advances in nitrogen and phosphorus removal at low do
TRANSCRIPT

Advances in Nitrogen and Phosphorus Removal at Low DO Conditions
Pusker RegmiVail Operator Training Seminar
13 October, 2016

• The water quality industry is currently facing dramatic changes
• It is shifting away from energy intensive wastewater treatment towards low-energy, sustainable technologies
• The future needs to focus on how one could extract energy captured from the wastewater rather than just treating it.
Wastewater Treatment and Energy
2

• The potential energy available in the wastewater exceeds the electricity requirements of the treatment process significantly.
• Energy required for secondary wastewater treatment1,200 to 2,400 MJ/1000 m3
• Energy available in wastewater for treatment, using previous data
5,850 MJ/1000 m3 (@ COD = 500 mg/L)
• Energy available in wastewater is 2 to 4 times the amount required for treatment
Energy Content of Wastewater
3

Energy Balance of WRRF
4
ET - thermal energy ES - syntheses energy EE - electricity
Wett et al. (2007)
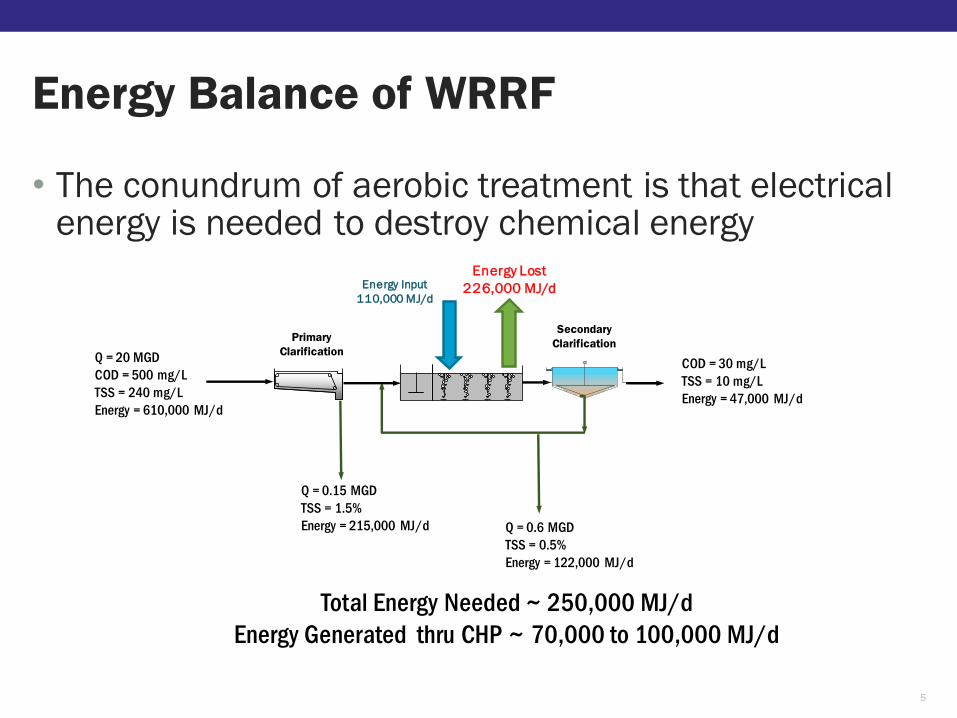
• The conundrum of aerobic treatment is that electrical energy is needed to destroy chemical energy
Energy Balance of WRRF
5
Primary
Clarification
Secondary
Clarification
Q = 20 MGD
COD = 500 mg/L
TSS = 240 mg/L
Energy = 610,000 MJ/d
Q = 0.15 MGD
TSS = 1.5%
Energy = 215,000 MJ/d Q = 0.6 MGD
TSS = 0.5%
Energy = 122,000 MJ/d
COD = 30 mg/L
TSS = 10 mg/L
Energy = 47,000 MJ/d
Energy Lost
226,000 MJ/dEnergy Input
110,000 MJ/d
Total Energy Needed ~ 250,000 MJ/d
Energy Generated thru CHP ~ 70,000 to 100,000 MJ/d

Energy Usage in WRRF
6
Energy Usage in WRRF Based on the WERF Report ENER1C12
Major Electricity Using Processes Units Typical Best Energy Practice
Influent and Effluent Pumping kWh/MG 420 296
Screening and Grit Removal kWh/MG 61 10
Odor Control kWh/MG 300 300
Nitrifying Activated Sludge kWh/MG 944 519
BNR Biological Reactor kWh/MG 1454 690
Final Clarifiers and RAS Pumping kWh/MG 106 77
Anaerobic Digestion kWh/MG 122 11
Tertiary Filtration kWh/MG 102 89
Other kWh/MG 273 87
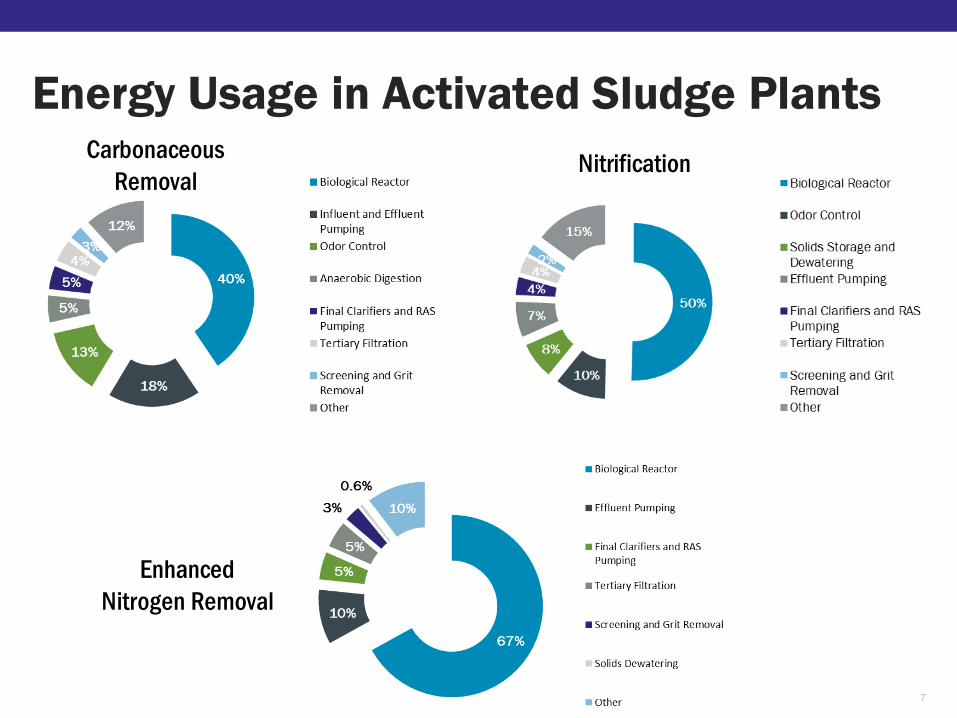
Energy Usage in Activated Sludge Plants
7
Carbonaceous
RemovalNitrification
Enhanced
Nitrogen Removal

Low Energy technology:
Simultaneous
nitrification
denitrification
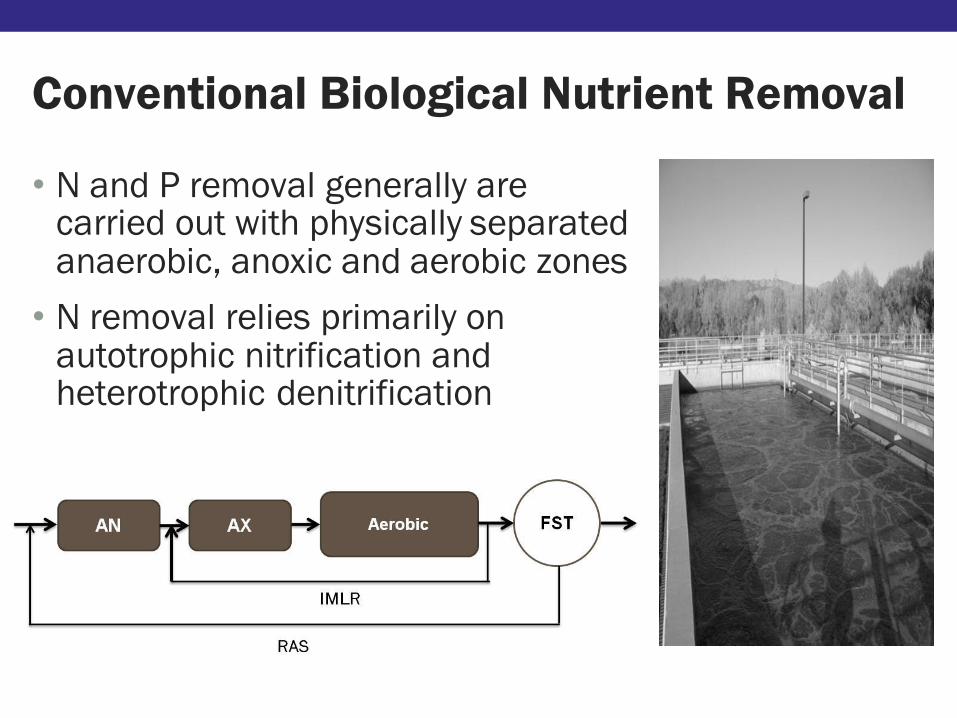
• N and P removal generally are carried out with physically separated anaerobic, anoxic and aerobic zones
• N removal relies primarily on autotrophic nitrification and heterotrophic denitrification
Conventional Biological Nutrient Removal

• Biological process where nitrification and denitrification occur concurrently in the same aerobic reactor (or in the same floc)
• SND relies on achieving a dynamic balance between nitrification and denitrification
• SND depends on:• Micro environment that affects oxygen
diffusivity inside the flocs [floc size]
• Macro environment that is related to mixing [bioreactor configuration]
• Bulk DO concentration
• Carbon availability
• Presence of novel microorganisms
Simultaneous Nitrification-Denitrification
10
NH3-N
DO
NO3-N
Carbon
Diffusion Layer
Aerobic Zone
Anoxic Zone

Simultaneous Nitrification-Denitrification
11
COD,

Potential Advantages
• Elimination of separate
tanks and internal recycle
systems for denitrification
• Simpler process design
• Reduction of carbon,
oxygen, energy and
alkalinity consumption
Simultaneous Nitrification-Denitrification
Potential Disadvantages
• Limited controlled aspects
of the process such as:
• floc sizes
• internal storage of COD
• DO profile within the flocs
• Sludge bulking; primarily
because of the excessive
growth of filamentous
bacteria
12

Factors affecting SND
for N removal

• To accomplish denitrification in any process, the availability of readily biodegradable organic carbon is essential
Effect of Influent Carbon on SND
14
0
2
4
6
8
10
12
14
16
0 2 4 6 8 10 12
Eff
luen
t N
O3-N
(m
g/L
)
Influent BOD:TKN Ratio (mg BOD5/mg TKN as N)
Jimenez et al. (2010) Jimenez et al. (2011)

• Control of bulk DO concentration in the system is essential for achieving a high degree of SND
Effect of DO on SND
15Jimenez et al. (2010)

DO constraints – nitrification kineticsNitrification fundamentals
16

Effect of DO on SND – Constant Aeration
17
Bulk DO Controlled to 0.5 mg/L

Effect of DO on SND – Cyclical Aeration
18

• Low DO required for SND is considered more susceptible to sludge bulking
• This has been considered one of the main disadvantages for SND processes
• Many facilities being operated in SND mode produce mixed liquor with marginal settling characteristics
• BNR facilities with AN or AX selectors often produce SVI values (90 percentile) of less than 120 and 150 mL/g (Parker et al., 2004)
Low DO Bulking in Plants Performing SND
19
Plant ProcessSVI
(mL/g)
Iron Bridge Bardenpho 115/165
Eastern Reg. Bardenpho 120/160
Snapfinger Single-Stage 200/300
Central Single-Stage 140/180
Winter Haven Bardenpho 130/190
Mandarin MLE 150/180
Marlay Taylor Single-Stage 170/280
Stuart Single-Stage 212/350
Smith Creek A2O 200/245

• Bulking in SND plants has driven some plants to convert to more conventional BNR processes
Low DO Bulking in Plants Performing SND
20
0
50
100
150
200
250
300
350
400
450
1/1/2004 1/1/2005 1/1/2006 1/1/2007 1/1/2008 1/1/2009
SV
I (m
L/g
)
Date
Construction
Period
A/O Process - Anaerobic Selector
and New Fine-bubble aeration
SND Process - Extended Aeration with
Mechanical Aerators
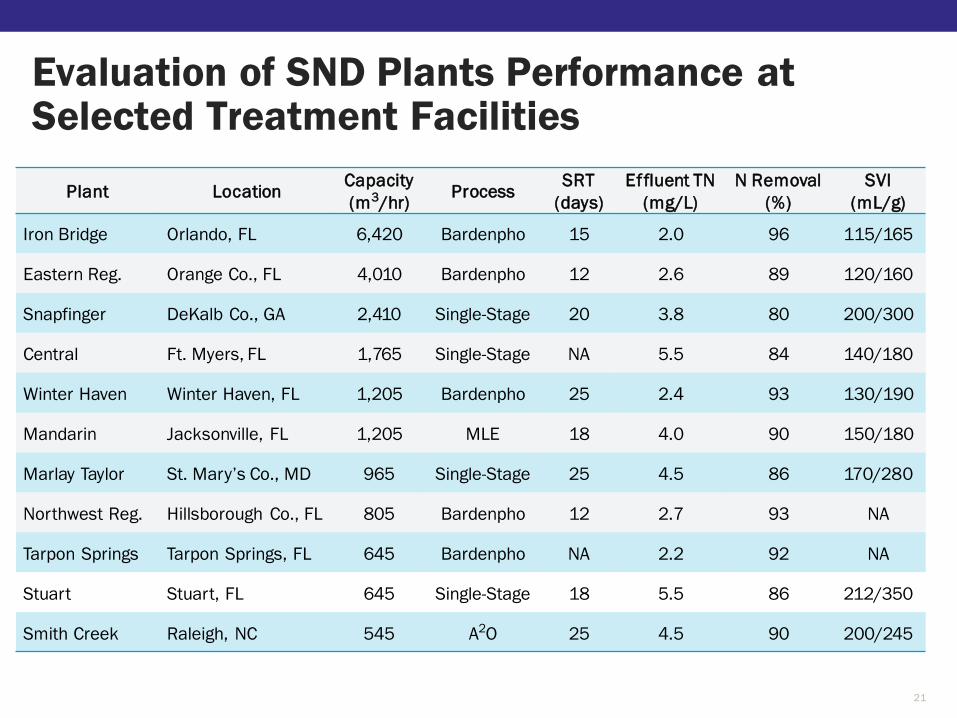
Evaluation of SND Plants Performance at Selected Treatment Facilities
21
Plant LocationCapacity
(m3/hr)Process
SRT
(days)
Effluent TN
(mg/L)
N Removal
(%)
SVI
(mL/g)
Iron Bridge Orlando, FL 6,420 Bardenpho 15 2.0 96 115/165
Eastern Reg. Orange Co., FL 4,010 Bardenpho 12 2.6 89 120/160
Snapfinger DeKalb Co., GA 2,410 Single-Stage 20 3.8 80 200/300
Central Ft. Myers, FL 1,765 Single-Stage NA 5.5 84 140/180
Winter Haven Winter Haven, FL 1,205 Bardenpho 25 2.4 93 130/190
Mandarin Jacksonville, FL 1,205 MLE 18 4.0 90 150/180
Marlay Taylor St. Mary’s Co., MD 965 Single-Stage 25 4.5 86 170/280
Northwest Reg. Hillsborough Co., FL 805 Bardenpho 12 2.7 93 NA
Tarpon Springs Tarpon Springs, FL 645 Bardenpho NA 2.2 92 NA
Stuart Stuart, FL 645 Single-Stage 18 5.5 86 212/350
Smith Creek Raleigh, NC 545 A2O 25 4.5 90 200/245

• Facilities with BNR configurations exhibited TN removal efficiencies of 89 to 96 percent
• Facilities using a single-reactor configurations (without explicitly defined anoxic zones) realized TN removal efficiencies in the order of 80 to 86 percent
Evaluation of SND Plants Performance at Selected Treatment Facilities
22

Iron Bridge WWTP, City of Orlando FL
23
Anaerobic Anoxic Oxidation Ditch operated in SND
Influent and
RAS
Post
Anoxic
Post
Aerobic
Mixed Liquor Recycle
To FST
0 0 0.3 0
1
15.5
7.1
0.2 0.5 0.140 00.95
0.35 0.4
0
2
4
6
8
10
12
14
16
18
Anaerobic Anoxic Oxidation
Ditch
Post-Anoxic Post-Aerobic
Con
cen
tra
tion
(m
g/L
)
DO NH3-N NO3-N

Iron Bridge WWTP, City of Orlando FLN Removal
WERF, 2011 24
0.10
1.00
10.00
Nov-04 May-05 Dec-05 Jul-06 Jan-07 Aug-07 Feb-08
N S
pe
cie
s (m
g N
/L)
TKN
NOx-N
TN

• The application of SND processes may be based and limited by:• Influent C:N ratio
• Optimum bulk DO from 0.3 mg/L to 0.7 mg/L
• Sludge bulking issues due to the excessive growth of filamentous bacteria
• The operator has limited control over important parameters impacting SND
Conclusions
25

Intr
od
uct
ion
Acetate and
propionate
Wate
r phase
NO2-, or NO3
-
Enhanced Biological Phosphorus Removal (EBPR)

• EBPR is favorable with an COD:P ratio > 15
• PAOs tend to dominate at COD:P ratios of 10-20 whereas GAOs tend to dominate at COD:P ratios >50 mg-COD/mg-P.
• COD must have a sufficient VFAs, or COD that ferments into VFAs (5 mgVFA/L per 1 mg/L of P to be removed)
• Seasonal variations in COD ratios and VFA content must be closely investigated preceding EBPR design.
Effect of Carbon Source on EBPR Performance

Traditional Flow Diagrams for N and P Removal
Barnard (2011)

Estimate of VFA and rbCOD Requirements for EBPR

Effect of MCRT & Temperature on EBPR
0
2
4
6
8
10
12
10 12 14 16 18 20 22 24 26 28 30
Temperature, º C
SR
T, d
ay
s
Nitrification in Conventional AS
Note: Incipient Washout Conditions with No Design “Safety Factor” on SRT
BPR only,No Nitrification
No BPR, No Nitrification

MCES Metro WWTP, St. Paul MN
0.0
0.5
1.0
1.5
2.0
2.5
3.0
Eff
lue
nt
TP
, m
g/L
Daily
Daily 30-DMA Annual Moving

• EBPR becomes less stable when applied in conjunction with N removal processes due:
• competition with GAOs
• introduction of nitrate/nitrite to anaerobic zone
• competition for carbon
• N removal via denitrification becomes carbon limited due to EBPR
• Supplemental carbon is added for denitrification and/or EBPR
Issues with Simultaneous EBPR and N Removal

Integration of EBPR and N Removal
Anaerobic-Oxic Process
Anaerobic-Anoxic-Oxic Process

• Competition for carbon between heterotrophs and polyphosphate accumulating organisms (PAOs)
• Introduction of nitrate/nitrite to anaerobic zone, thereby disrupting anaerobic carbon uptake
• Competition with glycogen accumulating organisms (GAOs)
Challenges Combined Nitrogen Removal and Phosphorus removal
Brown and Caldwell 34
Carbon limited conditions makes
it even more difficult!!

Is low carbon combined shortcut nitrogen removal and BioP possible?
35

Brown and Caldwell 36

City of St. Petersburg Southwest WRF
37
No Primaries
Anaerobic digestion

• A/O Process
• Rated Capacity = 20 MGD
• Total SRT = 5 days
• Aerobic SRT = 3.5 days
• HRT = 6 hrs
• COD:TKN = 6.0 – 8.0
• Minimum Temp. = 22 degree C
• Maximum Temp. = 30 degree C
• Effluent nutrient limits (Florida Water Reuse requirements)• Total N = 10 mg/L
• Total P = 1.0 mg/L
City of St. Petersburg Southwest WRF
38

City of St. Petersburg Southwest WRF
39
GBT
BFP
Screening Grit Removal
Biological ReactorsSecondary
ClarificationTertiary
Filtration
Anaerobic DigestionSidestream Return

DO and SRT Control Strategy
40

DO and SRT Control Strategy
41
Control Parameter Condition Action
NH4+ Control
NH4+ lower than 1.0 mg N/L
Reduce SRT to limit NH4+ removal and
keep the average DO to a minimum value
of 0.1 mg/L.
NH4+ higher than 3.0 mg N/L
Increase SRT to improve NH4+ removal
and keep DO to a minimum value of 0.1
mg/L. If SRT approaches 5 days,
increase the DO to a maximum value of
0.3 mg/L until NH4+ is reduced
NO3- Control
NO3- higher than 1.0 mg N/L
Decrease the DO to a minimum value of
0.1 mg/L and monitor NO2- accumulation
(profile) in the aeration basin
NO3- lower than 1.0 mgN/L No action required
NO2- Control Monitor effluent NO2
- as surrogate measurement of shunt performance

Summary of Influent Characteristics
42
Parameters (mg/L) Value (Standard Deviation)
COD 300 (±65)
Soluble COD 120 (±20)
Readily Biodegradable COD 65 (±15)
Unbiodegradable COD 20 (±8.5)
VFAs 13 (±5)
TSS 140 (±35)
TKN 42 (±5.6)
NH3-N 30 (±4.5)
TP 3.9 (±0.75)
PO4-P 2.4 (±0.30)
Alkalinity (mg/L CaCO3) 210 (±20)
pH (SU) 7.1 (±0.22)

Inorganic Nitrogen Profile
0.8
Unaerated
DO = 0.02 ±
0.01 mg/L
Aerobic 1
DO = 0.22 ±
0.15 mg/L
Aerobic 2
DO = 0.12 ±
0.08 mg/L
Aerobic 3
DO = 0.08 ±
0.05 mg/L

Final Effluent Inorganic Nitrogen

Reason for excellent N removal?
45
1 mole Ammonia
(NH3 / NH4 +)
½ mol Nitrogen Gas
(N2 )
1 mole Nitrite
(NO2-)
1 mole Nitrite
(NO2-)
1 mole Nitrate
(NO3-)
Autotrophic Bacteria
Aerobic Environment
Heterotrophic Bacteria
Anoxic Environment
75% O2 (energy)
~100% Alkalinity
25% O2 (energy)
40% Carbon (COD)
60% Carbon (COD)
Ammonia Oxidizing Bacteria (AOB)
Nitrite Oxidizing .Bacteria (NOB)
Advantages:
• 25% reduction in oxygen demand (energy)
• 40% reduction in carbon (e- donor) demand
• 40% reduction in biomass production
NitritationDenitritation
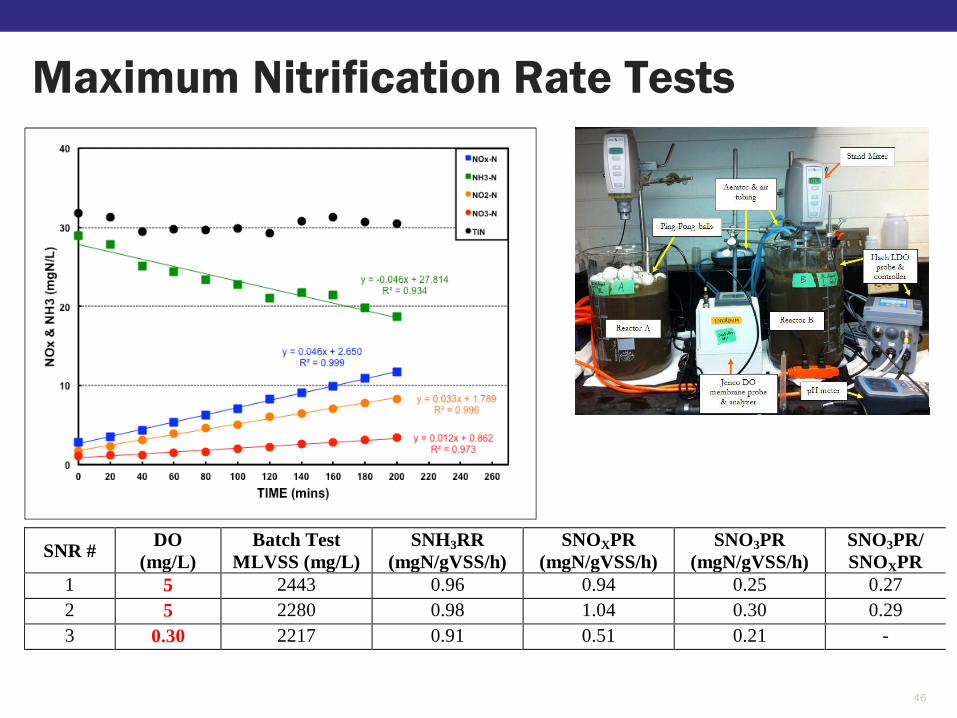
Maximum Nitrification Rate Tests
46
SNR # DO
(mg/L)
Batch Test
MLVSS (mg/L)
SNH3RR
(mgN/gVSS/h)
SNOXPR
(mgN/gVSS/h)
SNO3PR
(mgN/gVSS/h)
SNO3PR/
SNOXPR
1 5 2443 0.96 0.94 0.25 0.27
2 5 2280 0.98 1.04 0.30 0.29
3 0.30 2217 0.91 0.51 0.21 -
4 0.10 2300 0 0 0 -

• Residual effluent ammonia >1 mg/L (Maximize AOB activity)
• Heterotrophs out-competing NOB for NO2-N at low DO conditions
• Maintaining aggressive SRT based on AOB activity
Mechanism of NOB out-selection
Brown and Caldwell 47

What about Bio-P?
48

Soluble PO4-P Profile
49
Unaerated
DO = 0.02 ±
0.01 mg/L
Aerobic 1
DO = 0.22 ±
0.15 mg/L
Aerobic 2
DO = 0.12 ±
0.08 mg/L
Aerobic 3
DO = 0.08 ±
0.05 mg/L

Stable High Temperature Bio-P

P Removal with NO2 Under Low DO/ Anoxic Conditions
Denitrifying PAOs???

What about settling??

• N removal is via nitrite-shunt - The low DO and short SRT operation resulted in significant NOB out-selection
• Effective SND was achieved in a simple AO process
• High temperature and low DO operation didn't adversely affect biological phosphate uptake (Large anaerobic volume and low NOx-N recycle could be helpful)
• Excellent settling at low DO operation
• Simple manual control strategy for DO and SRT was effective
• Low DO ammonia oxidation was key to this process
Final Thoughts
53

• Molecular work – Who is doing what?
• Modeling – Simultaneous N and P removal at low DO
• And the ultimate goal would be to replicate this process elsewhere with better process understanding
• WERF Project: Understanding the Impacts of Low-Energy and Low-Carbon Nitrogen Removal Technologies on Bio-P and Nutrient Recovery Processes (Started this week)
Future Work
Brown and Caldwell 54
Granules/flocs system
Carbon efficient WRRFCarbon efficient WRRF
Advanced aeration control
for SND
Low DO shortcut nitrogen
removal
GoalGoal BenefitsBenefits
Improved bio-P with
DPAOs
Process intensification
Increased C and P recovery
potential
Reduced energy and
chemical input
