advances in large-scale assessment: a parcc update national conference on student assessment new...
TRANSCRIPT

Advances in Large-Scale Assessment:A PARCC Update
National Conference on Student AssessmentNew OrleansJune 26, 2014
1

2
Introductions
Presenters:Luis Saldivia, Senior Mathematics Advisor, ETSMichelle Richard, Technology Solutions Manager, PearsonLora Monfils, Senior Psychometrician, ETSLaurie Davis, Director, Solutions Implementation, Pearson
Discussant: Mike Russell, Senior Associate, Center for Assessment
Moderator:Kit Viator, Senior Executive, ETS

3
Advances in Large-Scale Assessment: A PARCC Update
Innovations in the Measurement of Mathematics Content
Luis Saldivia Educational Testing Service

• Innovations explicitly sought by PARCC
• Additional innovations required to properly measure mathematics performance as required by CCSS and PARCC’s Evidence-Centered Design specifications
PARCC Related Innovations
4

1. Quality assessment of individual content standards with machine scoring of responses entered by computer interface
2. Practice-forward tasks3. Tasks assessing conceptual understanding
with machine scoring of responses entered by computer interface
4. Integrative tasks with machine scoring of responses entered by computer interface
PARCC Math Innovations
5

5. Fluency assessment with machine scoring of responses entered by computer interface
6. Expressing mathematical reasoning 7. Modeling / application8. Technology-enhanced tasks
PARCC Math Innovations
6

URL: http://practice.parcc.testnav.com/# • Sample Set HS Math: # 9• Sample Set Grades 6-8 Math: # 4• Grade 3 Math EOY: # 17• Geometry EOY/Calculator Section: # 18• Algebra I EOY/Non-Calc Section: # 6
PARCC: Sample Mathematics Items
7

• We will need to be responsive to PARCC states’ needs as they develop over time
• Two major purposes associated with use of technological innovation:– Improve the precision of measurement of
the intended constructs– Improve tools available to students during
the assessment process to support student engagement
Summary
8

9
Advances in Large-Scale Assessment: A PARCC Update
Innovations in Item Functionality and Scoring
Michelle Richard Pearson

10
Innovations in Functionality
• Use a class inside standard QTI interaction to give it a different context
• Expresses functionality specific to current system, but would default to basic interaction in other systems– matchInteraction / Table Grid
• class=“table-grid” changes interaction from Drag and Drop functionality to a matrix with checkboxes or radio buttons
• Scores exactly the same with or without class
– textEntryInteraction / Equation Editor• class=“tei-ee” changes a text response box to a box embedded with
palettes that can be used to create mathML-based responses• Scoring via rubric in both representations

11
Match Interaction with class “table-grid” added
Match Interaction with no class attribute

12
textEntry Interaction with class “tei-ee” added
textEntry Interaction with no class attribute

13
New Item Types
• Fraction Model – Allows for equivalent fractions to be modeled
• Function Graph– Appearance of graph is driven by button selections– Evaluated against an equation and other parameters using record
cardinality• Interactive Numberline
– Evaluates solution plotted on a numberline• Select in Passage / Text Highlighting
– Allows for text to be selected directly from passage as answer to question without need for alternate source file

14
Multiple Delivery Formats
• Standard Computer/Laptop– Uses mouse controls– Differing monitor sizes
• Tablet/iPad– Uses touchscreen controls– Limited screen size (7” to 10.1”)
• Cross-Browser / OS compatibility– Functionality of interactions can differ across browsers / OS
• Accessibility– Delivery of items that are both accessible and innovative is a
fine line to walk
15
Innovations in Scoring
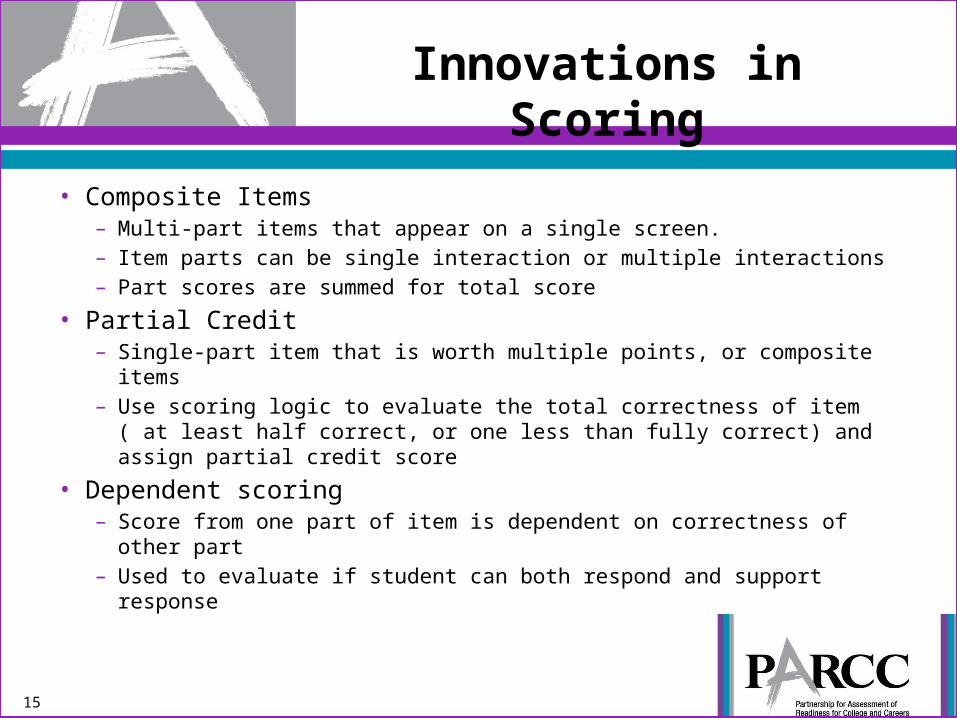
• Composite Items– Multi-part items that appear on a single screen. – Item parts can be single interaction or multiple interactions– Part scores are summed for total score
• Partial Credit– Single-part item that is worth multiple points, or composite items– Use scoring logic to evaluate the total correctness of item ( at least half
correct, or one less than fully correct) and assign partial credit score
• Dependent scoring– Score from one part of item is dependent on correctness of other part– Used to evaluate if student can both respond and support response

16
Innovations in Scoring
• Custom Operators– QTI/APIP allows for customized scoring logic to built within the scoring
engine and called in the XML– Allows for more complex scoring models to be authored
• A few PARCC customOperators– stringToNumber = Converts a string that contains commas to a float value
(ex: 14,342 to 14342)– SubstringBefore and SubstringAfter = takes characters before or after
specific character(s) and splits for evaluation (ex: ‘3/5’ to ‘3’ and ‘5’)– CountPointsThatSatisfyEquation = takes text-based equation provided by
author and evaluates student-entered points against it. Output is count of points that were correct, which can be used to provide full or partial credit (ex: 0 3, and -2 -5 against the equation y=4*x+3)
– IsCorrectByQuantity = Counts cloned sources in a target for correctness

Advances in Large-Scale Assessment: A PARCC Update
Field Test Design and Analysis
Lora Monfils Educational Testing Service
17

• Background on Field Test– Purpose/goals– Constraints
• Field Test Design• Sampling• Psychometric Analysis– Item Analysis– Scoring and Scaling Studies– Comparability Studies
Overview
18
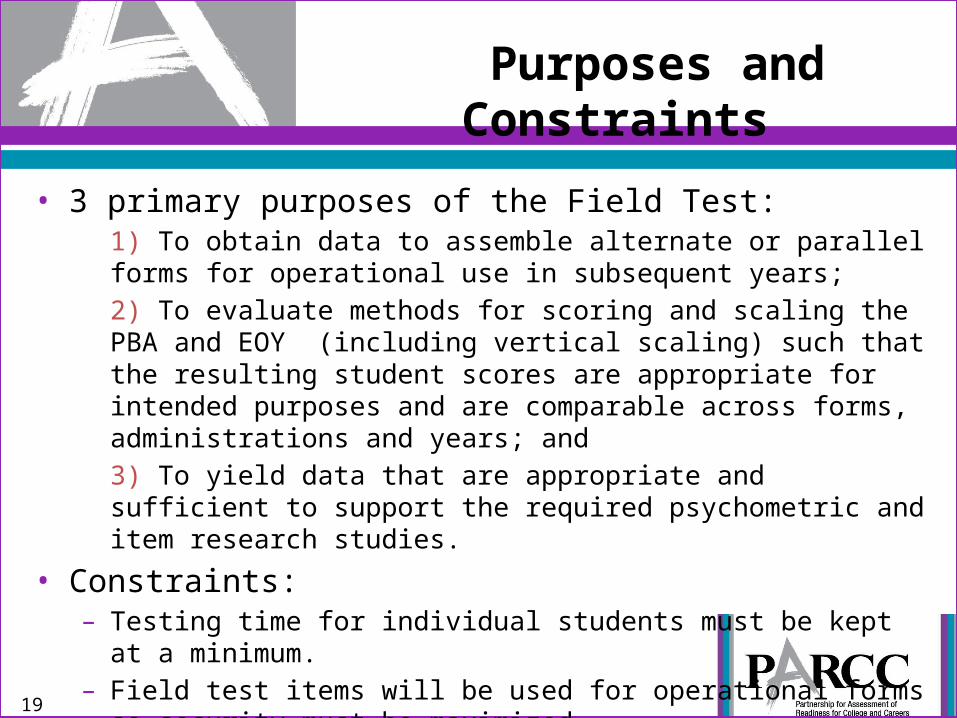
• 3 primary purposes of the Field Test:1) To obtain data to assemble alternate or parallel forms for operational use in subsequent years;2) To evaluate methods for scoring and scaling the PBA and EOY (including vertical scaling) such that the resulting student scores are appropriate for intended purposes and are comparable across forms, administrations and years; and 3) To yield data that are appropriate and sufficient to support the required psychometric and item research studies.
• Constraints: – Testing time for individual students must be kept at a minimum. – Field test items will be used for operational forms so security must be
maximized.
Purposes and Constraints
19

• To the extent possible, the Field Test was designed to reflect future operational administrations– 2 separate administrations – PBA in March, EOY in April/May– Dual mode administration – PBA and EOY field test forms constructed to full operational test
blueprints and requirements • Data collection design
– 2 conditions: 1) Full summative (PBA+EOY), 2) PBA or EOY but not both
– Linking through common items across forms and conditions, and randomly equivalent groups
Field Test Design
20

• Timing of PBA FT and EOY FT relative to State operational testing
• Individual State participation requirements
• Test burden for participating districts/schools and students
• Number of FT forms – construction, administration
• Data collection for special studies
• Initial FT design modified to address considerations– Trade-offs between ideal and practical, advantages and disadvantages
Additional Design Considerations
21

• Description– Students participate in both the PBA and EOY FT administrations. Each Condition 1
form has 2 parts (1 PBA + 1 EOY); each student takes pt 1 & pt 2 of assigned form. Assignment to forms is through spiraling at the student level .
• Purpose– This condition most closely replicates the operational summative assessment.
Data for scoring and scaling studies, and other research studies. Data will also contribute to item statistics for operational form construction.
• Notes on Linking Items– Forms include common items, on-grade items for within-grade linking and
adjacent-grade items for vertical scaling • EOY and math PBA forms include external matrix sections with off-grade items• ELA PBA forms share internal items cross grades
– HS math EOCs, common items link Traditional and Integrated– Designated CBT-PBT pairs to link across modes
FT Design: Condition 1
22

• Description– 2A : Students participate in PBA administration only. PBA FT forms are spiraled
at the student level.– 2B: Students participate in EOY administration only. EOY FT forms are spiraled
at the student level.
• Purpose– By administering test components separately, statistical data can be generated
while limiting testing time for individual students. Data will be used to obtain item statistics for operational form construction.
• Notes on Linking Items– EOY and PBA forms include common on-grade items linking within and across
conditions • PBT forms also include adjacent-grade items for vertical scaling • Int Math forms also include adjacent-grade and Trad Math items
FT Design: Condition 2
23

Field Test DesignN Forms per Grade or Traditional Math EOC
24
1 The Full Summative (FS) test consists of two parts – Part 1 is the PBA portion and Part 2 is the EOY portion.2 Except Grade 3, where there will be five forms..
Condition Form TypeField Test Administration
Number of Forms per Grade or EOC
ELA/Literacy Mathematics
March April CBT PBT
CBT PBT
1 FS1 PBA portion EOY portion 62 FS 1 FS 6 FS 1 FS
2A PBA/MYA PBA n/a 18 (16) 62 12 (10) 6 (5)
2B EOY n/a EOY 9 5 9 6
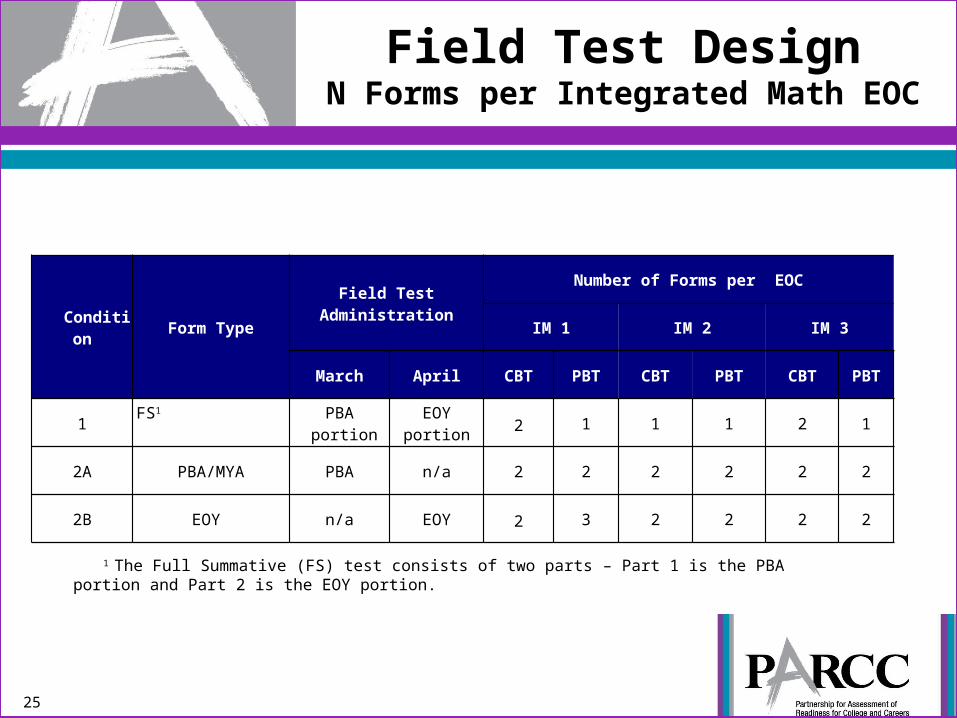
Field Test DesignN Forms per Integrated Math EOC
25
1 The Full Summative (FS) test consists of two parts – Part 1 is the PBA portion and Part 2 is the EOY portion.
Condition Form TypeField Test Administration
Number of Forms per EOC
IM 1 IM 2 IM 3
March April CBT PBT CBT PBT CBT PBT
1 FS1 PBA portion EOY portion 2 1 1 1 2 1
2A PBA/MYA PBA n/a 2 2 2 2 2 2
2B EOY n/a EOY 2 3 2 2 2 2

• To support IRT scaling, target minimum sample size of 1,200 valid cases per item (test form)– To achieve target, oversampled by approximately 50% for Cond 1 and 20%
for Cond 2 to allow for attrition, non-response, etc – Separate samples drawn for each content/grade and test mode– Students to test in one subject only – either Math or ELA/Literacy– Where targets not met, some adjustments in number of forms
• Note: Linking items/tasks appeared in more than one form, therefore targeted 1,200 valid cases per form to support well-estimated item parameters from each form for common item linking.
Sample Size
26

• Targets established for each state – Based on proportional representation with 2% minimum – Grade level enrollments from 2012 NCES data– Reflected state special participation requests – impact distributed
proportionally• For each content/grade, schools placed into 5 strata based on %
Proficient reported in NCES data for the content/grade (% Proficient Math or % Proficient ELA) – New schools (e.g., those that opened subsequent to the 2012 NCES data)
formed a sixth stratum– Test-level targets were distributed across strata – proportional to number of
schools in each stratum– Within strata, schools were sampled to meet designated sample size
requirements
Sampling Overview
27

• Schools were randomly selected within strata to meet test target sample size.– Each sampled school contributed two classes (estimated as 20 per class, thus
40 students) if grade-level enrollment permitted– In the case of states that required that all classes participate, the sampled
school contributed the number of students in that grade.• Sampling of schools continued until targets were met for strata and
test overall– Assuming sufficient number of schools to sample from, because selection
within schools entailed groups of students (2 classes or entire grade), rather than individuals, meeting targets resulted in some overage
– If insufficient number of schools, sampling resulted in not meeting targets• Samples evaluated at State and PARCC level
– ELA Prof, Math Prof, Econ Dis, SWD, LEP, Gender, Ethnicity
Sampling Overview, cont
28

• Adjustments to standard procedures implemented in certain cases– To reduce over-sampling when selecting entire grades, an algorithm was
implemented to minimize the size of the last school randomly selected to meet target
– When there were limitations on number of schools available to sample from for a given test due to special requests, and/or low volume curriculum as in the case of Integrated Mathematics, targets used were adjusted to allow sampling of students for all conditions and modes, albeit in smaller numbers
• Sampled schools were sent to States for approval• Replacements identified for schools not approved and schools that
declined to participate– Iterative process, with 3 rounds of recruitment
• Major collaborative effort
Sampling Overview, cont
29

• Research questions to inform operational assessments– Innovative items
• Evaluate item/task performance• Implications for future operational forms
– Scoring• Combining PBA and EOY to yield summative score• Subscore reporting
– Scaling • IRT model selection • Feasibility of vertical scale
– Special studies• Mode/device comparability• HS Math EOC comparability
Field Test Analyses Overview
30

• Evaluation of Field Test Item/Task Performance– Classical Item Analyses
• Classical item difficulty indices (or p-value; SR and CR items)• The percentage of students choosing each response option (SR items)• Item-total correlation (SR and CR items) • Distractor-total correlation (SR items)• Score point distribution (CR items).
– Differential Item Functioning• Groups determined based on policy considerations
– Gender, ethnicity, special populations (SWD, ELL, EconDis)• Mantel-Haenzel procedures, Logistic Regression
– Reliability • PBA, EOY, FS (PBA+EOY)• Total sample, plus subgroups of interest
Field Test Analyses- Classical Item and Test Analyses
31

• Prior to IRT scaling, dimensionality studies will be conducted within each summative test component (PBA and EOY) and grade, across the PBA and EOY within each grade, and across grades.
• Dimensionality analyses are necessary for determining a) evidence of essential unidimensionality for IRT scaling, b) the score aggregation method for PBA and EOY tests, and c) the feasibility and structure of a vertical scale.
• Both exploratory and confirmatory analyses
Field Test Analyses- Dimensionality Analyses
32

• Analyses to inform IRT model selection considerations– Underlying assumptions for different IRT models.
• Dimensionality• Equal discrimination in Rasch/PC• Minimal guessing in Rasch and 2PL• Local independence/Minimal testlet effect
– Model simplicity or parsimony– Model fit
• Goodness-of-fit tests• Plots of empirical data vs model-based ICCs
– Implications for vertical scales
Field Test Analyses-IRT Model Selection Considerations
33

• Issues related to VS for Mathematics EOCs– Ideally, if sufficiently large representative samples, use Integrated Math 1, 2, 3
• For Traditional Math, progression Gr 8 -> Alg1 -> Alg2; Gr 8 -> Geom• Common ES statements/items Integrated & Traditional EOCs (EOC comp study)• Integrated Math samples smaller than planned, will provide preliminary results
• Implications of rates of CCSS implementation in Spring 2014– Variation in grade to grade performance within and across states
• Due to state transition timelines• Due to district/school implementation and other factors
– Impact on relative difficulty, discrimination of items• From grade to grade in vertical linking sets• Within grade on “operational core” items
– Suggests results may differ substantially in 2015 and beyond until CCSS are fully implemented• Consider periodic evaluation of scale stability
Field Test Analyses – Explore Viability of Vertical Scale
34

• Analyses to inform operational summative scores– For Math, analyses to investigate combining the PBA and EOY into a single
summative Math scale score– For ELA, analyses to investigate production of separate scale scores for
Writing and Reading, and a single summative ELA/L scale score– Considerations for choice of score scale
• Investigation of estimation procedures to support subscore reporting
• Comparability across mode/device
• Comparability across HS Math EOCs for Trad, Int courses
Field Test Analyses – To Inform Operational Scores
35
• Questions?
• Thank you!
Questions?
36

37
Advances in Large-Scale Assessment:A PARCC Update
PARCC Mode and DeviceComparability Research
Laurie DavisPearson

38
• PARCC’s ultimate goal is digital delivery of the ELA/Literacy and Mathematics assessments using the widest variety of devices that will support interchangeable scores.
• Initially to include:– Desktop computers – Laptops computers – Tablets (9.7” or larger)
• Strict comparability (score interchangeability) across computer-based tests and paper-based tests is not a PARCC goal
• However…paper will be provided as an option for schools where technology infrastructure is not ready for digital delivery
Why Conduct Comparability Research?

39
• Mode Comparability– TEIs on computer only– Score interchangeabilitynot expected
• Device Comparability– TEIs on all devices– Score interchangeabilityexpected
Mode vs. Device Comparability

Mode: Computer vs. Paper and Pencil
• Initial comparability studies planned as part of PARCC field test analyses
• All grades and subjects• Schools assigned to either paper or computer mode• Goal: Evaluate the degree to which comparability can
be obtained through scaling items onto a single metric, linking or concordance
40

• Classical item analysis– Differences, rank order p-values
• DIF– CBT reference, PBT focal
• Factor structure, dimensionality• Reliability• IRT analysis – informed by dimensionality analysis
– Separate calibrations– Link PBT to CBT with S-L procedure
• Score adjustment• Evaluate resulting score distributions
Mode Comparability: Item and Test Level Analyses
41

42
• 2-part research effort• Part I: Cognitive lab (qualitative)—summer 2013• 72 students in grades 4, 8, and 11 from CO and AR
• Part II: Comparability study (quantitative)—2014 using field test data
• Goal: Determine the statistical and practical significance of any device effects
Device: Computer vs. Tablet
43
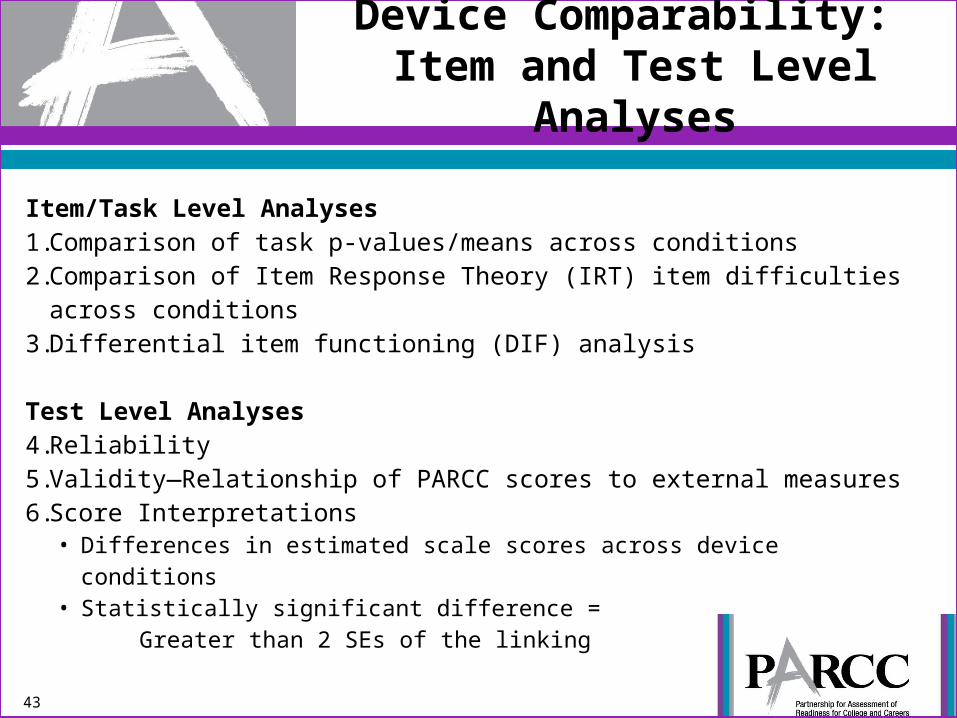
Item/Task Level Analyses1. Comparison of task p-values/means across conditions2. Comparison of Item Response Theory (IRT) item difficulties across
conditions3. Differential item functioning (DIF) analysis
Test Level Analyses4. Reliability5. Validity—Relationship of PARCC scores to external measures6. Score Interpretations
• Differences in estimated scale scores across device conditions• Statistically significant difference = Greater than 2 SEs of the linking
Device Comparability: Item and Test Level Analyses

44
• 2014 Device comparability study will include:• Grade 4 ELA/Literacy • Grade 4 Mathematics • Grade 8 ELA/Literacy • Grade 8 Mathematics• Grade 10 ELA/Literacy• Geometry
Device ComparabilityGrades and Subjects Studied
45
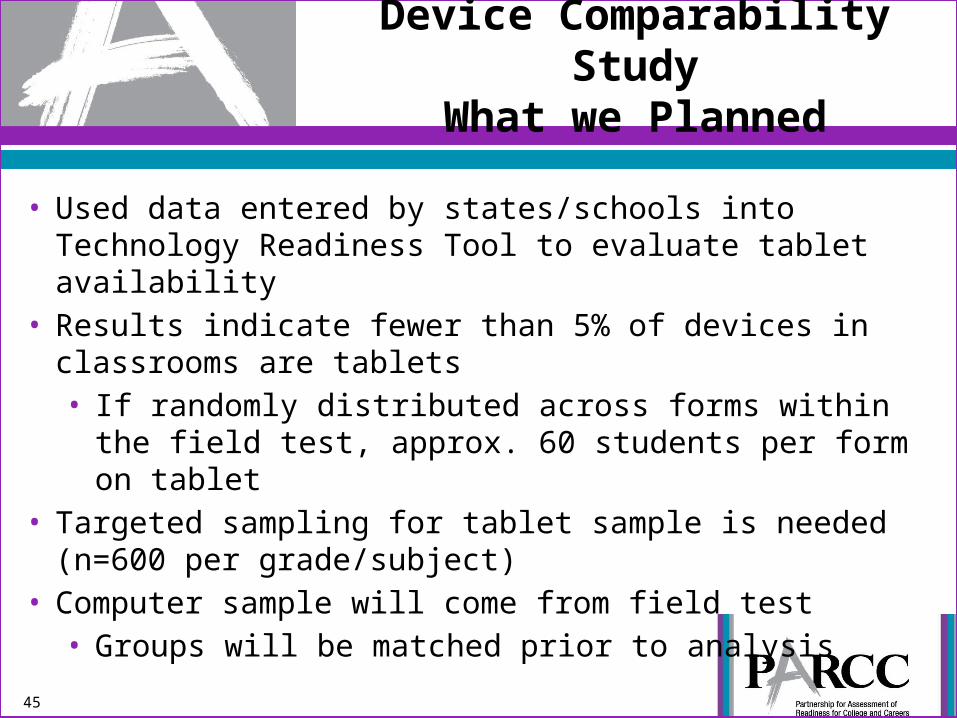
• Used data entered by states/schools into Technology Readiness Tool to evaluate tablet availability
• Results indicate fewer than 5% of devices in classrooms are tablets• If randomly distributed across forms within the field
test, approx. 60 students per form on tablet• Targeted sampling for tablet sample is needed (n=600
per grade/subject)• Computer sample will come from field test• Groups will be matched prior to analysis
Device Comparability StudyWhat we Planned

46
• Grade 8 and high school studies use random assignment (computer and tablet) of students from Burlington, MA• Approximately 250 students per grade/subject• ~125 students per study condition
• Grade 4 study uses matched sample from LA, AR, & MA. • Students assigned to tablet condition matched to
students who tested on computer in the field test• Approximately 300-400 students per subject
Device Comparability StudyWhat we Got

47
A Sampling of Student Survey Results
PARCC PBA Field Test AdministrationBurlington, MA
Grade 8 Students

48
Map

49
50

51
52
Advances in Large-Scale Assessment: A PARCC Update
Discussion: Five Thoughts
Mike RussellCenter for Assessment

53
1. Perspective
1961 Freedom 7
Alan ShepardScience Fiction
Space Colonization

54
1. Perspective
Gaming
Testing

55
2. Innovation & Measurement Value
SS Savannah, 1819
First Trans-Atlantic Steamship Crossing

56
3. Informed by Research

57
4. Interoperability

5. Competing Tensions
58
Innovation
Interoperability
CCSS/Content
Time