advances in food science and nutrition (p. m/advances) || new trends in sensory characterization of...
TRANSCRIPT

321
Visakh. P. M, Laura B. Iturriaga and Pablo Daniel Ribotta (eds.) Advances in Food Science and Nutrition, (321–360) 2014 © Scrivener Publishing LLC
10
New Trends in Sensory Characterization of Food Products
Gastón Ares* and Ana Giménez
Department of Food Science and Technology, Faculty of Chemistry, Universidad de la República, Montevideo, Uruguay
Abstract Sensory characterization provides a complete description of the sensory characteristics of food products. Descriptive Analysis is the most common methodology for this purpose. However, due to the cost and time associ-ated with its application, several alternative methods have been recently developed. These methods do not require training, can be performed by trained assessors or consumers, and have been reported to be a good option when quick information about the sensory characteristics of a set of prod-ucts is needed. There are basically four types of methodologies: method-ologies based on the evaluation of specifi c attributes, on global differences among products, on the comparison with references, and methodologies that provide a verbal description of the products. In the present chapter these novel methodologies for sensory characterization of food products are described. Advantages and disadvantages of each methodology are discussed and recommendations for their application are provided.
Keywords: Descriptive Analysis, consumer profi ling, projective map-ping, CATA, sorting, polarized sensory profi ling
10.1 Introduction
10.1.1 Sensory Characterization
Sensory characterization is one of the most powerful, sophisti-cated and extensively applied tools in sensory science, which aims
*Corresponding author: [email protected]

322 Advances in Food Science and Nutrition
at providing a complete description of the sensory characteristics of food products [1]. Sensory characterization is extremely useful for the food industry when detailed information about the sensory characteristics of food products is needed. In particular, this meth-odology is usually applied for the development and marketing of new products, the reformulation of existing products, the optimiza-tion of manufacturing processes, monitoring the sensory character-istics of the products available in the market, the implementation of sensory quality assurance programs, establishing relationships between sensory and instrumental methods, and for sensory shelf life estimation [2].
One of the most common applications of sensory characteriza-tion is during new product development and product reformu-lation. At these stages it is usual that product formulation and processing conditions are systematically varied following an experimental design in order to generate a series of prototype products [3]. In this context, sensory characterization enables the product developer to evaluate how formulation and processing variables affect the sensory characteristics of the prototypes, to determine how close the prototypes are from the target product to be developed and to take decisions based on objective sensory information.
Furthermore, during the implementation of sensory quality assurance programs sensory characterization plays a key role in defi ning specifi cations or quality standards for the sensory charac-teristics of food products, as well as for establishing specifi cations for physicochemical properties that are related to specifi c sensory characteristics [4].
10.1.2 Descriptive Analysis
Several classical methodologies have been used for sensory char-acterization of a wide range of food products, which are known as Descriptive Analysis techniques. These include the Flavour Profi le® [5, 6], Texture Profi le® [7, 8], Quantitative Descriptive Analysis®
(QDA) [9, 10], and Sensory Spectrum® methodologies [11, 12]. The most commonly used methodology, usually known as
Descriptive Analysis, is an adaptation and combination of the basic features of traditional QDA and Sensory Spectrum [1]. Descriptive Analysis should be performed with a panel of 8-20 trained assessors,

New Trends in Sensory Characterization 323
and involves three basic steps: (i) descriptor generation, (ii) assessor training, (iii) evaluation of samples.
The fi rst step of Descriptive Analysis involves the selection of the main attributes that characterize the product’s sensory prop-erties, by generating a complete list of descriptors. This step is performed by asking the assessors to select the descriptors that describe the sensory characteristics of a wide range of products within the specifi c product category; this can be done by consen-sus or by providing a list of all the possible words that describe the category [1]. Once the descriptors are selected, the evalua-tion technique should be clearly defi ned and references should be selected to help the assessors to identify and quantify each sensory attribute [13].
After descriptor generation the assessors should be trained in attribute recognition and quantifi cation since quantitative infor-mation is a key point in Descriptive Analysis [10]. Usually, attri-bute intensity is quantifi ed using a 10 cm or 15 cm line with words such as slight and intense at the extremes. During successive ses-sions the assessors are presented with different samples and are asked to quantify the intensity of each of the selected attributes. The length of the training process usually ranges from 10 h to 120 h, depending on the complexity of the specifi c product and the number and characteristics of the sensory attributes needed to characterize the product [2, 14]. In order to defi ne the end of training, i.e., when the panel is capable of providing reliable infor-mation about the sensory characteristics of food products, the per-formance of each assessor, as well as the performance of the entire trained panel, should be checked [15]. Panel performance is evalu-ated considering repeatability, reproducibility and discrimination [16]. After training, all the assessors should be able to score the same product consistently for a given attribute to fi nd differences between products and to evaluate them, on average, as the rest of the trained panel [17]. Checking panel performance is usually carried out using analysis of variance and multivariate statistical techniques [18–21].
An advantage of Descriptive Analysis is that data is easily sta-tistically analyzed and graphically represented. Data analysis is performed averaging intensity data across panelists and repli-cates, once panel performance has been checked [21]. Thus, aver-age intensity of all the evaluated sensory attributes provides a
324 Advances in Food Science and Nutrition
sensory characterization of the products and enables the iden-tifi cation of relative differences among samples using statisti-cal techniques such as analysis of variance [1]. It is important to highlight that average intensity of the evaluated samples are not absolute since they are related to the references used during panel training.
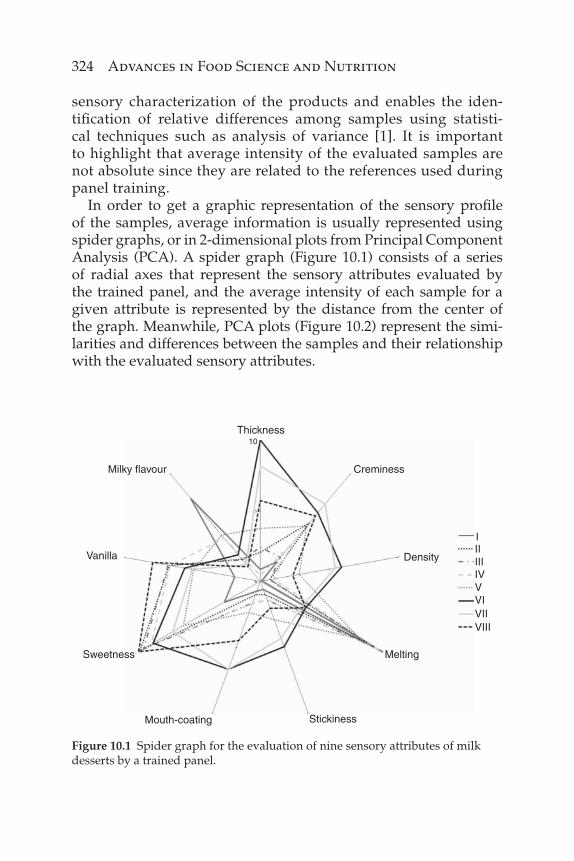
In order to get a graphic representation of the sensory profi le of the samples, average information is usually represented using spider graphs, or in 2-dimensional plots from Principal Component Analysis (PCA). A spider graph (Figure 10.1) consists of a series of radial axes that represent the sensory attributes evaluated by the trained panel, and the average intensity of each sample for a given attribute is represented by the distance from the center of the graph. Meanwhile, PCA plots (Figure 10.2) represent the simi-larities and differences between the samples and their relationship with the evaluated sensory attributes.
Figure 10.1 Spider graph for the evaluation of nine sensory attributes of milk desserts by a trained panel.
Thickness10
Milky flavour
Vanilla
Sweetness
Mouth-coating Stickiness
Melting
Density
Creminess
IIIIIIIVVVIVIIVIII

New Trends in Sensory Characterization 325
10.2 New Trends in Sensory Characterization of Food Products
10.2.1 Overview
Descriptive Analysis provides detailed, accurate, reliable and consistent results [2, 10]. In almost every major organization engaged in food research in Europe and the United States, as well as in many food companies, descriptive panels are used [22]. Due to the quality of the information provided, this methodology is expensive and time-consuming, which makes it diffi cult to apply in many everyday situations in the food industry where there are constraints in terms of time and resources [15].
Figure 10.2 Bi-plot representation of the Principal Component Analysis (PCA) performed on average data from the evaluation of nine sensory attributes of milk desserts by a trained panel.
Vanilla
Sweetness
Creaminess
ThicknessMouth-coating
GumminessStickinessV
I
VIVII
–2–2
–1
0
1
2
–1 0 1 2
VIII
IIIII
IV
Melting
PC
2 (2
6.81
%)
PC1 (66.45%)
Milky flavour

326 Advances in Food Science and Nutrition
In the fi rst place, the vocabulary and associated panel training must be adapted to each specifi c type of product, which makes the time necessary to get reliable results from Descriptive Analysis rela-tively high. Considering that the times available for product devel-opment become shorter, on many occasions it is not possible to use Descriptive Analysis during the development of a novel product, which hinders the design of products with optimum sensory char-acteristics. Moreover, the fact that assessors have to complete an exhaustive training process and that the evaluations for a specifi c food category require several sessions, make it necessary for many food companies to maintain separate panels, since a single panel is not able to handle the evaluations of all the product categories pro-duced [1]. These disadvantages limit the application of Descriptive Analysis in many specifi c applications; particularly in the case of small food companies and during the development of new food categories within a specifi c company [1]. Therefore, there is indus-trial pressure to develop alternative methods that obviate the need to train a sensory panel, or that at least reduce the training process.
Moreover, there is an increasing interest in gathering sensory information directly from the target consumers of food products instead of the more technical descriptions provided by trained assessors [23]. The most common approach to product optimiza-tion is to ask consumers to rate their liking of a large set of products and characterize the sensory properties of those products using a trained assessors’ panel. Then, both data sets are combined using regression analysis to identify the sensory characteristics of con-sumers’ ideal product [24]. In these approaches consumers are only asked about their liking, and therefore information about how they perceive the sensory characteristics of the products is not gathered. However, trained assessors could describe the product differently or take into account attributes that may be irrelevant for consumers [25]. Considering that the best way to understand consumer pref-erences might be consumer data [26], getting consumer feedback about the sensory characteristics of food products has become of great interest in the last decade.
In this context, several cost-effective methods for sensory characterization, alternative to Descriptive Analysis, have been recently developed. These methods do not require training, can be performed by trained assessors or consumers, and have been reported to be a good option when quick information about the sensory characteristics of a set of products is needed. There are

New Trends in Sensory Characterization 327
basically four types of methodologies: (i) methodologies based on the evaluation of specifi c attributes, (ii) methodologies that pro-vide a verbal description of the products, (iii) holistic methodolo-gies based on global similarities and differences among products, and (iv) methodologies based on the comparison of products with references.
10.2.2 Methodologies Based on Specifi c Attributes
This fi rst type of methodology relies on the quantifi cation of specifi c sensory attributes, as in conventional Descriptive Analysis. Its basic feature is that it saves time and resources by reducing to different extents the steps related to descriptor generation and panel train-ing. Within this fi rst type of alternative techniques for sensory char-acterization there are three main methodologies: intensity scales used by consumers, free-choice profi ling, and fl ash profi ling.
10.2.2.1 Evaluation of Sensory Attributes by Consumers Using Intensity Scales
A fi rst alternative to reduce the time needed for training assessors for sensory characterization is asking consumers to rate the inten-sity of a fi xed set of sensory attributes using scales, as it is com-monly done with trained assessors in Descriptive Analysis. The main difference with the traditional approach is that descriptors are provided by the researcher and not generated by consumers, and that no training in attribute recognition or quantifi cation is performed.
Despite the fact that this approach has not been traditionally rec-ommended [1, 10], it has been recently considered as an alternative to the classical sensory profi le provided by trained assessors [27, 28].
Many authors have reported that trained panels perform better than consumers or untrained panelists in terms of discriminative capacity and reproducibility, and that therefore training cannot be eliminated when evaluating the intensity of sensory attributes using intensity scales [15, 22, 29–31]. On the other hand, Moskowitz [32] stated that consumers are capable of validly rating the sensory aspects of products, based on the comparison with results from trained assessors. This author compared consumer ratings for 37 commercial sauce products with expert ratings and physical mea-surements, and concluded, based on the high correlation between

328 Advances in Food Science and Nutrition
datasets, that consumers are able to assess the characteristics of food products. Hough [33] stated that the similarities in the per-formance of consumer and expert panels reported by Moskowitz [32] were due to the fact that the experts were not well trained and that only correlations between mean ratings were considered in the comparison.
More recently, studies have been published reporting that con-sumers are able to perform Descriptive Analysis, providing simi-lar results as trained assessor panels. Husson et al. [27] analyzed results from two consumer panels from different geographies (218 and 124 assessors) for sensory characterization of 28 grape/rasp-berry beverages, by means of 10 attributes. Using analysis of vari-ance and multiple factor analysis on mean ratings for the evaluated attributes, the authors concluded that both panels provided valid and comparable results.
Meanwhile, Worch et al. [28] studied the sensory profi le of 12 commercial perfumes provided by a panel of 12 experts and by 104 consumers. The expert panel evaluated 12 attributes using 10 cm unstructured scales, whereas consumers evaluated 21 attributes using the same type of scale. In order to evaluate the reproducibil-ity of the consumer panel two products were evaluated in dupli-cate. The authors used analysis of variance, correlation coeffi cients and multiple factor analysis to compare results provided by experts and consumers. They concluded that the two panels provided simi-lar results in terms of discrimination, consensus, and reproducibil-ity; reporting that the product spaces obtained from both panels were similar. However, it is important to take into account that in this study the expert panel was composed of students and teachers from an esthetic and cosmetic school, who were not subjected to any extensive training apart from one training session for the most diffi cult attributes.
Ares et al. [34] evaluated global and individual performance of a consumer panel for texture evaluation of milk desserts, and compared it with that of a trained assessor panel. These authors concluded that consumer and trained assessor panels showed similar discriminative capacity and reproducibility, being able to detect the same differences in the texture of the evaluated milk desserts. However, panel agreement and individual performance of the consumers were much worse than that of the trained asses-sors. In particular, consumer intensity scores were widely distrib-uted along the scale and the majority of consumers were not able to
New Trends in Sensory Characterization 329
give scores that signifi cantly discriminated among samples. Thus, it seemed that the lack of consensus in the consumer panel and the high variability in their evaluations were compensated by the large sample size and the fact that a small group of consumers had an outstanding performance in evaluating the characteristics of the products, even without training. For these reasons, using consum-ers for Descriptive Analysis using intensity scales would not be recommended, except for a couple of specifi c situations where the cost and time involved in the selection and training of the assessors might be higher than those needed to perform a consumer study with 50–150 participants. In particular, the evaluation of sensory attributes using intensity scales by consumers might be a good option in specifi c applications when food companies do not have a trained panel or when the product is not evaluated on a regular basis.
10.2.2.2 Free-Choice Profi ling
Free-choice profi ling is a method for sensory characterization of food products that was developed in the 80s to overcome some of the diffi culties of conventional Descriptive Analysis [35]. The main assumption of this methodology is that assessors differ in the way in which they describe the sensory characteristics of food products [36]. Thus, instead of creating a consensus vocabulary and exten-sively training the assessors in the evaluation of specifi c sensory attributes, each assessor develops his/her own set of attributes and uses it to individually score the samples [37]. The main advantage of this approach is that assessors need little training since they just need to be capable of describing the sensory characteristics of food products and using line scales to quantify them according to their personal criteria [38]. For this reason, free-choice profi ling is quicker and less expensive than Descriptive Analysis, and can be applied with both trained assessors and consumers [1, 39].
In order to overcome the diffi culties faced by many untrained assessors to generate sensory terms to characterize the products [40], descriptor generation is usually performed using the reper-tory grid method [41]. Repertory grid consists of a simple personal interviewing technique that allows understanding which product characteristics are relevant for consumers and provides a list of sen-sory terms to be used for characterizing the products [42]. Products are arranged into triads (groups of three), and are presented to the

330 Advances in Food Science and Nutrition
assessors in such way that two of the objects within the triad are arbitrarily grouped and separated from the third [42]. Assessors are asked to describe how the two grouped objects (A and B) are similar and different from the third (C) [41]. Once the assessor has elicited all the terms responsible for the similarities and differences between the groups, the researcher presents the remaining combi-nations within the triad (A and C vs B, B and C vs A) and once again asks the assessor to describe the similarities and differences. After the procedure is repeated for all the possible triads of products to be evaluated, all the sensory terms elicited by the assessor are placed together in a list next to unstructured scales. Then, assessors are asked to evaluate the products by rating the intensity of their own set of sensory attributes. It is important to highlight that in free-choice profi ling each assessor evaluates his/her own set of sensory attributes, which are considered the most relevant for describing the products.
Due to the fact that assessors use an individual set of sensory attributes for their evaluations, data analysis should be carried out using Generalized Procrustes Analysis (GPA) [43, 44] followed by a principal component analysis [45], in order to get a consensus con-fi guration from a set of individual data sets. GPA scales, translates, and rotates the data matrices of each panelist [43]. Each assessor’s data is transformed into an individual spatial confi guration, which is then matched into a consensus confi guration, which provides information about the sensory characteristics that assessors used to distinguish the products, as well as a two- or three-dimensional rep-resentation of the similarities and differences between the samples [38]. Differences among products are explained considering the indi-vidual terms used by the assessors to describe each of the products.
Free-choice profi ling (FCP) has been applied to a wide range of food products, including scotch whisky [46], beer [29], dark rum [47], vanilla samples [48], dry [49, 50] and cooked ham [51], carbon-ated soft-drinks [52], dairy products [53], coffee [54], and orange juice [55].
FCP is a simple and quick methodology that can provide relevant information to marketing and product development teams about the sensory characteristics of food products [56, 57]. However, results are generally not much actionable for product developers due to the fact that results mainly show the most important similarities and differences between the products, not providing information about the average intensity of the products or identifying subtle

New Trends in Sensory Characterization 331
differences between them [1]. Moreover, another disadvantage of the methodology is that many times the sensory terms used by some assessors to characterize the products are diffi cult to interpret [1] due to the fact that they are too personal. According to Deliza et al. [58] the terms used by consumers during the evaluation are closely related to their own individual experience and familiarity with the product.
10.2.2.3 Flash Profi le
Flash profi le is a sensory characterization technique that consists of a combination of free-choice profi ling with a simultaneous com-parative evaluation of the whole product set [59]. Flash profi le was developed as a fl exible and quick method that aims at providing information about the relative sensory positioning of a set of prod-ucts [60].
The methodology is based on the assumption that comparing products is easier and more natural than evaluating them using intensity scales [61]. According to Dairou and Sieffermann [62] fl ash profi ling should be performed with trained assessors or sen-sory evaluation experts in order to be able to better describe the products using discriminating and non-hedonic attributes.
Flash profi ling is structured in two main sessions. In the fi rst session assessors are presented with the whole set of products and are asked to generate their individual set of sensory terms which differentiate the products, avoiding hedonic terms [1]. Then, the researcher makes a list of the terms generated by all the assessors and shows it to each of them. The assessors are allowed to update their list by adding terms that they consider relevant but were not elicited by themselves or by replacing terms that are better adapted to the products. In the second session the assessors are presented the whole product set and are asked to rank the products accord-ing to their intensity of each of the attributes in their individual lists. At least three replications of the ranking session are recom-mended [62].
Data from fl ash profi ling are commonly analyzed using Generalized Procrustes Analysis on ranking data, similarly to free choice profi ling [1]. Using this analysis a consensus confi gu-ration is obtained, which allows the identifi cation of similarities and differences among products, as well as their main sensory characteristics.

332 Advances in Food Science and Nutrition
The main advantage of fl ash profi ling is that information about the sensory characteristics of a set of products is gathered in a short time due to the fact that the phases of familiarization with the prod-uct space, attribute generation and evaluation are merged into a single step [61]. Considering that each assessor uses his/her own vocabulary to generate the list of sensory terms, the methodology allows a diversity of points of views [62]. Moreover, the fact that assessors have simultaneous access to the whole product set forces them to focus on the differences they perceive in order to gener-ate only attributes which allow discriminating among samples [63]. For this reason, when the tested products belong to the same prod-uct category or to similar product categories, fl ash profi ling has been reported to be more discriminating than conventional profi l-ing [61].
However, fl ash profi ling also has several disadvantages; the fi rst of which is that this methodology is recommended for assessors with previous experience in sensory evaluation. As in free choice profi ling the interpretation of the sensory terms is not always easy since assessors generate a large number of descriptors that lack defi nition and evaluation procedure [64]. Also, considering that all products should be evaluated simultaneously, in order to avoid fatigue, the number of samples to be evaluated in a single session is limited [1]. Besides, it might be diffi cult to apply fl ash profi ling for shelf life testing or for evaluating products that require care-ful temperature control or that have intense and persistent sensory characteristics.
Flash profi le has been applied to describe the sensory character-istics of different foods, such as red fruit jams [62], dairy products [61], pork sausages [65], commercial apple and pear purees [66], jellies [67], bread [68], wines [69], apple juice [70], hot beverages [60], fi sh nuggets [64], and ice tea [63].
10.2.3 Methodologies that Provide a Verbal Description of the Products
The second type of methodology is less analytic and rational. It aims at providing a verbal description of the products, which could be done by selecting words or phrases from a list (as in check-all-that-apply questions) or by providing a description of the products in an open-ended-question.

New Trends in Sensory Characterization 333
10.2.3.1 Check-All-That-Apply Questions
Check-all-that-apply (CATA) questions are a type of multiple choice question which have been extensively used in marketing research [71]. They have been recently reported to be a simple and reliable method to gather information about consumers’ perception of the sensory characteristics of food products [72–74]. CATA questions consist of a list of words or phrases from which respondents should select all they consider appropriate to describe a product.
Products are presented to consumers in monadic balanced order and they are asked to check all the terms from the CATA question that they consider appropriate to describe each of the samples. There are no constraints on the number of attributes that could be selected by the consumers. The list of attributes included in the CATA question can include sensory characteristics (Figure 10.3a) but also terms related to non-sensory characteristics, such as usage occasions, product positioning and emotions (Figure 10.3b). The selection of the list of words or phrases included in the CATA ques-tion is one of the main challenges of the methodology. Sensory attributes can be selected based on the descriptors used by trained assessor panels to characterize the products or by using results from previous focus groups or consumer studies.
Data analysis from CATA questions is performed using Cochran’s Q test [75] and Correspondence Analysis [25]. Cochran’s Q test is used to evaluate if the consumers detected differences among
Figure 10.3 Examples of check-all-that-apply (CATA) questions composed of sensory (a) and non-sensory terms (b).
Please, check all the words or phrases you think that apply to this product:
Please, check all the words or phrases you think that apply to this product:
Sweet
(a)
(b)
BitterCreamyStickyRoughOff-flavour
SoftThickChocolate flavourVanilla flavour
Good for nutrition It is the best way to start the morning in a healthy wayGood for refreshing and hydratingGood for gratificationPerfect complement for dieting
Good to go along with mealsMakes meals specialFor the whole family

334 Advances in Food Science and Nutrition
samples for each of the terms from the CATA question. Cochran’s Q test is a nonparametric statistical test, which is used in the analysis of two-way randomized block designs to check whether k treat-ments have identical effects, when the response variable is binary. For each term of the CATA question a data matrix is created con-taining samples in the columns, consumers in rows and where each cell indicates if the term was mentioned or not (1/0 respectively) (Table 10.1).
Moreover, in order to get a representation of the samples, the fre-quency of mention of each term from the check-all-that-apply ques-tion is determined by counting the number of consumers who used that term to describe each sample (Table 10.2). Correspondence Analysis (MCA) or Multiple Factor Analysis is then performed on the frequency table containing responses to the CATA question [73,
Table 10.1 Example of the data matrix used for analyzing data from a term of a check-all-that-apply (CATA) questions using Cochran’s Q test.
Consumer Sample 1 Sample 2 .... Sample x
1 1 0 ... 0
2 1 0 ... 0
... ... ... ... ...
n 0 1 ... 1
Each cell indicates if the term was mentioned or not (1/0 respectively) by each consumer.
Table 10.2 Example of the frequency table used for analyzing data from a term of a check-all-that-apply (CATA) questions using Correspondence Analysis.
Sample Sweet Creamy .... Rough
1 34 45 ... 0
2 22 0 ... 14
... ... ... ... ...
x 17 43 ... 3
Each cell indicates the number of times that a term was mentioned for describing each sample.

New Trends in Sensory Characterization 335
76]. This analysis provides a sensory map of the samples, which enables the determination of similarities and differences between the samples, as well as the sensory attributes that characterize them (Figure 10.4).
Despite the recent application of CATA questions to sensory characterization, it has been used for the sensory characterization of several food products such as snacks [72], strawberry cultivars [77], ice cream [74], milk desserts [73, 78], orange-fl avored pow-dered drinks [76], and citrus-fl avored sodas [79].
CATA questions have been reported to be a quick, simple and easy method to gather information about the sensory characteristics of food products. Ticking a box to select the sensory characteristics that describe a food product does not require much effort for consumers. Thus, CATA questions seem easier and have a smaller infl uence on liking scores than just-about-right or intensity questions [72]. Some
Figure 10.4 Representation of the fi rst and second dimensions of a Correspondence Analysis performed on data from check-all-that-apply (CATA) questions for the sensory characterization of orange-fl avored powdered drinks.
Light colourAcid
1
Orange flavour
Natural Sweet
RoughIntense flavour
Very sweet 1AftertasteC
EArtificial flavour
Dark colour
Dim –1 (57.9%)
Dim
2 (
26.3
%)
–1
1
A
Bitter
Off-flavour
Soft
Not much orangeflavour
Not very sweet
DDiluted
B
F
00

336 Advances in Food Science and Nutrition
publications have suggested that the sensory maps generated by CATA questions are very similar to those from Descriptive Analysis with a trained assessor panel [74, 78, 80]. However, it is important to take into account that despite the fact that frequency of mention of the terms from CATA questions have been reported to be closely related to attribute intensity, they do not provide quantitative infor-mation since consumers only evaluate if a term is appropriate to describe a product or not. For this reason, data from CATA ques-tions is qualitative and therefore might have smaller discriminative capacity than ranking tasks or intensity scales [74].
Another limitation of CATA questions is that it requires a rela-tively large number of consumers. Furthermore, it is worth men-tioning that further research is needed to evaluate the infl uence of the number and type of terms in the sensory characterization pro-vided by this methodology.
10.2.3.2 Open-Ended Questions
The application of open-ended questions to gather information about consumer perception of the sensory characteristics of food products was proposed by ten Kleij and Musters [25]. These authors allowed consumers to voluntarily write down remarks after their overall liking evaluations. Alternatively, Ares et al. [81] asked con-sumers to compulsorily provide up to four words to describe the samples, whereas Symoneaux et al. [82] gave consumers the option to freely state what they liked and/or disliked about the evaluated product. All these options enabled consumers to provide a descrip-tion about the sensory characteristics of food products, which aims at understanding their perception and particularly what motivates their liking scores.
Consumer responses to open-ended questions are not subjected to any restrictions and therefore contain rich information that can underscore and complement quantitative fi ndings from trained assessor panels [25]. However, the analysis of textual data is diffi -cult, labor-intensive and time-consuming due to the inherent com-plexity of this type of data.
Consumers complete the open-ended question in their own style, without any specifi c guidance, even with typing, ortho-graphic and grammatical mistakes, which makes it necessary to transform the data into precise sensory terms [82]. According to

New Trends in Sensory Characterization 337
Rostaing et al. [83] analysis of text data consists of the following stages: removing mistakes, elimination of connectors and auxil-iary terms, identifi cation of phrases and terms which make them up, lemmatization, regrouping synonyms, managing ambiguous words, and marking terms of interest for the researcher. The fi rst step of the analysis usually consists of deleting stopwords, auxil-iary terms and other irrelevant words. Then, words with similar meaning are grouped into the same category. This classifi cation is usually performed independently by three researchers consider-ing their personal interpretation of the meaning of the words and synonymy as determined by a dictionary. After individually evalu-ating the data, a meeting of the researchers is undertaken to check the agreement between their classifi cations. The fi nal categories are consensually determined by the researchers. This triangulation technique has been used by other authors dealing with data from qualitative techniques [84]. Categories mentioned by more than 5% or 10% of the consumers are selected and frequency of mention of each category is determined by counting the number of partici-pants that used each category to describe each product. After this, a frequency table or contingency table is constructed and analyzed. This data can be analyzed using Chi-square test and correspon-dence analysis. Ares et al. [81] carried out a global Chi-square test to study the independence between rows and columns, whereas Symoneaux et al. [82] used a Chi-square per cell test to identify signifi cant differences among products and sensory characteristics within the contingency table. Data can fi nally be graphically rep-resented using correspondence analysis [25, 81], which provides a 2-dimensional representation of the samples and the attributes.
This methodology has been used for sensory characterization in a limited number of food products: mayonnaise [25], milk desserts [81], and apples [82]. Results have shown that open-ended ques-tions provide similar information to that obtained using Descriptive Analysis with trained assessor panels. However, it is important to highlight that the information provided by this methodology might not be precise enough compared to the traditional Descriptive Analysis performed with trained assessors, particularly when sub-tle differences between the products exist. It is important to high-light that, as in CATA questions, the data gathered by open-ended questions have little discriminative power due to their qualitative nature. Besides, words provided by consumers may be vague and

338 Advances in Food Science and Nutrition
diffi cult to interpret, which makes data analysis tedious and dif-fi cult [81].
Open-ended questions can be considered an interesting comple-ment to the traditional descriptive approach in order to gather the vocabulary used by consumers to describe the products, providing valuable information for marketing groups when developing com-munication strategies [81, 82].
10.2.4 Holistic Methodologies
Holistic methodologies are based on the assessors’ perception of the global similarities and differences among products. They rely on the holistic or global perception of the products rather than on the analytical evaluation of specifi c sensory attributes. This consists of a fi rst advantage of the methods since those aspects that are dif-fi cult to verbalize or defi ne are not overlooked by assessors.
The most popular methodologies are free sorting and projective mapping, which are closely related to projective techniques. This type of technique is extensively used in psychology and is based on the assumption that the innermost feelings, beliefs, perceptions, atti-tudes and motivations of consumers can be uncovered by presenting them an unstructured and ambiguous stimulus [85]. In this context, projective techniques provide an indirect approach to consumers’ perceptions, which allows researchers to transcend communication barriers and get information that is not affected by the instructions given to consumers before performing the evaluation [86].
10.2.4.1 Sorting
One of the most important operations in thinking is classifi ca-tion and categorization [87]. According to the Merriam-Webster Dictionary [88] a classifi cation is a systematic arrangement in groups or categories according to established criteria. In the context of social sci-ences, sorting is a classifi cation performed by a person [87]. Sorting has been extensively used in cognitive and social sciences as a sys-tematic method for data collection, particularly when the objective is to uncover how people perceive a series of objects and what char-acteristics they attend to when making discriminations between objects [87, 89]. Sorting tasks have also been reported to be a power-ful alternative to gather information about the sensory character-istics of food products in sensory and consumer science [90, 91].

New Trends in Sensory Characterization 339
The idea behind free sorting tasks is to measure the global degree of similarity among samples by grouping them according to their similarity.
Assessors (who can be trained assessors or consumers) receive the entire set of samples at once and are asked to try them and to sort the samples into groups according to their similarities and dif-ferences, using their own personal criteria. It is explained that two very similar samples should belong to the same group, whereas two samples that are clearly different should be placed in different groups. Assessors are usually told that they should sort the samples in at least two groups in order to avoid the trivial response of hav-ing all samples in the same group. In order to get information about the sensory characteristics responsible for the similarities and dif-ferences between the samples, a verbalization task is needed [92]. Thus, once the sorting has been completed, assessors are generally asked to provide descriptive words for each of the groups they formed [91, 93]. A typical classifi cation provided by an assessor in a sorting task is presented in Figure 10.5.
Considering that assessors may fi nd it diffi cult to provide a description of the sensory characteristics of each group of samples and that textual data is often diffi cult to analyze, Lelièvre et al. [94] provided the assessors with a list of predefi ned characteristics.
Different approaches have been proposed to analyze data from free sorting tasks. However, the idea behind all the approaches is to get a spatial map that represents the relationship of the samples in terms of their sensory characteristics [91]. The distance between
Figure 10.5 Typical response of a single assessor to a free sorting task with six samples.
Description of the groups
Group N°1: sour, bitter
1 735, 678, 098057, 876
32123
Group N°2: creamy, soft, thick
Group N°3: off-flavour, disgusting
Group Samples

340 Advances in Food Science and Nutrition
each pair of samples in the map is related to their degree of differ-ence, i.e., if two samples are represented close to each other in the map they are very similar, and if they are represented far from each other they correspond to clearly dissimilar samples.
The most common statistical technique for analyzing sorting data is multidimensional scaling [91]. In this technique a similar-ity matrix is created by counting the number of times each pair of samples is sorted within the same group, as shown in Table 10.3. Then, either non-metric or metric multidimensional scaling (MDS) is performed on this similarity matrix in order to get a 2-dimen-sional representation of the samples, which provides a measure of the similarities between them. A typical sample representation from MDS is shown in Figure 10.6.
The main drawback of MDS is that information about the indi-vidual perception of the assessors is lost because individual data is transformed into a similarity matrix [91]. Thus, in this data analysis it is not possible to visualize if all the assessors sorted the samples similarly or if they had clearly different perceptions. In order to overcome this limitation, Abdi et al. [95] proposed the application of DISTATIS. This technique is a generalization of MDS, which allows analyzing 3-way distance tables. It takes into account individual sorting data. DISTATIS fi rst analyzes the individual co-occurrences matrices of the participants, providing an optimal representation of the assessors which is based on their resemblance. Then, DISTATIS diagonalizes the linear combination of individual matrices to pro-vide a consensus representation of the samples. Finally, the words used to describe product groups could be projected by using bary-centric properties.
Table 10.3 Example of a similarity matrix containing data from a free sorting task.
Sample 1 Sample 2 .... Sample x
Sample 1 50 27 ... 0
Sample 2 27 50 ... 13
... ... ... ... ...
Sample x 0 13 ... 50
Each cell indicates the number of times that each pair of samples was placed together within the same group in the free sorting task.

New Trends in Sensory Characterization 341
Moreover, Cadoret et al. [96] presented a different technique for analyzing sorting data, which is called FAST. This approach pro-vides an optimal representation of the products based on Multiple Correspondence Analysis (MCA), and an optimal representation of the consumers based on Multiple Factor Analysis (MFA). In this technique all the consumers have the same importance when con-structing the samples’ map. An example of the sample representa-tion from a free sorting task using FAST is shown in Figure 10.7.
The main advantage of DISTATIS and FAST is that they provide a representation of the consumers, which enables the visualiza-tion of individual differences and the identifi cation of consumer segments with different perceptions. Moreover, by applying these techniques, the words used by consumers to describe the samples could easily be projected into the sample space. This last possibility improves interpretation, providing more actionable results.
Free sorting tasks have been extensively applied in sensory and consumer science to a wide range of products with different com-plexity such as cheese [91], drinking water [97], beers [98], red wine [99], yogurts [100], breakfast cereals [93], olive oil [101], and orange-fl avored powdered drinks [76].
Figure 10.6 Typical sample representation of data from a free sorting task with seven samples using multidimensional scaling (MDS).
0.3
0.2
0.1 A
D
F
CB
GE
0.0
–0.1
–0.2
–0.3
–0.4
–0.4 –0.2 0.0
NMDS1
NM
DS
2
0.2

342 Advances in Food Science and Nutrition
Figure 10.7 Representation of samples and descriptive terms from a free sorting task using FAST.
E
G Off-flavour
Light colourNot very sweet
BitterRough
Aftertaste
Disgusting–1
–1
0
0
Orange flavourYummy
Natural
Artificial flavour
Diluted
SoftNot much orange flavour
Sweet
Intense flavour
Very sweet
Dim 1 (23.6%)
Dim
2 (
19.9
%)
Dark colour
BC
D
F
1
2
A
21
–2
–2
Acid
Free sorting has several advantages. Firstly, it does not require extensive training and produces little fatigue and boredom, which makes it appropriate for both trained assessors and consumers [102]. Besides, it does not require the use of scales or other quantitative systems [93]. Despite the fact that the method can be applied to a large sample set it is important to take into account that all samples should be presented simultaneously in a single session. Therefore, when working with complex fatiguing products, the number of products to be evaluated may be rather limited. Furthermore, one of the main limitations of free sorting tasks is that the descriptions provided by the assessors may be diffi cult to interpret in order to get actionable information.
10.2.4.2 Projective Mapping
Another alternative to traditional profi ling is projective mapping, also known as Placing or Napping®. Risvik et al. [103] introduced the idea of projective mapping to quantify individual perception of overall similarity and dissimilarity among products. This method-ology can be carried out with consumers or trained assessors, who are asked to provide a two-dimensional representation of a group of samples, according to their own criteria [26]. In this represen-tation, the Euclidean distance between the samples is a measure

New Trends in Sensory Characterization 343
of their dissimilarity, in such a way that the smaller the distance separating two samples, the more similar they are. In this method-ology assessors are asked to consider the product as a whole and to quantify the overall difference between pairs of samples [103]. As in any projective technique, the idea is to have a vague task which is not well defi ned, in order to get a simple and spontaneous response [26].
For performing a projective mapping task, all samples are pre-sented simultaneously to the assessors, who are asked to place them on an A3 white sheet of paper (60 cm by 40 cm), accord-ing to the similarities or dissimilarities between them. Assessors are told to complete the task according to their own criteria since there are no right or wrong answers. It is also explained that two samples close together on the sheet correspond to very similar samples and that if they perceive two samples as very different they should locate them apart from each other. The positioning criteria and their importance are chosen on an individual basis by each assessor, which makes projective mapping a fl exible and spontaneous procedure.
In order to understand the similarities and dissimilarities among samples in terms of their differences in their sensory characteristics, a description phase can be added to the projective mapping task [104]. This description phase is usually performed after the samples are placed on the white sheet.
For each assessor map, the X and Y coordinates of each sample are determined, considering the left bottom corner of the sheet as origin of the coordinate system, as shown in Figure 10.8. These data are analyzed using Generalized Procrustes Analysis (GPA) or Multiple Factor Analysis (MFA) [69, 104]. In MFA data analysis is performed on a data matrix composed of a set of columns that rep-resent the X and Y coordinates of the samples in the sheets of each of the assessors for each of the evaluated samples (Table 10.4). In the MFA the coordinates of each assessor are considered as a group of two unstandardized variables, which enables the balancing of differences in how each assessor uses the horizontal and vertical coordinates [104]. The frequency table containing assessor descrip-tions is considered as a set of supplementary variables: correlation coeffi cients with the MFA factors were calculated and the variables are represented but they do not participate in the construction of these factors [104]. This analysis provides a consensus representa-tion of the samples, a representation of the descriptions provided

344 Advances in Food Science and Nutrition
Figure 10.8 Example of sample representation of an individual consumer in a projective mapping task.
Sample 465x
x
y
y
Sample 007
Sample 132
Sample 543
Sample 786
Sample 200
Table 10.4 Example of the data matrix used for analyzing data from projective mapping using Multiple Factor Analysis.
SampleAssessor 1 Assessor 2 Assessor n
X1 Y1 X2 Y2 ... Xn Yn
1 14.7 0.5 10.4 34.5 ... 14.3 4.4
2 54.5 1.8 15.9 29.4 ... 35.4 6.7
... ... ... ... ... ... ...
X 34.2 8.4 45.8 11.4 ... 58.9 19.4
Each couple of columns Xi,Yi represent the coordinates of the samples in the map of consumer i.
by the assessors, and also a representation of the assessors, which indicates the similarity of their representations.
Projective mapping has been applied to a variety of food prod-ucts, including chocolate [103], dried soup [26], snack bars [105], wines [69, 104], hot beverages [60], fi sh nuggets [64], milk desserts [73], orange-fl avored powdered drinks [76], apples and cheese [106].

New Trends in Sensory Characterization 345
Projective mapping is a quick and simple technique which can be used with trained assessors, experts or consumers. As in free sorting tasks, projective mapping does not require the use of scales or other quantitative systems. On the other hand, one of the dis-advantages of this methodology is that sometimes the differences between samples are diffi cult to explain due to the heterogeneity of assessors’ descriptions. Moreover, in order to limit fatigue or adap-tation, the number of samples presented should be limited to sets of approximately 10 samples which have to be simultaneously evalu-ated in a single session [107].
10.2.5 Methods Based on the Comparison with References
The fourth type of methodology for sensory characterization is based on the comparison of samples with products that are regarded as references and are readily available for evaluation. The main advantage of this approach is that it consists of a quick and easy methodology that enables the comparison of all products with fi xed references, even if they are not evaluated in the same session. These methodologies are relatively novel and although they have been reported to provide interesting results, they have not been extensively applied yet.
10.2.5.1 Polarized Sensory Positioning
Teillet et al. [108] developed a quick method to explore consumers’ perception of the sensory characteristics of water, which is called Polarized Sensory Positioning. This method is based on the com-parison of food samples to a fi xed set of reference products, or poles.
In this methodology, assessors (who could be trained or untrained) are asked to evaluate the degree of similarity of the sam-ples with a set of standard products. In their initial proposal, Teillet et al. [108] selected three poles that represent three main tastes of mineral water and used unstructured scales ranging from “exactly the same taste” to “totally different taste” to measure how similar the taste of the sample was compared to the taste of each of the three reference products (poles), as shown in Figure 10.9.
Data analysis can be performed using two different approaches. In the fi rst approach scores are considered as a measure of the distance from each pole. Then, data are averaged by sample and

346 Advances in Food Science and Nutrition
Figure 10.9 Example of an evaluation sheet used in Polarized Sensory Positioning to compare one sample with three reference products (R1, R2 and R3).
Please, evaluate how different the sample is compared to the three referenceproducts:
Exactly the sametaste
R1
R2
R3
Exactly the sametaste
Totally differenttaste
Totally differenttaste
Exactly the sametaste
Totally differenttaste
analyzed using multidimensional scaling unfolding techniques [109] on the samples by poles matrix (Table 10.5), to get a two-dimensional representation of the similarities and differences among samples. In the second approach the poles are considered as descriptors and therefore data are analyzed by calculating aver-age scores, whereas sample representation is obtained by principal component analysis [108].
The advantages of Polarized Sensory Positioning are the fact that it is an easy and quick methodology which could be performed with
Table 10.5 Example of the data matrix used for analyzing data from projective Polarized Sensory Positioning.
SampleAssessor 1 Assessor 2 Assessor n
R1 R2 R3 R1 R2 R3 ... R1 R2 R3
1 1.4 8.3 0.9 1.0 7.6 8.5 ... 1.3 7.8 4.4
2 0.2 9.8 7.8 8.9 5.6 2.4 ... 3.4 6.5 6.7
... ... ... ... ... ... ... ... ... ... ...
X 3.2 4.8 6.4 5.8 9.9 1.4 ... 8.9 7.5 1.4
Each couple of columns R1, R2, R3 represent the degree of difference between a sample and each of the references (R1, R2 and R3, respectively) for each of the assessors.

New Trends in Sensory Characterization 347
trained and untrained assessors, and that it allows the comparison of data performed in different sessions.
Despite the fact that the only published application of this meth-odology to food products is related to mineral water, the methodol-ogy has a great potentiality due to the fact that it has been reported to provide similar results to Descriptive Analysis [108]. However, it is important to highlight that its application requires being able to have easily available and stable references. Besides, research is nec-essary to determine how reference samples should be selected, and particularly how many reference samples are necessary and what their characteristics should be. Besides, if no descriptive phase is performed after the task, information about the sensory character-istics responsible for the similarities and differences among prod-ucts is not gathered.
10.2.5.2 Pivot Profi le Method
The Pivot© Profi le method was developed by Thuillier [110] to characterize the sensory properties of champagne. The method is based on the free description of the differences among samples and a reference product, which is called the “pivot.”
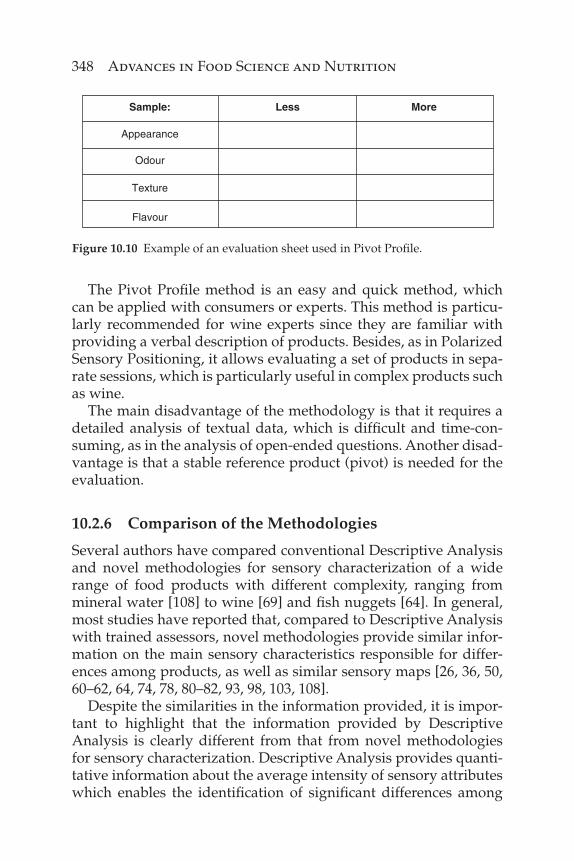
Assessors are asked to provide a complete description of the attributes that they perceive as responsible for the sensory dif-ferences between the products and the pivot by completing two different columns, one described as “More” and the other as “Less.” Thus, assessors should describe the sensory attributes that they perceive as less intense in the product compared to the pivot (e.g. less bitter), as well as those that they perceive as more intense (e.g. more acid). Assessors are asked to use only descrip-tive words and to avoid writing complete sentences. An example of the evaluation sheet is shown in Figure 10.10.
The fi rst step of the data analysis is to analyze textual data to iden-tify similar terms, which are grouped, as in open-ended questions. Then, the number of times that each term is positively and negatively mentioned is determined for each product and then the negative number is subtracted from the positive number. The fi nal score is subjected to a transformation to get positive scores and the result-ing matrix is submitted to Correspondence Analysis to get a sensory map of the evaluated products [110]. This analysis provides informa-tion on the main sensory characteristics of each product, as well as on the similarities and differences among the evaluated samples.
348 Advances in Food Science and Nutrition
The Pivot Profi le method is an easy and quick method, which can be applied with consumers or experts. This method is particu-larly recommended for wine experts since they are familiar with providing a verbal description of products. Besides, as in Polarized Sensory Positioning, it allows evaluating a set of products in sepa-rate sessions, which is particularly useful in complex products such as wine.
The main disadvantage of the methodology is that it requires a detailed analysis of textual data, which is diffi cult and time-con-suming, as in the analysis of open-ended questions. Another disad-vantage is that a stable reference product (pivot) is needed for the evaluation.
10.2.6 Comparison of the Methodologies
Several authors have compared conventional Descriptive Analysis and novel methodologies for sensory characterization of a wide range of food products with different complexity, ranging from mineral water [108] to wine [69] and fi sh nuggets [64]. In general, most studies have reported that, compared to Descriptive Analysis with trained assessors, novel methodologies provide similar infor-mation on the main sensory characteristics responsible for differ-ences among products, as well as similar sensory maps [26, 36, 50, 60–62, 64, 74, 78, 80–82, 93, 98, 103, 108].
Despite the similarities in the information provided, it is impor-tant to highlight that the information provided by Descriptive Analysis is clearly different from that from novel methodologies for sensory characterization. Descriptive Analysis provides quanti-tative information about the average intensity of sensory attributes which enables the identifi cation of signifi cant differences among
Figure 10.10 Example of an evaluation sheet used in Pivot Profi le.
Sample:
Appearance
Odour
Texture
Flavour
Less More

New Trends in Sensory Characterization 349
samples in a specifi c attribute. However, it is not possible to gather this information using novel methodologies. From a statistical point of view, Descriptive Analysis is more robust than most novel meth-odologies, which makes it possible to identify subtle differences among products [64]. Besides, considering the assessors’ extensive training, Descriptive Analysis is clearly more appropriate for com-paring samples in different moments in time or different sample sets [60]. Besides, the interpretation of the sensory terms used in free-profi ling, fl ash profi le, open-ended questions, or holistic meth-odologies is in general a time-consuming, labor-intensive and dif-fi cult task due to the heterogeneity of consumers’ descriptions, the large number of terms used and the lack of defi nitions and evalu-ation procedures. In particular, when differences among products lay in complex sensory attributes (such as creaminess or afterfeel) panel training for Descriptive Analysis is needed in order to get accurate information for product development [60]. For all these reasons results from Descriptive Analysis are much more action-able for product developers than those from novel methodologies; being that the latter is mainly useful when the objective is to iden-tify the most salient attributes and the most important similarities and differences among products.
Despite the fact that Descriptive Analysis provides more accu-rate and reliable information in most cases, some clear advantages of novel methodologies can be highlighted. Firstly, the time asso-ciated with the implementation of novel methodologies for sen-sory characterization is much shorter than that needed to perform Descriptive Analysis, which makes them an interesting alternative in sensory and consumer science, particularly for those working in the industry. Another advantage of most novel methodologies is that they do not require using scales for evaluating the intensity of sensory attributes. Besides, they do not require consensus from the panel, which can potentially lead to some loss of information due to the fact that if the perception of the minority of the assessors differs from that of the majority, it is not taken into account [64]. The lack of need for consensus among panelists allows a diversity of points of views, which can lead to richer information [62]. Furthermore, in a small number of applications fl ash profi le has been reported to provide more detailed information than Descriptive Analysis. Delarue and Sieffermann [61] stated that when working with simi-lar products fl ash profi le was more discriminating than Descriptive Analysis. Meanwhile, Albert et al. [64] reported that fl ash profi le

350 Advances in Food Science and Nutrition
with semi-trained assessors provided a more detailed description of the sensory characteristics of fi sh nuggets than Descriptive Analysis.
Novel methodologies differ in the way in which they gather information about the sensory characteristics of food products, which leads to differences in the information they provide [67]. Holistic methodologies are based on assessors’ global perception of the products, which may enable the identifi cation of the main attri-butes responsible for differences in their perception of the samples. In free sorting and projective mapping assessors focus their atten-tion on the global perception of the products, which enables the identifi cation of the most salient characteristics. On the other hand, on attribute-based methods assessors’ perception is evaluated by attributes. This leads to differences in the information provided by similarity-based methodologies and those that rely on the evalua-tion of specifi c attributes.
Some authors have reported that similarity-based methods are less discriminative than those from methodologies based on the evaluation of specifi c sensory attributes, particularly when small differences among samples are considered. Veinand et al. [63] com-pared three methodologies (free-choice profi ling, fl ash profi le and projective mapping) for consumer profi ling of lemon iced teas and reported that fl ash profi le showed the highest discriminative abil-ity, whereas projective mapping showed the lowest. Meanwhile, Albert et al. [64] concluded that fl ash profi le provided more detailed information about the sensory characteristics of fi sh nuggets than projective mapping due to the fact that the latter was based on assessors’ global perception of the products. When working with hot beverages, Moussaoui and Varela [60] reported that fl ash pro-fi le and free-choice profi le provided richer vocabularies and more accurate sample maps than similarity-based methodologies such as projective mapping and free sorting. Moreover, these authors reported that untrained assessors were more repeatable when using fl ash profi le than projective mapping or free sorting. Regarding the comparison of projective mapping and free sorting, Nestrud and Lawless [106] reported that despite the sensory maps provided by both methodologies were similar for apples and cheese, the identi-fi cation of samples with similar sensory characteristics was easier to interpret for projective mapping than for sorting.
Apart from the reliability of the methodologies it is also impor-tant to take into account practical issues. Although most of the novel methodologies for sensory characterization have been reported

New Trends in Sensory Characterization 351
to provide similar results, they clearly differ in the diffi culty that assessors encounter when completing the tasks. Holistic methodol-ogies such as free sorting and projective mapping can be considered more intuitive and less rational than other methodologies based on the evaluation of specifi c sensory attributes. However, Ares et al. [76] reported that although consumers seemed to understand the projective mapping and sorting tasks, they found them much more diffi cult than CATA questions or intensity scales. Veinand et al. [63] reported that projective mapping was more diffi cult to per-form with consumers than fl ash profi le. According to these authors, when completing a projective mapping task consumers found it diffi cult to use the sheet of paper to locate the samples according to their similarities and differences. Also, Ares et al. [73] reported that projective mapping tasks required further explanation than CATA questions in order to assure that consumers understood the task.
Besides, regarding the time needed by assessors to complete the task, intensity scales, CATA questions, open-ended questions and pivot profi le are less time-consuming than projective mapping, free-choice profi ling, fl ash profi le, and polarized sensory position-ing. Whereas free-choice profi ling and fl ash profi le imply two sepa-rate sessions, one for generating the descriptors and a second one for evaluating the set of products, the rest of the methodologies can be performed in only one session. Besides, projective mapping and sorting tasks are more time-consuming than CATA or open-ended questions. According to Ares et al. [73], consumers needed between 5 and 15 min to complete a CATA question for characterizing the sensory properties of eight milk desserts, while it took consumers between 18 and 25 min to complete a projective mapping task.
According to these results holistic methodologies such as projective mapping and free sorting are more diffi cult and time-consuming for consumers. Considering that trained assessors with previous experi-ence with sensory evaluation techniques can more easily understand these methodologies than naïve assessors, Veinand et al. [63] recom-mended the use of projective mapping only with expert panelists.
Another disadvantage of projective mapping is when paper sheets are used during the evaluations; it is tedious and tiresome for the researchers to measure the products’ coordinates in the sheet of each assessor, particularly when a large number of consumers is considered [63].
Another clear difference between the methods is related to the number of samples that can be considered as a product set in an

352 Advances in Food Science and Nutrition
experiment. Free-choice profi ling, fl ash profi le, free sorting and projective mapping request that all products should be evaluated by the assessors simultaneously due to the fact that comparisons between them are made. Therefore, in order to avoid fatigue and adaptation, the number of samples to be evaluated in a single ses-sion is limited, compared to other methodologies such as intensity scales, CATA questions or polarized sensory positioning. For this reason, it can be diffi cult to apply them when dealing with shelf life testing or the evaluation of products that require careful tem-perature control or that have intense and persistent sensory charac-teristics. In particular, polarized sensory positioning is appropriate to compare products over time with fi xed reference products or when dealing with evaluations performed on different sessions. However, the criteria for selection of stable and easily available ref-erence products should be carefully taken into account.
10.3 Conclusions and Recommendations
All the methodologies described in the present chapter consist of valid, reliable and quick alternatives for gathering informa-tion about the sensory characteristics of food products. They all have been reported to provide similar information to Descriptive Analysis performed with a trained assessor panel. However, it is important to highlight that the information provided by Descriptive Analysis is always more accurate due to the fact that assessors are extensively trained in the identifi cation and quantifi cation of sen-sory attributes. For this reason Descriptive Analysis seems more appropriate when the objective of the sensory characterization is to identify small differences between products or in the intensity of specifi c sensory attributes, as it happens in many cases during the optimization step of new product development.
However, when quick non-detailed information about the sensory characteristics of food products is needed, novel meth-odologies seem a very good alternative. They can be a valuable alternative to gather information about the sensory characteristics of food products for food companies that do not have the time or the resources to train a panel (which is common in developing countries such as Uruguay) for evaluating a specifi c product. In these cases the cost and time involved in the selection and train-ing of the assessors may be higher than those needed to perform

New Trends in Sensory Characterization 353
a consumer study with 50–150 participants. Novel methodologies can also be interesting when conducting preliminary studies on the sensory characteristics of food products or when performing a screening for the selection of products or conditions for the design of a larger experiment.
Moreover, sensory characterization with consumers can only be considered complementary to Descriptive Analysis with trained assessor panels. This information can be extremely useful for uncovering consumer perception of food products, which can be valuable during new food product development or when designing marketing or communication campaigns. In this case an advantage of holistic methodologies, free-choice profi ling and fl ash profi le is that they enable the identifi cation of consumers’ vocabulary to describe the sensory characteristics of the products, while CATA questions and intensity scales should rely on previous studies to identify consumers’ relevant terms.
The selection of a novel methodology for a particular application strongly depends on the type of assessors to be considered, practi-cal issues and the specifi c objectives of the studies. However, when working with consumers the recommended approach would gen-erally be to apply simple methodologies such as intensity scales, CATA questions, open-ended questions or pivot profi le. Although verbal methodologies (such as CATA or open-ended questions, and intensity scales) have been reported to provide similar informa-tion than intensity scales, the former methodologies would be pre-ferred due to their simplicity and ease of use, and the fact that they are more natural for consumers. On the other hand, when there is a trained panel available and quick information about the sen-sory characteristics of food products is needed, the recommended approach would be to apply fl ash profi le, sorting, projective map-ping or polarized sensory positioning due to their higher complex-ity. Holistic methods based on global similarity, such as sorting and projective mapping seem more appropriate when summarized sensory information is needed. Polarized sensory positioning or pivot profi le seem a good option when there is strong interest in the comparison of new products with known ones, which can be considered reference products, or when the sensory characteristics of food products are to be compared over time.
Finally, it is important to take into account that most of the novel methodologies for sensory characterization have been used for a relatively short period of time and have been applied in a much

354 Advances in Food Science and Nutrition
shorter number of applications than the traditional Descriptive Analysis. For this reason, further research on the applicability, reli-ability and reproducibility of new approaches for sensory char-acterization is strongly needed, particularly when working with complex products.
References
1. Lawless, H.T., and Heymann, H., Sensory Evaluation of Food: Principles and Practices, New York, Springer, 2010.
2. Meilgaard, M., Civille, G.V., and. Carr, B.T., Sensory Evaluation Techniques, Boca Raton, Florida, CRC Press, 1999.
3. Moskowitz, H.R., Product optimization: Approaches and appli-cations, in: MacFie, H.J.H., and D.M.H. Thomson, D.M.H., eds., Measurement of Food Preferences, London, Blackie Academic & Professional, pp. 97–136, 1994.
4. Costell, E., Food Quality and Preference, Vol. 13, p. 341, 2002. 5. Cairncross, S.E., and Sjöstrom, L.B., Food Technology, Vol. 4, p. 308–311,
1950. 6. Caul, J.F., Advances in Food Research, Vol. 7, p. 1, 1957. 7. Brandt, M.A., Skinner, E.Z., and Coleman, J.A., Journal of Food Science,
Vol. 28, p. 404, 1963. 8. Civille, G.V., and Liska, I.H., Journal of Texture Studies, Vol. 6, p. 19,
1975. 9. Stone, H., Sidel, J.L., Oliver, S., Woolsey, A., and Singleton, R.C., Food
Technology, Vol. 28, p. 24, 1974 10. Stone, H., and Sidel, J.L., Sensory Evaluation Practices, Third Edition.
Orlando, FL: Academic Press, 2004. 11. Muñoz, A.M., and Civille, G.V., The spectrum Descriptive Analysis
method, in: Hootman, C., (ed.), Manual on Descriptive Analysis Testing for Sensory Evaluation, West Conshohocken, PA, ASTM Manual Series MNL 13, 1992.
12. Civille, G.V., and Lyon, B., ASTM Lexicon Vocabulary for Descriptive Analysis. Philadelphia, American Society for Testing and Materials, 1996.
13. Rainey, B., Journal of Sensory Studies, Vol. 1, p. 149, 1986. 14. Dairou, V., and Sieffermann, J.M., Journal of Food Science, Vol. 67, p. 826,
2002. 15. Labbe, D., Rytz, A., and Hugi, A., Food Quality and Preference, Vol. 15,
p. 341, 2004. 16. Bi, J., Journal of Sensory Studies, Vol. 18, p. 61, 2003. 17. Mandel, J., Chemometrics and Intelligent Laboratory Systems, Vol. 11,
p. 109, 1991.

New Trends in Sensory Characterization 355
18. Brockhoff, P., Food Quality and Preference, Vol. 9, p. 87, 1998. 19. Latreille, J., Mauger, E., Ambroisine, L., Tenenahaus, M., VIncent,
M., Navarro, S., and Guinot, C., Food Quality and Preference, Vol. 17, p. 369, 2006.
20. Dahl, T., Tomic, O., Wold, J.P., and Naes, T., Food Quality and Preference, Vol. 19, p. 103, 2008.
21. Derks, E.P.P.A., Food Quality and Preference, Vol. 21, p. 324, 2010. 22. Wolters, C.J., and Allchurch, E.M., Food Quality and Preference, Vol. 5,
p. 203, 1994. 23. Faye, P., Brémaud, D., Teillet, E., Courcoux, P., Giboreau, A., and
Nicod, H., Food Quality and Preference, Vol. 17, p. 604, 2006. 24. van Trijp, H.C.M., Punter, P.H., Mickartz, F., and Kruithof, L., Food
Quality and Preference, Vol. 18, p. 729, 2007. 25. ten Kleij, F., and Musters, P.A.D., Food Quality and Preference, Vol. 14,
p. 43, 2003. 26. Risvik, E., McEwan, J.A., and Rodbotten, M., Food Quality and
Preference, Vol. 8, p. 63, 1997. 27. Husson, F., Le Dien, S., and Pagès, J., Food Quality and Preference,
Vol. 12, p. 291, 2001. 28. Worch, T., Lê, S., and Punter, P., Food Quality and Preference, Vol. 21,
p. 309, 2010. 29. Cardello, A.V., Maller, O., Kapsalis, J.G., Segars, R.A., Sawyer, F.M.,
Murphy, C., and Moskowitz, H., Journal of Food Science, Vol. 47, p. 1186, 1992.
30. Sawyer, F.M., Cardello, A.V., and Prell, P.A., Journal of Sensory Studies, Vol. 53, p. 12, 1988.
31. Roberts, A.K., and Vickers, Z.M., Journal of Sensory Studies, Vol. 9, p. 1, 1994.
32. Moskowitz, H.R., Journal of Sensory Studies, Vol. 11, p. 19, 1996. 33. Hough, G., Journal of Sensory Studies, Vol. 13, p. 285, 1998. 34. Ares, G., Bruzzone, F., and Giménez, A., Journal of Sensory Studies,
Vol. 26, p. 363, 2011. 35. Arnold, G., and Williams, A.A., The use of generalized procrustes
technique in sensory analysis, in: Piggott, J.R., ed., Statistical Procedures in Food Research, Elsevier Applied Science, London, UK, pp. 233–254, 1986.
36. Jack, F.R., and Piggott, J.R., Food Quality and Preference, Vol. 3, p.129, 1991.
37. Williams, A.A., and Arnold, G.M., Journal of the Science of Food and Agriculture, Vol. 36, p. 204, 1985.
38. Williams, A.A., and Langron, S.P., Journal of the Science of Food and Agriculture, Vol. 35, p. 558, 1994.
39. Gains, N., and Thomson, D.M.H., Food Quality and Preference, Vol. 2, p. 39 1990.

356 Advances in Food Science and Nutrition
40. McEwan, J.A., Colwill, J.S., and Thomson, D.M.H., Journal of Sensory Studies, Vol. 3, p. 271, 1989.
41. Kelly, G.A., The Psychology of Personal Constructs, New York, NY, Norton, 1955.
42. Gains, N., The repertory grid approach, in: MacFie, H.J.H., and Thomson, D.M.H., eds., Measurement of Food Preferences. Blackie Academic and Professional, Glasgow, pp. 51–76, 1994.
43. Gower, J.C., Psychometrika, Vol. 40, p. 33, 1975. 44. Gower, J.C., and Dijksterhuis, G.B., Procrustes Problems. New York,
Oxford University Press, 2004. 45. Piggott, J.R., and Sharman, K., Methods to aid interpretation of mul-
tidimensional data, in: Piggott, J.R., ed., Statistical Procedures in Food Research, London, Elsevier Applied Science, pp. 181–232, 1986.
46. Guy, C., Piggott, J.R., and Marie, S., Food Quality and Preference, Vol. 1, p. 69, 1989.
47. Piggot, J.R., Paterson, A., Fleming, A.M., and M.R. Sheen, M.R., Food Quality and Preference, Vol. 3, p.135, 1991.
48. Heymann, H., Journal of Sensory Studies, Vol. 9, p. 445, 1993. 49. Parolari, G., Virgili, R., and Schivazappa, C., Meat Science, Vol. 38,
p. 117, 1994. 50. Guàrdia, M.D., Aguiar, A.P.S., Claret, A., Arnau, J., and Guerrero, L.,
Food Quality and Preference, Vol. 21, p. 148, 2010. 51. Delahunty, C.M., McCord, A., O’Neil, E.E., and Morrissey, P.A., Food
Quality and Preference, Vol. 8, p. 381, 1997. 52. Lachnit, M., Busch-Stockfi sch, M., Kunert, J., and Krahl, T., Food
Quality and Preference, Vol. 14, p. 257, 2003. 53. Kirkmeyer, S.V., and Tepper, B., Chemical Senses, Vol. 28, p. 527, 2003. 54. Narain, C., Paterson, A., and Reid, E., Food Quality and Preference,
Vol. 15, p. 31, 2004. 55. Aparicio, J.P., Medina, M.A.T., and Rosales, V.L., Analytica Chimica
Acta, Vol. 595, p. 238, 2007. 56. Elmore, J., and Heymann, H., Food Quality and Preference, Vol. 10,
p. 219, 1999. 57. Murray, J.M., Delahunty, C.M., and Baxter, I.A., Food Research
International, Vol. 34, p. 461, 2001. 58. Deliza, R., MacFie, H., and Hedderley, D., Journal of Sensory Studies,
Vol. 20, p. 17, 2005. 59. Sieffermann, J.M., Le profi l Flash. Un outil rapide et innovant
d’évaluation sensorielle descriptive, AGORAL 2000 – XIIèmes renco-tres, in: Tec and Doc Paris, eds, L’innovation: de l’idée au success, Paris, Lavoisier, pp. 335–340, 2000.
60. Moussaoui, K.A., and Varela, P., Food Quality and Preference, Vol. 21, p. 1088, 2010.

New Trends in Sensory Characterization 357
61. Delarue, J., and Sieffermann, J.M., Food Quality and Preference, Vol. 15, p. 383, 2004.
62. Dairou, V., and Sieffermann, J.M., Journal of Food Science, Vol. 67, p. 826, 2002.
63. Veinand, B., Godefroy, C., Adam, C., and Delarue, J., Food Quality and Preference, Vol. 22, p. 474, 2011.
64. Albert, A., Varela, P., Salvador, A., Hough, G., and Fiszman, S., Food Quality and Preference, Vol. 22, p. 463, 2011.
65. Rason, J., Léger, L., Dufour, E., and Lebecque, A., European Food Research and Technology, Vol. 222, p. 580, 2006.
66. Tarea, S., Cuvelier, G., and Sieffermann, J.M., Journal of Food Quality, Vol. 30, p. 1121, 2007
67. Blancher, G., Chollet, S., Kesteloot, R., Nguyen, D., Cuvelier, G., and Sieffermann, J.M., Food Quality and Preference, Vol. 18, p. 560, 2007.
68. Lassoued, N., Delarue, J., Launay, B., and Michon, C., Journal of Cereal Science, Vol. 48, p. 133, 2008.
69. Perrin, L., Symoneaux, R., Maître, I., Asselin, C., Jourjon, F., and Pagès, J., Food Quality and Preference, Vol. 19, p. 1, 2008.
70. Jaros, D., Thamke, I., Raddatz, H., and Rohm, H., European Food Research and Technology, Vol. 229, p. 51, 2009.
71. Driesener, C., and Romaniuk, J., International Journal of Market Research, Vol. 48, p. 681, 2006.
72. Adams, J., Williams, A., Lancaster, B., and Foley, M., Advantages and uses of check-all-that-apply response compared to traditional scaling of attributes for salty snacks, in: 7th Pangborn Sensory Science Symposium, August 16th, 2007, Minneapolis, USA, 2007.
73. Ares, G., Deliza, R., Giménez, A., Barreiro, C., and Gámbaro, A., Food Quality and Preference, Vol. 21, p. 417, 2010.
74. Dooley, L., Lee, Y.S., and Meullenet, J.F., Food Quality and Preference, Vol. 21, p. 394, 2010.
75. Parente, M.E., Manzoni, A.V., and Ares, G., Journal of Sensory Studies, Vol. 26, p. 158, 2011.
76. Ares, G., Varela, P., Rado, G., and Giménez, A., International Journal of Food Science and Technology, Vol. 46, p. 1600, 2011.
77. Lado, J., Vicente, E., Manzioni, A., and Ares, G., Journal of the Science of Food and Agriculture, Vol. 90, p. 2268, 2010.
78. Ares, G., Barreiro, C., Deliza, R., Giménez, A., and Gámbaro, A., Journal of Sensory Studies, Vol. 25, p. 67, 2010.
79. Plaehn, D., Food Quality and Preference, Vol. 24, p. 141, 2012. 80. Bruzzone, F., Ares, G., and Giménez, A., Journal of Texture Studies,
Vol. 43, p. 214, 2012 81. Ares, G., Giménez, A., Barreiro, C., and Gámbaro, A., Food Quality and
Preference, Vol. 21, p. 286, 2010.

358 Advances in Food Science and Nutrition
82. Symoneaux, R., Galmarini, M.V., Mehinagic, E., Food Quality and Preference, Vol. 24, p. 59, 2012.
83. Rostaing, H., Ziegelbaum, H., Boutin, E., and Rogeaux, M., Analyse de commentaires libres par la techniques des réseaux de segments, in: Fourth International Conference on the Statistical Analysis of Textual Data, JADT’98, 1998.
84. Modell, S., Management Accounting Research, Vol. 16, p. 231, 2005. 85. Donoghue, S., Journal of Family Ecology and Consumer Sciences, Vol. 28,
p.47, 2000. 86. Steinmann, R.B., International Bulletin of Business Administration,
Vol. 5, p. 37, 2009. 87. Coxon, A.P.M., Sorting Data: Collection and Analysis. Thousand Oaks,
CA: SAGE Publications, Inc., 1999. 88. Merriam-Webster’s Dictionary (2004), Springfi eld, MA: Merriam-
Webster Inc., 2004. 89. Black, M., Dialogue, Vol. 2, p. 1, 1963. 90. Schiffman, S.S., Reynolds, M.L., and Young, F.W., Introduction to
Multidimensional Scaling, New York: Academic Press, 1981. 91. Lawless, H.T., Sheng, N., and Knoops, S.S.C.P., Food Quality and
Preference, Vol. 6, p. 91, 1995. 92. Popper, R., and Heymann, H., Analyzing differences among products
and panelists by multidimensional scaling, in: Naes, T., and Risvik, E., eds., Multivariate Analysis of Data in Sensory Science, Amsterdam: Elsevier, pp. 159–184, 1996.
93. Cartier, R., Rytz, A., Lecomte, A., Poblete, F., Krystlik, J., Belin, E., and Martin, N., Food Quality and Preference, Vol. 17, p. 562, 2006.
94. Lelièvre, M., Chollet, S., Abdi, H., and Valentin, D., Food Quality and Preference, Vol. 19, p. 697, 2008
95. Abdi, H., Valentin, D., Chrea, C., and Chollet, S., Food Quality and Preference, Vol. 18, p. 627, 2007.
96. Cadoret, M., Lê, S., and Pagès, J., Food Quality and Preference, Vol. 20, p. 410, 2009.
97. Falahee, M., and MacRae, A., Food Quality and Preference, Vol. 8, p. 389, 1997.
98. Chollet, S., and Valentin, D., Journal of Sensory Studies, Vol. 16, p. 601, 2001.
99. Gawel, R., Iland, P.G., and Francis, I.L., Food Quality of Preference, Vol. 12, p. 83, 2001.
100. Saint Eve, A., Paci-Kora, E., and Martin, N., Food Quality and Preference, Vol. 15, p. 655, 2004.
101. Santosa, M., Abdi, H., and Guinard, J.X., Food Quality and Preference, Vol. 21, p. 881, 2010.
102. Bijmolt, T., and Wedel, M., International Journal of Research in Marketing, Vol. 12, p. 363, 1995.

New Trends in Sensory Characterization 359
103. Risvik, E., McEwan, J.A., Colwill, J.S., Rogers, R., and Lyon, D.H., Food Quality and Preference, Vol. 5, p. 263, 1994.
104. Pagès, J., Food Quality and Preference, Vol. 16, p. 642, 2005.105. King, M.C., Cliff, M.A., and Hall, J.W., Journal of Sensory Studies,
Vol. 13, p. 347, 1998.106. Nestrud, M.A., and Lawless, H.T., Attention, Perception, &
Psychophysics, Vol. 73, p. 1266, 2011.107. Schifferstein, H.N.J., Food Quality and Preference, Vol. 7, p. 167, 1996108. Teillet, E., Schlich, P., Urbano, C., Cordelle, S., and Guichard, E., Food
Quality and Preference, Vol. 21, p. 967, 2010109. Busing, F.M.T.A., Groenen, P.J.F., and Heiser, W.J., Psychometrika,
Vol. 70, p. 49, 2005.110. Thuillier, B., Rôle du CO2 dans l’Appréciation Organoleptique des
Champagnes - Expérimentation et Apports Méthodologiques. Thèse de l’URCA. http://www.abt-sensory-analysis.com/docs/methode_profi l_pivot.pdf, Reims, France, 2007.