advances in environmental biology - aensiweb.com 5 2014/1307-1318.pdfadvances in environmental...
TRANSCRIPT
Advances in Environmental Biology, 8(11) Special 2014, Pages: 1307-1318
AENSI Journals
Advances in Environmental Biology ISSN-1995-0756 EISSN-1998-1066
Journal home page: http://www.aensiweb.com/AEB/
Corresponding Author: Sina Hajati Ziabari, Department of Civil Engineering, Mehrastan University, Astaneh Ashrafieh,
Iran
E-mail: [email protected]
The Application of Statistical Model to Predict Alluvium Permeability of Manjil City Based on Soil Grading Features Sina Hajati Ziabari
Department of Civil Engineering, Mehrastan University, Astaneh Ashrafieh, Iran
A R T I C L E I N F O A B S T R A C T
Article history:
Received 15 April 2014 Received in revised form 22 May
2014
Accepted 25 May 2014 Available online 15 June 2014
Keywords: Permeability, Statistical model, Lab,
manjil.
Based on the increasing growth of urban civil projects in various regions of Manjol city
and costly civil projects and geotechnical tests, new and empirical relations can be a suitable and economical solution in small urban projects. One of the correlations is
prediction of alluvium permeability of Rasht town based on soil grading features. By
statistical models and existing lab data and databases by SPSS software, we found some new results in prediction of permeability of Rasht city alluvium by soil grading test and
these relations are presented in the form of some charts.
© 2014 AENSI Publisher All rights reserved.
To Cite This Article: Sina Hajati Ziabari, The Application of Statistical Model to Predict Alluvium Permeability of Manjil City Based on
Soil Grading Features. Adv. Environ. Biol., 8(11), 1307-1318, 2014
INTRODUCTION
Manjil City has been located between 36 degrees and 32 minutes to 37 degrees and 7 minutes from the
equator and at longitude 49 degrees and 11 minutes to 50 degrees and 5 minutes east from the meridian. Manjil
has been located at an altitude of 396 meters above sea level and at the last eastern part of Alborz Mountains on
the right beach of Qezel Ozan and at 500 meters to south of Manjil Dam and near to Qezel Ozan and Shahrud
confluence point, at 80 km to Rasht and 100 km to Qazvin in the great Qazvin-Rasht road. It is among foothill
towns of Gilan and is located at the slopes of Alborz and Talesh Mountains along Sefid Rood River and olive
gardens. Its climate is Mediterranean and it has moderate and slightly humid winters and hot and dry summers.
Fig. 1: Location in Iran (Point A).
In underground water hydrology, the knowledge of earth hydraulic conductivity (K) or permeability
coefficient is the pre-requirement of recognizing flow rotation processes and water flow transfer in soil. Also,
permeability coefficient is an important parameter in water pumping to construct structure in underground and
analysis of stability of earth dams and trenches supporting structures (as bearing wall and etc.). In addition, it is
an important parameter regarding some geotechnical problems. There are various techniques to estimate this
value in alluvial areas including field methods, lab tests and empirical relations. Among these methods, correct
estimation of hydraulic conductivity by field methods due to the lack of knowledge to aquifer geometry and its
hydraulic borders has some limitations. In the past years, various research’s studied this mutual relation
(between permeability and grading) and some empirical equations are introduced to estimate permeability
coefficient by distributing soil particles but each of the relations are studied in specific geology environments
(type of sediment, particles size and etc.). Some researchers proved that these equations are true for geology
conditions. Thus, to use empirical relations in another environment as Rasht alluvium, it is necessary to

1308 Sina Hajati Ziabari 2014
Advances in Environmental Biology, 8(11) Special 2014, Pages: 1307-1318
introduce the equation with highest correlation with real values. Based on the significance of the study, the
present study compared the estimated hydraulic conductivity value of various empirical relations developed
based on soil grading distribution with real values of lab tests (in Rasht). To do this, at first data base of grading
tests and tests of soil hydraulic conductivity coefficient of civil projects in Rasht city were determined. Then, the
estimated values of empirical relations were compared with the real values of lab tests to determine the relations
with high correlation with the measured values by statistical tests. A significant statistical relationship between
parameters of soil particles size and hydraulic conductivity coefficient was investigated by multi-variate
regression method and finally an empirical relation between grading parameters and hydraulic conductivity
coefficient is proposed for Rasht alluvium. The importance of this issue is clear when time-consuming and
costly methods as pumping, achieve integer K value in a part of underground water. The doubt with this method
(grading) is a subject that is considered in the studies of Mishra et al. (1989) ،Alyamani & Sen (1993)و Sperry &
Peirce (1995)( Vienken, 2010).
One of the most important collected data is dedicated to hydraulic conductivity parameter (falling head in
lab) and it is attempted to clarify this issue, the hydraulic conductivity determination method is explained in
accordance to ASTM D2434 standard.
Generally, hydraulic conductivity is the amount of water passing under hydraulic slop of a unit of soil area
in time. In the tests of water movement in soil, Darcy found that the water amount passing a soil sample in time
unit has direct relations with the difference of potential between entrance and exit of soil column (gravity and
pressure potentials) and has inverse relation with soil column length or with flow path length in soil. Darcy
relation is as:
L
hKAQ
Equation (1)
Where, Q is the volume of water passing soil column in time unit
K= Hydraulic conductivity
h
=Hydraulic potential difference
L= Water path length in soil
The calculation of grading parameters:
To calculate consistency and curvature coefficients, we should have the diameter of soil particles. The
particles diameter can be obtained by having soil percent passing from each sieve. In other words, if 40%
sample remains on sieve No. 20#, 60% of them have diameter less than the diameter of sieve No. 20#.
Consistency coefficient Cu is obtained of the following relation Eq. 2:
Cu=D60 / D10 Eq. (2)
Curvature coefficient Cc is as:
𝐶𝑐 =(𝐷30)2
𝐷60×𝐷10 Eq. (3)
It is attempted to disperse the locations in Rasht city and avoid registering the data repeated in a definite
sediment layer. In some boreholes being in a sediment layer, various grading and permeability tests are observed
but as all the tests were done in similar samples (it has similar values), only one of them was registered in data
basis of this study by which the test results are dispersed in alluviums of Rasht city. It can be said that after the
data collection, data basis was formed and the results are presented in Table 1.
Table 1: The number of collected and registered data in data basis.
Number
of
boreholes
The number of permeability test The number of
grading test In-situ Lab
Constant
head
Falling head Constant
head
Falling head
Initial collected data 200 82 64 36 54 1600
Classification of variables and descriptive statistics:
When quantitative data is collected, at first they are organized and summarized as significantly. Descriptive
statistics is used for this aim. The first step in data organizing is sorting them based on logic and then extracting
the central measures and dispersion and calculation of correlation between information and using advanced
analyses as regression and prediction.
Formation of frequency distribution and drawing chart:
Frequency distribution is organizing data or observations as levels with frequency of each level. To form a
frequency distribution table, the changes, number of levels and volume are calculated by the formulas and then
distribution table in two columns is written (levels and levels frequency column). Then, other indices as
compressive frequency, percent compressive frequency are calculated. Frequency distribution table is an

1309 Sina Hajati Ziabari 2014
Advances in Environmental Biology, 8(11) Special 2014, Pages: 1307-1318
economical and easy method to show great amount of irregular data but some data are lost in classification due
to classification error and it is reflected in calculation of statistical indices but it is little and there is no problem.
One of the weaknesses of data display as frequency table is the lack of rapid perception of table
information. Charters are good tools to display information as visual. There are various types of charts as
histogram, column chart, compressive multi-gonal charter, circle chart, time series charts and in this report, in
figures 1 frequency histogram of permeability test and in figures 2-10 frequency histogram d10, d30, d50, d60,
4.75mm, 2mm, 0.05mm, 0.075mm, 0.002mm, respectively are shown.
Fig. 1: Frequency histogram of hydraulic conductivity logarithm Log K with normal curve.
Fig. 2: Frequency histogram of particle effective size (d10) obtained of grading tests with normal curve.
Fig. 3: Frequency histogram of particle effective size (d30) obtained of grading tests with normal curve.

1310 Sina Hajati Ziabari 2014
Advances in Environmental Biology, 8(11) Special 2014, Pages: 1307-1318
Fig. 4: Frequency histogram of particle effective size (d50) obtained of grading tests with normal curve.
Fig. 5: Frequency histogram of particle effective size (d60) obtained of grading tests with normal curve.
Fig. 6: Frequency histogram of the particles pass through a sieve 4.75mm obtained of grading tests with normal
curve.

1311 Sina Hajati Ziabari 2014
Advances in Environmental Biology, 8(11) Special 2014, Pages: 1307-1318
Fig. 7: Frequency histogram of the particles pass through a sieve 2mm obtained of grading tests with normal
curve.
Fig. 8: Frequency histogram of the particles pass through a sieve 0.25mm obtained of grading tests with normal
curve.
Fig. 9: Frequency histogram of the particles pass through a sieve 0.075mm obtained of grading tests with
normal curve.

1312 Sina Hajati Ziabari 2014
Advances in Environmental Biology, 8(11) Special 2014, Pages: 1307-1318
Fig. 10: Frequency histogram of the particles pass through a sieve 0.002mm obtained of grading tests with
normal curve.
A histogram shows the distribution of data values, it says us how is the probability of each of the values.
Based on histogram, we understand whether the samples are around a central value or not. Is small and big
values probability equal to each other or are there dummy data or not. These items are not only useful to
perceive the collected data but also they are important to select a suitable technique of data analysis. As shown
in figure 1, hydraulic conductivity logarithm distribution Log K is in -5.5 to -6.5 m/s is maximum. In addition,
Log K is symmetrical but small number value is more than big values. In figures 2-5, particles size distribution
d10, d30, d50 and d60 achieve the highest in the first distance. In addition, it can be said particles size
distribution is not symmetrical and they are extended to the great particles. This is because the biggest possible
value of particles is limited to zero and small numbers are limited to total particles value.
In histogram, the particles passed from various sieves (figures 5-10) are more symmetrical compared to the
particles size distribution but in these charts, most of the frequencies are gathered in small values and except
figure 10 (percent being passed of 0.002mm) in the rest of histograms, their tail is extended to great particle
values.
The main subject of this chapter is that a new relation is made by regression model between independent
variables (grading parameters) with dependent variable (hydraulic conductivity value) for Tabriz alluvium. In
the previous chapters, regression analysis is used to investigate the relationship between dependent and
independent variable. To form a new relation of Tabriz alluvium, to predict dependent variable, more than one
independent variables are required (grading parameters). In other words, to estimate hydraulic conductivity
value by grading test, it is required to consider various effective factors as particles dimensions, the percent
passed of various sieves and consistency and curvature coefficients achieved by sieve grading test. As it was
said, we explain how a linear regression model is formed to estimate hydraulic conductivity to have more than
one independent variables. A technique being used in this regard is multiple linear regression analysis. In this
section, hydraulic conductivity value is predicted based on the parameters that are obtained by sieve grading
tests. Table 2 indicates a list of independent variables being obtained of grading tests. These data are obtained of
borehole and the depth and permeability test is also performed.
The applied model:
A linear regression equation can select coefficients in which the sum of squares of the difference between
predicted values and observed values of dependent variables is the lowest and in other coefficients, the residual
square value is greater.
The required assumptions for multiple regression:
When there is an independent variable, for linear test of population regression, the data should be a random
sample of population:
The observations should be independent
The relationship between two variables is linear
For each of independent values, normal distribution of dependent variable values exists.
These distributions have fixed variance

1313 Sina Hajati Ziabari 2014
Advances in Environmental Biology, 8(11) Special 2014, Pages: 1307-1318
Only by brief changes, these assumptions are considered for multiple regression. The relationship between
dependent and independent variables is linear. For each of the combinations of independent variables, dependent
variable distribution is normal and its variance is fixed.
The investigation of independent variables:
Figure 11 shows a matrix of scatterplot charts between independent and dependent variables. Namely, the
first matrix line is important as the relationships between permeability coefficients with independent variables
(grading parameters) are shown. Scatter plot chart matrix with its variables has rows and columns. 10 rows and
10 columns are observed in this figure. Each block of matrix has scatter plot chart and a pair of variables.
Fig. 11: Scatter plot matrix chart.
An equation with the maximum F is the best line or equation between measured Log K and grading
parameters. As shown in the table, the highest F coefficient between D10, D50, D60, d0.25mm, d2mm and
parameter Log (K) is dedicated to logarithm relation. The parameters d4.75mm, d0.075mm, d0.002mm have
linear relation with Log(k) parameter. Also, only one independent variable has inverse relation with Log (k)
parameter and it is D30 parameter. To clarify this issue, formulas between independent variables and response
variable are presented in Table 4. These equations are shown by coefficients table as the output of SPSS
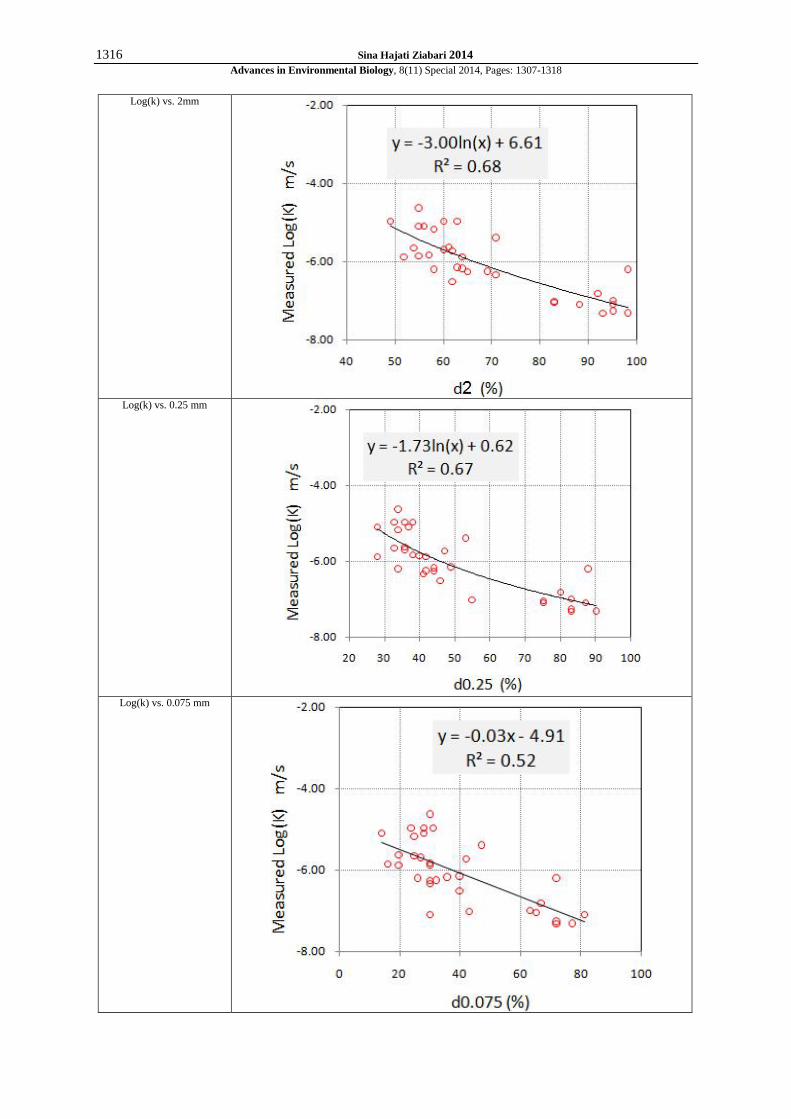
software. The scatterplot chart and regression line of each of independent parameters to parameter Log (k) are
shown in Table 5.

1314 Sina Hajati Ziabari 2014
Advances in Environmental Biology, 8(11) Special 2014, Pages: 1307-1318
Table 3: The results of Fisher number being obtained of fitting of k values measured and various grading parameters.
Parameters Fisher number being obtained of fitting of k values measured
(Liner) ( logarithmic) (Inverse) (Quadratic) (Cubic)
Log(k) vs. D10 3.611 5.141 2.543 2.347 1.801
Log(k) vs. D30 15.224 59.927 65.756 19.033 22.588
Log(k) vs. D50 60.273 89.102 41.374 46.898 32.241
Log(k) vs. D60 56.479 74.864 36.201 39.250 26.948
Log(k) vs. 4.75 mm 53.226 51.870 49.275 25.863 25.889
Log(k) vs. 2mm 63.909 66.468 65.859 32.832 33.108
Log(k) vs. 0.25 mm 57.477 62.561 59.045 31.516 20.954
Log(k) vs. 0.075 mm 33.252 29.976 20.478 16.097 10.455
Log(k) vs. 0.002 mm 11.981 5.798 3.762
Table 4: The relationship between various soil grading parameters and Log (k) with the obtained equations.
Variable Equation R2 F
Log(k) vs. D10 Log(k)= -1.333 + 0.353 • Log(D10) 0.14 5.14
Log(k) vs. D30 Log(k)= -5.517 + 1/-8.64e-6 • (D30) 0.7 65.7
Log(k) vs. D50 Log(k)= -2.732 + 0.41 • Log(D50) 0.74 89.1
Log(k) vs. D60 Log(k)= -3.413 + 0.364 • Log(D60) 0.7 74.86
Log(k) vs. 4.75 mm Log(k)= -2.328 - 0.048 • (%d4.75) 0.6 53.2
Log(k) vs. 2mm Log(k)= 6.606 - 3.002 • Log(%d2) 0.7 66
Log(k) vs. 0.25 mm Log(k)= 0.619 – 1.73 • Log(%d0.25) 0.7 62
Log(k) vs. 0.075 mm Log(k)= -0.29 - 4.914 • (%d0.075) 0.5 33
Log(k) vs. 0.002 mm Log(k)= -0.065 - 5.151 • (%d0.002) 0.3 11.98
Table 5: Scatter plot chart and regression between independent variables (grading parameters) and log(k).
Variable Figure
Log(k) vs. D10
Log(k) vs. D30

1315 Sina Hajati Ziabari 2014
Advances in Environmental Biology, 8(11) Special 2014, Pages: 1307-1318
Log(k) vs. D50
Log(k) vs. D60
Log(k) vs. 4.75 mm
1316 Sina Hajati Ziabari 2014
Advances in Environmental Biology, 8(11) Special 2014, Pages: 1307-1318
Log(k) vs. 2mm
Log(k) vs. 0.25 mm
Log(k) vs. 0.075 mm

1317 Sina Hajati Ziabari 2014
Advances in Environmental Biology, 8(11) Special 2014, Pages: 1307-1318
Log(k) vs. 0.002 mm
The analysis of residuals:
When the relationship between two variables is investigated, it is not clear required assumptions are true
about the regression analysis or not. It is not definite dependent variable distribution is normal or its variance is
constant for various values of independent variable. An important section of regression analysis is the
investigation of linearity, normality, variance constant and independent observations. When some models are
fitted for data, the residuals play important role. By investigation of residuals distribution and its relations with
other variables, we can determine the validity of regression assumptions. Generally, there is difference between
observed value, dependent variable and the value that is predicted by regression line. If the required assumptions
are true for regression analysis, the residuals have the following characteristics:
Their distribution should be normal and error mean zero
Their variance should be constant for all independent variables
When the residuals are charted to the predicted values, no model should be observed.
To analyze the residual (normality of error, error mean is zero and constant error variance) for D50 variable,
three charts are drawn shown in Figure 12 to 14 The results of the mentioned charts support normality of error,
mean error with zero and constant error variance. As observed in the figures, in all cases, error normality is
supported but variance constant is doubtful in 6 cases.
Fig. 12: Histogram of Regression Standardized Residual.

1318 Sina Hajati Ziabari 2014
Advances in Environmental Biology, 8(11) Special 2014, Pages: 1307-1318
Fig. 13: Normal P-P plot of Regression Standard Residual.
Fig. 14: Scatter plot Regression Standardized Predicted Value.
Conclusion:
Based on the statistical model, it can be said soil grading is one of the effective factors in determining
permeability in Rasht alluvium in prediction of permeability test. The benefits of using this correlation are
reduction of studies implementation. By exact investigation of this correlation, we can find about the
permeability of alluvium of Rasht city.
REFERENCES
[1] Chiasson¸ P., J. Lafleur¸ M. Soulié and K.T. Law¸ 1995. “Characterizing spatial variability of a clay by
geostatistics”; Canadian Geotechnical Journal, 32: 1-10.
[2] Fakher, A. and M. Khodaparast, 2004. “The repeatability in results of Mackintosh Probe test “; Proc. 2nd
Int. Conf. Geotechnical and Geophysical Site Characterization; Porto, pp: 325-330.
[3] Fakher, A., M. Khodaparast and C.J.F.P. Jones, 2006. “The use of Mackintosh Probe for site investigation
in soft soils “; Q.J.E.G. London, 39: 189-196.
[4] Huntley, S.L., 1990. "Use dynamic penterometer as a ground investigation and design tool in
Hertfordshire", field testing in engineering Geology, Geological Society engineering geology special
publication, 6: 145-149.
[5] Low, I.J. and P.F. Zaccheo¸ 1990. “Subsurface explorations and sampling”; Foundation Engineering
Handbook; Fang, Y.H. (eds), Chapman & Hall Publishers, pp: 12-14.