advances in environmental biology - aensiweb.net 2014/1020-1036.pdf · using gis and watergems...
TRANSCRIPT

Advances in Environmental Biology, 8(17) September 2014, Pages: 1020-1036
AENSI Journals
Advances in Environmental Biology ISSN-1995-0756 EISSN-1998-1066
Journal home page: http://www.aensiweb.com/AEB/
Corresponding Author: Ahmad Nohegar, Professor, Environment faculty, Tehran University, Tehran, Iran.
E-mail: [email protected]
Hydraulic Analysis and Management of Water Transmission Lines Using Gis and waterGems (Case Study: Complex of Minab's edge project) 1Ahmad Nohegar, 2Parviz Nejati, 3Fateme Riahi 1Professor, Environment faculty, Tehran University, Tehran, Iran. 2Master of Remote sensing and Geographical information system, Hormozgan University.Iran 3PHD student of watershed engineering, Natural resource faculty, Hormozgan University, Bandar Abas, Iran.
ARTICLE INFO ABSTRACT
Article history:
Received 19 September 2014 Received in revised form
19 November 2014
Accepted 13 December 2014 Available online 31 December 2014
Key words:
Geographical Information System,
GIS, Watergems, Databases, Combination
Proper utilization of sources and facilities requires strong and scientific management so
that proper decisions would be made according to accurate, reliable and up to date information. GIS is a system that records, stores, controls, combines, uses, analyzes and
shows the data that is reference in terms of location of the land. The word geography
shall not give this subjective image that the information system which is being discussed is limited to topographic data, map and cartography. GIS is also used for
banking services, postal services, demographic studies, and management of urban
installations including those in water and electricity (Mehr Andish, 1376). Firstly, the present research attempts to do hydraulic analysis of transmission lines of the region of
the project by using the Watergems software, and then use these analysis and their
association with the Arc GIS environment and also the local and descriptive information and statistics of the transmission lines, entrance and storage and
management of the data, the research tries to create a comprehensive database associated with transmission installations in the environment o GIS. And then these
data will be combined together in the environment of geographical information system
and it will be provided for the users.
© 2014 AENSI Publisher All rights reserved.
To Cite This Article: Ahmad Nohegar, Parviz Nejati, Fateme Riahi., Hydraulic Analysis and Management of Water Transmission Lines
Using Gis and waterGems (Case Study: Complex of Minab's edge project). Adv. Environ. Biol., 8(17), 1020-1036, 2014
INTRODUCTION
The constraint of the available water sources on one hand and the quick industrial growth and development
of urban and rural infrastructures without the required programming on the other one makes the necessity of
using a system and comprehensive thought in the field of management of sources and development of water
supply infrastructures more obvious and more important more and more each day. And also facing a huge
volume of data and information in these kind of local infrastructures and rise of the time as the most important
capital in the modern urban management, using the modern technologies in order to have access, collect,
process, model and finally decide in the shortest time, requires highest accuracy and least cost [8]. One of the
problems of both rural and urban water and sewage companies is the lack of updated maps of transmission lines
and distribution networks and subscribers and dispersion of descriptive information associated with these
installations. Thus, this matter requires a programming, which is in accordance with the GIS standard, to collect
essential information in order of necessary preference and the problems will be reduced to a significant extent
by modeling the lines and networks.
Research background:
The first example of a national GIS is the GIS of Canada which has been used from the late 1960 to this
day continuously. In the 1970th
and 1980th
, some significant developments were seen in the GIS technology, in a
way that the phrase geographical information system was used in association with a set of tools for analyzing
and showing the maps and combining the statistical and cartography methods and techniques and its wider
application, particularly for analyzing the effects and governmental policies. While the history of the GIS
technology reaches over forty years in Western countries including Canada and America, the GIS technology is
very young in most of the countries of the third world. The coordination between technology and its application
1021 Ahmad Nohegar et al, 2014
Advances in Environmental Biology, 8(17) September 2014, Pages: 1020-1036
and education is one of the properties of GIS in Western countries, while in the countries of the third world,
technology is brought before the education and learning skills associated with it [2].
In Iran, the first center that officially started using the geographical information system in country was the
cartography organization of the country that became responsible for the project of using this system according to
the passage of Islamic Consultative Assembly in the year 1369. This organization is currently trying to provide
1:25000 topographical maps of the aerial photographs with scale of 1:40000. And this is an opportunity for
turning these maps to digital structures and establishing national topographical database which will satisfy the
needs of the users in the field of GIS.
In this respect, the national assembly of the users established the geographical information systems in order
for making policies, programming and coordinating activities in the field of GIS, analyzing the needs and also
properly utilizing all of the human resources, technical and scientific capacities in order to create and use GIS
and by considering the duties of the cartography organization of the country about determining and creating the
national geographical information system in the January of 1993.
Implementation activities of the project of creating geographical information system in the Ministry of
Industries and Mines began April of 1992 and currently, this system is widely used in association with its
activities. Other institutions that are active in the field of this system are Municipality of Tehran, Ministry of
Housing and Urban Development, Ministry of Agriculture, International Institute of Seismology and Earthquake
Engineering, the forests and grasslands' organizations and the Department of Energy.
In the past three decades, several researchers have been active in the field of using the GIS in the water and
sewage industry. Jeffrey et al created the urban GIS comprehensively about the network of water distribution,
and they modeled the hydraulic network in it in 1995 in the city Glandule. This database was mostly designed
for evaluating the hydraulic changes within the system and in order to maintain and manage it. In the field of the
connection between hydraulic models and GIS, several researches have been done throughout the world. The
researches that we can refer to are the works of Strafaci, [16], Foerster et al, Pickuns et al, [12], Ramirez, [13],
Schaeffer et al, [15] and Rangzan and Mehrabi, [14].
Several studies about the role of geographical information systems in the management of transmission lines
and water networks have also been done in Iran. Most of these researches were in the field of water unaccounted
water [5], events of the network [6], hydraulic modeling and network, application of GIS in the network of
urban water distribution and management of the information of the subscribers [8], intelligent routing of the
transmission lines of water by using GIS and genetic algorithms [9], creating a database of the reference land
and geometrical network for managing the water distribution network of the urban region of Kianpars and Kian
Abad [14], application of combining GIS and hydraulic analysis models in the studies of unaccounted water of
the distribution networks of urban water and designing the database of the reference land [10] and a few
researches were done in the field of implementation of geographical information in transimission lines and
distribution networks of urban and rural water, which is the infrastructure and backbone of most of these
analysis and other applicable reports and analysis with an approach to decision making in the management of
these lines and networks in the future.
Objectives of the Project:
Creating a comprehensive database of the transmission lines and water distribution networks in the region
of the project.
Creating a local and descriptive connection between the collected data in order to utilizing the system.
Creating a proper mode for updating the information and statistics in the geographical information system.
Utilizing the geographical information system which has been provided in the rural Water and Sewage
Company of Hormozgan.
Location of the Region of the Project:
The range includes 39 villages and it has been placed in the city Minab, the county Bandazrak, the rural
districts of Bandazrak and Kargan. The location of the project starts from the villages of Islam Abad in north
and it is limited to Zahhouki and Sarmast and Dalvar villages in east, and Sarshif, Kohneh Shahr and Kargan in
south, and Bandarzak and Kouleq Kashi in west.
Preparation of Local Data:
The first step in creating the reference database is to prepare the basic map of the villages of the region of
the project. In order to create a base, the topographic map of the region shall turn to a useable file in GIS. For
this purpose, first the 1:25000 map of the region was classified in the environment of the AutoCAD software in
the form of different layers including houses, gardens, waterways, canals, bridges and etc. Then this map was
entered in the environment of ArcMap10 in the form of effects of dot, line and polygon. Since these effects do
not have coordinate system, they shall be referenced in the cross coordinate system of the location. The
environment of Arc Toolbox and the extension of Data Management Tools were used for this matter. After the
effects became the location references, all of the available layers in the AutoCAD software appeared in the form

1022 Ahmad Nohegar et al, 2014
Advances in Environmental Biology, 8(17) September 2014, Pages: 1020-1036
of linear, polygon and dot effects in the environment of ArxMaps. Thus, we used the option Select by Attribute
in order to separate the effects to various layer such as well, river, residential house, road and so on, and we
separated various effects which were available in the map from one another and we add them to the map.
Then we choose the proper symbol for each of the effect by using the notation method. These symbols shall
be the same in all of the prepared maps. We save the chosen symbols in a new style. Therefore, a background
will be created for the maps.
The hydraulic analysis of the transmission lines and installation of water are done in the software
WaterGEMS software. In order to transfer these analysis to the environment of the ArcGIS software, first a
readable output is prepared from the available layers in the hydraulic analysis software WaterGEMS for the
ArcGIS software. These outputs are in the form of vectors, and each of the vector effects has complete
information about the hydraulic of the layers. For example, about the node layer, this information includes the
number of the nod, flow, pressure and height of it. The output layers of the hydraulic software do not have
coordinate system just line the layers of AutoCAD. That is why these layers also become reference with the help
of the given method, so that all of the effects would be in their own location. We separate the available and
suggested installations of water from one another with the help of feature table and we save them in a database.
At the time of the preparation of local data for entering the environment of GIS, all of the effects shall be coded
according to the available coding system, so that we are able to create a connection between local and
descriptive data according to the communicative relations.
Preparation of Descriptive Data:
The descriptive data includes the information that has been obtained from the "Abfar" company of
Hormozgan provenance and also from cartography about the available installations of water in the region of the
project, which have been collected in the forms of Excel with a specific method. Then by using the
communicative relations, a connection was created between them and descriptive data by using the codes that
had been given to the local data before. It is necessary to mention that by creating the connection between local
and descriptive data, since this connection is temporary, a new data shall be provided in the reference database
from the created effect, so that this connection would become a permanent one. This matter is done by using the
order of Export Data.
The next stage of is the topological creation of the available data in the reference database. But since the
water installations of the region of the project enter the environment of GIS from the environment of the
hydraulic analysis software, there is no need of the topological creation, because in the hydraulic analysis
software, the installations are analyzed, only when all of the layers are connected to one another in proper
places.Thus, the connection of these layers has been created in this software and there is no need for topological
creation for reviewing the connection between the layers, their being located on one another and so on, any
more.
Therefore, all of the information associated with the water installations in the villages of the region of the
project, including sources of water preparation, transmission lines, pumping stations, reservoirs and consumers
(villages) are stored in a reference database which is easily accessible. And also the required information can be
accessed quickly by using the feature table and analytic functions.
If the information associated with each of the water installations and also villages of the region of the
project changed, the new information can be easily entered by using the extension of edition. And also we can
significantly help the updating process by defining relations and also mathematical functions.
Output Products:
In general, outputs are divided into two categories:
Paper outputs such as statistical reports, maps, charts and tables which are provided though printer or
plotter.
Non-paper outputs in which the produced information can be seen on the screen. This type of output is used
for using the final processes and analysis.
In the present research the output of the map was prepared from the paper output products of the
geographical information system. We refer to the stage of preparing the map in this environment in the rest of
the research.
Preparation of Installation of Water Transmission:
One of the applications of ArcGIS is preparing maps with various scales for transmission lines. The
ArcMAP layout is used for preparing the map. This environment enables the users to adjust and move the
demonstrative details of the map as they desire and to create a final map with layout in order for taking an
output from the software.
We use the layout view toolbar (figure no.1) in order to prepare the map from the information that has been
entered by considering the require scale.

1023 Ahmad Nohegar et al, 2014
Advances in Environmental Biology, 8(17) September 2014, Pages: 1020-1036
Fig. 1: Layout View Tools in the environment of ArcMAP
We can use the setting option of the page in the File menu in order to adjust the dimensions of
demonstration and also in order to place the Layout in the page (figure no. 2).
Fig. 2: Setting of the size of the page for showing the data in the Layout View Tools
After preparing the size of the page and setting the required data for demonstration in the maps by using the
tools and scale of Tools (figure no. 3), we need some details such as: title of the map, explanation of signs of the
map, geographical navigator signs, scale, labeling the effects of the installations of the transmission and other
additional details such as images and auxiliary maps, in order to complete the final map and turning it into a
standard map in order for taking the output.

1024 Ahmad Nohegar et al, 2014
Advances in Environmental Biology, 8(17) September 2014, Pages: 1020-1036
*Scale
Fig. 3: Scale and Tools for preparation of the output map
A proper frame was designed for adding title to the map in this project using the cartography software
AutoCAD. In this frame, some places were specified for title, subject, number of the map, scale, and name of
the designers and also the employer and councilor and then it was turned into an image.
The next step after adding the title frame is to add the scale of the map, which is done by using the Insert
menu. We can make some changes of the size, color, and style of the scale also in this opened frame through the
tab of features. And we save those changes that are always fixed for all of the output maps of the project as a
style (figure no. 4). We place the number that is prepared through these steps in its proper place in the title
frame. By changing the scale of the map, this number automatically changes and there is no need to enter it
again at all, which is one of the advantages of preparing a map by using the ArcGIS itself.

1025 Ahmad Nohegar et al, 2014
Advances in Environmental Biology, 8(17) September 2014, Pages: 1020-1036
Fig. 4: how to scale the output map
The next step is adding the geographic direction of north to the map, which is done through the Insert menu.
It is necessary to state that just like in scale, in this item we can easily apply our desired style as well and also
save it for the next maps. This leads to saving time and makes the preparation of the next maps quicker (figure
no. 5).
Fig. 5: Adding the geographical direction of north to the map

1026 Ahmad Nohegar et al, 2014
Advances in Environmental Biology, 8(17) September 2014, Pages: 1020-1036
Rest of the figure no. 5
After adding the direction of north to the map, a coordinate network shall be defined for the map. This is
possible by right clicking and choosing the coordinate option. We choose the network tab in the window that has
been opened and choose a new network and in the new opened window, we choose the distance of the lines in
the network and also size, color and style of these lines. And also after these actions, if we wanted other
changes, we could make them by using the properties tab which is in the window of the properties of the data
frame. Therefore, the lines of coordinate network appear on the map with the changes that were made (figure no.
6).

1027 Ahmad Nohegar et al, 2014
Advances in Environmental Biology, 8(17) September 2014, Pages: 1020-1036
Fig. 6: how to add the coordinate network to the output map
Rest of the figure no. 6
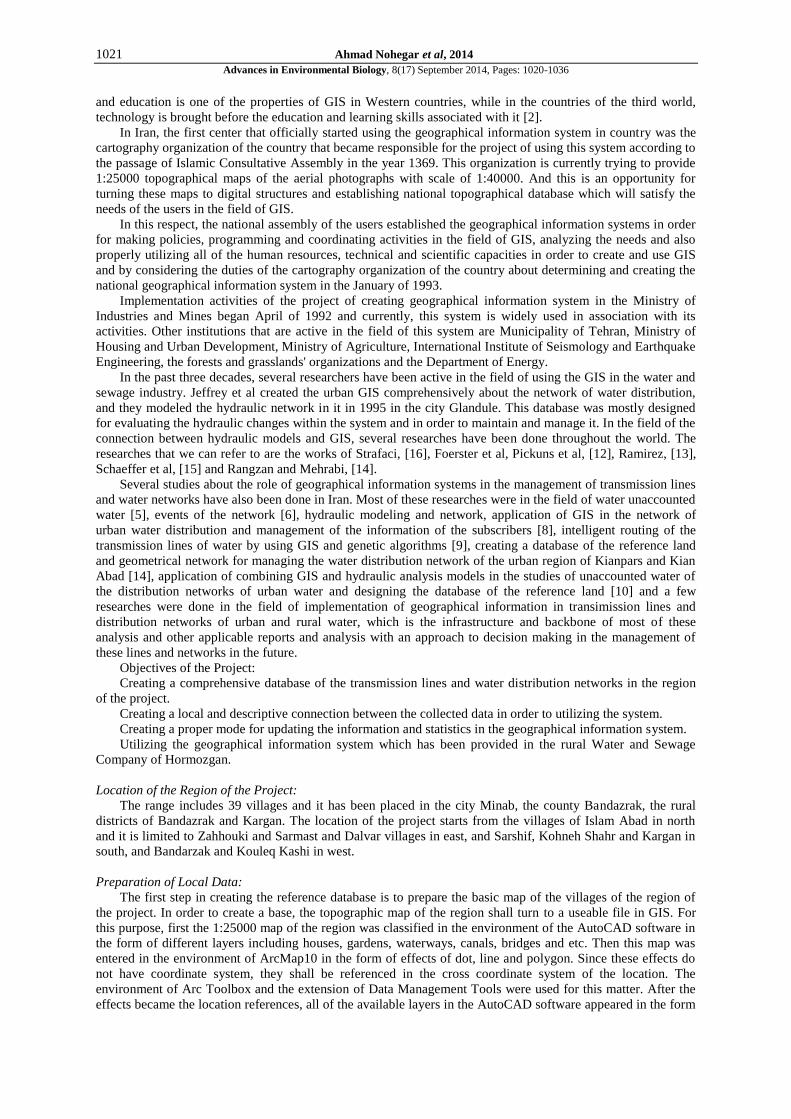
Labeling the effects of the installations of transmission is done in the nest step which includes some
information associated with their descriptive table. Since in the normal mode we can only choose a name (for
example) for the effect, the programming with the language of VBA was used in this project in order to put
multiple labels on the effect, for example pipes, number of the pipe, flow, material, dimension, and length of the
pipe. With the help of this application, various labels can be put in separate rows. In order to label these effects
the labeling menu is used, which can be added to it by right clicking in the environment of the ArcMap. In this
menu, we choose the effect that we want to label and then we click of the Expression option and we choose
multiple labels by using the columns of the properties table and add them to the map (figure no. 7).

1028 Ahmad Nohegar et al, 2014
Advances in Environmental Biology, 8(17) September 2014, Pages: 1020-1036
Fig. 7: How to label the effects
1029 Ahmad Nohegar et al, 2014
Advances in Environmental Biology, 8(17) September 2014, Pages: 1020-1036
Rest of the figure no. 7
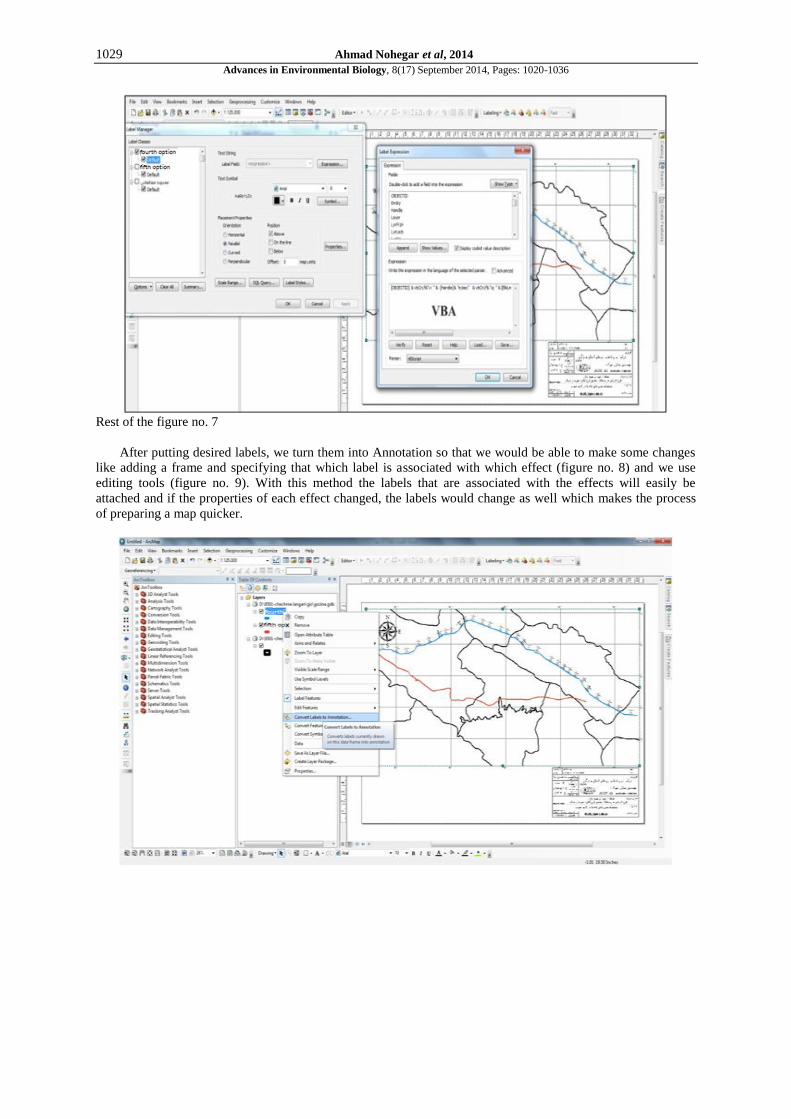
After putting desired labels, we turn them into Annotation so that we would be able to make some changes
like adding a frame and specifying that which label is associated with which effect (figure no. 8) and we use
editing tools (figure no. 9). With this method the labels that are associated with the effects will easily be
attached and if the properties of each effect changed, the labels would change as well which makes the process
of preparing a map quicker.

1030 Ahmad Nohegar et al, 2014
Advances in Environmental Biology, 8(17) September 2014, Pages: 1020-1036
Fig. 8: How to turn Labels to Annotation
Fig. 9: How to edit the labels in the map

1031 Ahmad Nohegar et al, 2014
Advances in Environmental Biology, 8(17) September 2014, Pages: 1020-1036
Rest of the figure no. 9
In order to add the guidance of the map, after activating the Insert option, we click on the Legend option
and with this action a new window will be opened. In the first section of this window an environment has been
provided so that the user would be able to easily add information layers to the guidance of map simply by using
it. In the next sections, the user can choose the color, size and style of the fonts and also edit the guidance frame
and by clinking on the End option the guidance will be added to the map and if necessary, the user can move the
whole content of it to the desired place on the map by clicking and choosing it.

1032 Ahmad Nohegar et al, 2014
Advances in Environmental Biology, 8(17) September 2014, Pages: 1020-1036
* Fourth Option ** Fourth Option
Fifth Option Fifth option
Study Series Study Series
Fig. 10: How to add guidance to the output map
In order to present all of the layers which were added to the map, at the time of moving the map, we
activate the option of Map Document Properties form the File menu. In the bottom section of the window that
has been opened, we activate the option of Store Relative pathnames to data sources.
We use the option Export file from the File menu in order to extract the output of the map and we choose
the type of the output file in the opened window and save it in the proper address (figure no. 11).

1033 Ahmad Nohegar et al, 2014
Advances in Environmental Biology, 8(17) September 2014, Pages: 1020-1036
Fig. 11: How to save the map
When using this method of preparation of the map, if the properties of the various effects of the map
changed, due to the connection that exists between the effects and their annotations, these changes would be
made automatically and there is no need for the user. The user only needs to do the final stage of preparation of
the map. This feature not only save so much time, but also it reduces the errors of the users in the output maps.
It is worth noting that just like all of the other software, in order to save a file in the environment of the
ArcMap, we used Save form the File menu. All of the files of this software are saved with MXD type.
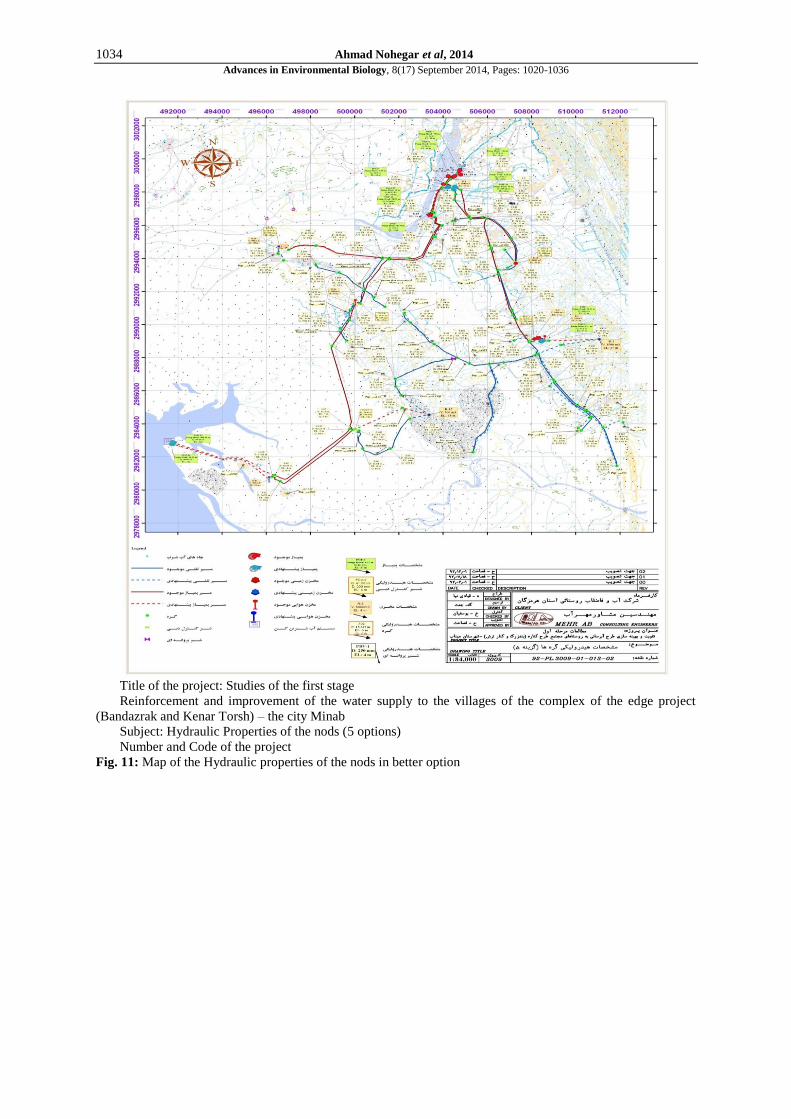
In this research, the hydraulic properties of the pipes in the better and passed option of the edge project of
Minab have been provided as a map (figues no. 12 and no. 13).
1034 Ahmad Nohegar et al, 2014
Advances in Environmental Biology, 8(17) September 2014, Pages: 1020-1036
Title of the project: Studies of the first stage
Reinforcement and improvement of the water supply to the villages of the complex of the edge project
(Bandazrak and Kenar Torsh) – the city Minab
Subject: Hydraulic Properties of the nods (5 options)
Number and Code of the project
Fig. 11: Map of the Hydraulic properties of the nods in better option

1035 Ahmad Nohegar et al, 2014
Advances in Environmental Biology, 8(17) September 2014, Pages: 1020-1036
Fig. 11: Map of Hydraulic properties of the pipes in better option
Title of the project: Studies of the first stage Reinforcement and improvement of the water supply to the
villages of the complex of the edge project (Bandazrak and Kenar Torsh) – the city Minab
Subject: Hydraulic Properties of the pipes (5 options)
Number and Code of the project
Conclusions:
After doing all of the various stages of hydraulic analysis, collecting data and entering the information to
the geographical information system and managing the system and finally producing an output, these results
have been obtained:
By using the WaterGEMS software, we can easily find access to the hydraulic problems in the water
transmission systems and solve these problems with the help of this software.
The data of the software WaterGEMS can be used in the environment of GIS and we can use it to our
advantage for preparing a database.
By considering the capabilities of the geographical information systems for storing, showing and analyzing
the local and descriptive information, we can create a complete and comprehensive database of subscribers and
installations of the water transmission lines. These databases are able to include an unlimited amount of local
information and descriptive information in them and the users can choose the data that they seek from the

1036 Ahmad Nohegar et al, 2014
Advances in Environmental Biology, 8(17) September 2014, Pages: 1020-1036
database, and delete, add or edit it and analyze it and finally prepare and present the outputs that they desired at
any time.
In this system, different type of available data in various databases can simultaneously be shown, reviewed
and analyzed. Therefore, there will be the possibility of comparing these data and information from various
dimensions with one another.
We can easily review the geographical dispersion of all kinds of data and identify the geographical
locations and regions and suggest them to the users for doing the required researches.
By applying the analysis functions of this system and other reasonable and various acts, the database will be
prepared to response to all of the questions of the users and fulfill their needs and we can do so many analyses in
association with the data, fit to the current needs.
The pattern that has been used in this research, in which the process of the work has been shown, can be
used as a model for water transmission installations in other complexes of the provenance.
REFERENCES
[1] Arhami, Mahmoud, 2002. Familiarity with the GIS ArcView software, Tehran, Organization of Iran Water
Resources Management.
[2] Sedighi, Mehri, 2006. Review of the application of Geographical Information System (GIS), Research and
Technology Center of Industrial Automation of Iran.
[3] Arnov, Astan, 1996. Geographical Information System, translation of cartography organization of the
country, first edition, Tehran, publication of cartography organization of the country.
[4] Star, Jeffrey, Stess, John, 1996. An introduction on the Geographical Information System, translated by
Hossein Sanaee Nejad, University Jihad.
[5] Kardar, S., 2001. Role of GOS and modeling in the reduction of the unaccounted water, Tarbiat Modarres
University, Department of Geography, Master Thesis.
[6] Delavar, M., M. Tabesh, H. Jafari, 2004. Application of GIS in the management of systems of events and
incidents municipal water distribution networks, First National Congress on Civil Engineering, Tehran.
[7] Sarami Pour, M., 2004. Classification and analysis of the status of pressure in the networks of municipal
water distribution by using GIS, Shahid Beheshti University, Department of Earth Sciences, Master Thesis.
[8] Motakan, A., A. Shakiba, A. Hosseini Asl, A. Ashouri, 2010. Application of GIS in municipal water
distribution networks and management of information of subscribers, Geomatic congress, Organization of
the country's cartography.
[9] Ebrahimi pour, A., 2005. Intelligent navigation of pipelines of water transmission by using GIS and genetic
algorithm, Trabiyat Modarres University, Faculty of Human Sciences, Master Thesis.
[10] Mehrabi, A., K. Rangzan, A. Abshirini, M. Motamedi, 2007. Management of the sewage network of the
urban region of Kian Pars and Kian Abad with a geodatabase desing and geometrical network, Geomatic
congress, National Cartographic organization, Tehran.
[11] Bostaniyan, B., 2001. Application of the combination of GIS and models of hydraulic analysis in the studies
of the unaccounted water of the networks of urban water distribution, Tehran University, Faculty of
Engineering, Master's Thesis.
[12] Pickus, J., R. Bahadur, W.B. Samuels, 2003. Integrating the ArcGIS Water Distribution Data Model into
Pipeline Net, Springer, Netherlands, pp: 99-112.
[13] Ramirez, A., 1997. Interfacing Potable water hydraulic models with Arc Info and ArcView data set,
Anchorage Water and Wastewater Utility, Anchorage.
[14] Rangzan, K., A. Mehrabi, 2007. Establishing a geospatial database and geometric network system for
management of water distribution network of Kianpars and Kianabad Urban district, 1st Urban GIS
conference, Shomal University, Amo;, Iran.
[15] Schaeffer, B., and T. Foerster, 2008. A client for distributed geo – processing and workflow design, Journal
for Location Based Services, 2(3): 194-210.
[16] Strafaci, A.E., Advanced Water Distribution Modeling and Management, Haested Publisher.