advances in civil engineering materials
TRANSCRIPT

Advances in Civil EngineeringMaterials
Paul Stutzman1
DOI: 10.1520/ACEM20130093
Quantitative X-RayPowderDiffraction Analysis ofPortland Cements:Proficiency Testingfor LaboratoryAssessment
VOL. 3 / NO. 1 / 2014

Paul Stutzman1
Quantitative X-Ray PowderDiffraction Analysis of PortlandCements: Proficiency Testingfor Laboratory Assessment
Reference
Stutzman, Paul, “Quantitative X-Ray Powder Diffraction Analysis of Portland Cements:
Proficiency Testing for Laboratory Assessment,” Advances in Civil Engineering Materials,
Vol. 3, No. 1, 2014, pp. 122–141, doi:10.1520/ACEM20130093. ISSN 2165-3984
ABSTRACT
Quantitative X-ray powder diffraction analysis (QXRD) is being used within the
cement industry for phase characterization of hydraulic cement. The current
ASTM standard test method for powder diffraction analysis of cements
provides guidance, but not an explicit method, for quantifying phase
concentrations. The standard utilizes qualification criteria, where an analysis of
a set of certified reference materials must fall within stated precision and bias
limits. Validation of X-ray powder diffraction analyses by the Rietveld method
is particularly important because the normalization inherent in the mass
fraction calculations can obscure accuracy problems. Currently, the only
certified reference materials for phase abundance are a set of NIST SRM
clinkers, which lack the calcium sulfate and carbonate phases found in
portland cements. A set of portland cements was distributed to 29 laboratories
for analysis according to each lab’s individual protocols. The objective was to
provide each lab with quantitative feedback on its precision and accuracy
performance. The results from all the labs are presented graphically with
Youden plots that incorporate ranking to illustrate relative lab precision and
accuracy based upon a consensus mean for each phase and ASTM C1365
performance qualification criteria. Labs that fall outside of the compliance
limits are provided with information via the Youden plots to assess their
systematic and random error. Proficiency testing of this sort provides
Manuscript received July 30, 2013;
accepted for publication January
16, 2014; published online
February 28, 2014.
1
Materials and Structural Systems
Division, National Institute of
Standards and Technology,
100 Bureau Drive, Gaithersburg,
MD 20899-8615, United States of
America.
Copyright VC 2014 by ASTM International, 100 Barr Harbor Drive, P.O. Box C700, West Conshohocken, PA 19428-2959 122
Advances in Civil Engineering Materials
doi:10.1520/ACEM20130093 / Vol. 3 / No. 1 / 2014 / available online at www.astm.org

participating laboratories with a quantitative assessment of their performance
relative to peers using a wider range of materials encompassing the broad
spectrum of modern hydraulic cement production. These newer materials may
include, for example, the calcium sulfate phases and the limestone additions
that have become commonplace in today’s cements. Such a quantitative
assessment could be used to qualify laboratories and may be stipulated in a
specification.
Introduction
Standard test method validation is generally accomplished through interlaboratory
testing and development of a precision statement. If certified reference materials are
available, a statement on bias may be possible. ASTM C1365 [1], standard test
method for X-ray powder diffraction analysis of clinker and cement, provides guid-
ance and performance criteria for X-ray powder diffraction analysis of cements.
Rather than provide a specific set of steps to follow in the analysis of cement, C1365
provides performance criteria that labs and analysts must meet in order to claim
compliance with the test requirements, a process called qualification. Qualification
involves documented analyses of certified reference materials, such as NIST SRM
2686, 2687, and 2688 for cement clinkers, with precision and bias performance crite-
ria previously established from an inter-laboratory study [2].
Being performance-based, ASTM C1365 provides flexibility in the selection of
a protocol. If, however, a laboratory lacks an explicit procedural format, it may
result in higher levels of random (precision) and systematic (bias) error, or uncer-
tainty. Cement and clinker phases pose challenges in phase identification as most,
if not all, of the intense diffraction peaks are subject to partial or complete over-
lap, and diffraction peaks from major phases can obscure low-concentration
phase diffraction peaks. With few resolvable peaks for identification, an alternate
approach is necessary for phase identification based upon key resolvable diffrac-
tion peaks. These key peaks are not typically the most intense peaks for a phase,
but those that are less likely to have an overlap with other phases in the cement.
ASTM C1365 does provide a list of important diagnostic peaks to facilitate phase
identification.
The normalization of the mass fraction calculations in the Rietveld calculations
and the lack of a representative range of certified cement reference materials make
identification of bias difficult. Given that individual lab bias generally dominates
method-specific biases, a statement on method bias becomes difficult to formulate,
making comprehensive calibration essentially impossible [2,3].
In developing an individual lab protocol, identification and resolution of mea-
surement issues typically involve the use of synthesized phases, in-house com-
pounded samples, clinkers that have been subjected to a light microscope point
count, or certified reference materials [4–7]. An alternative approach to developing
and validating a lab protocol is to incorporate proficiency testing. This approach was
developed by Youden [8], applied to cement testing [9], and used by the Cement
and Concrete Reference Laboratory (CCRL) for a wide variety of chemical and
STUTZMAN QUANTITATIVE ON X-RAY POWDER DIFFRACTION PROFICIENCY TESTING 123
Advances in Civil Engineering Materials

physical cement analyses to assess laboratory precision and to rate laboratory per-
formance based upon consensus means.
Adopting anonymous proficiency testing for X-ray powder diffraction analysis
of hydraulic cements provides a number of advantages: (1) enabling a regular supply
of new materials from actual industrial cements, which include calcium sulfate and
carbonate phases lacking in the clinkers, (2) testing a laboratory protocol against
consensus values from a large group of laboratories, (3) developing insight into
individual lab precision and accuracy, (4) ranking performance by phase against pre-
cision and accuracy qualification criteria required by ASTM C1365 [1], (5) anony-
mously contributing and then comparing one’s performance against the collective
results of peers, and (6) identifying precision and accuracy problems in the test
method.
A trial proficiency test program was initiated for quantitative X-ray powder
diffraction of hydraulic cements by distributing two industrial cements to each of
the participating laboratories. Participants were instructed to use their own labo-
ratory preparation, data collection, and data reduction protocols, and to provide
as much detail to the organizers as possible. The test program specified replicate
analyses that are not generally used in routine proficiency testing, but which will
be used in a subsequent report on refining precision and accuracy estimates for
ASTM C1365 [1].
The Proficiency Test Program
CCRL provided a pair of cements for each lab (25 g samples sealed in glass vials)
that were chosen from among those used in the chemical proficiency test program
cements 177 (A) and 178 (B) (Table 1) [10]. These cements were taken from com-
mercial production and were homogenized in a V-blender prior to packaging. Each
lab participating in the trial test program was instructed to perform a quantitative
TABLE 1
CCRL oxide results and ASTM C150 phase estimates from chemical analyses for cements A and B. The manufac-
turers each reported a mass fraction of 3.7 % limestone.
A B
SiO2 20.72 19.53
Al2O3 4.46 4.44
Fe2O3 2.87 3.09
CaO 63.58 63.68
MgO 2.26 2.50
SO3 2.70 3.38
Na2O 0.175 0.120
K2O 0.559 0.496
Alite 53.2 61.5
Belite 19.0 9.4
Aluminate 7.0 6.5
Ferrite 8.7 9.4
STUTZMAN QUANTITATIVE ON X-RAY POWDER DIFFRACTION PROFICIENCY TESTING 124
Advances in Civil Engineering Materials

analysis by XRD in triplicate. Each lab was assigned an identification number
allowing it to identify its results while maintaining anonymity. Details on each lab’s
analytical procedures were requested in order to enable investigation of procedure-
induced bias from factors like the use of specimen grinding, hydraulic press mount-
ing, and preferred orientation corrections. Data were returned on pre-formatted
spreadsheets to facilitate processing and analysis. Samples were sent to 36 participat-
ing laboratories, and 29 of these laboratories returned data.
This proficiency test program differs from that described in ASTM E2489
[11] in that the precision criteria for ranking are not being derived from the data,
but from the qualification limits from ASTM C1365 [1]. The qualification criteria
include repeatability (within-lab) and reproducibility (between-lab) standard devi-
ations and accuracy limits against a known value using the mean of 2, 3, or 4
replicate determinations. The ranking system of proficiency testing [9] was
adopted to expand the information from reproducibility results by assigning a
rank based upon each lab’s performance, rather than pass/fail criteria. The ASTM
C1365 reproducibility criteria (d2s) would be approximately 2.5 standard devia-
tions, or a ranking of 1.
Accuracy is the “closeness of agreement between a test result and an accepted
reference value” and contains random uncertainty compared to bias [12]. Uncer-
tainty introduced by individual lab protocol appears to dominate that of method
bias, particularly when the method does not explicitly specify the process. Use of
a certified reference material is less helpful in these cases, as the computed bias
will not represent most individual lab’s performance [2] and, additionally, certi-
fied reference materials may not be available. An alternative may be found in
using cements, for which certified reference materials are not available for phase
abundance, and comparing each lab’s performance against the consensus value of
the participants. The consensus value is used because the individual lab uncertain-
ties tend to cancel out, providing an improved estimate of the true value. Since
there is a lab effect (outliers), the consensus value for each analyte is established
using a trimmed mean of means. This is a modification of a mean of means
model used in early SRM work using the 3-point mean from each lab and an
80 % trimmed mean across all laboratories. The 3-point mean reduces within–lab
random uncertainty while the trimmed mean of means reduces the influences of
outliers by the mean of the data excluding 10 % from the top and bottom of
ranked mean determinations [13].
The ASTM C1365 [1] accuracy criteria are based upon a prediction interval
developed from the composite results of an inter-laboratory study [2]. ASTM C1365
95 % prediction intervals should contain the measurement estimate for a single
future observation and are based upon three-point means for this program. Falling
within this interval indicates a lab’s accuracy is similar to that of the collective results
of the inter-lab study participants.
RECALCULATION OF CALCITE QUALIFICATION CRITERIA
New calcite (CaCO3) qualification values were derived from these data, as an un-
usual number of labs failed the original ASTM C1365 [1] limits for calcite. The
overly restrictive accuracy limit may be a result of the calcite qualification criteria in
ASTM C1365 being based upon a single cement for and an unusual occurrence of
STUTZMAN QUANTITATIVE ON X-RAY POWDER DIFFRACTION PROFICIENCY TESTING 125
Advances in Civil Engineering Materials

the between-lab standard deviation being smaller than the within-lab standard devi-
ation [2]. Following ASTM E691 [14], calcite precision was re-estimated (Table 2)
based upon two cements and three replicates, each from 29 laboratories, and the
qualification criteria were re-calculated. These values will be used for the qualifica-
tion criterion in place of those given for calcite in ASTM C1365. A future report will
evaluate all phases for consideration by ASTM in future revisions of the ASTM
C1365 test method.
ASTM C1365 STANDARD TEST METHOD
ASTM C1365 [1] was first adopted in 1998 for quantitative X-ray powder diffraction
analysis of portland cement and portland cement clinker. A novel feature of this
standard test method is a requirement for demonstrating the ability to perform an
analysis comparable to the consensus performance of a set of competent labs from
an inter-laboratory study. This qualification process uses a set of three SRM clinkers
available from NIST for the determination of proportions of alite, belite, aluminate,
ferrite, and periclase, which are all the phases discussed in the ASTM C150 [15]
cement specification. The ASTM C1365 qualification criteria consist of repeatability
and reproducibility standard deviations (Table 3), and accuracy (Table 4) relative to
the certified SRM values [1,2].
TABLE 2
Calcite repeatability (sr) and reproducibility (sR) values expressed as a single standard deviation and 95 % limitsfor repeatability (r) and reproducibility (R) where n¼24.
Material Mean sr sR r R
A 2.58 0.1936 0.9498 0.54 2.66
B 2.51 0.2176 1.0517 0.61 2.94
pooled 0.2059 1.0020 0.57 2.78
TABLE 3
Repeatability and reproducibility expressed as 1�r and 95 % limit where the results of two tests by should not varymore than the 95 % limit (ASTM C1365).
Repeatability Within-Lab 95 % Limit (r) Reproducibility Between-Lab 95 % Limit (R)
alite 0.74 2.04 2.27 6.30
belite 0.64 1.77 1.40 3.87
aluminate 0.47 1.31 0.79 2.19
ferrite 0.49 1.36 0.89 2.47
periclase 0.23 0.63 0.50 1.39
arcanite 0.22 0.60 0.34 0.94
gypsum 0.21 0.59 0.59 1.65
bassanite 0.39 1.08 0.58 1.60
anhydrite 0.27 0.74 0.64 1.77
calcitea 0.21 0.58 1.00 2.78
aRevised values based upon current proficiency data.
STUTZMAN QUANTITATIVE ON X-RAY POWDER DIFFRACTION PROFICIENCY TESTING 126
Advances in Civil Engineering Materials

Most of the participants in this study indicated that they were not currently
qualified, so this was not made a prerequisite for participation. The qualification lim-
its from ASTM C1365 and the recalculated calcite criteria were applied to results of
their analyses of the two cements, with the trimmed mean of means value represent-
ing the consensus estimate of phase abundance for each analyte as described
previously.
TABLE 4
Prediction intervals for n¼2, 3, 4 replicate measurements, corrected from ASTM C1365.
2 3 4
alite 3.38 2.80 2.45
belite 2.08 1.72 1.51
ferrite 1.32 1.10 0.96
aluminate 1.17 0.97 0.85
periclase 0.74 0.62 0.54
gypsum 0.88 0.73 0.64
bassanite 0.86 0.71 0.63
anhydrite 0.95 0.79 0.69
arcanite 0.51 0.42 0.37
calcitea 1.53 1.27 1.12
aRevised values based upon current proficiency data.
FIG. 1 Alite Youden plot delineated by 1, 1.5, 2, and 2.5 standard deviations from the means.
STUTZMAN QUANTITATIVE ON X-RAY POWDER DIFFRACTION PROFICIENCY TESTING 127
Advances in Civil Engineering Materials
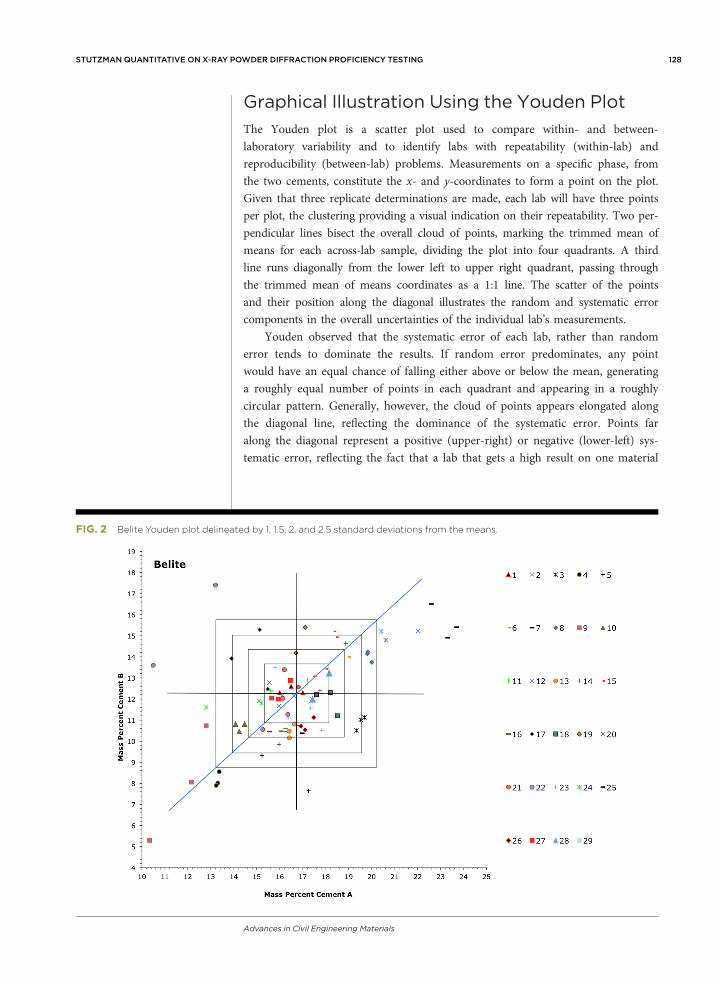
Graphical Illustration Using the Youden Plot
The Youden plot is a scatter plot used to compare within- and between-
laboratory variability and to identify labs with repeatability (within-lab) and
reproducibility (between-lab) problems. Measurements on a specific phase, from
the two cements, constitute the x- and y-coordinates to form a point on the plot.
Given that three replicate determinations are made, each lab will have three points
per plot, the clustering providing a visual indication on their repeatability. Two per-
pendicular lines bisect the overall cloud of points, marking the trimmed mean of
means for each across-lab sample, dividing the plot into four quadrants. A third
line runs diagonally from the lower left to upper right quadrant, passing through
the trimmed mean of means coordinates as a 1:1 line. The scatter of the points
and their position along the diagonal illustrates the random and systematic error
components in the overall uncertainties of the individual lab’s measurements.
Youden observed that the systematic error of each lab, rather than random
error tends to dominate the results. If random error predominates, any point
would have an equal chance of falling either above or below the mean, generating
a roughly equal number of points in each quadrant and appearing in a roughly
circular pattern. Generally, however, the cloud of points appears elongated along
the diagonal line, reflecting the dominance of the systematic error. Points far
along the diagonal represent a positive (upper-right) or negative (lower-left) sys-
tematic error, reflecting the fact that a lab that gets a high result on one material
FIG. 2 Belite Youden plot delineated by 1, 1.5, 2, and 2.5 standard deviations from the means.
STUTZMAN QUANTITATIVE ON X-RAY POWDER DIFFRACTION PROFICIENCY TESTING 128
Advances in Civil Engineering Materials

will likely have a high result on the other. Points that fall away from the diagonal
indicate some inconsistency for that lab; for example, poor within-lab precision
or a problem with one specimen. In general, the width of the data projected onto
a perpendicular to the diagonal is proportional to the test random error, while
the width of the data projected onto the diagonal itself is proportional to the sys-
tematic error [11].
The modified Youden plots presented here (Figs. 1–6) have been augmented
with boxes representing 1, 1.5, 2, and 2.5 standard deviations from the mean, based
upon the ASTM C1365 [1] 1r reproducibility precision. These bounds define
rankings from 4 to 0, respectively, with higher numerical ranking representing better
laboratory performance. Each lab is anonymously identified by a color and shape-
coded symbol. The rankings can also be presented in tabular form. Graphical repre-
sentation of single-phase data in the form of a strip plot (Figs. 7–10) is similar to a
histogram with lab results coded by lab number, organized horizontally according to
value.
OBSERVATIONS ON TEST RESULTS
The dispersion of the data within the Youden plots for alite, belite, and aluminate
appear generally circular with some elongation along the 45� line. Plots for ferrite,
periclase, and calcite show a more pronounced elongation. In the case of calcite
and possibly ferrite, the propensity for preferred orientation due to calcite’s rhombic
and ferrite’s tabular crystal habits may result in a greater incidence of systematic
error if an orientation correction is not made, or made in a way where the bias
increases.
FIG. 3 Aluminate Youden plot delineated by 1, 1.5, 2, and 2.5 standard deviations from the means.
STUTZMAN QUANTITATIVE ON X-RAY POWDER DIFFRACTION PROFICIENCY TESTING 129
Advances in Civil Engineering Materials

An example of a lab that scores well for all analytes is lab 27, where the all
the reported values lie close to the 45� lines and to the intersection of the mean
lines. This lab’s results fell inside the smallest box (61r) for all phases but bas-
sanite (as seen in tabulation), where they fell inside the 1.5 r box. In Fig. 1 of the
alite Youden plot, Lab 21 exhibits a large random error (relatively wide point
clustering), and greater difficulty with cement A, suggesting that Lab 21 should
consider improving its sample preparation and measurement processes to achieve
more consistent results. Averaging test results can reduce lab bias due to impreci-
sion. While the individual determinations for Lab 21 exhibit relatively poor
repeatability, a test result being an average of multiple determinations would
reduce bias in their case, as seen later in the prediction interval plot that utilizes
the mean of three replicates.
Labs showing an alite inaccuracy tend to have an opposing anti-correlated
estimate for belite. For example, Lab 9 shows a positive alite estimate, having its
values fall outside the upper-right quadrant, resulting in a ranking of 0 for all the
replicates. Lab 9 exhibits a similar inaccuracy in the opposite direction for belite,
ferrite and aluminate. Given the far right quadrant point placement and distance
from the 45� line for alite, Lab 9 exhibits both systematic and random error. Lab
9 used unground samples, top loading using a high-pressure mounting press, and
a preferred orientation correction, which while not explicitly so noted, was pre-
sumably for alite. In contrast, Lab 7 shows a negative inaccuracy for alite and a
positive inaccuracy for belite. Lab 21 shows poor repeatability, and a positive alite
inaccuracy with corresponding low belite estimates in two of its three replicates,
particularly for cement A. This anti-correlation may be the result of the
FIG. 4 Ferrite Youden plot delineated by 1, 1.5, 2, and 2.5 standard deviations from the means.
STUTZMAN QUANTITATIVE ON X-RAY POWDER DIFFRACTION PROFICIENCY TESTING 130
Advances in Civil Engineering Materials

substantial peak overlap and the correlation between their scale (intensity) varia-
bles or it could be the result of the normalization in calculation of mass fractions.
Attempts to correlate processing and analysis procedures with accuracy problems
were not successful as most summary reports provided few details on the use of
preferred orientation correction.
PLOTS FOR SINGLE-OCCURRENCE PHASES
In the cases where a phase is identified in only one of the two cements, a point plot is
useful for visualizing the test results. Plots for gypsum, bassanite, anhydrite, and arcan-
ite are presented in Figs. 7–10. The vertical axis represents the mass percentage of the
phase with replicates for each lab stacked in columns along the x-axis. The consensus
mean value is indicated with a horizontal solid line parallel to the x-axis and the per-
formance interval bounds noted by numerical values on the dashed lines. This presen-
tation provides each lab with a sense of its within-lab precision (repeatability) based
upon their point clustering and accuracy relative to the consensus mean.
PRECISION
Table 5 shows how individual labs compared to the ASTM C1365 [1] repeatability
criteria, broken out by phase and designated by P/F for pass or fail. Currently within
C1365, the pass/fail criteria apply to individual phases. Therefore, a fail on a single
phase will not invalidate the entire analysis, but it does indicate that the analyst
should review the lab’s analysis protocol.
FIG. 5 Periclase Youden plot delineated by 1, 1.5, 2, and 2.5 standard deviations from the means.
STUTZMAN QUANTITATIVE ON X-RAY POWDER DIFFRACTION PROFICIENCY TESTING 131
Advances in Civil Engineering Materials

New calcite precision criteria were established using these data, so that few
labs would fail for this phase. Labs 28 and 29 exhibited some difficulty in meeting
the within-laboratory precision criteria for many of the phases for both cements,
while labs 5, 9, and 21 had difficulties with one of the two cements. Labs 11 and
17 missed the limits for tricalcium aluminate and belite, respectively, for a single
cement. No single cement appears to have exclusively presented precision prob-
lems, indicating that for these analyses the samples were probably relatively
homogeneous.
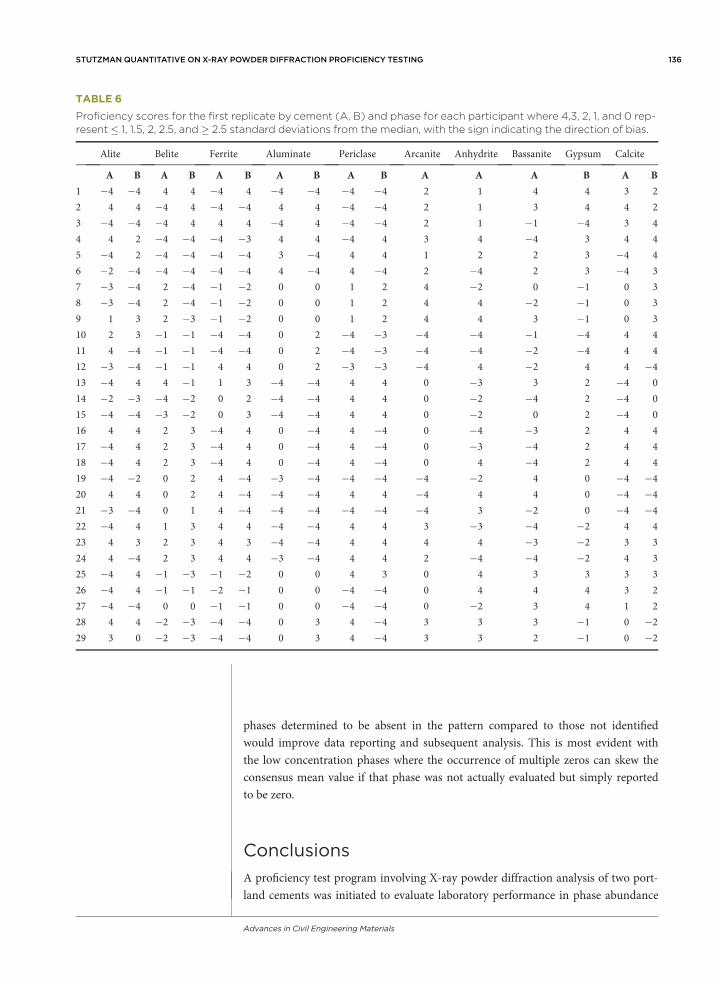
Proficiency scores are presented in Table 6 based upon the ASTM C1365 95 %
limits, r and R, (Table 2) [1]. In this example, the difference between the first two repli-
cates and the consensus mean were evaluated based upon the maximum allowed for
qualification. Proficiency scores are presented for the first replicate by cement (A, B)
and phase for each participant where 4, 3, 2, 1, and 0 represent �1, 1.5, 2, 2.5, and�2.5 standard deviations, respectively, from the mean, with the sign indicating the
direction of inaccuracy. A score of 1 is approximately the same as the 95 % limits from
ASTM C1365, as reported in Table 1 of ASTM C1365. If proficiency testing becomes
part of a qualification scheme for ASTM C1365, the Subcommittee will need to specify
what constitutes a reasonable performance limit before requiring a re-evaluation of the
laboratory procedures and re-certification using the SRM clinkers.
BIAS QUALIFICATION USING PREDICTION INTERVALS
For each lab, the mean of the three replicates was calculated and compared to the
limits in Table 4 for the appropriate number of replicates to check conformance to
FIG. 6 Calcite Youden plot delineated by 1, 1.5, 2, and 2.5 standard deviations from the means.
STUTZMAN QUANTITATIVE ON X-RAY POWDER DIFFRACTION PROFICIENCY TESTING 132
Advances in Civil Engineering Materials

FIG. 7 Gypsum plot by lab for cement B, with a solid consensus mean arrow and dashed lines bounding performance levels.
FIG. 8 Bassanite plot by lab for cement A, with solid consensus mean arrow and dashed lines bounding performance levels.
STUTZMAN QUANTITATIVE ON X-RAY POWDER DIFFRACTION PROFICIENCY TESTING 133
Advances in Civil Engineering Materials

FIG. 9 Anhydrite plot by lab for cement A, with solid arrow consensus mean marker and dashed lines bounding performance levels.
FIG. 10 Arcanite plot by lab for cement A, with solid arrow consensus mean marker and dashed lines bounding performance
levels.
STUTZMAN QUANTITATIVE ON X-RAY POWDER DIFFRACTION PROFICIENCY TESTING 134
Advances in Civil Engineering Materials

the accuracy qualification criteria, using mean values as the consensus. This table is
a modification of that in ASTM C1365 [1] to correct an error in the original calcula-
tion of the intervals. Tables 7 and 8 show results of the prediction interval qualifica-
tion, with the mean values on the bottom row and boldface for values exceeding the
prediction interval bounds. In some cases, no value was reported and the slot is left
empty. In others, a value of zero was reported as such. Averaging the replicate deter-
minations improved the apparent quality of the results from some participants
because the averaging can offset a relatively high random error; for example, with
alite in cement A for lab 21. In other instances with high systematic error (e.g., Labs
9 and 10), averaging did not help a lab to meet the prediction interval qualification
criteria. Proficiency test reporting criteria making explicit the distinction between
TABLE 5
Pass (P)–Fail (F) precision qualification by phase based upon the C1365 repeatability (within-lab) 95 % limits onmaximum difference between duplicates from the first two replicates.
Alite Belite Ferrite Aluminate Periclase Arcanite Anhydrite Bassanite Gypsum Calcite
A B A B A B A B A B A A A B A B
1 P P P P P P P P P P P P P P P P
2 P P P P P P P P P P P P P P P P
3 P P P P P P P P P P P P P P P P
4 P P P P P P P P P P P P P P P P
5 P F P F P P P P P P P P P P P P
6 P P P P P P P P P P P P P P P P
7 P P P P P P P P P P P P P P P P
8 P P P P P P P P P P P P P P P P
9 P F P F P P P P P P P P P P P P
10 P P P P P P P P P P P P P P P P
11 P P P P P P F P P P P P P P P P
12 P P P P P P P P P P P P P P P P
13 P P P P P P P P P P P P P P P P
14 P P P P P P P P P P P P P P P P
15 P P P P P P P P P P P P P P P P
16 P P P P P P P P P P P P P P P P
17 P P P F P P P P P P P P P P P P
18 P P P P P P P P P P P P P P P P
19 P P P P P P P P P P P P P P P P
20 P P P P P P P P P P P P P P P P
21 F P F P F P P P P P P P P P P P
22 P P P P P P P P P P P P P P P P
23 P P P P P P P P P P P P P P P P
24 P P P P P P P P P P P P P P P P
25 P P P P P P P P P P P P P P P P
26 P P P P P P P P P P P P P P P P
27 P P P P P P P P P P P P P P P P
28 P F F F P P P P P P P P P P F P
29 F F F P P F P P P P P P P P P P
STUTZMAN QUANTITATIVE ON X-RAY POWDER DIFFRACTION PROFICIENCY TESTING 135
Advances in Civil Engineering Materials
phases determined to be absent in the pattern compared to those not identified
would improve data reporting and subsequent analysis. This is most evident with
the low concentration phases where the occurrence of multiple zeros can skew the
consensus mean value if that phase was not actually evaluated but simply reported
to be zero.
Conclusions
A proficiency test program involving X-ray powder diffraction analysis of two port-
land cements was initiated to evaluate laboratory performance in phase abundance
TABLE 6
Proficiency scores for the first replicate by cement (A, B) and phase for each participant where 4,3, 2, 1, and 0 rep-resent � 1, 1.5, 2, 2.5, and � 2.5 standard deviations from the median, with the sign indicating the direction of bias.
Alite Belite Ferrite Aluminate Periclase Arcanite Anhydrite Bassanite Gypsum Calcite
A B A B A B A B A B A A A B A B
1 �4 �4 4 4 �4 4 �4 �4 �4 �4 2 1 4 4 3 2
2 4 4 �4 4 �4 �4 4 4 �4 �4 2 1 3 4 4 2
3 �4 �4 �4 4 4 4 �4 4 �4 �4 2 1 �1 �4 3 4
4 4 2 �4 �4 �4 �3 4 4 �4 4 3 4 �4 3 4 4
5 �4 2 �4 �4 �4 �4 3 �4 4 4 1 2 2 3 �4 4
6 �2 �4 �4 �4 �4 �4 4 �4 4 �4 2 �4 2 3 �4 3
7 �3 �4 2 �4 �1 �2 0 0 1 2 4 �2 0 �1 0 3
8 �3 �4 2 �4 �1 �2 0 0 1 2 4 4 �2 �1 0 3
9 1 3 2 �3 �1 �2 0 0 1 2 4 4 3 �1 0 3
10 2 3 �1 �1 �4 �4 0 2 �4 �3 �4 �4 �1 �4 4 4
11 4 �4 �1 �1 �4 �4 0 2 �4 �3 �4 �4 �2 �4 4 4
12 �3 �4 �1 �1 4 4 0 2 �3 �3 �4 4 �2 4 4 �413 �4 4 4 �1 1 3 �4 �4 4 4 0 �3 3 2 �4 0
14 �2 �3 �4 �2 0 2 �4 �4 4 4 0 �2 �4 2 �4 0
15 �4 �4 �3 �2 0 3 �4 �4 4 4 0 �2 0 2 �4 0
16 4 4 2 3 �4 4 0 �4 4 �4 0 �4 �3 2 4 4
17 �4 4 2 3 �4 4 0 �4 4 �4 0 �3 �4 2 4 4
18 �4 4 2 3 �4 4 0 �4 4 �4 0 4 �4 2 4 4
19 �4 �2 0 2 4 �4 �3 �4 �4 �4 �4 �2 4 0 �4 �420 4 4 0 2 4 �4 �4 �4 4 4 �4 4 4 0 �4 �421 �3 �4 0 1 4 �4 �4 �4 �4 �4 �4 3 �2 0 �4 �422 �4 4 1 3 4 4 �4 �4 4 4 3 �3 �4 �2 4 4
23 4 3 2 3 4 3 �4 �4 4 4 4 4 �3 �2 3 3
24 4 �4 2 3 4 4 �3 �4 4 4 2 �4 �4 �2 4 3
25 �4 4 �1 �3 �1 �2 0 0 4 3 0 4 3 3 3 3
26 �4 4 �1 �1 �2 �1 0 0 �4 �4 0 4 4 4 3 2
27 �4 �4 0 0 �1 �1 0 0 �4 �4 0 �2 3 4 1 2
28 4 4 �2 �3 �4 �4 0 3 4 �4 3 3 3 �1 0 �229 3 0 �2 �3 �4 �4 0 3 4 �4 3 3 2 �1 0 �2
STUTZMAN QUANTITATIVE ON X-RAY POWDER DIFFRACTION PROFICIENCY TESTING 136
Advances in Civil Engineering Materials

analysis of cements. By contrast to reference clinkers, cement samples contain addi-
tional calcium sulfate and calcium carbonate phases, and a “blind” test that requires
a qualitative analysis followed by a quantitative analysis. Objective quality measures
of a laboratory’s measurement process can be obtained by comparing individual
results against the consensus values using the ASTM C1365 [1] qualification criteria
via graphical and numerical ranking of lab performance through Youden plots and
strip plots. Comparing an individual lab’s results to the collective consensus provides
each lab with an opportunity to identify and resolve precision and bias problems in
their analyses.
TABLE 7
Prediction Interval qualification for alite, belite, aluminate and ferrite where boldface indicates a k¼3 meanexceeding the 95 % confidence bounds. Un-reported values are blank.
Alite Belite Aluminate Ferrite
A B A B A B A B
1 59.27 61.57 16.50 12.40 4.17 3.67 9.40 10.03
2 60.52 63.45 15.86 12.20 4.93 3.49 9.11 9.18
3 58.28 61.95 19.51 10.88 7.27 7.36 6.96 8.14
4 60.82 66.87 13.30 8.15 5.67 5.14 9.35 9.73
5 58.96 65.49 16.15 8.94 3.98 3.05 12.61 11.26
6 55.00 63.00 19.00 14.00 3.00 3.00 9.00 10.00
7 57.67 58.87 23.20 15.60 3.57 3.00 9.93 9.63
8 57.98 61.13 19.88 14.04 3.41 3.34 9.80 10.69
9 68.30 69.13 11.76 8.03 0.00 0.18 7.35 7.72
10 64.43 66.93 14.26 10.68 5.46 4.66 9.01 9.57
11 60.77 61.17 16.20 12.93 9.37 5.50 7.07 10.43
12 57.83 63.55 21.01 15.07 4.11 3.63 12.50 13.29
13 59.29 63.60 16.49 10.48 4.39 2.89 9.23 9.26
14 57.13 61.47 18.04 13.37 4.95 3.30 11.47 11.88
15 59.39 62.11 18.27 14.52 3.42 3.12 8.37 8.53
16 60.45 64.30 16.17 10.51 4.62 3.55 9.81 9.08
17 60.95 63.75 14.83 13.89 4.12 4.04 10.34 10.99
18 59.87 64.43 18.10 11.90 3.70 2.87 8.87 9.63
19 58.38 61.35 16.87 14.05 3.14 2.93 9.50 9.93
20 61.79 65.73 17.02 12.07 4.11 4.03 9.30 9.01
21 61.97 62.47 13.30 14.80 3.93 3.67 14.53 10.90
22 59.10 63.78 15.91 11.28 4.85 4.00 10.32 10.15
23 60.92 65.22 17.18 11.06 4.47 2.91 9.96 10.98
24 61.87 62.47 14.37 11.77 4.23 3.30 10.20 10.67
25 59.67 64.41 16.47 10.52 3.52 2.90 9.28 10.04
26 59.60 65.12 17.17 10.79 3.40 2.86 10.67 11.58
27 59.30 62.24 16.02 12.31 4.68 3.28 9.14 9.70
28a 59.75 63.30 17.05 12.60 3.85 3.96 9.28 8.80
29a 65.76 26.23 17.11 43.97 4.53 21.37 5.65 2.31
Mean 60.0 63.42 16.74 12.28 4.21 3.57 9.53 9.92
aQualification based on k¼ 2 as only two replicate values provided.
STUTZMAN QUANTITATIVE ON X-RAY POWDER DIFFRACTION PROFICIENCY TESTING 137
Advances in Civil Engineering Materials

In future proficiency testing, a requirement is necessary for distinguishing
phases identified as not present compared to those not included in the analyses. In
addition, ASTM C1365 should provide a list of required phases, optional phases,
and a required phase identification protocol. Providing an option to use means of
multiple test results in C1365 (though it is not precluded) would improve measure-
ment precision.
One goal of this study was to identify potential problem areas in the analyses.
However, identifying correlations between sample preparation, orientation correc-
tions and mass fraction accuracy was inconclusive, in part due to lack of complete
data describing the exact procedures employed by each lab. Evaluation of the impact
TABLE 8
Prediction interval qualification for periclase, calcite, arcanite, gypsum, bassanite, and anhydrite where boldfaceindicates a k¼3 mean exceeds the 95 % confidence bounds. Unreported values are blank.
Periclase Calcite Arcanite Gypsum Bassanite Anhydrite
A B A B A B A A
1 0.90 1.33 3.53 3.77 1.3 5.27 2.00 3.00
2 1.01 1.46 2.44 3.52 1.3 4.14 2.73 1.53
3 2.12 2.31 5.78 3.78 0.8 6.95 0.16 0.93
4 0.49 0.84 3.05 2.59 0.5 6.37 2.06 1.07
5 1.43 1.72 2.44 – – 8.34 3.20 0.13
6 1.00 1.00 3.00 3.00 – 5.00 3.00 0.80
7 0.93 1.40 2.17 2.23 0.5 6.20 2.00 1.19
8 1.17 1.53 3.47 3.52 1.1 4.76 0.90 0.95
9 0.91 1.50 4.07 4.03 – 5.83 2.50 0.93
10 0.93 1.38 – 0.59 1.1 2.34 0.64 2.17
11 0.60 1.63 2.60 3.33 1.1 3.90 0.77 1.72
12 0.84 1.25 0.72 0.75 1.0 0.34 0.98 1.44
13 0.79 1.40 2.28 2.33 0.3 7.16 2.53 0.97
14 1.14 1.43 1.46 1.76 1.5 5.58 1.34 1.94
15 1.12 1.77 2.14 2.54 – 4.01 0.00 1.40
16 0.75 1.18 2.26 2.38 0.3 6.10 3.24 1.36
17 0.95 1.38 2.85 2.02 – 3.28 2.11 1.62
18 0.90 1.10 3.43 3.43 1.3 5.53 1.50 0.89
19 0.96 1.49 2.95 3.04 – 7.22 2.75 1.36
20 1.22 1.70 1.33 1.27 – 4.16 2.48 0.67
21 0.90 1.27 1.53 1.80 1.1 4.33 0.70 0.80
22 1.37 1.52 2.51 3.17 1.5 4.76 1.41 1.33
23 0.92 1.46 2.04 1.53 1.3 5.66 1.08 1.58
24 0.70 1.40 3.63 2.57 0.8 6.03 1.87 1.39
25 0.84 1.42 3.21 2.94 0.7 5.60 2.58 1.07
26 1.18 1.53 3.11 2.73 0.4 3.88 2.05 0.37
27 0.89 1.49 2.87 3.25 0.8 4.75 2.46 1.81
28a 1.22 1.74 1.37 1.38 – 4.13 2.56 0.18
29a 0.77 2.30 1.68 - - – 2.69
mean 0.97 1.46 2.53 2.46 0.68 5.03 1.91 1.25
aQualification based on k¼ 2 as only two replicate values provided.
STUTZMAN QUANTITATIVE ON X-RAY POWDER DIFFRACTION PROFICIENCY TESTING 138
Advances in Civil Engineering Materials

of sample preparation and data analysis factors are probably best studied with a sin-
gle laboratory using a ruggedness test. XRD proficiency testing may ultimately be
included in the CCRL proficiency test program as part of the test regime, and may
be considered as an addition to the existing ASTM C1365 qualification criteria as
part of a routine testing program.
ACKNOWLEDGMENTS
The time and efforts of the participants in this trial program, Robin Haupt of the
Cement and Concrete Reference laboratory for sample distribution and collecting
data, the assistance of Alan Heckert, NIST Statistical Engineering Division, with
Dataplot for ASTM E691 and E2489, and comments and suggestions of Stefan Leigh
and the anonymous reviewers of the manuscript are gratefully acknowledged. This
project was supported by the Early-Age Performance of Concrete project within the
Sustainable Engineering Materials program at NIST.
Participants
Eric Bowman Lafarge North America
Don Broton CTL Group, Inc.
Andy Chafin Heidelberg Technology Center,
Heidelberg, Germany
Clifton Coward Texas Department of Transportation
Jeffrey Hook Lehigh Portland Cement Co.
Joanne Leclerc Lafarge North America
Jo Lejeune Heidelberg Technology Center, Netherlands
Lila Lopez CEMEX Research Group AG
Oliver Maier Polysius AG
Joan Malcolm Lehigh Southwest Cement Co.
Dave Martin Ash Grove Cement Co.
Rita McKinley Halliburton Energy Services
Jeffery Nicolich W.R. Grace
Lars-Bo Nielsen F. L. Smidth A/S
Newell Norton California Portland Cement Company
Claudia Obispo Holcim El Salvador
Juan Parra Garcia Cemex Research Group AG
Scott Podhaisky Lafarge North America
Terry Ramlochan University of Toronto
Rainer Schmidt Bruker AXS GmbH
Paul Stutzman NIST
Willi Suter Holcim Group Support Ltd
Annick Tremblay Holcim (Canada), Inc.
Mike Trimble Buzzi Unicem USA
Yu Wen Tsang NYC Dept of Envir Protect-QA Lab
Howard Westbury Holcim Inc.
Shu Yang Colacem Canada
STUTZMAN QUANTITATIVE ON X-RAY POWDER DIFFRACTION PROFICIENCY TESTING 139
Advances in Civil Engineering Materials

References
[1] ASTM C1365: Standard Test Method for Determination of the Proportion of
Phases in Portland Cement and Portland-Cement Clinker Using X-Ray Powder
Diffraction, Annual Book of ASTM Standards, ASTM International, West
Conshohocken, PA, 2013.
[2] Stutzman, P. and Leigh, S., “Phase Analysis of Hydraulic Cements by X-Ray
Powder Diffraction: Precision, Bias, and Qualification,” J. ASTM Int., Vol. 4,
No. 5, 2007, 101085.
[3] Scarlett, N. V. Y. and Madsen, I. C., “Accuracy in X-Ray Powder Diffraction: A
Comparison of Quantitative Methods,” International Union of Crystallography
Commission on Powder Diffraction Newsletter No. 26, IUCr, Chester, UK, 2001,
pp. 21–23.
[4] Neubauer, J., Kuzel, H. J., and Sieber, R., “Rietveld Quantitative XRD
Analysis of Portland Cement: Part II Quantification of Synthetic and
Technical Portland Cement Clinkers,” Proceedings of the 18th International
Conference on Cement Microscopy, Houston, TX, pp. Apr. 21–25, 1996,
pp. 100–111.
[5] De la Torre, A. G. and Aranda, M. A. G., “Accuracy in Rietveld Quantitative
Phase Analysis of Portland Cements,” J. Appl. Crystall., Vol. 36, No. 5, 2003,
pp. 1169–1176.
[6] Leon-Reina, L., de la Torre, A. G., Porras-Vazquez, J. M., Cruz, M., Ordonez,
L. M., Alcobe, X., Guisbert-Guirado, F., Larranaga-Varga, A., Paul, M.,
Fuellmann, T., Schmidt, R., and Aranda, M. A. G., “Round Robin on Rietveld
Quantitative Phase Analysis of Portland Cements,” J. Appl. Crystall., Vol. 42,
2009, pp. 906–916.
[7] Stutzman, P., “Direct Determination of Phases in Portland Cements by
Quantitative X-Ray Powder Diffraction,” NIST Technical Note 1692, NIST,
Gaithersburg, MD, 2010.
[8] Youden, W. J., “Statistical Aspects of the Cement Testing Program,” Proc. Am.
Soc. Test. Mater., Vol. 59, 1959, pp. 1120–1128.
[9] Crandall, J. R. and Blaine, R. L., “Statistical Evaluation of Interlaboratory
Cement Tests,” Proc. Am. Soc. Test. Mater., Vol. 59, 1959, pp.
1129–1154.
[10] Haupt, R. K., 2010, “Final Report Portland Cement Proficiency Samples
Number 177 and Number 178,” http://www.ccrl.us/Psp/Reports/Portland
Cement Report177.pdf, (Last accessed 28 Jan 2014).
[11] ASTM E2489: Standard Practice for Statistical Analysis of One-Sample
and Two-Sample Interlaboratory Proficiency Testing Programs, Annual
Book of ASTM Standards, ASTM International, West Conshohocken, PA,
2013.
[12] ASTM E456: Standard Terminology Relating to Quality and Statistics, An-
nual Book of ASTM Standards, ASTM International, West Conshohocken,
PA, 2013.
[13] NIST, 1996, “Dataplot Manual, Trimmed Mean,” www.itl.nist.gov/
div898/software/dataplot/refman2/ch2/trimmean.pdf (Last accessed 28 Jan
2014).
STUTZMAN QUANTITATIVE ON X-RAY POWDER DIFFRACTION PROFICIENCY TESTING 140
Advances in Civil Engineering Materials

[14] ASTM E691: Standard Practice for Conducting an Interlaboratory Study
to Determine the Precision of a Test Method, Book of Standards, Annual
Book of ASTM Standards, ASTM International, West Conshohocken, PA,
2013.
[15] ASTM C150: Standard Specification for Portland Cement, Annual Book
of ASTM Standards, ASTM International, West Conshohocken, PA,
2013.
STUTZMAN QUANTITATIVE ON X-RAY POWDER DIFFRACTION PROFICIENCY TESTING 141
Advances in Civil Engineering MaterialsCopyright by ASTM Int’l (all rights reserved); Wed Mar 5 8:21:13 EDT 2014Downloaded/printed byPaul E. Stutzman (NIST, 100 Bureau Drive, Gaithersburg, Maryland, United States, 20899-8615)Pursuant to License Agreement. No further reproduction authorized.