advanced thermostat - publicservice.vermont.gov tie… · for calculation of savings see...
TRANSCRIPT

Advanced Thermostat
Version Date & Revision History
Draft date: 8/1/2017
Effective date: 1/1/2018
End date: TBD
Referenced Documents
1) VT-RES-New-Construction-On-Site-Final-Report-2-13-13
2) IL SAG Smart Thermostat Preliminary Gas Impact Findings 2015-12-08 to IL SAG
3) Studies informing the TRM Savings Characterization for Advanced Thermostats
4) VT SF Existing Homes Onsite Report_final 021513
5) Advanced Thermostat Analysis_04182017_FINAL
6) VGS Usage Regression Work_04182017
Description
This measure characterizes the household energy savings from the installation of a new thermostat(s)
for reduced heating consumption through a configurable schedule of temperature set-points (like a
programmable thermostat) and automatic variations to that schedule to better match HVAC system
runtimes to meet occupant comfort needs. These schedules may be defaults, established through user
interaction, and be changed manually at the device or remotely through a web or mobile app.
Automatic variations to that schedule could be driven by local sensors and software algorithms,
and/or through connectivity to an internet software service. Data triggers to automatic schedule
changes might include, for example: occupancy/activity detection, arrival & departure of
conditioned spaces, optimization based on historical or population-specific trends, weather data and
forecasts1. This class of products and services are relatively new, diverse, and rapidly changing.
Generally, the savings expected for this measure aren’t yet established at the level of individual
features, but rather at the system level and how it performs overall. Note that it is a very active area
of ongoing study to better map features to savings value, and establish standards of performance
measurement based on field data so that a standard of efficiency can be developed2. That work is not
yet complete but does inform the treatment of some aspects of this characterization and
recommendations.
Savings estimates are provided for Existing Homes and New Construction. Note all savings will be
claimed through Efficient Products, however the baseline for New Construction is a programmable
thermostat (due to code requirements) while the baseline for Existing Homes is assume to be a mix
of manual and programmable thermostats.
The measure assumes that the advanced thermostat is controlling a portion of the whole home’s
heating load. Efficiency Vermont will track and provide incentives for up to two advanced
thermostats per home.
1 For example, the capabilities of products and added services that use ultrasound, infrared, or geofencing
sensor systems, automatically develop individual models of home’s thermal properties through user interaction,
and optimize system operation based on equipment type and performance traits based on weather forecasts
demonstrate the type of automatic schedule change functionality that apply to this measure characterization. 2 The ENERGY STAR program discontinued its support for basic programmable thermostats effective
12/31/09, and is presently developing a new specification, ‘Connected Thermostats V1.0’. This measure will be
updated in 2017 to reflect the forthcoming final ENERGY STAR spec and performance values reported on the
qualified product list, as well as results from the Efficiency Vermont pilot (e.g. system run time, # zones per
home, # of smart thermostats installed, installation type).

The thermostat must be installed and connected with the manufacturer in order to be eligible for a
rebate.
Definition of Energy Transformation Equipment or Condition
The criteria for this measure are established by replacement of a manual-only or programmable
thermostat, with one that has the default enabled capability—or the capability to automatically—
establish a schedule of temperature setpoints according to driving device inputs above and beyond
basic time and temperature data of conventional programmable thermostats. As summarized in the
description, this category of products and services is broad and rapidly advancing in regards to their
capability, usability, and sophistication, but at a minimum must be capable of two-way
communication3 and exceed the typical performance of manual and conventional programmable
thermostats through the automatic or default capabilities described above.
Definition of Baseline Equipment or Condition
For existing homes the baseline is assumed to be a mix of programmable and manual thermostats
(67% manual and 33% programmable - based upon Vermont Single-Family Existing Homes Onsite
Report, 2/15/2013, ‘Table 5-13 Type of Thermostat’).
For New Construction, the baseline is a programmable thermostat.
Algorithms
Electric Energy Impacts
There are no electric energy impacts for this measure.
Demand Impacts
There are no demand impacts for this measure.
Fossil Fuel Impacts
ΔMMBtu = Σ (Heating_Consumption × %Controlled) × Heating_Reduction
Where:
MMBtu = Thermal savings from displacement of fossil fuels
%Controlled = Assumed percentage of total heating load being controlled by
thermostat.
= 69% for EH and 53% for RNC4
Heating_Consumption = Estimate of annual household heating consumption
3 This measure recognizes that field data may be available, through this 2-way communication capability, to
better inform characterization of efficiency criteria and savings calculations. Efficiency Vermont will be
exploring ways to better utilize this data once the program is underway and once the ENERGY STAR
specification and program process is finalized. 4 Based on review of # of thermostats per home data from Vermont Single-Family Existing Homes Onsite
Report, 2/15/2013 and Vermont Residential New Construction Baseline Study Analysis of On-Site Audits,
2/13/2013. See 'Advanced Thermostat Analysis_04182017_FINAL.xls'

Gas Heating Consumption (MMBtu)
Existing Homes5 New Construction6
Gas 81 67
Oil 84 70
Unknown 82 67
Heating_Reduction = Assumed percentage reduction in total household heating
energy consumption due to advanced thermostat
Program Existing Thermostat
Type
Heating
Reduction7
Existing Homes Unknown (Blended) 7.7%
New
Construction
Programmable 5.6%
Gross-to-Net Savings Factors
Table 1 - Gross-to-Net Savings Factors
Freerider Spillover
1.0 1.0
Persistence
The persistence factor is assumed to be one.
Lifetime
The expected measure life for advanced thermostats is assumed to be similar to that of a
programmable thermostat 10 years8 based upon equipment life only.
Measure Cost
For DI and other programs for which installation services are provided, the actual material, labor,
and other costs should be used, with a default of $265 ($225 for the thermostat and $40 for labor).
5 Estimate is based upon calculation of average heating load; (FLH * Capacity/1,000,000)/AFUE. FLH and
Capacity are based upon natural gas billing data analysis provided by Vermont Gas Systems (VGS) (see 'VGS
Usage Regression Work_04182017.xls'). AFUE assumptions are from Vermont Single-Family Existing Homes
Onsite Report, 2/15/2013. Note the FLH calculation attempts to isolate heating only consumption (removing
DHW and other loads). For calculation of savings see “Advanced Thermostat Analysis_04182017.xlsx”, for
details. 6 Estimate is based upon calculation of average heating load; (FLH * Capacity/1,000,000)/AFUE. FLH and
Capacity are based upon natural gas billing data analysis provided by Vermont Gas Systems (VGS) (see 'VGS
Usage Regression Work_04182017.xls'). AFUE assumptions are from Vermont Residential New Construction
Baseline Study Analysis of On-Site Audits, 2/13/2013. Note the FLH calculation attempts to isolate heating
only consumption (removing DHW and other loads). For calculation of savings see “Advanced Thermostat
Analysis_04182017.xlsx”, for details. 7 Savings of 8.8% for manual, and 5.6% for programmable thermostats as presented in Navigant’s PowerPoint
on Impact Analysis from Preliminary Gas savings findings (slide 28 of ‘IL SAG Smart Thermostat Preliminary
Gas Impact Findings 2015-12-08 to IL SAG.ppt’). These values are used as the basis for the weighted average
savings value for existing homes. The weighting of manual to programmable thermostats for when unknown is
based upon Vermont Single-Family Existing Homes Onsite Report, 2/15/2013, ‘Table 5-13 Type of
Thermostat’. 8 Table 1, HVAC Controls, Measure Life Report, Residential and Commercial/Industrial Lighting and HVAC
Measures, GDS
Associates, 2007

For retail, Bring Your Own Thermostat (BYOT) programs9, or other program types the average
incremental cost for the new installation measure is assumed to be $17510.
For new construction, the incremental cost between a programmable and advanced thermostat is
assumed to be $15011.
O&M Cost Adjustments
N/A
Savings Summary12
Blended Advanced Thermostat Savings
MMBtu 4.36
9 In contrast to program designs that utilize program affiliated contractors or other trade ally partners that
support customer participation through thermostat distribution, installation and other services, BYOT programs
enroll customers after the time of purchase through online rebate and program integration sign-ups. 10 Market prices vary considerably in this category, generally increasing with thermostat capability and
sophistication. The core suite of functions required by this measure's eligibility criteria are available on units
readily available in the market roughly in the range of $200 and $250, excluding the availability of any
wholesale or volume discounts. The assumed incremental cost is based on the middle of this range ($225) minus
a cost of $50 for the baseline equipment blend of manual and programmable thermostats. Note that any add-on
energy service costs, which may include one-time setup and/or annual per device costs are not included in this
assumption. 11 Assumed to be $225 minus $75 for programmable thermostat. 12 Summary can be found in analysis document: advanced-thermostat-analysis-Tier III.xlsx. This
blending analyzes the percent of homes in Vermont with heating systems of different fossil fuels and
assumed new construction installation factor.

Variable Speed Mini-Split Heat Pumps (Single-Zone) Version Date & Revision History
Draft date: 10/27/2017
Effective date: 1/1/2018
End date: TBD
Referenced Documents:
1. Navigant Consulting Inc. (2013). Incremental Cost Study Phase Two Final Report.
Burlington, MA: NEEP Evaluation, Measurement, and Verification Forum.
2. NMR Group, Inc. (2013). Vermont Single-Family Existing Homes Onsite Report
FINAL.
3. U.S. Department of Energy. (2010). Residential Heating Products Final Rule
Technical Support Document.
4. DPS CCHP Tier III- Final Final.pdf
5. Tier III TAG CCHP TRM Savings Calculation_Single and Multi Zone.xlsx
6. Cadmus, Evaluation of Cold Climate Heat Pumps in Vermont. Montpelier, VT:
Vermont Department of Public Service, July 31, 2017.
7. Upstream EVT CCHP Program Data_Cost Analysis.xlsx
Description
This measure claims savings for the installation of single-zone variable speed mini-split
heat pumps in a residential application. The measure is characterized as a retrofit claiming
thermal energy savings for heating. If the heat pump has integrated controls, the controls
must interact with the thermostatic sensor in the room and reduce short cycling.
Definition of Baseline Equipment or Condition
The baseline condition is assumed to be the existing fossil fuel heating system with the
following efficiency criteria:
Table 2 – Baseline Efficiency Criteria
Equipment AFUE
Existing Fossil Fuel
System
85%13
Definition of Energy Transformation Equipment or Condition
To qualify for savings under this measure the installed equipment must be a be a new heat
pump that is capable of providing heat using the heat pump cycle down to 5°F and meets
the following minimum efficiency criteria:
13 Weighted efficiencies based on VT SF Existing Homes Onsite Report Table 5-8 and 5-9. (NMR
Group, Inc., 2013). Efficiency for homes using wood or pellet stoves based on review of EPA-
Certified wood stoves. (U.S. Environmental Protection Agency, n.d.)

Table 3 – High Efficiency Criteria14
Equipment HSPF EER SEER
Air-Source Heat Pump 8.6 9.8 15.6
Algorithms
Electric Energy Impacts
Electric energy heating penalties include increases in electric consumption based on the
fuel switch. Seasonal efficiency values have been used to approximate varying system
efficiencies due to changes in operating conditions.
∆𝑘𝑊ℎ = − [𝐶𝑎𝑝𝑎𝑐𝑖𝑡𝑦 × 𝐸𝐹𝐿𝐻 × 1
𝐶𝑂𝑃 ×
1
3412] × %𝐹𝑜𝑠𝑠𝑖𝑙
Where:
ΔkWh = total net kWh penalties for heating and cooling (deemed
assumption for prescriptive savings, based on size category)
Capacity = max heating capacity of heat pump at 5 degrees F (Btu/hr)
EFLH = Equivalent Full Load Hours15
= 1355
COP = Actual Heating Seasonal Performance Factor (HSPF) converted
to COP
= 𝐻𝑆𝑃𝐹
3.412
%Fossil = Average percentage of fossil fuels in electric generation mix for
the program year, adjusted for measure lifetime. For electric
distribution utilities generating 100% of electricity from renewable
energy, %Fossil is 0%.
= Custom input from utility
Demand Impacts
14 Average efficiencies of all capacity bins. Based on analysis of Vermont distributor sales data
collected by Efficiency Vermont. Analysis can be found on the Analysis tab of the Tier III TAG
CCHP TRM Savings Calculation_Single and Multi Zone.xlsx. 15 EFLH is calculated in an analysis of heat pump metered data. This analysis can be found on the
EFLH Calculator tab in the Tier III TAG CCHP TRM Savings Calculation_Single and Multi
Zone.xlsx.
Demand penalties are calculated using the energy penalty divided by the equivalent full
load hours. Increased power draw for the efficient system compared to the baseline system
is treated as a demand penalty for heating.
∆𝑘𝑊 = −∆𝑘𝑊ℎ
𝐸𝐹𝐿𝐻
ΔkW = total average winter coincident peak kW increase
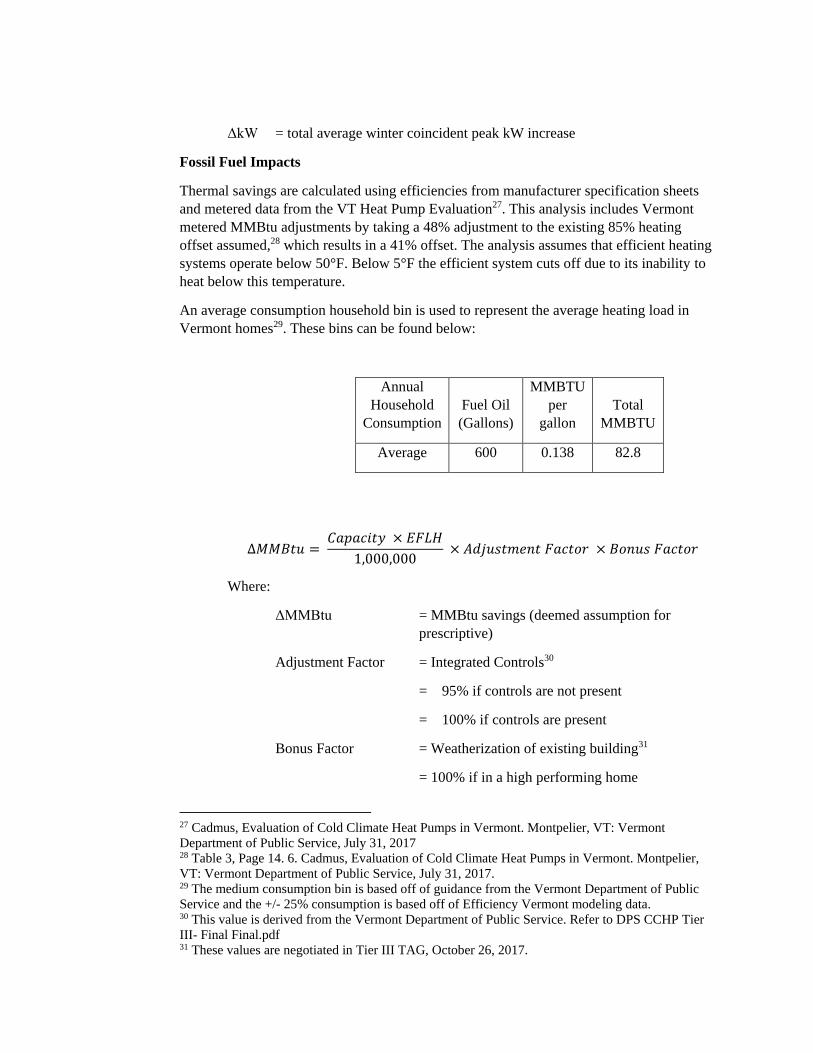
Fossil Fuel Impacts
Thermal savings are calculated using efficiencies from manufacturer specification sheets
and metered data from the VT Heat Pump Evaluation16. This analysis includes Vermont
metered MMBtu adjustments by taking a 48% adjustment to the existing 85% heating
offset assumed,17 which results in a 41% offset. The analysis assumes that efficient heating
systems operate below 50°F. Below 5°F the efficient system cuts off due to its inability to
heat below this temperature.
An average consumption household bin is used to represent the average heating load in
Vermont homes18. These bins can be found below:
Household
Consumption
Fuel Oil
(Gallons)
MMBTU
per
gallon
Total
MMBTU
Average 600 0.138 82.8
∆𝑀𝑀𝐵𝑡𝑢 = 𝐶𝑎𝑝𝑎𝑐𝑖𝑡𝑦 × 𝐸𝐹𝐿𝐻
1,000,000 × 𝐴𝑑𝑗𝑢𝑠𝑡𝑚𝑒𝑛𝑡 𝐹𝑎𝑐𝑡𝑜𝑟 × 𝐵𝑜𝑛𝑢𝑠 𝐹𝑎𝑐𝑡𝑜𝑟
Where:
ΔMMBtu = MMBtu savings (deemed assumption for
prescriptive)
Adjustment Factor = Integrated Controls19
= 95% if controls are not present
= 100% if controls are present
16 Cadmus, Evaluation of Cold Climate Heat Pumps in Vermont. Montpelier, VT: Vermont
Department of Public Service, July 31, 2017 17 Table 3, Page 14. 6. Cadmus, Evaluation of Cold Climate Heat Pumps in Vermont. Montpelier,
VT: Vermont Department of Public Service, July 31, 2017. 18 The medium consumption bin is based off of guidance from the Vermont Department of Public
Service and the +/- 25% consumption is based off of Efficiency Vermont modeling data. 19 This value is derived from the Vermont Department of Public Service. Refer to DPS CCHP Tier
III- Final Final.pdf

Bonus Factor = Weatherization of existing building20
= 100% if in a high performing home
= 81% if in a low performing home
Loadshape
Loadshape #116, Residential Variable Speed Mini-Split and Multi-Split Heat Pumps
Freeridership/Spillover Factors21
Measure Category HVAC
Product Description Efficient ductless mini-split, heat
pump
Freerider Spillover
Variable Speed Mini-
Split Heat Pumps
(Single-Zone) in Low
Performing Home
0.81 1.07
Persistence
The persistence factor is assumed to be one.
Lifetimes
The expected measure life is assumed to be 15 years.22
Measure Cost23
Measure cost represents the total installed cost of a CCHP with Tier III efficiencies.
20 These values are negotiated in Tier III TAG, October 26, 2017. 21 Negotiated between the DU’s and shall not have transferability to the Efficiency Vermont / EEU
TRM 22 California DEER Effective Useful Life values, updated October 10, 2008. Various sources range
from 12 to 20 years, DEER represented a reasonable mid-range. 23 Cost analysis of Vermont installed Cold Climate Heat Pumps through Efficiency Vermont’s
program. Distributor reported costs analyzed in Upstream Efficiency Vermont CCHP Program
Data_Cost Analysis.xlsx.

O&M Cost Adjustments
There are no operation and maintenance cost adjustments for this measure.
Net Impacts24
∆𝑀𝑊ℎ𝑁𝑒𝑡 = ∆𝑀𝑊ℎ𝐸𝑙𝑒𝑐𝑡𝑟𝑖𝑐 + ∆𝑀𝑊ℎ𝐹𝑜𝑠𝑠𝑖𝑙𝐹𝑢𝑒𝑙
24 Refer to Savings tab of Tier III Single Zone CCHPSavingsAnalysis Update.xlsx
Nominal
Equipment
Capacity (Btu/hr)
Retrofit
Costs
6,000
$2,759.80
9,000
$2,763.71
12,000
$2,761.05
15,000
$2,894.48
18,000
$3,132.36
24,000
$3,426.49

Variable Speed Mini-Split Multi Heat Pumps (Multi-Zone) Version Date & Revision History
Draft date: 10/27/2017
Effective date: 1/1/2018
End date: TBD
Referenced Documents:
1. Navigant Consulting Inc. Incremental Cost Study Phase Two Final Report.
Burlington, MA: NEEP Evaluation, Measurement, and Verification Forum, 2013.
2. NMR Group, Inc. "Vermont Single-Family Existing Homes Onsite Report
FINAL." 2013.
3. U.S. Environmental Protection Agency. n.d.
http://www.epa.gov/burnwise/woodstoves.html (accessed March 7, 2014).
4. DPS CCHP Tier III- Final Final.pdf
5. Tier III TAG CCHP TRM Savings Calculation_Single and Multi Zone.xlsx
6. Cadmus, Evaluation of Cold Climate Heat Pumps in Vermont. Montpelier, VT:
Vermont Department of Public Service, July 31, 2017.
7. Upstream EVT CCHP Program Data_Cost Analysis.xlsx
Description
This measure claims savings for the installation of multi-zone variable speed mini-split heat
pumps in a residential application. The measure is characterized as a retrofit claiming
thermal energy savings for heating. If the heat pump has integrated controls, the controls
must interact with the thermostatic sensor in the room and reduce short cycling.
Definition of Baseline Equipment or Condition
The baseline condition is assumed to be the existing fossil fuel heating system with the
following efficiency criteria:
Table 4 – Baseline Efficiency Criteria
Equipment AFUE
Existing Fossil Fuel
System
85%25
Definition of Energy Transformation Equipment or Condition
To qualify for savings under this measure the installed equipment must be a be a new heat
pump that is capable of providing heat using the heat pump cycle down to 5°F and meets
the following minimum efficiency criteria:
Table 5 – High Efficiency Criteria
25 Weighted efficiencies based on VT SF Existing Homes Onsite Report Table 5-8 and 5-9. (NMR
Group, Inc., 2013). Efficiency for homes using wood or pellet stoves based on review of EPA-
Certified wood stoves. (U.S. Environmental Protection Agency, n.d.)

Equipment HSPF EER SEER
Air-Source Heat Pump 8.2 12 14.5
Algorithms
Electric Energy Impacts
Electric energy heating penalties include increases in electric consumption based on the
fuel switch. Seasonal efficiency values have been used to approximate varying system
efficiencies due to changes in operating conditions.
∆𝑘𝑊ℎ = − [𝐶𝑎𝑝𝑎𝑐𝑖𝑡𝑦 × 𝐸𝐹𝐿𝐻 × 1
𝐶𝑂𝑃 ×
1
3412] × %𝐹𝑜𝑠𝑠𝑖𝑙
Where:
ΔkWh = total net kWh penalties for heating and cooling (deemed
assumption for prescriptive savings, based on size category)
Capacity = max heating capacity of heat pump at 5 degrees F (Btu/hr)
EFLH = Equivalent Full Load Hours26
= 1355
COP = Actual Heating Seasonal Performance Factor (HSPF) converted
to COP
= 𝐻𝑆𝑃𝐹
3.412
%Fossil = Average percentage of fossil fuels in electric generation mix for
the program year, adjusted for measure lifetime. For electric
distribution utilities generating 100% of electricity from renewable
energy, %Fossil is 0%.
= Custom input from utility
Demand Impacts
Demand penalties are calculated using the energy penalty divided by the equivalent full
load hours. Increased power draw for the efficient system compared to the baseline system
is treated as a demand penalty for heating.
∆𝑘𝑊 = −∆𝑘𝑊ℎ
𝐸𝐹𝐿𝐻
26 EFLH is calculated in an analysis of heat pump metered data. This analysis can be found on the
EFLH Calculator tab in the Tier III TAG CCHP TRM Savings Calculation_Single and Multi
Zone.xlsx.
ΔkW = total average winter coincident peak kW increase
Fossil Fuel Impacts
Thermal savings are calculated using efficiencies from manufacturer specification sheets
and metered data from the VT Heat Pump Evaluation27. This analysis includes Vermont
metered MMBtu adjustments by taking a 48% adjustment to the existing 85% heating
offset assumed,28 which results in a 41% offset. The analysis assumes that efficient heating
systems operate below 50°F. Below 5°F the efficient system cuts off due to its inability to
heat below this temperature.
An average consumption household bin is used to represent the average heating load in
Vermont homes29. These bins can be found below:
Annual
Household
Consumption
Fuel Oil
(Gallons)
MMBTU
per
gallon
Total
MMBTU
Average 600 0.138 82.8
∆𝑀𝑀𝐵𝑡𝑢 = 𝐶𝑎𝑝𝑎𝑐𝑖𝑡𝑦 × 𝐸𝐹𝐿𝐻
1,000,000 × 𝐴𝑑𝑗𝑢𝑠𝑡𝑚𝑒𝑛𝑡 𝐹𝑎𝑐𝑡𝑜𝑟 × 𝐵𝑜𝑛𝑢𝑠 𝐹𝑎𝑐𝑡𝑜𝑟
Where:
ΔMMBtu = MMBtu savings (deemed assumption for
prescriptive)
Adjustment Factor = Integrated Controls30
= 95% if controls are not present
= 100% if controls are present
Bonus Factor = Weatherization of existing building31
= 100% if in a high performing home
27 Cadmus, Evaluation of Cold Climate Heat Pumps in Vermont. Montpelier, VT: Vermont
Department of Public Service, July 31, 2017 28 Table 3, Page 14. 6. Cadmus, Evaluation of Cold Climate Heat Pumps in Vermont. Montpelier,
VT: Vermont Department of Public Service, July 31, 2017. 29 The medium consumption bin is based off of guidance from the Vermont Department of Public
Service and the +/- 25% consumption is based off of Efficiency Vermont modeling data. 30 This value is derived from the Vermont Department of Public Service. Refer to DPS CCHP Tier
III- Final Final.pdf 31 These values are negotiated in Tier III TAG, October 26, 2017.

= 81% if in a low performing home
Loadshape
Loadshape #116, Residential Variable Speed Mini-Split and Multi-Split Heat Pumps
Table 6 – Freeridership/Spillover Factors32
Measure Category HVAC
Product Description Efficient ductless mini-
split, multi head heat
pump
Freerider Spillover
Variable Speed Mini-Split Multi
Heat Pumps
0.81 1.07
Persistence
The persistence factor is assumed to be one.
Lifetimes
The expected measure life is assumed to be 15 years.33
Measure Cost 34
Measure cost represents the installed cost of a multi head CCHP with Tier III efficiencies.
Nominal
Equipment
Capacity (Btu/hr) Total Cost
18,000 $3,494.93
24,000 $3,991.69
30,000 $3,754.15
36,000 $4,342.63
42,000 $5,036.26
48,000 $5,481.42
32 Negotiated between the DU’s and shall not have transferability to the Efficiency Vermont / EEU
TRM 33 California DEER Effective Useful Life values, updated October 10, 2008. Various sources range
from 12 to 20 years, DEER represented a reasonable mid-range. 34 Cost analysis of Vermont installed Cold Climate Heat Pumps through Efficiency Vermont’s
program. Distributor reported costs analyzed in Upstream Efficiency Vermont CCHP Program
Data_Cost Analysis.xlsx.

O&M Cost Adjustments
There are no operation and maintenance cost adjustments for this measure.
Net Impacts35
∆𝑀𝑊ℎ𝑁𝑒𝑡 = ∆𝑀𝑊ℎ𝐸𝑙𝑒𝑐𝑡𝑟𝑖𝑐 + ∆𝑀𝑊ℎ𝐹𝑜𝑠𝑠𝑖𝑙𝐹𝑢𝑒𝑙
35 ∆𝑀𝑊ℎ is calculated annual savings. Refer to Savings tab of Tier III Multi Zone
CCHPSavingsAnalysis Update.xlsx

Electric Bicycles
Version Date & Revision History
Draft date: 8/27/2017
Effective date: 1/1/2018
End date: TBD
Referenced Documents
1. VTRANS, “The Vermont Transportation Energy Profile,” October 2015
Description
This is a time of sale measure that applies to the purchase of a new electric bicycle to partially
displace usage of a new, conventional gasoline-powered or diesel vehicle. The measure assumes the
electric bicycle will be used to commute to or from work or social activities or to complete errands.
Electric bicycle usage for exercise or recreation is not included in measure impacts.
Definition of Energy Transformation Equipment or Condition
The energy transformation equipment must be a new electric bicycle.
Definition of Baseline Equipment or Condition
The baseline equipment is a new, conventional gasoline-powered or diesel vehicle.
Algorithms
Demand Impacts
Demand impacts are estimated to be TBD.
Electric Energy Impacts
Using the algorithm and assumptions below, deemed electric impacts for an electric bicycle are 0.03
MWh.
∆𝑀𝑊ℎ𝐸𝑙𝑒𝑐𝑡𝑟𝑖𝑐 = (𝐷𝐷𝑀 𝑥 𝑊ℎ/𝑚𝑖𝑙𝑒) /1,000,000
Where:
MWhElectric = Gross customer annual electric energy impacts for the measure
DDM = Displaced driving miles, or number of conventional vehicle miles
displaced by the electric bicycle annually
=1,286 miles36
Wh/mile = Electric efficiency (Wh/mile) of new electric bicycle
= 20 Wh/mile37
36 Displaced driving miles (DDM) were calculated using data from a 2017 electric bicycle survey conducted by
VEIC. DDM = (annual electric bicycle mileage for non-exercise or recreation purposes) x (% vehicle travel
reduction). Values for “%vehicle travel reduction” were assigned based on the survey question “Prior to
owning an E-bike would you typically have been driving to those places instead?” Responses were Often
(75%), Sometimes (50%), Rarely (12%), and Never (0%). 37 Average electric efficiency from Ithaca’s Boxy Bikes (http://boxybikes.com/learn/) and electricbike.com
(https://www.electricbike.com/watt-hours/).

1,000,000 = Factor to convert Wh to MWh
Fossil Fuel Impacts
Using the algorithm and assumptions below, deemed fossil fuel impacts for an electric bicycle are
6.159 MMBtu.
∆𝑀𝑀𝐵𝑡𝑢 = 𝐷𝐷𝑀/ 𝐸𝐹𝐹𝐹𝑢𝑒𝑙 𝑥 121,160)/1,000,000
Where:
MMBtu = Thermal savings from displacement of fossil fuels
EFFFuel = Fuel efficiency (miles/gallon or MPG) of new, conventional, light-duty
vehicle
= 25.3 MPG38
121,160 = Weighted average energy content (Btu/gallon) of gasoline and diesel in
Vermont privately-owned vehicle fleet39
1,000,000 = Factor to convert Btu to MMBtu
Other factors as defined above.
Loadshape
N/A
Gross-to-Net Savings Factors
Measure Category Transportation
Product Description Electric Bicycles
Measure Code TRNEBKE
Track Name Track No. Spillover Freerider
TBD TBD 1.0 1.0
Persistence
The persistence factor is assumed to be one.
Lifetime
The lifetime of an electric bicycle is assumed to be 8 years.
38 Sales-weighted average miles per gallon of model year 2015 vehicles, calculated in University of Michigan
Transportation Research Institute Eco-driving Index: http://www.umich.edu/~umtriswt/EDI_sales-weighted-
mpg.html. This average includes all light duty vehicles (cars, SUVs, pick-up trucks) and may include a small
number of alternative fuel vehicles. 39 Weight average based on energy content of gasoline and diesel from “Fuel Conversion Factors” provided by
the Vermont Department of Public Service. The privately owned vehicle fleet in Vermont consists of 94.5%
gasoline-powered vehicles and 5.3% diesel-powered vehicles. See Figure 3.1 from VTRANS, “The Vermont
Transportation Energy Profile,” October 2015.

Measure Cost
The measure cost is the average retail price of a new electric bicycle: $2,825.40
O&M Cost Adjustments
O&M costs for electric bicycles compared to new, conventional vehicles are presented in the table
below along with incremental lifetime O&M savings.
Conventional Vehicle
O&M Cost
Electric Bicycle O&M
Cost
Incremental Lifetime
O&M Costs
$7741 $137.5042 $484
40 The measure cost is the average of new electric bicycle prices from Electric Bike Review (average of $3,300
for 2016 cruiser, mountain, road, city, folding, and cargo electric bicycles) and Electric Bike Report (price
range of $500-$10,000+; average of $2,350 for a quality electric bicycle). 41 Annual O&M cost for conventional vehicles is annual displaced driving miles (1,286 miles) x $0.0597/mile
(average cost for maintenance and tires from AAA, “Your Driving Costs: How Much Are You Really Paying to
Drive?” 2013, page 7. 42 Electric bicycle O&M includes annual tune-up (based on Pedego maintenance schedule:
http://www.pedegocotswolds.com/maintenance-videos/) at $75 (Electric Bike Review) and battery replacement
every 4 years (http://www.pedegoelectricbikes.com/battery-details/#start) at $500 (Electric Bike Review).

Commercial Electric Vehicles
Version Date & Revision History Draft date: 8/27/2017
Effective date: 1/1/2018
End date: TBD
Referenced Documents
1. U.S. Department of Transportation, "Bus Lifecycle Cost Model for Federal Land Management
Agencies”
2. Columbia University, "Electric Bus Analysis for New York City Transit," May 2016.
3. U.S. Dept. of Transportation Federal Transit Administration (FTA), “Useful Life of Transit
Buses and Vans, Report No. FTA VA-26-7229-07.1,” April 2007 4. "Benefits of Zero Emissions School Buses," July 20, 2016
5. SAIC, “Transit Cooperative Research Program Report 146: Guidebook for Evaluating Fuel
Choices for Post-2010 Transit Bus Procurements,” 2011
6. NREL, “Foothill Transit Battery Electric Bus Demonstration Results,” Jan 2016
Description
This is a time of sale measure that applies to the purchase of a new, commercial, all-electric vehicle
instead of a new, commercial, conventional gasoline-powered or diesel vehicle. The measure
characterizes transit buses, school buses, and paratransit vehicles.
Definition of Energy Transformation Equipment or Condition
The energy transformation equipment must be a new commercial, all-electric vehicle.
Definition of Baseline Equipment or Condition
The baseline equipment for paratransit vehicles is a new, conventional gasoline-powered paratransit
vehicle. The baseline equipment for transit and school buses is a new, conventional diesel-powered
transit or school bus.
Algorithms
Demand Impacts
Demand impacts are estimated to be TBD.
Electric Energy Impacts
∆𝑀𝑊ℎ𝐸𝑙𝑒𝑐𝑡𝑟𝑖𝑐 = 𝑉𝑀𝑇 𝑥 𝐸𝐹𝐹𝐸𝑙𝑒𝑐𝑡𝑟𝑖𝑐/1,000
Where:
MWhElectric = Gross customer annual electric energy impacts for the measure
VMT = Annual vehicle miles traveled
= Custom input
EFFElectric = Electric efficiency (kWh/mile) of new electric vehicle
= Custom Input
1,000 = Factor to convert kWh to MWh

Fossil Fuel Impacts
∆𝑀𝑀𝐵𝑡𝑢 = 𝑉𝑀𝑇/ 𝐸𝐹𝐹𝐹𝑢𝑒𝑙 𝑥 𝐵𝑡𝑢/𝐺𝑎𝑙𝑙𝑜𝑛)/1,000,000
Where:
MMBtu = Thermal savings from displacement of fossil fuels
EFFFuel = Fuel efficiency (miles/gallon or MPG) of new, commercial, conventional
gasoline-powered or diesel vehicle
Vehicle Type EFFConventionalFuel
Transit Bus 4.27 MPG43
School Bus 7 MPG44
Paratransit Vehicle 7.69 MPG45
Btu/Gallon = Weighted average energy content (Btu/gallon) of fuel used in baseline
vehicle46
Vehicle Type Btu/Gallon
Transit Bus and School Bus
(diesel)
137,500
Paratransit Vehicle (gasoline) 120,500
1,000,000 = Factor to convert Btu to MMBtu
Other factors as defined above.
Loadshape
N/A
43 Diesel transit bus efficiency based on 29,900 annual VMT and 7,000 gallons of fuel per year from Burlington
Electric Department's November 7, 2016 filing in docket 8550. A similar value (4 MPG) can be found in U.S.
Department of Transportation, "Bus Lifecycle Cost Model for Federal Land Management Agencies.” 44 Diesel school bus efficiency from "Bus Lifecycle Cost Model for Federal Land Management Agencies.” 45 Gasoline paratransit vehicle efficiency from U.S. DOE’s Alternative Fuels Data Center, based on Federal
Highway Administration Table VM-1 and American Public Transit Association's Public Transportation Fact
Book Tables 6, 7, and 20: https://www.afdc.energy.gov/data/10310 46 Energy content of diesel for transit and school buses and gasoline for paratransit vehicles from “Fuel
Conversion Factors” provided by the Vermont Department of Public Service.

Gross-to-Net Savings Factors
Measure Category Transportation Transportation Transportation
Product Description Electric Transit Bus Electric School Bus Electric Paratransit
Vehicle
Measure Code TRNETBUS TRNESBUS TRNEPARA
Track Name Track No. Spillover Freerider Freerider Spillover Freerider Spillover
TBD TBD 1.0 1.0 1.0 1.0 1.0 1.0
Persistence
The persistence factor is assumed to be one.
Lifetime
The lifetime of each commercial electric vehicle is shown in the table below.
Vehicle Type Lifetime
Transit Bus and School Bus 12 years47
Paratransit Vehicle 8 years48
Measure Cost
The measure cost is the incremental cost difference between a new, commercial, conventional
gasoline-powered or diesel vehicle (see table below) and a new commercial electric vehicle (custom
input).
Vehicle Type Baseline Cost
Transit Bus $450,00049
School Bus $128,79650
Paratransit Vehicle $75,00051
47 Bus lifetime from Columbia University, "Electric Bus Analysis for New York City Transit," May 2016. 48 Paratransit vehicle lifetime from U.S. Dept. of Transportation Federal Transit Administration (FTA), “Useful
Life of Transit Buses and Vans, Report No. FTA VA-26-7229-07.1,” April 2007, Table ES-2. 49 Price of new diesel transit bus from "Electric Bus Analysis for New York City Transit.” 50 Price of new diesel school bus is MSRP with 8% sales tax removed, from webinar "Benefits of Zero
Emissions School Buses," July 20, 2016. 51 Price of new gasoline paratransit vehicle from FTA, “Useful Life of Transit Buses and Vans.”

O&M Cost Adjustments
O&M costs for electric vehicles compared to new, conventional vehicles are presented in the table
below along with incremental lifetime O&M savings. Electric vehicles require minimal
maintenance for batteries, motors, and associated electronics, require fewer fluid changes than
conventional vehicles, have fewer moving parts, and experience less brake wear due to regenerative
braking.
Vehicle Type Conventional Vehicle
O&M Cost ($/mile)
Electric Vehicle
O&M Cost ($/mile)
Incremental Lifetime
O&M Savings
Transit Bus $0.59/mile52 $0.36/mile53 $0.23/mile x VMT x
12 years
School Bus $0.50/mile54 $0.16/mile55 $0.34/mile x VMT x
12 years
Paratransit Vehicle $1.00/mile56 $0.33/mile57 $0.67/mile x VMT x 8
years
52 Maintenance cost for diesel transit buses from SAIC, “Transit Cooperative Research Program Report 146:
Guidebook for Evaluating Fuel Choices for Post-2010 Transit Bus Procurements,” 2011. 53 Maintenance cost for electric transit buses based on “Transit Cooperative Research Program Report 146:
Guidebook for Evaluating Fuel Choices for Post-2010 Transit Bus Procurements.” The report estimates the cost
of maintaining a diesel transit bus at between $0.47 and $0.72 per mile. Of these costs, between $0.17 and $0.35
per mile can be attributed to maintaining braking and propulsions systems. Using this data, VEIC used the mid-
point maintenance cost for diesel buses ($0.59) and subtracted $0.23 per mile (braking and propulsion system
costs) to estimate the cost of maintaining electric buses at $0.36 per mile. 54 Maintenance cost for diesel school buses from fleet data reported in the February 3, 2016 issue of School
Transportation News. 55 Maintenance cost for electric school buses from NREL, “Foothill Transit Battery Electric Bus Demonstration
Results,” Jan 2016. 56 Maintenance cost for gasoline paratransit vehicles from U.S. Department of Transportation, "Bus Lifecycle
Cost Model for Federal Land Management Agencies,” page 6. 57 Maintenance cost for electric paratransit vehicles based on statement from Motiv Power Systems
representative.

Low Flow Faucet Aerator Version Date & Revision History
Draft date: 10/15/2017
Effective date: 1/1/2018
End date: TBD
Referenced Documents:
1. Schultdt, Marc, and Debra Tachibana, "Energy Related Water Fixture Measurements:
Securing the Baseline for Northwest Single Family Homes. 2008 ACEEE Summer Study
on Energy Efficiency in Buildings," 2008.
2. Cadmus and Opinion Dynamics, for the Michigan Evaluation Working Group,
"Showerhead and Faucet Aerator Meter Study Memorandum," June 2013.
3. U.S. Census Bureau_ACS Table DP04 VT_2015.pdf.
4. Navigant Consulting, Inc. for the Ontario Energy Board, "Measures and Assumptions for
Demand Side Management Planning, Appendix C: Substantiation Sheets," April 16, 2009.
5. U.S. DOE Standard Building America DHW Schedules, May 2014.
6. Navigant, "energySMART Energy Savings Kits, GPY 4 Evaluation Report (FINAL),"
April 29, 2016.
7. Cadmus, "Ameren Missouri Efficient Products Impact and Process Evaluation: PY
2015," May 13, 2016.
8. NMR Group, Survey Analysis of Owners in Existing Homes in Vermont (Draft)," Dec
2016.
9. DEER2014-EUL-table-update_2014-02-05.xlsx.
Description
This measure relates to the installation of a low flow faucet aerator in a single family home
or multifamily building. Low flow faucet aerators reduce the consumption of hot water and
as a result, the energy required to heat it. The measure applies to retrofit direct install
implementation or to free giveaways.
Definition of Energy Transformation Equipment or Condition
The energy transformation equipment is a faucet aerator with a flow rate of
1.5 gpm. Savings assumptions include a 0.95 throttling factor for new faucets to account
for the fact that faucets are not always operated at full flow, reducing the flow rate to 0.95
gpm.
Definition of Baseline Equipment or Condition
The baseline equipment is assumed to be a standard faucet aerator with a flow rate of 2.2
gpm. Savings assumptions include a 0.83 throttling factor for baseline faucets to account

for the fact that faucets are not always operated at full flow, reducing the flow rate to
1.83 gpm.
Algorithms
Demand Impacts
N/A
Electric Energy Impacts
N/A
Fossil Fuel Impacts
∆𝑀𝑀𝐵𝑡𝑢 = (((𝐺𝑃𝑀𝑏𝑎𝑠𝑒 𝑥 𝑇ℎ𝑟𝑜𝑡𝑡𝑙𝑒𝑏𝑎𝑠𝑒) − (𝐺𝑃𝑀𝑙𝑜𝑤 𝑥 𝑇ℎ𝑟𝑜𝑡𝑡𝑙𝑒𝑙𝑜𝑤)) 𝑥 𝑇𝑝𝑒𝑟𝑠𝑜𝑛/
𝑑𝑎𝑦 𝑥 # 𝑝𝑒𝑜𝑝𝑙𝑒 𝑥 𝑢𝑠𝑒𝑑𝑎𝑦𝑠/ 𝑦𝑒𝑎𝑟 𝑥 𝐷𝑅 𝑥 8.3 𝑥 1.0 𝑥 (𝑇𝐸𝑀𝑃𝑓𝑎𝑢𝑐𝑒𝑡 − 𝑇𝐸𝑀𝑃𝑖𝑛)/
1,000,000/𝜂𝐹𝑢𝑒𝑙_𝐷𝐻𝑊) 𝑥 𝐼𝑆𝑅 𝑥 %𝐹𝑢𝑒𝑙_𝐷𝐻𝑊
Where:
MMBtu = Annual thermal savings from displacement of fossil fuels
GPMbase = Flow rate (gpm) of baseline faucet
= 2.258
Throttlebase = Ratio of user setting to full-throttle flow rate for baseline faucet
= 0.8359
GPMlow = Flow rate (gpm) of low flow faucet
= 1.560
Throttlelow = Ratio of user setting to full-throttle flow rate for low flow faucet
= 0.9561
Tperson/day = Average daily length of use per person, per faucet (min/person/faucet)
= 1.662
# people = Average number of people per household
58 Federal standard for faucets, 10 CFR 430.32(o) 59 Schultdt, Marc, and Debra Tachibana, "Energy Related Water Fixture Measurements: Securing the
Baseline for Northwest Single Family Homes. 2008 ACEEE Summer Study on Energy Efficiency in
Buildings," 2008, page 1-265. 60 Federal standard for faucets, 10 CFR 430.32(o) 61 Schultdt, Marc, and Debra Tachibana, "Energy Related Water Fixture Measurements: Securing the
Baseline for Northwest Single Family Homes. 2008 ACEEE Summer Study on Energy Efficiency in
Buildings," 2008, page 1-265. 62 Cadmus and Opinion Dynamics, for the Michigan Evaluation Working Group, "Showerhead and
Faucet Aerator Meter Study Memorandum," June 2013, Table 6, page 10.
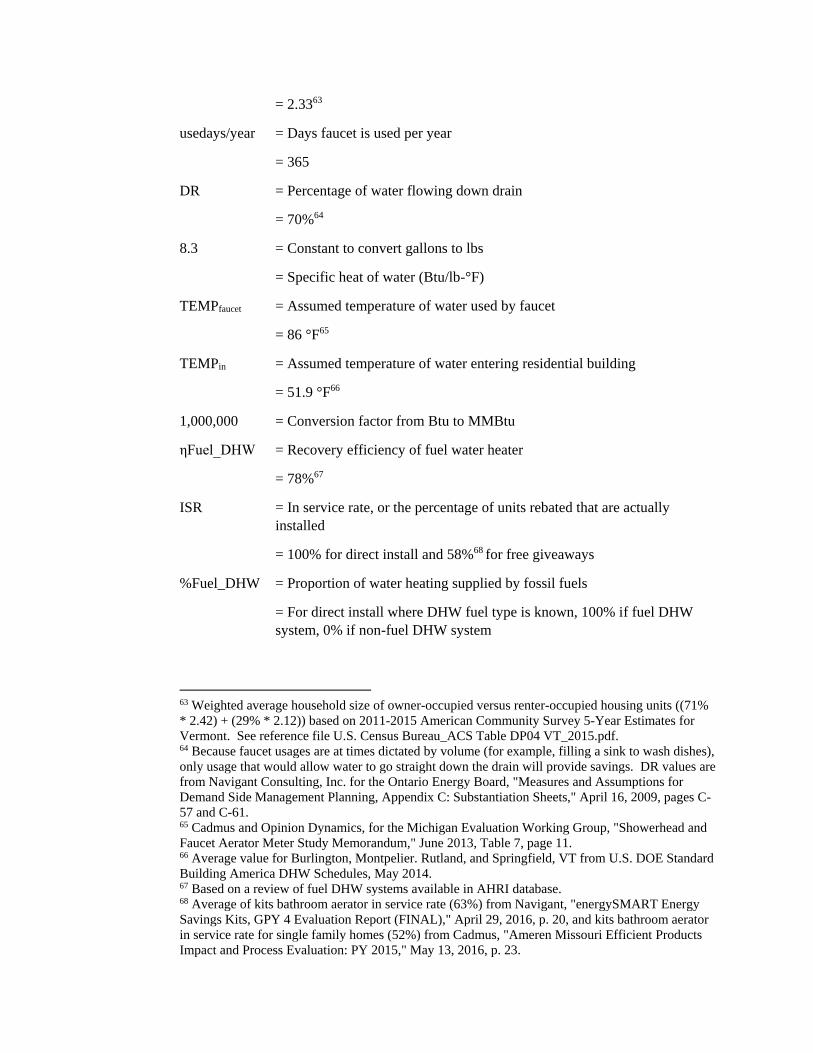
= 2.3363
usedays/year = Days faucet is used per year
= 365
DR = Percentage of water flowing down drain
= 70%64
8.3 = Constant to convert gallons to lbs
= Specific heat of water (Btu/lb-°F)
TEMPfaucet = Assumed temperature of water used by faucet
= 86 °F65
TEMPin = Assumed temperature of water entering residential building
= 51.9 °F66
1,000,000 = Conversion factor from Btu to MMBtu
ηFuel_DHW = Recovery efficiency of fuel water heater
= 78%67
ISR = In service rate, or the percentage of units rebated that are actually
installed
= 100% for direct install and 58%68 for free giveaways
%Fuel_DHW = Proportion of water heating supplied by fossil fuels
= For direct install where DHW fuel type is known, 100% if fuel DHW
system, 0% if non-fuel DHW system
63 Weighted average household size of owner-occupied versus renter-occupied housing units ((71%
* 2.42) + (29% * 2.12)) based on 2011-2015 American Community Survey 5-Year Estimates for
Vermont. See reference file U.S. Census Bureau_ACS Table DP04 VT_2015.pdf. 64 Because faucet usages are at times dictated by volume (for example, filling a sink to wash dishes),
only usage that would allow water to go straight down the drain will provide savings. DR values are
from Navigant Consulting, Inc. for the Ontario Energy Board, "Measures and Assumptions for
Demand Side Management Planning, Appendix C: Substantiation Sheets," April 16, 2009, pages C-
57 and C-61. 65 Cadmus and Opinion Dynamics, for the Michigan Evaluation Working Group, "Showerhead and
Faucet Aerator Meter Study Memorandum," June 2013, Table 7, page 11. 66 Average value for Burlington, Montpelier. Rutland, and Springfield, VT from U.S. DOE Standard
Building America DHW Schedules, May 2014. 67 Based on a review of fuel DHW systems available in AHRI database. 68 Average of kits bathroom aerator in service rate (63%) from Navigant, "energySMART Energy
Savings Kits, GPY 4 Evaluation Report (FINAL)," April 29, 2016, p. 20, and kits bathroom aerator
in service rate for single family homes (52%) from Cadmus, "Ameren Missouri Efficient Products
Impact and Process Evaluation: PY 2015," May 13, 2016, p. 23.

= For direct install where DHW fuel type is unknown or for free
giveaways, assume 73%:69
Deemed fossil fuel impacts are shown in the table below, based on program
implementation.
Program Type MMBtu
Direct Install (DHW fuel known) 0.1386 MMBtu
Direct Install (DHW fuel unknown) 0.1012 MMBtu
Free Giveaways 0.0587 MMBtu
Loadshape
N/A
Gross-to-Net Savings Factors
Measure Category Hot Water
Product Description Low Flow Faucet Aerator
Measure Code HWEFAUCT
Track Name Track No. Freerider Spillover
LISF Retrofit 6034LISF 1.0 1.0
Res Retrofit 6036RETR 0.90 1.0
Persistence
The persistence factor is assumed to be one.
Lifetimes
10 years70
Measure Cost
For direct install implementation, the measure cost is the actual material and labor cost of installing
the new aerator. If actual costs are unknown, assume a full install cost of $8 (market research
average of $3 for faucet aerator and assess and install cost of $5.00, based on 20 minutes of labor at
$15/hour).
For free giveaways, assume a measure cost of $3 (market research average).
69 Percentage of DHW fuels for free products giveaways based on data received by Efficiency
Vermont on 08/21/2017 from NMR Group, Survey Analysis of Owners in Existing Homes in
Vermont (Draft)," Dec 2016. 70 Measure lifetime from California DEER. See file DEER2014-EUL-table-update_2014-02-
05.xlsx.

O&M Cost Adjustments
There are no operation and maintenance cost adjustments for this measure.

Low Flow Faucet Showerhead Version Date & Revision History
Draft date: 10/15/2017
Effective date: 1/1/2018
End date: TBD
Referenced Documents:
1. Cadmus and Opinion Dynamics, for the Michigan Evaluation Working Group,
"Showerhead and Faucet Aerator Meter Study Memorandum," June 2013.
2. U.S. Census Bureau_ACS Table DP04 VT_2015.pdf.
3. U.S. DOE Standard Building America DHW Schedules, May 2014.
4. DEER2014-EUL-table-update_2014-02-05.xlsx.
Description
This measure characterizes the installation of a low flow (1.5 gallons per minute, or gpm)
showerhead in a single family home or a multifamily building. The measure applies to
direct install implementation.
Definition of Energy Transformation Equipment or Condition
The energy transformation equipment is an energy efficient showerhead using 1.5 gpm.
Definition of Baseline Equipment or Condition
The baseline equipment is a standard showerhead using 2.5 gpm.
Algorithms
Demand Impacts
N/A
Electric Energy Impacts
N/A
Fossil Fuel Impacts
∆𝑀𝑀𝐵𝑡𝑢 = ((𝐺𝑃𝑀𝑏𝑎𝑠𝑒 − 𝐺𝑃𝑀𝑙𝑜𝑤) 𝑥 𝑇𝑠ℎ𝑜𝑤𝑒𝑟 𝑥 # 𝑝𝑒𝑜𝑝𝑙𝑒 𝑥 # 𝑠ℎ𝑜𝑤𝑒𝑟𝑠 𝑥 𝑢𝑠𝑒𝑑𝑎𝑦𝑠/
𝑦𝑒𝑎𝑟 / 𝑆𝐻/ℎ𝑜𝑚𝑒) 𝑥 8.3 𝑥 1.0 𝑥 (𝑇𝐸𝑀𝑃𝑠ℎ − 𝑇𝐸𝑀𝑃𝑖𝑛)/𝜂𝐹𝑢𝑒𝑙_𝐷𝐻𝑊/1,000,000
Where:
MMBtu = Annual thermal savings from displacement of fossil fuels
GPMbase = Flow rate (gpm) of baseline showerhead

= 2.571
GPMlow = Flow rate (gpm) of low flow showerhead
= 1.5
Tshower = Average shower length in minutes
= 7.872
# people = Average number of people per household
= 2.3373
# showers = Showers per person per day
= 0.674
usedays/year = Days faucet is used per year
= 365
SH/home = Average number of showerheads per household
= 1.375
8.3 = Constant to convert gallons to lbs
= Specific heat of water (Btu/lb-°F)
TEMPsh = Assumed temperature of water coming from showerhead
= 101 °F76
TEMPin = Assumed temperature of water entering residential building
71 The Energy Policy Act of 1992 (EPAct) established the maximum flow rate for showerheads at
2.5 gallons per minute (gpm), which is the minimum qualifying flow rate for Efficiency Vermont
programs. Baseline flow rate is verified on site by reviewing the equipment label and measuring the
flow rate. However, baseline flow rates are not recorded. 72 Cadmus and Opinion Dynamics, for the Michigan Evaluation Working Group, "Showerhead and
Faucet Aerator Meter Study Memorandum," June 2013, page 10, Table 6. 73 Weighted average household size of owner-occupied versus renter-occupied housing units ((71%
* 2.42) + (29% * 2.12)) based on 2011-2015 American Community Survey 5-Year Estimates for
Vermont. See reference file U.S. Census Bureau_ACS Table DP04 VT_2015.pdf. 74 Cadmus and Opinion Dynamics, for the Michigan Evaluation Working Group, "Showerhead and
Faucet Aerator Meter Study Memorandum," June 2013, page 11, Table 8. 75 Average of values for single family and multifamily households from Cadmus and Opinion
Dynamics, for the Michigan Evaluation Working Group, "Showerhead and Faucet Aerator Meter
Study Memorandum," June 2013, page 12, Table 9. 76 Cadmus and Opinion Dynamics, for the Michigan Evaluation Working Group, "Showerhead and
Faucet Aerator Meter Study Memorandum," June 2013, page 11, Table 7.

= 51.9 °F77
ηFuel_DHW = Recovery efficiency of fuel water heater
= 78%78
1,000,000 = Conversion factor from Btu to MMBtu
Deemed fossil fuel impacts per low flow showerhead are 1.600 MMBtu.
Loadshape
N/A
Gross-to-Net Savings Factors
Measure Category Hot Water
Product Description Low Flow Showerhead
Measure Code HWESHOWR
Track Name Track No. Freerider Spillover
LISF Retrofit 6034LISF 1.0 1.0
Res Retrofit 6036RETR 0.90 1.0
Persistence
The persistence factor is assumed to be one.
Lifetimes
10 years79
Measure Cost
The measure cost is the actual program cost (material and labor) of installing the new showerhead.
O&M Cost Adjustments
There are no operation and maintenance cost adjustments for this measure.
77 Average value for Burlington, Montpelier. Rutland, and Springfield, VT from U.S. DOE Standard
Building America DHW Schedules, May 2014. 78 Based on a review of fuel DHW systems available in AHRI database. 79 Measure lifetime from California DEER. See file DEER2014-EUL-table-update_2014-02-
05.xlsx.

Electric Vehicle Charging Stations
Version Date & Revision History
Draft date: 1/12/2018
Effective date: 1/1/2018
End date: TBD
Referenced Documents
1. EV Project Electric Vehicle Charging Infrastructure Summary Report for January 2013
through December 2013. Idaho National Laboratory.
2. 20161028_EV_Project_Demand_Estimate.xlsx. 3. Electric Vehicle Registered in Vermont. Drive Electric Vermont, based on Vermont
Department of Motor Vehicles vehicle registration database as of June 25, 2016.
4. An Assessment of Level 1 and Level 2 Electric Vehicle Charging Efficiency. Vermont
Energy Investment Corporation, March 20, 2013.
5. 20161027_VT_EV_ElectricEstimates_Tier III_v2.xlsx.
6. The Vermont Transportation Energy Profile. VTrans, October 2015.
7. Incremental costs are the mid-range of installed costs from Electric Vehicle Charging
Station Guidebook: Planning for Installation and Operation. Chittenden County
Regional Planning Commission. June 2014.
8. Vermont Electric Utility EV Charging Usage Data Analysis, 20180104 EV charging usage
summary_nolocations.xlsx
Description
This measure applies to the installation of Level 2 or DC Fast Charging Electric Vehicle Supply
Equipment (EVSE), commonly referred to as a “charging station” in a non-residential location.
Promotion of charging stations encourages the use of electricity to power plug-in electric vehicles
(EVs) instead of gasoline or diesel.
Definition of Energy Transformation Equipment or Condition
The energy transformation equipment must be a Level 2 or a DC Fast charging station. To
determine savings annual charging station consumption can be based on the following approaches:
metered energy consumption data;
projections of energy consumption based on assumptions for an individual installation; or
a deemed value derived from consumption data from current Vermont EV charger
installations
Definition of Baseline Equipment or Condition The baseline condition is a blended assumption of gasoline and diesel used to power a vehicle.
Algorithms
Demand Impacts
Demand impacts are estimated to be 0.73914 kW.80
Electric Energy Impacts
80 Based on median weekday demand from residential Level 2, private nonresidential Level 2, public Level 2,
and public DC Fast charging stations from EV Project Electric Vehicle Charging Infrastructure Summary
Report for January 2013 through December 2013. Idaho National Laboratory. Demand was calculated based
on 6,494 vehicles in the study. See 20161028_EV_Project_Demand_Estimate.xlsx for analysis.
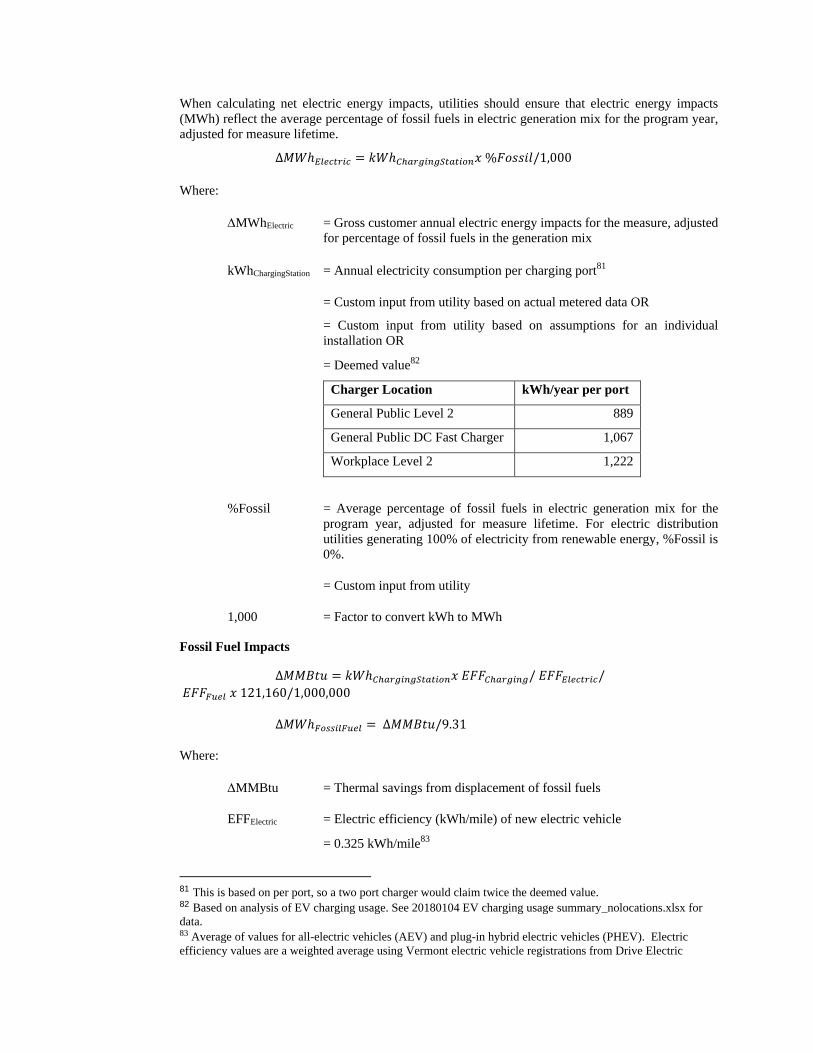
When calculating net electric energy impacts, utilities should ensure that electric energy impacts
(MWh) reflect the average percentage of fossil fuels in electric generation mix for the program year,
adjusted for measure lifetime.
∆𝑀𝑊ℎ𝐸𝑙𝑒𝑐𝑡𝑟𝑖𝑐 = 𝑘𝑊ℎ𝐶ℎ𝑎𝑟𝑔𝑖𝑛𝑔𝑆𝑡𝑎𝑡𝑖𝑜𝑛𝑥 %𝐹𝑜𝑠𝑠𝑖𝑙/1,000
Where:
MWhElectric = Gross customer annual electric energy impacts for the measure, adjusted
for percentage of fossil fuels in the generation mix
kWhChargingStation = Annual electricity consumption per charging port81
= Custom input from utility based on actual metered data OR
= Custom input from utility based on assumptions for an individual
installation OR
= Deemed value82
Charger Location kWh/year per port
General Public Level 2 889
General Public DC Fast Charger 1,067
Workplace Level 2 1,222
%Fossil = Average percentage of fossil fuels in electric generation mix for the
program year, adjusted for measure lifetime. For electric distribution
utilities generating 100% of electricity from renewable energy, %Fossil is
0%.
= Custom input from utility
1,000 = Factor to convert kWh to MWh
Fossil Fuel Impacts
∆𝑀𝑀𝐵𝑡𝑢 = 𝑘𝑊ℎ𝐶ℎ𝑎𝑟𝑔𝑖𝑛𝑔𝑆𝑡𝑎𝑡𝑖𝑜𝑛𝑥 𝐸𝐹𝐹𝐶ℎ𝑎𝑟𝑔𝑖𝑛𝑔/ 𝐸𝐹𝐹𝐸𝑙𝑒𝑐𝑡𝑟𝑖𝑐/
𝐸𝐹𝐹𝐹𝑢𝑒𝑙 𝑥 121,160/1,000,000
∆𝑀𝑊ℎ𝐹𝑜𝑠𝑠𝑖𝑙𝐹𝑢𝑒𝑙 = ∆𝑀𝑀𝐵𝑡𝑢/9.31
Where:
MMBtu = Thermal savings from displacement of fossil fuels
EFFElectric = Electric efficiency (kWh/mile) of new electric vehicle
= 0.325 kWh/mile83
81 This is based on per port, so a two port charger would claim twice the deemed value. 82 Based on analysis of EV charging usage. See 20180104 EV charging usage summary_nolocations.xlsx for
data. 83 Average of values for all-electric vehicles (AEV) and plug-in hybrid electric vehicles (PHEV). Electric
efficiency values are a weighted average using Vermont electric vehicle registrations from Drive Electric

EFFCharging = Efficiency of charging station84
= 86.4%85 for Level 2 and 100% for DC Fast
EFFFuel = Fuel efficiency (miles/gallon or MPG) of new, conventional, light-duty
vehicle
= 25.3 MPG86
121,160 = Weighted average energy content (Btu/gallon) of gasoline and diesel in
Vermont privately-owned vehicle fleet87
1,000,000 = Factor to convert Btu to MMBtu
MWhFossilFuel = Gross customer annual fossil fuel impacts for this measure, converted to
MWh
9.541 = Factor to convert MMBtu to MWh88
Other factors as defined above.
Net Impacts
∆𝑀𝑊ℎ𝑁𝑒𝑡 = ∆𝑀𝑊ℎ𝐹𝑜𝑠𝑠𝑖𝑙𝐹𝑢𝑒𝑙 − ∆𝑀𝑊ℎ𝐸𝑙𝑒𝑐𝑡𝑟𝑖𝑐
Loadshape
Vermont, based on Vermont Department of Motor Vehicles vehicle registration database as of June 25, 2016
and electric vehicle efficiency values for most recent model years available from FuelEconomy.gov. See
20161027_VT_EV_ElectricEstimates_Tier III_v2.xlsx for analysis. Tesla Roadsters were excluded from the
analysis because production ended in 2012. 84 Electric energy losses occur during charging due to AC/DC power conversion within EVs and other energy
demands associated with vehicle charging activity. 85 Average Level 2 charge efficiency from “An Assessment of Level 1 and Level 2 Electric Vehicle Charging
Efficiency.” Vermont Energy Investment Corporation, March 20, 2013. 86 Sales-weighted average miles per gallon of model year 2015 vehicles, calculated in University of Michigan
Transportation Research Institute Eco-driving Index: http://www.umich.edu/~umtriswt/EDI_sales-weighted-
mpg.html. This average includes all light duty vehicles (cars, SUVs, pick-up trucks) and may include a small
number of alternative fuel vehicles. 87 Weight average based on energy content of gasoline and diesel from “Fuel Conversion Factors” provided by
the Vermont Department of Public Service. The privately owned vehicle fleet in Vermont consists of 94.5%
gasoline-powered vehicles and 5.3% diesel-powered vehicles. See Figure 3.1 from “The Vermont
Transportation Energy Profile.” VTrans, October 2015.
http://vtrans.vermont.gov/sites/aot/files/planning/documents/planning/Vermont%20Transportation%20Energy%
20Profile%202015.pdf 88 MMBtu to MWh conversion factor from the U.S. Energy Information Administration
http://psb.vermont.gov/sites/psb/files/Fuel%20Conversion%20Factors.pdf

N/A
Gross-to-Net Savings Factors
Measure Category Transportation Transportation
Product Description Level 2 Charging
Station
DC Fast Charging Station
Measure Code TRNDCFCS TRNLVTCS
Track Name Track No. Freerider Spillover Freerider Spillover
TBD TBD 1.0 1.0 1.0 1.0
Persistence
The persistence factor is assumed to be one.
Lifetime
The measure lifetime varies based on the savings claim approach.
For metered data, measure lifetime is the duration of the metering.
For a custom input, measure lifetime is based on installation specific assumptions.
For a deemed approach, the measure lifetime is 10 years.
Measure Cost
The measure cost is the total installed cost of an electric charging station. See table below.
Type of Charging Station Incremental Cost89
Level 2 Public $11,800
DC Fast $55,000
O&M Cost Adjustments
Annual maintenance costs are $400.90
89 Incremental costs are the mid-range of installed costs from Electric Vehicle Charging Station Guidebook:
Planning for Installation and Operation. Chittenden County Regional Planning Commission. June 2014. 90 O&M costs are from Electric Vehicle Charging Station Guidebook: Planning for Installation and Operation.
Chittenden County Regional Planning Commission. June 2014. Costs for Level 2 Public are for 3.3-6.6 kW
units and costs for DC Fast are for 25-50 kW units.