advanced signal processing techniques for microwave ... · pdf filemeasuring separately the...
TRANSCRIPT

Abstract—This paper presents different signal processingtechniques used in separating cardiopulmonary signalsmeasured using a microwave Doppler radar. For differentsides from the person under test, the microwave system istested for several operational frequencies simultaneously witha PC-based electrocardiograph. Wavelet transforms are used inorder to separate heartbeat signal from the cardiopulmonarysignals. High accuracy is obtained in terms of heartbeat ratefor the whole measurements.
Keywords—Wavelet transforms, electrocardiograph, microwavesystem, cardiopulmonary signals.
I. INTRODUCTION
he demand for wireless monitoring has increased recentlyfor many applications including life sign detection for
people under rubble or snow, newly born infant or burnvictims, where electrocardiograph (ECG) with affixedelectrodes can be perturbing. Thus, the utility of themicrowave Doppler radar has increased as used for touch-lessmonitoring. According to the Doppler theory, a subject with a quasi-periodic movement will reflect the transmitted continuouswave signal with its modulated by the subject displacement[1]. When transmitted to a person’s chest, the signal will bereflected with the phase modulated according to the chestdisplacement. This latter is due to both, respiration and heartbeating. As the heartbeat and the respiration signals are laidtogether, signal processing techniques are required to separatethe heartbeat signal from the cardiopulmonary signal in orderto extract the heartbeat rate (HR).
T
As the chest displacement due to respiration (4 – 12 mm) ismuch higher than that due to heartbeat (0.2 – 0.5 mm), therespiration rate can be determined without filtering whiledetermining the heartbeat rate needs a processing technique[2]–[4]. This can be established due to the fact that theheartbeat rate varies between 50 and 90 beats per minute (0.83to 1.5 Hz) while the respiration rate varies between 9 and 24breaths per minute (0.15 to 0.4 Hz) [5]. This allows theextraction of an average heartbeat rate over a specific windowof time. On the other hand, tracking the variations of theheartbeat rate over time requires signals separation and apeak-finding technique. Previous works tend to detect the heartbeat rate either bymeasuring separately the heartbeat and respiration signal, orby using classical filters, then by applying Fourier transformto the filtered signal and considering the peak to correspond tothe HR [6]–[8]. Other studies show the possibility ofestimating the HR based on the periodicity of the auto-correlation function [9] or upon applying FFT to the auto-correlated signal to obtain the heartbeat rate [10], [11].
Recently, another processing techniques are used for cardio-respiratory separation: field-programmable gate arrays(FPGAs) is used to process either time- or frequency-domainsignals in human sensing radar applications applied for CWand UWB radars [12] as well as the use of compact quadratureDoppler radar sensor where Continuous-wavelet filter andensemble empirical mode decomposition (EEMD) basedalgorithms are applied for cardiorespiratory signal to separatethe cardiac and respiratory signals [13]. These works show the possibility of detecting the HR forperson when holding the breath as well as when breathingnormally. However, they lack providing information about theheart rate variation in time as only an average value of the HRis extracted. The aim of this work is to show the possibility of detecting thecardiopulmonary signals of a person from four different sides:front, back, left, and right. The proposed system is tested atdifferent operational frequencies: 2.4, 5.8, and 10 GHz.Simultaneously to the microwave system, PC-based ECG isused as a reference signal in order to validated the HRextraction. Obtained signals are processed using severalwavelet transforms in order to extract the heartbeat signalalong the time-axis.The rest of this paper is organized as follows: section IIpresents the proposed system and the measurement setup.Section III discusses the signal processing techniques used.Section IV shows and discusses the obtained results. SectionV concludes the work.
II.PROPOSED SYSTEM AND MEASUREMENT SETUP
A. Proposed System
The contact-less detection of the cardiopulmonary activityis based on the reflected signal off the person’s chest. The RFsignal penetrates clothes with minimal reflection, and has amuch higher reflection at the air/skin interface. This dependson the frequency of the transmitted signal. The signalreflection at the air/skin interface decreases as the frequencydecreases, and has more significant reflections from clothingor bedding, and vice-versa. The amount of the phase variationis indirectly proportional to the wavelength of the carrierfrequency. Thus, the signal-to-noise ratio is directlyproportional as well to the operational frequency (f = C/λ).Higher frequency results in a shorter the wavelength, and thenin a greater phase variation. Another feature related to theoperational frequency is the size of the antenna. As thefrequency increases, the same antenna gain can be achievedwith a smaller antenna.
The proposed microwave system is based on using a VectorNetwork Analyzer (VNA), and two horn antennas. In additionto the installation simplicity, the VNA provide the ability oftuning both frequency and power of the transmitted signal.Moreover, it measures many parameters and especially the
Advanced Signal Processing Techniques forMicrowave Cardiopulmonary Signals Separation
D. Obeid, S. Samad, S. Sadek, G. Zaharia, and G. El Zein
INTERNATIONAL JOURNAL OF BIOLOGY AND BIOMEDICAL ENGINEERING Volume 10, 2016
ISSN: 1998-4510 248

time variation of the phase and module of the S parameters ofthe system under test. The phase of the S21 parametercorresponds to the difference between the phase of thereceived signal and the phase of the transmitted signal.Simultaneously with microwave system, a PC-based ECG isused in order to extract the electrocardiogram signal. Thissignal is used as a reference signal to which the processedmicrowave signal is compared. More details about the systemsetup can be found in [14], [15].
B. Measurement Setup
Measurements are performed on healthy subject of 54 yearsold, sitting at a distance of 1 meter from the antennas. As thelife sign detection for patients and people under rubblerequires heart activity detection regardless their positions withrespect to the system, measurements are performed at the fourdifferent sides from the person under test: front, back, left, andright. As the reflection at the air/skin interface changes whenthe operational frequency changes, a comparative study isprovided in terms of operational frequency where severalfrequencies are tested using the proposed system. Theoperational frequencies should cover as much radar banddesignations as possible, as well as ISM bands. Thus, theoperational frequencies tested in this work are: 2.4 GHz (ISMS-band), 5.8 GHz (ISM C-band), and 10 GHz (X-band). Fromeach side of the person under test, the system is tested atseveral operational frequencies: 2.4, 5.8, and 10 GHz. Thetotal output power of the transmitted signal is 0 dBm. Eachmeasurement lasts 30 seconds during which the subjectbreathes normally. Both the microwave and the ECGmeasurements start simultaneously. The phase variation due tothe chest displacement is stored in the VNA and sent to thepersonal computer for processing. The processed signals arecompared to the ECG signal. The ECG provides the electricalactivity of the heart, however, only the RR interval is used asreference information for the comparison with the VNAfiltered signal.
III.SIGNAL PROCESSING TECHNIQUES
As the phase variations of S21 due to breathing are higherthan those caused by the heart beating, processing techniquesare necessary to extract the heartbeat signal from the obtainedcardiopulmonary signal. Previous work tends to apply theFourier transform to the obtained cardiopulmonary signal inorder to extract the heartbeat rate. This provides a mean valueof the HR over a specific window of time; thus, it lacksproviding the more important information about the variationof the HR in time, and cannot be established in real-time as itrequires a window of long-duration. In order sto overcomethese problems, the Discrete Wavelet Transform (DWT) isapplied for the extraction the heartbeat signal.
The DWT (W j ,k ) of a signal f(t) is given by the scalar
product of f(t) with the scaling function (i.e. the wavelet basisfunction ϕ (t ) which is scaled and shifted:
(W j ,k ) (1)
where the basis function is given by:
ϕ j ,k (t )=2− j2 ϕ (2− j t−k ) (2)
where j is the jth decomposition level or step and k is the kth
wavelet coefficient at the jth level [16]. DWT is computed bysuccessive low- and high-pass filtering of the discrete time-domain signal. The main advantage of the DWT determinationis that the examination of the signal at different frequencybands with different resolutions by decomposing the signalinto Approximation coefficients (A) and Detailed information(D). Hence, this algorithm gives precise analysis of frequencydomain at low frequency and time domain at high frequency.
The “detail” Dn contains frequencies between fs/2n andfs/2n+1. At rest, the HR varies between 60 and 120 beats perminute and the corresponding frequency is located between 1and 2 Hz. The actual sampling frequency used in the VNA is666.7 Hz, thus, there is no decomposition that provides thesignal with frequency components between 1 and 2 Hz. A re-sampling is required in order to convert the samplingfrequency from 666.7 Hz to 512 Hz which allows theextraction of the desired signal. This lets the 1-2 Hzcomponents to be included in the 8th decomposition of thewavelet. Once the wavelet decomposition is extracted, thesignal is reconstructed in time-domain. A peak-detectionmethod is applied to the time-domain reconstructed signal inorder to detect the peaks that correspond to the beats and toextract the heartbeat rate.
Several wavelet families are tested in Matlab for themeasurement performed at different sides from the personunder test and for all the operational frequencies. The waveletfamilies include Bio2.4, Rbio2.3, Sym5, Db5, Coif3, andDmey. As not all the wavelet families fulfill the properties of thedesired signal, the wavelet family has to be chosen as close aspossible to the analyzed signal to give a better reconstructionwith fewer decomposition levels [17], [18]. The choice of asuitable wavelet is based on the perfect reconstruction of thepower system signal. The error between the original signaland the reconstructed signal should be the smallest for perfectreconstruction. The Mean Square Error (MSE) is calculatedand used as indicator to measure the error between the originalsignal and the reconstructed signal. The MSE is computerwith the following relation [17], [18]:
MSE=‖S−Sreconstructed‖=√∑n= 0
N−1
|x (n )− x̂ ( n )|2 (3)
In order to compare the ECG signal to the reconstructedfiltered cardiopulmonary signal, the peak detection method isapplied to both signals. This allows comparing the beat-to-beat interval. The mean error is calculated for eachmeasurement and for the different wavelet decompositions.The mean of the MSE of all available signals is calculated foreach wavelet type according to the following equation:
(4) MSEmeanwavelettype=
∑p=1
4
∑q=1
3
MSEwavelettype ( p ) (q )
p×q
INTERNATIONAL JOURNAL OF BIOLOGY AND BIOMEDICAL ENGINEERING Volume 10, 2016
ISSN: 1998-4510 249

where p indicates the positions and q corresponds to theemitted frequency. Four positions are considered: p=1 for thefront side position, p=2 for the back side position, p=3 for theright side position, and p=4 for the left side position. Threeemitted frequencies are considered during measurements: q=1for 2.4 GHz, q=2 for 5.8 GHz, and q=3 for 10 GHz.
IV. RESULTS AND DISCUSSION
This section presents the results obtained upon measuringthe cardiopulmonary signals using a microwave touch-lesstechnique and for different sides from the person under test.Fig. 1 shows the cardiopulmonary signal detected from thefour sides of the subject when using the 5.8 GHz operationalfrequency: a) the S21 variation due to breathing is shown whenmeasured from the front side a), from the back side b), fromthe left side c), and from the right side d).
The measurement duration is 30 seconds during which thesubject is requested to breathe normally. As seen in the figure,the time-domain respiration signal is clear when measuredfrom the front side.
The signal separation is achieved upon applying severalwavelet transforms families. Fig. 2 shows the D8 levelextracted from the cardiopulmonary signal measured at 5.8GHz from the front side upon using Coiflet wavelet (Coif3)compared to the corresponding ECG signal.
Fig. 2: Front side measurement: wavelet decomposition signal at level 8 (d8) using Coif3 Vs the corresponding ECG signal
Fig. 3 shows the heartbeat signal extracted from thecardiopulmonary signal measured from the back side.
The heartbeat signal extracted from the left side of thesubject is shown in the Fig. 4.
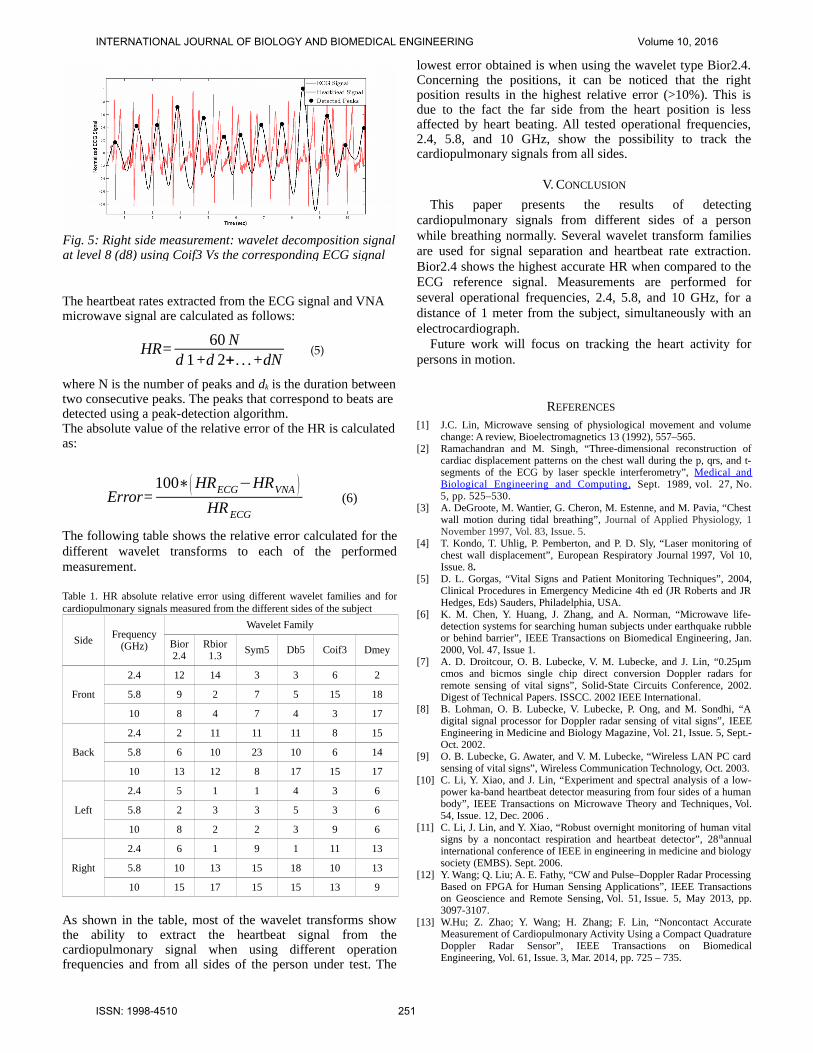
The heartbeat signal extracted from the right side of thesubject is shown in Fig. 5.
Fig. 3: Back side measurement: wavelet decomposition signalat level 8 (d8) using Coif3 Vs the corresponding ECG signal
Fig. 4: Left side measurement: wavelet decomposition signal at level 8 (d8) using Coif3 Vs the corresponding ECG signal
Fig. 1 Cardiopulmonary signals detected at 5.8 GHz and fromdifferent sides of the subject: (a) front side, (b) back side, (c) left side, and (d) right side
INTERNATIONAL JOURNAL OF BIOLOGY AND BIOMEDICAL ENGINEERING Volume 10, 2016
ISSN: 1998-4510 250
The heartbeat rates extracted from the ECG signal and VNA microwave signal are calculated as follows:
HR= 60 Nd 1+d 2+. . .+dN
(5)
where N is the number of peaks and dk is the duration betweentwo consecutive peaks. The peaks that correspond to beats are detected using a peak-detection algorithm. The absolute value of the relative error of the HR is calculatedas:
Error=100∗( HRECG−HRVNA )
HR ECG
(6)
The following table shows the relative error calculated for thedifferent wavelet transforms to each of the performedmeasurement.
Table 1. HR absolute relative error using different wavelet families and forcardiopulmonary signals measured from the different sides of the subject
SideFrequency
(GHz)
Wavelet Family
Bior2.4
Rbior1.3
Sym5 Db5 Coif3 Dmey
Front
2.4 12 14 3 3 6 2
5.8 9 2 7 5 15 18
10 8 4 7 4 3 17
Back
2.4 2 11 11 11 8 15
5.8 6 10 23 10 6 14
10 13 12 8 17 15 17
Left
2.4 5 1 1 4 3 6
5.8 2 3 3 5 3 6
10 8 2 2 3 9 6
Right
2.4 6 1 9 1 11 13
5.8 10 13 15 18 10 13
10 15 17 15 15 13 9
As shown in the table, most of the wavelet transforms showthe ability to extract the heartbeat signal from thecardiopulmonary signal when using different operationfrequencies and from all sides of the person under test. The
lowest error obtained is when using the wavelet type Bior2.4.Concerning the positions, it can be noticed that the rightposition results in the highest relative error (>10%). This isdue to the fact the far side from the heart position is lessaffected by heart beating. All tested operational frequencies,2.4, 5.8, and 10 GHz, show the possibility to track thecardiopulmonary signals from all sides.
V. CONCLUSION
This paper presents the results of detectingcardiopulmonary signals from different sides of a personwhile breathing normally. Several wavelet transform familiesare used for signal separation and heartbeat rate extraction.Bior2.4 shows the highest accurate HR when compared to theECG reference signal. Measurements are performed forseveral operational frequencies, 2.4, 5.8, and 10 GHz, for adistance of 1 meter from the subject, simultaneously with anelectrocardiograph.
Future work will focus on tracking the heart activity forpersons in motion.
REFERENCES [1] J.C. Lin, Microwave sensing of physiological movement and volume
change: A review, Bioelectromagnetics 13 (1992), 557–565.[2] Ramachandran and M. Singh, “Three-dimensional reconstruction of
cardiac displacement patterns on the chest wall during the p, qrs, and t-segments of the ECG by laser speckle interferometry”, Medical andBiological Engineering and Computing , Sept. 1989, vol. 27, No.5, pp. 525–530.
[3] A. DeGroote, M. Wantier, G. Cheron, M. Estenne, and M. Pavia, “Chestwall motion during tidal breathing”, Journal of Applied Physiology, 1November 1997, Vol. 83, Issue. 5.
[4] T. Kondo, T. Uhlig, P. Pemberton, and P. D. Sly, “Laser monitoring ofchest wall displacement”, European Respiratory Journal 1997, Vol 10,Issue. 8.
[5] D. L. Gorgas, “Vital Signs and Patient Monitoring Techniques”, 2004,Clinical Procedures in Emergency Medicine 4th ed (JR Roberts and JRHedges, Eds) Sauders, Philadelphia, USA.
[6] K. M. Chen, Y. Huang, J. Zhang, and A. Norman, “Microwave life-detection systems for searching human subjects under earthquake rubbleor behind barrier”, IEEE Transactions on Biomedical Engineering, Jan.2000, Vol. 47, Issue 1.
[7] A. D. Droitcour, O. B. Lubecke, V. M. Lubecke, and J. Lin, “0.25μmcmos and bicmos single chip direct conversion Doppler radars forremote sensing of vital signs”, Solid-State Circuits Conference, 2002.Digest of Technical Papers. ISSCC. 2002 IEEE International.
[8] B. Lohman, O. B. Lubecke, V. Lubecke, P. Ong, and M. Sondhi, “Adigital signal processor for Doppler radar sensing of vital signs”, IEEEEngineering in Medicine and Biology Magazine, Vol. 21, Issue. 5, Sept.-Oct. 2002.
[9] O. B. Lubecke, G. Awater, and V. M. Lubecke, “Wireless LAN PC cardsensing of vital signs”, Wireless Communication Technology, Oct. 2003.
[10] C. Li, Y. Xiao, and J. Lin, “Experiment and spectral analysis of a low-power ka-band heartbeat detector measuring from four sides of a humanbody”, IEEE Transactions on Microwave Theory and Techniques, Vol.54, Issue. 12, Dec. 2006 .
[11] C. Li, J. Lin, and Y. Xiao, “Robust overnight monitoring of human vitalsigns by a noncontact respiration and heartbeat detector”, 28thannualinternational conference of IEEE in engineering in medicine and biologysociety (EMBS). Sept. 2006.
[12] Y. Wang; Q. Liu; A. E. Fathy, “CW and Pulse–Doppler Radar ProcessingBased on FPGA for Human Sensing Applications”, IEEE Transactionson Geoscience and Remote Sensing, Vol. 51, Issue. 5, May 2013, pp.3097-3107.
[13] W.Hu; Z. Zhao; Y. Wang; H. Zhang; F. Lin, “Noncontact AccurateMeasurement of Cardiopulmonary Activity Using a Compact QuadratureDoppler Radar Sensor”, IEEE Transactions on BiomedicalEngineering, Vol. 61, Issue. 3, Mar. 2014, pp. 725 – 735.
Fig. 5: Right side measurement: wavelet decomposition signalat level 8 (d8) using Coif3 Vs the corresponding ECG signal
INTERNATIONAL JOURNAL OF BIOLOGY AND BIOMEDICAL ENGINEERING Volume 10, 2016
ISSN: 1998-4510 251

[14] Dany Obeid, Sarah Samad, Sawsan Sadek, Gheorghe Zaharia and GhaïsEl Zein (2016). Position-Free Vital Sign Monitoring: Measurements andProcessing, Advanced Biosignal Processing and Diagnostic Methods,Dr. Christoph Hintermüller (Ed.), InTech, DOI: 10.5772/63915.Available from: http://www.intechopen.com/books/advanced-biosignal-processing-and-diagnostic-methods/position-free-vital-sign-monitoring-measurements-and-processing
[15] Dany Obeid, Gheorghe Zaharia, Sawsan Sadek , Ghaïs El Zein,Microwave Doppler radar for heartbeat detection vs electrocardiogram,2012
[16] G. A. Blackburn, J. Garke Ferwerda, “Retrieval of chlorophyllconcentration from leaf reflectance spectra using wavelet analysis”,Remote Sensing of Environment, Vol. 112, Issue. 4, April 2008, pp.1614-1632.
[17] S. Z. Mohd Tumari, R. Sudirman, A. H. Ahmad “Selection of a SuitableWavelet for Cognitive Memory Using Electroencephalograph Signal”,Scientific reaserch, doi:10.4236/eng.2013.55B004 Published OnlineMay 2013.
[18] A.I. Megahed, A. Monem Moussa, H. B. Elrefaie, Y.M. Marghany“Selection of a Suitable Mother Wavelet for Analyzing Power SystemFault Transients”, Power and Energy Society General Meeting -Conversion and Delivery of Electrical Energy in the 21st Century, 2008IEEE , Pittsburgh, PA, 20-24 July, 2008, pp.1 – 7.
INTERNATIONAL JOURNAL OF BIOLOGY AND BIOMEDICAL ENGINEERING Volume 10, 2016
ISSN: 1998-4510 252