advanced rtu campaign - department of energy · advanced rtu campaign. ... rtu management pilot...
TRANSCRIPT

Michael Deru, [email protected] Renewable Energy Laboratory
Advanced RTU Campaign2017 Building Technologies Office Peer Review
2
Project Summary
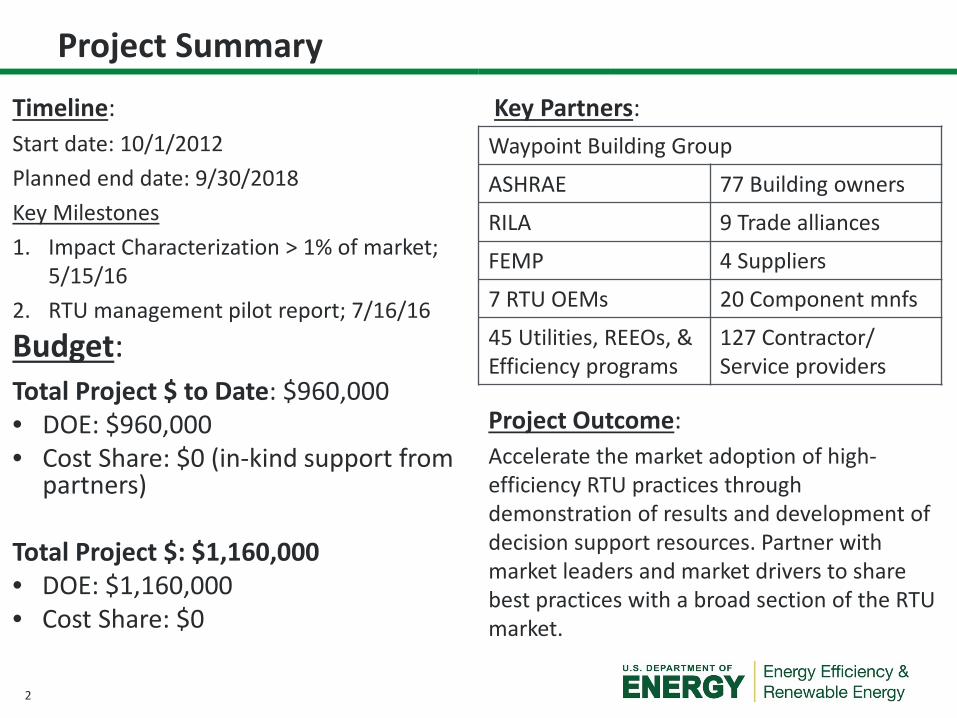
Timeline:Start date: 10/1/2012Planned end date: 9/30/2018Key Milestones 1. Impact Characterization > 1% of market;
5/15/16 2. RTU management pilot report; 7/16/16
Budget:Total Project $ to Date: $960,000• DOE: $960,000• Cost Share: $0 (in-kind support from
partners)
Total Project $: $1,160,000• DOE: $1,160,000• Cost Share: $0
Key Partners:
Project Outcome: Accelerate the market adoption of high-efficiency RTU practices through demonstration of results and development of decision support resources. Partner with market leaders and market drivers to share best practices with a broad section of the RTU market.
Waypoint Building Group
ASHRAE 77 Building owners
RILA 9 Trade alliances
FEMP 4 Suppliers
7 RTU OEMs 20 Component mnfs
45 Utilities, REEOs, & Efficiency programs
127 Contractor/Service providers
3
Purpose and Objectives
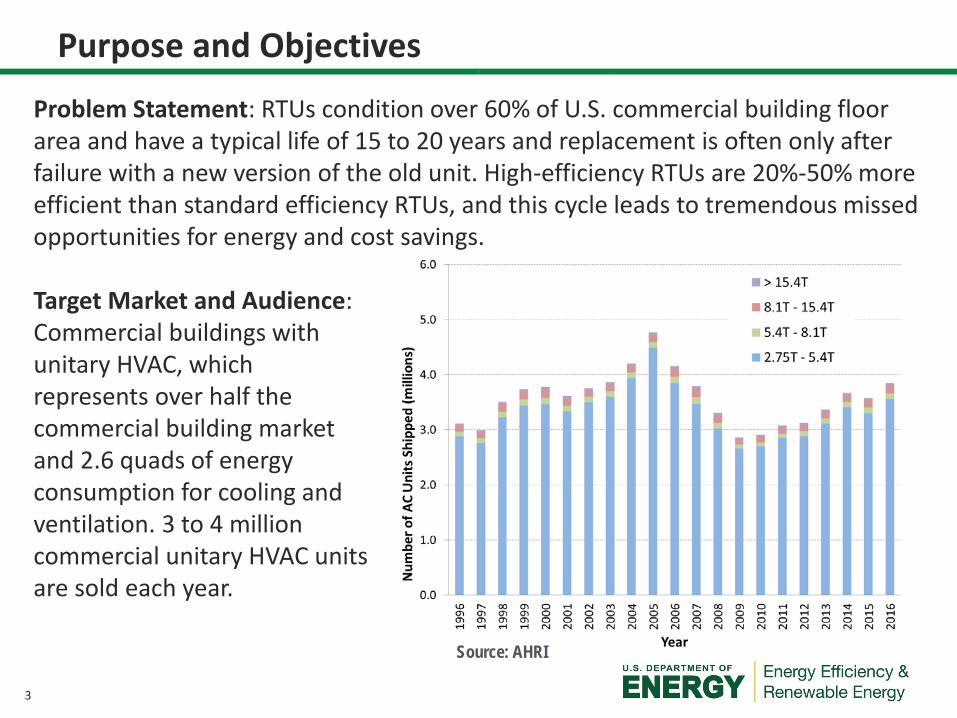
Problem Statement: RTUs condition over 60% of U.S. commercial building floor area and have a typical life of 15 to 20 years and replacement is often only after failure with a new version of the old unit. High-efficiency RTUs are 20%-50% more efficient than standard efficiency RTUs, and this cycle leads to tremendous missed opportunities for energy and cost savings.
Target Market and Audience: Commercial buildings with unitary HVAC, which represents over half the commercial building market and 2.6 quads of energy consumption for cooling and ventilation. 3 to 4 million commercial unitary HVAC units are sold each year.
Source: AHRI

4
Purpose and ObjectivesImpact of Project: • Accelerate market adoption of high-efficiency RTU practices:
– Proactive replacement with right-sized, high-efficiency RTUs– Advanced RTU control retrofits on constant speed RTUs– Persistence of performance with Quality Installation, Quality Maintenance, and
automated fault detection and diagnostics• Engage with partners across all fields affecting RTUs and develop technical
and business resources to support informed decisions. • Progress is measured by the
number of RTUs impacted by Campaign partners, energy savings, the number and type of Campaign partners, and the number of resources developed.

5
ApproachApproach: • Demonstrate performance• Recognize and promote best practices• Develop technical and business decision resources• Provide technical support and duplicate lessons for other users• Coordinate across all levels of the market• Leverage resources with large partner base
Partner Case Study on Retrofit Best Practices
Number of stores (big box retail) 40
Average RTU cooling capacity reduction
69 tons (25%)
Highest RTU cooling capacityreduction
175 tons (41%)
Annual energy savings 13 million kWh
Annual energy cost savings $1.3 million

6
Approach
Key Issues:• Market inertia • Several economic, technical, and practical barriers
Barrier SolutionHigh initial cost Guidance on LCC, IncentivesSplit incentives between owners and tenants Energy-aligned leases and owner/tenant
negotiated upgradesRisk of the unknown with new technologies Education and successful demonstrations
Uncertainty/mistrust about savings claims Demonstrations and case studies
Lack of expertise with advanced equipment/what to buy
Sample procurement specifications, standard load calculations and proper sizing, training of contractors
Difficult to quantify performance of variable speed/capacity RTUs
Improved performance calculators
Partial List of Barriers and Solutions

7
ApproachDistinctive Characteristics:• Part of a larger DOE effort to raise the efficiency of RTUs
RTU Challenge Demonstrations Advanced RTU Campaign Raise minimum equipment efficiencies
• Integration of advanced controls for improved performance and untapped savings
• Broad market outreach beyond market leadersOrganization Type Number of
PartnersBuilding owners 77Trade and Industry Organization 9Utility and Efficiency Program 36RTU Original Equipment Manufacturer 7RTU Component Manufacturer 11RTU Retrofit Controls Manufacturer 9RTU Supplier 4RTU Contractor/Service Provider 127RTU Performance 9Total 289

8
Progress and Accomplishments
Accomplishments:• Campaign awards presented at the PRSM National conference• Published Business Guide and Green Lease Language• The Campaign website hosts over 33 technical and business resources. Future
goals of the Campaign are to affect over 200,000 RTUs by 2020 and achieve annual savings of over 2 billion kWh.

9
Progress and Accomplishments
Market Impact: • Over 280 partners• Almost 77,000 high-efficiency RTUs• 6604 million kWh, $66 million, and 7 trillion Btus saved annually• Met deployment goals every year • Working with utilities to reach a broader market segment
– RTU management model pilot with DNV GL and NYSERDA– Provided input to CEE and NYSERDA planning for RTU programs
Advanced RTU Campaign Impact SummaryAnnual
(2013-2016)Cumulative (2013-2016)
High-Efficiency RTU Installations 43,556Advanced RTU Control Retrofits 33,388Total RTUs 76,944Electricity savings (million kWh) 660 1,663 Energy cost savings ($million) $66 $166 Primary energy savings (Trillion Btu) 7.0 17.8 GHG reductions (million lb CO2e) 456 1,156

10
Progress and Accomplishments
Awards/Recognition: • Featured in over 65 industry news letters and blog posts• Four journal articles about the Campaign
Lessons Learned: • Market transformation requires a broad approach to support the diversity of
market challenges, interests, and abilities. • Challenging to get partners to share RTU numbers• Estimating performance of variable speed systems is challenging• Comprehensive utility RTU programs require more effort but are the most
effective
11
Project Integration: The Campaign team identifies and works with key industry partners and stakeholders to promote best practices and recruit more participants• DOE oversees the Campaign and approves work items• Campaign team (NREL and Waypoint Building Group) run the Campaign• Organizing partners advise, promote, and contribute content• Supporting partners promote, support participants, and recruit• Participating partners install and maintain high-efficiency RTUs
Partners, Subcontractors, and Collaborators:Waypoint Building Group – subcontractor and project communications leadASHRAE, RILA, and FEMP – Organizing partners and advisors212 Supporting partners – Promote best practices and recruit new partners77 Participating partners – Install and maintain high-efficiency RTUs
Project Integration and Collaboration

12
Communications: Objectives: Education, engage industry, communicate successes• Multiple DOE Blogs, tweets, and posts• 2016 DOE Awards notice was reposted 9 by different media outlets• 2 stories in industry journals in 2016• 2016 & 2017 PRSM National Conference Awards and technical session• Presented at three national conferences • 13 webinars with partners (since 2013) with over 1,000 viewers
Project Integration and Collaboration

13
Next Steps and Future Plans: • Study and document how RTU AFDD promotes persistence of savings• Promote broad implementation of RTU AFDD • Continue to develop and promote RTU calculations with OpenStudio• Support comprehensive utility RTU programs• Transition resources to the market
Next Steps and Future Plans

14
REFERENCE SLIDES
15
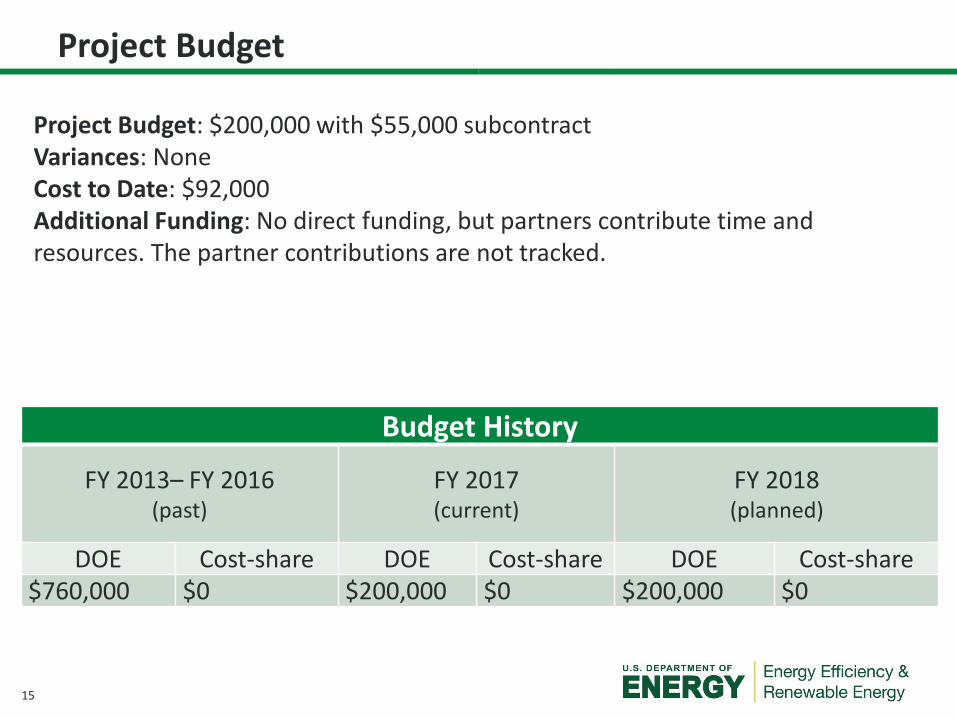
Project Budget: $200,000 with $55,000 subcontractVariances: NoneCost to Date: $92,000Additional Funding: No direct funding, but partners contribute time and resources. The partner contributions are not tracked.
Budget History
FY 2013– FY 2016(past)
FY 2017(current)
FY 2018(planned)
DOE Cost-share DOE Cost-share DOE Cost-share$760,000 $0 $200,000 $0 $200,000 $0
Project Budget
16
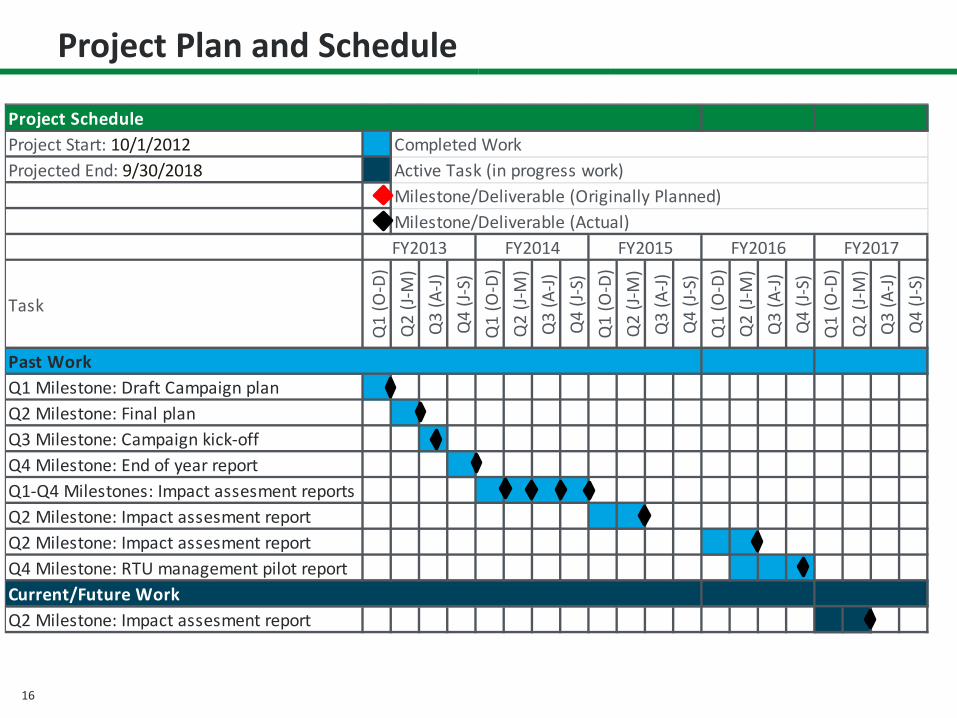
Project Plan and Schedule
Project ScheduleProject Start: 10/1/2012Projected End: 9/30/2018
Task
Q1
(O-D
)Q
2 (J-
M)
Q3
(A-J)
Q4
(J-S)
Q1
(O-D
)Q
2 (J-
M)
Q3
(A-J)
Q4
(J-S)
Q1
(O-D
)Q
2 (J-
M)
Q3
(A-J)
Q4
(J-S)
Q1
(O-D
)Q
2 (J-
M)
Q3
(A-J)
Q4
(J-S)
Q1
(O-D
)Q
2 (J-
M)
Q3
(A-J)
Q4
(J-S)
Past WorkQ1 Milestone: Draft Campaign planQ2 Milestone: Final planQ3 Milestone: Campaign kick-offQ4 Milestone: End of year reportQ1-Q4 Milestones: Impact assesment reportsQ2 Milestone: Impact assesment reportQ2 Milestone: Impact assesment reportQ4 Milestone: RTU management pilot reportCurrent/Future WorkQ2 Milestone: Impact assesment report
FY2016 FY2017
Completed WorkActive Task (in progress work)Milestone/Deliverable (Originally Planned) Milestone/Deliverable (Actual) FY2013 FY2014 FY2015