advanced manufacturing: ohio iron and steel industry
TRANSCRIPT
Research Office A State Affiliate of the U.S. Census Bureau
Advanced Manufacturing: Ohio Iron and Steel Industry
December, 2017

Inside front cover

ADVANCED MANUFACTURING: The Ohio Iron and Steel Industry
December 2017
B1001 Don Larrick, Principal Analyst Office of Research, Ohio Development Services Agency
P.O. Box 1001, Columbus, Oh. 43216-1001 Production Support: Steve Kelley, Editor; Robert Schmidley, GIS Specialist

TABLE OF CONTENTS Page Executive Summary 1 Description of Ohio’s Iron and Steel Industry - - - - - - - - - - - - - - - - - - - - - - - - - - - - - - - - - - - - - - - - - - - - - - - - 3 Notable Iron and Steel Industry Manufacturers 5 Globalization and Foreign Investment in Ohio - - - - - - - - - - - - - - - - - - - - - - - - - - - - - - - - - - - - - - - - - - - - - - - - - - 8 Recent Expansion and Attraction Announcements 11 Iron and Steel Industry Concentration in Ohio - - - - - - - - - - - - - - - - - - - - - - - - - - - - - - - - - - - - - - - - - - - - - - - - - - 13 The Composition of Ohio’s Iron and Steel Industry: Employment 15 Industry Pay- - - - - - - - - - - - - - - - - - - - - - - - - - - - - - - - - - - - - - - - - - - - - - - - - - - - - - - - - - - - - - - - - - - - - - - - - - 17 The Distribution of Industry Establishments in Ohio 19 The Distribution of Industry Employment in Ohio - - - - - - - - - - - - - - - - - - - - - - - - - - - - - - - - - - - - - - - - - - - - - - - - 21 Trends 23 Raw Steel Production - - - - - - - - - - - - - - - - - - - - - - - - - - - - - - - - - - - - - - - - - - - - - - - - - - - - - - - - - - - - - - - - - - - 25 Production as Measured by Value-Added 29 Capital Expenditures- - - - - - - - - - - - - - - - - - - - - - - - - - - - - - - - - - - - - - - - - - - - - - - - - - - - - - - - - - - - - - - - - - - - 31 Establishments 33 Employment- - - - - - - - - - - - - - - - - - - - - - - - - - - - - - - - - - - - - - - - - - - - - - - - - - - - - - - - - - - - - - - - - - - - - - - - - - 35
i

Exports from Ohio 37 Notes on U.S. Imports and Exports - - - - - - - - - - - - - - - - - - - - - - - - - - - - - - - - - - - - - - - - - - - - - - - - - - - - - - - - - - 39 Overview and Outlooks 41 An Overview of the Industry - - - - - - - - - - - - - - - - - - - - - - - - - - - - - - - - - - - - - - - - - - - - - - - - - - - - - - - - - - - - - - - 42 The Near- and Long-Term Outlooks 47 Appendices- - - - - - - - - - - - - - - - - - - - - - - - - - - - - - - - - - - - - - - - - - - - - - - - - - - - - - - - - - - - - - - - - - - - - - - - - - 50
Detailed Tables 51
Table A1: Notable Iron and Steel Manufacturing Companies in Ohio, 2017 52 Table A2: Expansion and Attraction Announcements in Ohio’s Iron and Steel Industry, 2013-2016 54 Table A3: Iron and Steel Industry Concentration in Ohio 55 Table A4: Establishments and Employment in the Iron and Steel Industry, Ohio and U.S., 2015 56 Table A5: Employment and Pay in the Iron and Steel Industry, Ohio and U.S., 2015 57 Table A6: Establishments and Employment in Ohio’s Iron and Steel Industry, by County, 2015 58 Table A7: Raw Steel Production in Ohio and the U.S., 1971-2016 59 Table A8: Trends in Value-Added for Ohio and the U.S., 2005-2015 60 Table A9: Trends in Capital Expenditures for Ohio and the U.S., 2005-2015 61 Table A10: Detailed Iron and Steel Industry Establishment Trends in Ohio and the U.S., 2005-2015 62 Table A11: Detailed Iron and Steel Industry Employment Trends in Ohio and the U.S., 2005-2015 63 Table A12: Trends in Exports from Ohio 64 Table A13: U.S. Imports and Exports of Steel Mill Products and Derived Statistics, 1995-2016 65 Table A14: Projections for Iron and Steel Industry Employment, Ohio and the U.S., 2014-2024 66
Industry Definition and Examples of Products 67
Glossary - - - - - - - - - - - - - - - - - - - - - - - - - - - - - - - - - - - - - - - - - - - - - - - - - - - - - - - - - - - - - - - - - - - - - - - - - - 69 A Primer on Iron and Steel Production Processes 72
ii

Notes- - - - - - - - - - - - - - - - - - - - -- - - - - - - - - - - - - - - - - - - - - - - - - - - - - - - - - - - - - - - - - - - - - - - - - - - - - - - - 73 Sources and References Cited 78
iii
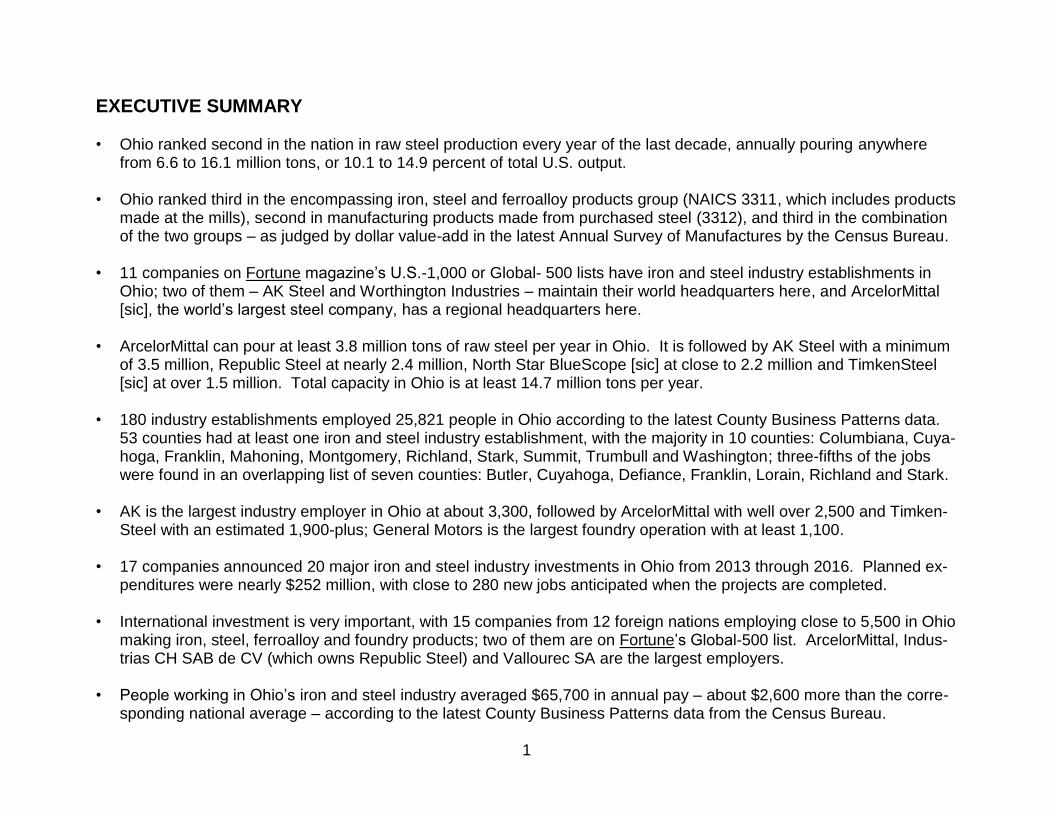
EXECUTIVE SUMMARY • Ohio ranked second in the nation in raw steel production every year of the last decade, annually pouring anywhere
from 6.6 to 16.1 million tons, or 10.1 to 14.9 percent of total U.S. output. • Ohio ranked third in the encompassing iron, steel and ferroalloy products group (NAICS 3311, which includes products
made at the mills), second in manufacturing products made from purchased steel (3312), and third in the combination of the two groups – as judged by dollar value-add in the latest Annual Survey of Manufactures by the Census Bureau.
• 11 companies on Fortune magazine’s U.S.-1,000 or Global- 500 lists have iron and steel industry establishments in
Ohio; two of them – AK Steel and Worthington Industries – maintain their world headquarters here, and ArcelorMittal [sic], the world’s largest steel company, has a regional headquarters here.
• ArcelorMittal can pour at least 3.8 million tons of raw steel per year in Ohio. It is followed by AK Steel with a minimum
of 3.5 million, Republic Steel at nearly 2.4 million, North Star BlueScope [sic] at close to 2.2 million and TimkenSteel [sic] at over 1.5 million. Total capacity in Ohio is at least 14.7 million tons per year.
• 180 industry establishments employed 25,821 people in Ohio according to the latest County Business Patterns data.
53 counties had at least one iron and steel industry establishment, with the majority in 10 counties: Columbiana, Cuya-hoga, Franklin, Mahoning, Montgomery, Richland, Stark, Summit, Trumbull and Washington; three-fifths of the jobs were found in an overlapping list of seven counties: Butler, Cuyahoga, Defiance, Franklin, Lorain, Richland and Stark.
• AK is the largest industry employer in Ohio at about 3,300, followed by ArcelorMittal with well over 2,500 and Timken-
Steel with an estimated 1,900-plus; General Motors is the largest foundry operation with at least 1,100. • 17 companies announced 20 major iron and steel industry investments in Ohio from 2013 through 2016. Planned ex-
penditures were nearly $252 million, with close to 280 new jobs anticipated when the projects are completed.
• International investment is very important, with 15 companies from 12 foreign nations employing close to 5,500 in Ohio making iron, steel, ferroalloy and foundry products; two of them are on Fortune’s Global-500 list. ArcelorMittal, Indus-trias CH SAB de CV (which owns Republic Steel) and Vallourec SA are the largest employers.
• People working in Ohio’s iron and steel industry averaged $65,700 in annual pay – about $2,600 more than the corre-
sponding national average – according to the latest County Business Patterns data from the Census Bureau.
1

This page intentionally blank
2

DESCRIPTION OF OHIO’S IRON AND STEEL INDUSTRY
3
!
!
!
!! !
!
!
!
!
!
!
!
!!
Ross
Stark
Pike
Wood
Darke
Knox
Licking
SciotoAdamsGallia
Wayne
Perry
Clark
Huron
Allen
Butler
Lorain
Seneca
Logan
Brown
Athens
Union
Trumbull
Meigs
Ashtabula
Hardin
Henry
Franklin
PrebleNoble
Mercer
Portage
Fulton
Miami
Erie
Belmont
Hancock
Vinton
Fairfield
Putnam
Highland
Lucas
Carroll
Shelby
Richland
Monroe
Clinton
Greene
Muskingum
Fayette
Marion
Medina
Warren
Holmes
Pickaway
Guernsey
Morgan
Madison
Washington
Coshocton
Geauga
Jackson
Hocking
Summit
Ashland
Morrow
Lake
Clermont
Tuscarawas
Delaware
Williams
Harrison
Paulding
Defiance
Lawrence
Auglaize
Van Wert
Cuyahoga
Wyandot
Hamilton
Columbiana
Jefferson
Crawford
Sandusky
Mahoning
Champaign
Ottawa
Montgomery
McWaneAK Steel
Coshocton
CharterSteel
AK SteelMiddletown
ArcelorMittalCleveland
GM DefianceFoundary
North StarBluescope
RepublicSteel
VallourecStar
ArcelorMittalShelby
RepublicSteel
TimkenSteel:Harrison
GambrinusFaircrest
NucorMarion
!"c$
!"c$
!"̀$
!"f$!"g$
!"̀$
!"e$
!"e$
!"a$
!"a$
!"g$!"f$
!"g$
!"f$
Ohio Steel IndustryNotable Establishments*
Key
! Notable Establishment*
Interstate Highway
Ohio County
*Major melt facility or establishmentbelieved to employ 400 or more
Sources:Hoover's Inc., Office of Research,news reports, company web sites,
and U.S. Census Bureau
Prepared by:Office of Research
Ohio Development Services Agency
November 2017
R102717A
4

NOTABLE IRON AND STEEL INDUSTRY MANUFACTURERS
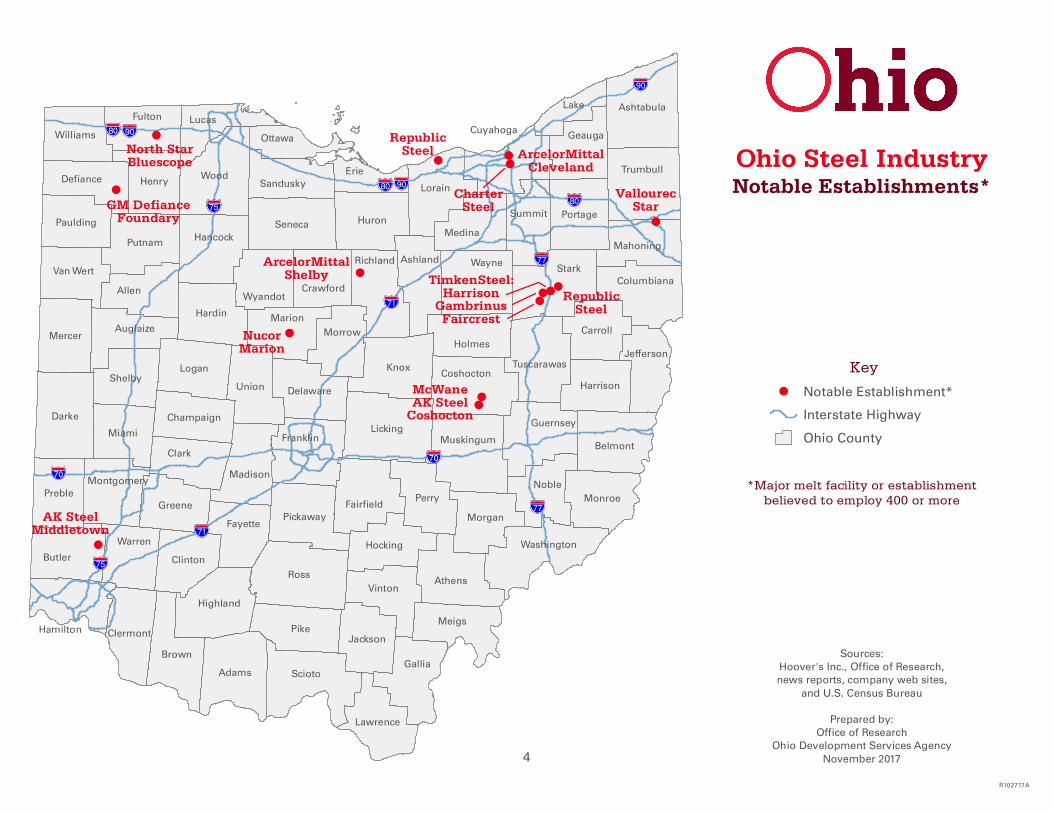
Eleven companies on Fortune’s U.S.-1,000 or Global-500 lists have iron and steel industry establishments in Ohio. Two of them maintain their world headquarters in Ohio: AK Steel and Worthington Industries. AK Steel is the largest industry employer in Ohio at about 3,300 people, followed by ArcelorMittal [sic] with well over 2,500, and TimkenSteel [sic] with an estimated 1,900-plus. (These figures included headquarters employment; TimkenSteel split from Timken-the-fabricated-metal-products-company in 2013.) General Motors operates the largest foundry with more than 1,100.1 Four more com-panies – regardless of their Fortune status – employ between 400 and 900 here. The map above shows establishments employing at least 400 or the location of major furnaces. TimkenSteel’s Faircrest, Gambrinus and Harrison form an integrated complex. The list below includes companies employing 400 or more people in Ohio and (generally) having at least 25 people at a site as well as Fortune company sites regardless of size. Establish-ments are grouped by NAICS code and note the city where the site is located. See Appendix Table A1 for the complete list organized by company. Industry Group: Notable Co.^/Subsidiary or Division NAICS City Jobs at Site1
3311: Iron and Steel Mills and Steel Mill Products AK Steel Holding Corp.*/AK Steel Corp.2 3311 Middletown 2,100 AK Steel Holding Corp.*/AK Steel Corp.2 3311 Mansfield 333 ArcelorMittal SA*/ArcelorMittal Cleveland LLC (east and west sites combined)3 3311 Cleveland 1,927 BlueScope Steel Ltd./North Star BlueScope4 3311 Delta 380 Charter Manufacturing Co., Inc./Charter Steel Division5 3311 Cleveland 330 Industrias CH, SAB de CV/Republic Steel Canton Bloom Casting6 3311 Canton 400 Nucor Corp.*/Nucor Steel Marion, Inc.3 3311 Marion 265 TimkenSteel Corp. (Faircrest, Gambrinus & Harrison)9 3311 Canton 1,650
3312: Steel Products from Purchased Steel ArcelorMittal SA*/ArcelorMittal Tubular Products3 33121 Shelby 496 ArcelorMittal SA*/ArcelorMittal Tubular Products3 33121 Marion 100 United States Steel Corp.*10 33121 Lorain 167 Vallourec SA/Vallourec Star, LP11 33121 Youngstown 550 AK Steel Holding Corp.*/AK Steel Corp.2 331221 Coshocton 420 AK Steel Holding Corp.*/AK Steel Corp.2 331221 Zanesville 143 Allegheny Technologies, Inc.*/Allegheny Ludlum, LLC 331221 Louisville 26 Industrias CH, SAB de CV/Republic Steel Cold-finished Plant6 331221 Massillon 200 Industrias CH, SAB de CV/Republic Steel Hot-rolled Bar Plant6, 7 331221 Lorain 10
5

Industry Group: Notable Co.^/Subsidiary or Division NAICS City Jobs at Site1
Mitsui & Co., Ltd.*/Steel Technologies LLC6 331221 Ottawa 100 Mitsui & Co., Ltd.*/Steel Technologies LLC6 331221 Willoughby 30 Nucor Corp.*/Nucor Bright Bar Orrville LLC 331221 Orrville 19 TimkenSteel Corp. (St. Clair) 331221 Eaton 97 Worthington Industries, Inc.*/Worthington Steel Co. 331221 Cleveland 175 Carpenter Technology Corp.*/Latrobe Specialty Metals Co., LLC 331222 Wauseon 76 Industrias CH, SAB de CV/Republic Steel Wire Processing Division6 331222 Solon 15 Leggett & Platt, Inc.*/Solon Specialty Wire Co. 331222 Solon 25
33151: Iron and Steel Foundries General Motors Co.*/Defiance Casting3 331511 Defiance 1,128 McWane, Inc. (fka Clow Water Systems)8 331511 Coshocton 425 Osco Industries, Inc.3 331511 Portsmouth 200 Osco Industries, Inc.3 331511 Jackson 140 Osco Industries, Inc.3 331511 New Boston 70 Westinghouse Air Brake Technologies Corp.*/Wabtec/Sancast12 331511 Coshocton 40 Worthington Industries, Inc.*/Worthington Steel Co. 331513 Monroe 165 Worthington Industries, Inc.*/Worthington Steelpac Systems 331513 Columbus 250
5511: Corporate, Subsidiary and Regional Management AK Steel Holding Corp.*/AK Steel Corp. (HQ) 551112/4 West Chester 300 ArcelorMittal SA*/ArcelorMittal USA LLC (regional HQ)3 551114 Richfield 30 Industrias CH, SAB de CV/Republic Steel Hot-rolled Plant (regional HQ)6 551114 Canton 100 TimkenSteel Corp. (HQ)9 551114 Canton 187 Worthington Industries, Inc.* (HQ) 551114 Worthington 250
Notes: ^ - "notable" means a company either (a) a Fortune U.S.-1,000 or Global-500 company, (b) employing at least 400 people in Ohio, or (c) having a major melt facility in Ohio; * - a Fortune company; 1 - jobs figures are from Hoover's (2017) unless otherwise noted; they are the best available estimates, but their accuracy cannot be guaranteed; 2 - jobs figures at least partially based on U.S. Census Bureau (2017b); 3 - jobs figures from company website(s); 4 - jobs figure from Binsted (2016); 5 - jobs figure from Plain-Dealer (2017), with 25 expected to be added in 2018; 6 - jobs figures from Office of Research (2016a); 7 - the plant is changing to pig iron production with new jobs expected (Payerchin, 2017); 8 - jobs figure from Hannahs (2017); 9 - HQ jobs figure derived from McKinnon (2015); Faircrest-Gambrinus-Harrison figure is company-reported union-only; 10 - jobs figure derived from Nix (2016); 11 - jobs figure from Tribune-Chronicle (2017); 12 - jobs figure from Williams (2017). Sources: Binsted (2016), Fortune (2017), Hannahs (2017), Hoover's (2017), McKinnon (2015), Nix (2016), Office of Research (2016a), Payerchin (2017), Plain-Dealer (2107), Tribune-Chronicle (2017), U.S. Census Bureau (2017b), Williams (2017) and company websites. Prepared by: Office of Research, Ohio Development Services Agency. Telephone 614-466-2116 (DL, 10/17).
6
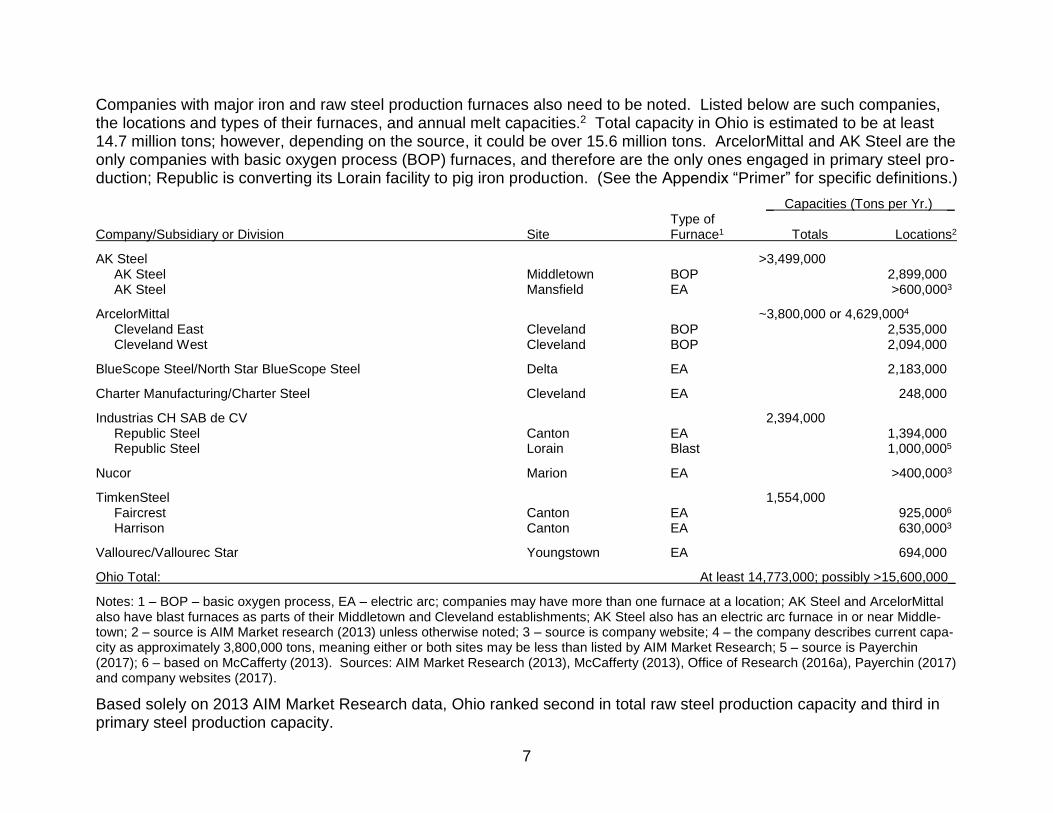
Companies with major iron and raw steel production furnaces also need to be noted. Listed below are such companies, the locations and types of their furnaces, and annual melt capacities.2 Total capacity in Ohio is estimated to be at least 14.7 million tons; however, depending on the source, it could be over 15.6 million tons. ArcelorMittal and AK Steel are the only companies with basic oxygen process (BOP) furnaces, and therefore are the only ones engaged in primary steel pro-duction; Republic is converting its Lorain facility to pig iron production. (See the Appendix “Primer” for specific definitions.)
_ Capacities (Tons per Yr.) _ Type of Company/Subsidiary or Division Site Furnace1 Totals Locations2
AK Steel >3,499,000 AK Steel Middletown BOP 2,899,000 AK Steel Mansfield EA >600,0003
ArcelorMittal ~3,800,000 or 4,629,0004 Cleveland East Cleveland BOP 2,535,000 Cleveland West Cleveland BOP 2,094,000
BlueScope Steel/North Star BlueScope Steel Delta EA 2,183,000
Charter Manufacturing/Charter Steel Cleveland EA 248,000
Industrias CH SAB de CV 2,394,000 Republic Steel Canton EA 1,394,000 Republic Steel Lorain Blast 1,000,0005
Nucor Marion EA >400,0003
TimkenSteel 1,554,000 Faircrest Canton EA 925,0006 Harrison Canton EA 630,0003
Vallourec/Vallourec Star Youngstown EA 694,000
Ohio Total: At least 14,773,000; possibly >15,600,000_
Notes: 1 – BOP – basic oxygen process, EA – electric arc; companies may have more than one furnace at a location; AK Steel and ArcelorMittal also have blast furnaces as parts of their Middletown and Cleveland establishments; AK Steel also has an electric arc furnace in or near Middle-town; 2 – source is AIM Market research (2013) unless otherwise noted; 3 – source is company website; 4 – the company describes current capa-city as approximately 3,800,000 tons, meaning either or both sites may be less than listed by AIM Market Research; 5 – source is Payerchin (2017); 6 – based on McCafferty (2013). Sources: AIM Market Research (2013), McCafferty (2013), Office of Research (2016a), Payerchin (2017) and company websites (2017).
Based solely on 2013 AIM Market Research data, Ohio ranked second in total raw steel production capacity and third in primary steel production capacity.
7

GLOBALIZATION AND FOREIGN INVESTMENT IN OHIO
Foreign investment in Ohio is part of the globalization about which industry analysts write, and has become increasingly important for companies (Hadid, 2017; Leach, 2017; Yucel, 2017a, 2017b). Fifteen foreign-based companies have 21 subsidiary manufacturing establishments in Ohio’s iron and steel industry; two of the companies are on Fortune’s Global-500 list. All companies with at least five employees are listed below, along with the countries where the home office is located, their Ohio subsidiaries, NAICS code(s) and the estimated number of employees here. ArcelorMittal is the largest employer with 2,523 people, followed by Industrias CH, SAB de CV with 725. Eramet is the only company specializing in ferroalloys (specifically manganese). Altogether, the 15 companies employ close to 5,500 in their mills, plants and foun-dries in Ohio. (Some companies also have separate facilities for coke production, fabricated metals activities, research and development, and/or distribution centers; such employment is not included here.)
Parent NAICS Total Ultimate Foreign Parent Country Ohio Subsidiary (no. of sites) Code(s) Jobs^
ArcelorMittal SA *1 Luxembourg ArcelorMittal (4, including a RHQ) 331: 1, 21, 51 2,523 BlueScope Steel Ltd.2 Australia North Star BlueScope Steel LLC (1) 3311 380 Caparo International. Corp. United Kingdom Bull Moose Tube Co. (1) 33121 40 Egon Evertz KG Germany Evertz Technology Services USA, Inc. (1) 33151 30 Eramet SA France Eramet Marietta, Inc. (1) 3311 200 GKN plc United Kingdom GKN Sinter Metals, Inc. (1) 331221 160 Industrias CH, SAB de CV Mexico Republic Steel (5, including a RHQ) 331: 1, 2 725 Miba AG Austria Miba Sinter USA LLC (1) 3311 115 Mitsui & Co., Ltd.* Japan Steel Technologies LLC (2) 331221 130 NV Bekaert SA Belgium Bekaert Corp. (1) 331222 200 OAO TMK Russia TMK Ipsco (1) 33121 105 Shinagawa Refractories Co., Ltd. Japan Shinagawa Advanced Materials Americas, Inc. (1) 33151 28 Tata Sons Ltd./Tata Steel Ltd. India Thomas Steel Strip Corp. (1) 331221 285 Vallourec SA3 France Vallourec Star (1) 33121 550 Van Merksteijn International Netherlands Van Merksteijn USA, LLC (1) 331222 15
Notes: ^ - “Jobs” figures are thought to be the best available at the time of publication, but their accuracy cannot be guaranteed; * - a Fortune U.S.-1,000 or Global-500 company; RHQ – regional headquarters 1 – employment figures from company website; 2 – jobs figure from Binsted (2016); 3 – jobs figure from Business Tribune (2017). Sources: Business-Tribune (2017), company websites (2017), Fortune (2017), Lexis-Nexis (2017), Office of Research, ODSA (2016a).
The foreign parent companies are headquartered in 12 nations. France, Japan and the United Kingdom are home to two each. Australia, Austria, Belgium, Germany, India, Luxembourg, Mexico, the Netherlands and Russia are home to one each. ArcelorMittal and Industrias are the only companies with establishments in more than one specific industry.
8

A second way to understand the role of foreign investors in Ohio’s industry is to note their iron and raw steel production capacity. Four companies – ArcelorMittal, BlueScope Steel, Industrias and Vallourec – own six of the 12 major melt sites in Ohio. Their combined annual melt capacity is estimated at 9.0 to 9.9 million tons, which is most of Ohio’s total capacity. Furthermore, ArcelorMittal owns two of the three basic oxygen process (BOP) sites – in turn, most of Ohio’s primary steel production capacity. The significant role of foreign investment in Ohio’s iron and steel industry in this regard is not atypi-cal; foreign-based steel companies owned an estimated 43.4 percent of all major melt capacity in America and an esti-mated 50.0 percent of U.S. primary steel production capacity in 2013 (drawn from AIM Market Research, 2013). Foreign ownership or investment in the U.S. iron and steel industry is only one aspect of globalization. The converse as-pect has been the establishment of foreign operations by American companies. U.S.-based companies have set-up or acquired over-seas operation for various reasons: less regulation, lower labor costs, and/or a desire to expand world mar-ket share along with more rapid growth prospects in emerging economies. This is particularly true of iron and steel pro-ducers (Hadid, 2017), but much less so of foundry companies and producers using purchased steel (Leach, 2017; Yucel, 2017a, 2017b). Setting up operations outside of home countries – whether it is foreign companies here or U.S.-based companies elsewhere – circumvents trade barriers.
9

$144.3
$84.0
$8.5
$15.2
83
126
38
31
0
30
60
90
120
150
$0.0
$30.0
$60.0
$90.0
$120.0
$150.0
2013 2014 2015 2016
New
Jo
bs
An
tic
ipa
ted
An
no
un
ce
d In
ve
stm
en
ts(i
n m
illi
on
s)
Major Projects in Ohio's Iron & Steel Industry, 2013-2016
Announced Investments New Jobs Anticipated
Source: Office of Research, ODSA
10

RECENT EXPANSION AND ATTRACTION ANNOUNCEMENTS
Seventeen companies announced 20 major investments in Ohio’s iron and steel industry from 2013 through 2016. Plan-ned expenditures were nearly $252.0 million, with close to 280 new jobs anticipated when the projects are completed. The chart above shows that the largest aggregate amount of intended investments occurred in 2013, while the greatest number of new jobs was anticipated beginning in 2014. $131.0 million were intended for iron and steel mills and ferroalloy production (NAICS 3311), followed by $108.8 million for manufacturing steel products from purchased steel (3312), and almost $12.2 million for foundry work (33151). Those figures are 52.0, 43.2 and 4.8 percent of the total. 124 of the new jobs – 44.6 percent – were anticipated in the iron and steel mills and ferroalloys group, 86 – 30.9 percent – for the products from purchased steel group, and 68 – 24.5 percent – in the foundries sub-group. ArcelorMittal led all investors with two announcements totaling $84.1 million. It was followed by Vallourec Star with the single largest announcement – $65.0 million in 2013 – and TimkenSteel with $42.0 million. GKN Sinter Metals and Liber-ty Castings each anticipated adding at least 50 jobs when their projects were completed, closely followed by Arcelor-Mittal with 45 new jobs at its Tubular Products division. The counts and summary figures are drawn from a list of major investments compiled by the Office of Research (2014b-2017b). Companies on the list met at least one of the following criteria: at least $1 million committed for land, building(s) or equipment; at least 20,000 square feet of new space added to a facility; or a minimum of 20 or 50 new jobs (depending on the year). Many major investments are phased-in over two or three years, with employee counts following upon pro-ject completion. Dollar figures are not comparable with the Census Bureau’s capital expenditures data.
11
See Table A2

3.4%
11.2% 11.2% 11.1%
0.0%
2.0%
4.0%
6.0%
8.0%
10.0%
12.0%
Total GDP Combined VA (3311-2) Iron/Steel/Alloys VA (3311) Steel Products VA (3312)
Oh
io a
s a
Pe
rce
nta
ge
of
the
U.S
. T
ota
lsThe Concentration of the Iron & Steel Industry in Ohio, 2015
12
Sources: U.S. Bureaus of the Census and Economic Analysis
Gross Domestic Product Value-Added

IRON AND STEEL INDUSTRY CONCENTRATION IN OHIO
The chart above illustrates the concentration of iron and steel industry groups in Ohio. During 2015, 11.2 percent of the value-added by U.S. iron, steel and ferroalloy producers (NAICS 3311) came from plants in Ohio, while 11.1 percent of steel-products-from-purchased-steel (3312) value-added originated in Ohio. The two groups combined were 11.2 percent of national output (U.S. Bureau of the Census, 2017a).3 More industry-specific data from the 2012 Census of Manufac-tures in Appendix Table A3 show 9.9 percent of ferrous metal foundry (33151) value-added came from Ohio. When com-bined with iron, steel, ferroalloy and steel-products-purchased-steel output that year, 11.0 percent of total iron and steel industry value-added came from Ohio. By comparison, 3.4 percent of the value of all goods and services provided in America in 2015 originated in Ohio according to the latest gross domestic product (GDP) figures from the U.S. Bureau of Economic Analysis (2017).4 The greater portions of the former compared with the last indicate the concentration of the industry here. The following table shows that the summary concentration of the iron and steel industry is broadly based on all specific industries and not reflective of an extraordinary concentration in just one. Percent of Apparent Value-added Rank in Industry Code and Description in the U.S. the U.S.*
3311: Iron & Steel Mills & Ferroalloys 12.7% 3rd 33121: Iron & Steel Pipes & Tubes from Purchased Steel 16.4% 1st 331221: Rolled Steel Shapes from Purchased Steel 10.2% 1st 331222: Steel Wire Drawing from Purchased Steel 8.1% 2nd 331511: Iron Foundries 7.9% 5th 331512: Steel Investment Foundries 13.7% 2nd 331513: Steel Foundries (except Investment) 10.7% 2nd
Note: * - Not every state with at least one industry establishment can be ranked based on value-added due to confiden-tiality restraints. Source: U.S. Bureau of the Census (2015c). Three factors help explain the industry’s historical and continuing concentration in Ohio: the raw materials – principally iron ore and coal – are in the region; bulk transportation, whether by water or rail, of both raw materials and products is convenient; and secondary manufacturers using purchased iron and steel (3312 and 33151) prefer to locate near their suppliers (3311), keeping transportation costs low (drawn from Yucel, 2015).
13
See Table A3

3311: Iron & Steel Mills, 13,118, 51%
33121: Pipe & Tube Mfg., 3,564, 14%
331221: Rolled Steel Shapes, 932, 3%
331222: Steel Wire Drawing, 945, 4%
331511: Iron Foundries, 3,816, 15%
331512: Steel Investment Foundries, 1,741, 7%
331513: Other Steel Foundries, 1,710, 6%
Employment in Ohio's Iron and Steel Industryby Specific Industry, 2015
33151: Ferrous Foundries, 7,267, 28%
3312: Products from Purchased Steel,
5,441, 21%
Total: 25,821
14
Source: U.S. Census Bureau
THE COMPOSITION OF OHIO’S IRON AND STEEL INDUSTRY: EMPLOYMENT
180 establishments employed more than 25,800 people in Ohio’s iron and steel industry according to the latest compre-hensive data from the U.S. Bureau of the Census (2017b). 13,100-plus – 50.8 percent – worked in the iron-steel-ferro-alloys group (NAICS 3311). (Data gathered prior to implementing the 2012 NAICS show only a minute fraction of the group was in ferroalloy production.) The remaining industry employees were divided between the ferrous metal foundries subgroup (33151) with 7,200-plus – 28.1 percent of the industry – and the products-from-purchased-steel group (3312) with 5,400-plus and 21.1 percent. Iron foundries (331511) were the second largest employers after iron and steel mills with over 3,800 people (the plurality of which were people at GM’s Defiance foundry.) The remaining specific industries employed from 932 to 3,500-plus people – 3.6 to 13.8 percent of the industry total. Overall, 9.1 percent of the iron and steel industry establishments and 11.8 percent of the industry’s jobs in America are located in Ohio – concentrated when compared with Ohio’s portions of all private non-farm non-railroad establishments and employment – 3.3 and 3.8 percent, respectively. As with value-added in the preceding section, the concentration of industry employment was broadly based, not the result of extreme concentration in one specific industry. Portions in Ohio ranged from 6.3 to 14.2 percent of the corresponding U.S. totals (U.S. Bureau of the Census, 2017b).
15
See Table A4

$45,161
$65,700
$75,319
$59,017
$62,866
$51,710$50,012
$53,385 $53,347
$58,684
$47,156 $47,739
89.6%
104.2%
100.4%
108.5%111.8%
98.7%
85.9%
108.7%
105.0%
116.7%
90.9%93.5%
0.0%
20.0%
40.0%
60.0%
80.0%
100.0%
120.0%
$0
$20,000
$40,000
$60,000
$80,000
$100,000
$120,000
As P
erc
en
tag
e o
f U
.S.
An
nu
al
Pay i
n O
hio
Annual Pay in Ohio's Iron and Steel Industryby Groups and Individual Industries, 2015
16
Source: U.S. Census Bureau

INDUSTRY PAY
The chart above shows that annual pay for all non-farm, non-railroad private sector employees in Ohio averaged more than $45,100 in 2015. People employed in the state’s iron and steel industry averaged $65,700, but there is much varia-tion within. Pay was greatest in the iron-steel-ferroalloys group (NAICS 3311, $75,300-plus), followed by the products-from-purchased-steel group (3312, about $59,000) and ferrous metal foundries (33151, $53,300-plus). The chart also illustrates the variation within the latter two groups. The high pay in pipes and tubes (33121, $62,800-plus) is offset by the lower pay in rolled steel shapes (331221, about $50,000), while pay in wire drawing (331222, just under $53,400) fell in between. Similarly, the relatively high pay in iron foundries (331511, nearly $58,700) offsets the lower pay of work in steel foundries (331512 and 3, $47,100-plus and $47,700-plus). Nevertheless, pay in all specific industries was greater than the near-all-Ohio average of $45,100-plus. Mean iron and steel industry pay in Ohio was 104.2 percent of the corresponding U.S. average. Again, there is notable variation from one specific industry to the next:
• 331221: rolling steel shapes from purchased steel – 85.9 percent;
• 331512 and 3: steel foundries – 90.9 and 93.5 percent;
• 3311: iron and steel mill production – 100.4 percent;
• 331222: wire drawing from purchased steel – 108.7 percent;
• 33121: pipes and tubes from purchased steel – 111.8 percent;
• 33151: iron foundries – 116.7 percent.
17
See Table A5

! ! ! ! ! ! ! ! ! !
! ! ! ! ! ! ! ! ! !
! ! ! ! ! ! ! ! ! !
! ! ! ! ! ! ! ! ! !
! ! ! ! ! ! ! ! ! !
! ! ! ! ! ! ! ! ! !
! ! ! ! ! ! ! ! ! !
! ! ! ! ! ! ! ! ! !
! ! ! ! ! ! ! ! ! !
! ! ! ! ! ! ! ! !
! ! ! ! ! ! ! ! !
! ! ! ! ! ! ! ! !
! ! ! ! ! ! ! ! !
! ! ! ! ! ! ! ! !
! ! ! ! ! ! ! ! !
! ! ! ! ! ! ! ! !
! ! ! ! ! ! ! ! !
! ! ! !
! ! ! !
! ! ! !
! ! !
! ! !
! ! !
! ! ! ! ! ! ! !
! ! ! ! ! ! ! !
! ! ! ! ! ! ! !
! ! ! ! ! ! ! !
! ! ! ! ! ! ! !
! ! ! ! ! ! ! !
! ! ! ! ! ! ! !
! ! ! ! ! ! !
! ! ! ! ! ! !
! ! ! ! ! ! !
! ! ! ! ! ! !
! ! ! ! ! ! !
! ! ! ! ! ! !
! ! ! ! ! ! !
! ! ! ! ! !
! ! ! ! ! !
! ! ! ! ! !
! ! ! ! ! !
! ! ! ! ! !
! ! ! ! !
! ! ! ! !
! ! ! ! !
! ! ! ! !
! ! !
! ! !
! ! !
! ! !
! ! !
! ! !
! ! ! ! !
! ! ! ! !
! ! ! ! !
! ! ! ! !
! ! ! ! !
! ! ! ! !
! ! ! ! !
! ! ! ! !
! ! ! ! !
! ! ! ! !
! ! ! ! !
! ! ! ! !
! ! ! ! ! ! !
! ! ! ! ! ! !
! ! ! ! ! ! !
! ! ! ! ! ! !
! ! ! ! ! ! !
! ! ! ! ! ! !
! ! ! ! ! ! !
! ! ! ! ! ! !
! ! ! ! ! ! !
! ! ! ! ! ! !
! ! ! ! ! ! !
! ! !
! ! !
! ! !
! ! !
! ! !
! ! !
! ! !
! ! !
! ! !
! ! !
! ! !
! ! !
! ! ! !
! ! ! !
! ! ! !
! ! ! !
! ! ! ! ! ! ! ! !
! ! ! ! ! ! ! ! !
! ! ! ! ! ! ! ! !
! ! ! ! ! ! ! ! !
! ! ! ! ! ! ! ! !
! ! ! ! ! ! ! ! !
! ! ! ! ! ! ! ! !
! ! ! ! ! ! ! ! !
! ! ! ! ! ! ! ! !
! ! ! ! ! ! ! !
! ! ! ! ! ! ! !
! ! ! ! ! ! ! !
! ! ! ! ! ! ! !
! ! ! ! ! ! ! !
! ! ! ! ! ! ! !
! ! ! ! ! ! ! !
! ! ! ! ! ! ! !
! ! ! !
! ! ! !
! ! ! !
! ! !
! ! !
! ! !
! ! ! ! ! ! ! !
! ! ! ! ! ! ! !
! ! ! ! ! ! ! !
! ! ! ! ! ! ! !
! ! ! ! ! ! ! !
! ! ! ! ! ! ! !
! ! ! ! ! ! ! !
! ! ! ! ! ! ! !
! ! ! ! ! ! ! !
! ! ! ! ! ! ! !
! ! ! ! ! ! ! !
! ! ! ! ! ! !
! ! ! ! ! ! !
! ! ! ! ! ! !
! ! ! ! ! ! !
! ! ! ! ! ! !
! ! ! ! ! ! !
! ! ! ! ! ! !
! ! ! ! ! ! !
! ! ! ! ! ! !
! ! ! ! ! ! !
! ! ! ! ! !
! ! ! ! ! !
! ! ! ! ! !
! ! ! ! ! !
! ! ! ! ! !
! ! ! ! ! !
! ! ! ! ! !
! ! ! ! !
! ! ! ! !
! ! ! ! !
! ! ! ! !
! ! ! ! !
! ! ! ! !
! ! ! !
! ! ! !
! ! ! !
! ! !
! ! !
! ! ! ! ! ! !
! ! ! ! ! ! !
! ! ! ! ! ! !
! ! ! ! ! ! !
! ! ! ! ! ! !
! ! ! ! ! !
! ! ! ! ! !
! ! ! ! ! !
! ! ! ! ! !
! ! ! ! ! !
! ! ! ! ! !
! ! ! ! ! !
! ! ! ! ! !
! ! ! ! ! !
! ! ! ! ! !
! ! ! ! ! !
! ! ! ! ! !
! ! !
! ! !
! ! !
! ! !
! ! !
! ! !
! ! !
! ! ! !
! ! ! !
! ! ! !
! ! !
! ! !
! ! !
! ! ! ! ! !
! ! ! ! ! !
! ! ! ! ! !
! ! ! ! ! !
! ! ! ! ! !
! ! ! ! ! !
! ! ! ! ! !
! ! ! ! ! !
! ! ! ! ! !
! ! ! ! ! ! ! ! !
! ! ! ! ! ! ! ! !
! ! ! ! ! ! ! ! !
! ! ! ! ! ! ! ! !
! ! ! ! ! ! ! ! !
! ! ! ! ! ! ! ! !
! ! ! ! ! ! ! ! !
! ! ! ! ! ! ! ! !
! ! ! ! ! ! ! ! !
! ! ! ! ! ! ! !
! ! ! ! ! ! ! !
! ! ! ! ! ! ! !
! ! ! ! ! ! ! !
! ! ! ! ! ! ! !
! ! ! ! ! ! ! !
! ! ! ! ! ! ! !
! ! ! ! ! ! ! !
! ! ! ! ! ! ! !
! ! !
! ! !
! ! !
! ! !
! ! !
! ! ! !
! ! ! !
! ! ! !
! ! !
! ! !
! ! !
! ! ! ! ! ! ! ! ! ! ! ! ! ! ! ! ! ! !
! ! ! ! ! ! ! ! ! ! ! ! ! ! ! ! ! ! !
! ! ! ! ! ! ! ! ! ! ! ! ! ! ! ! ! ! !
! ! ! ! ! ! ! ! ! ! ! ! ! ! ! ! ! ! !
! ! ! ! ! ! ! ! ! ! ! ! ! ! ! ! ! ! !
! ! ! ! ! ! ! ! ! ! ! ! ! ! ! ! ! ! !
! ! ! ! ! ! ! ! ! ! ! ! ! ! ! ! ! ! !
! ! ! ! ! ! ! ! ! ! ! ! ! ! ! ! ! ! !
! ! ! ! ! ! ! ! ! ! ! ! ! ! ! ! ! ! !
! ! ! ! ! ! ! ! ! ! ! ! ! ! ! ! ! ! !
! ! ! ! ! ! ! ! ! ! ! ! ! ! ! ! ! ! !
! ! ! ! ! ! ! ! ! ! ! ! ! ! ! ! ! ! !
! ! ! ! ! ! ! ! ! ! ! ! ! ! ! ! ! ! !
! ! ! ! ! ! ! ! ! ! ! ! ! ! ! ! ! ! !
! ! ! ! ! ! ! ! ! ! ! ! ! ! ! ! ! ! !
! ! ! ! ! ! ! ! ! ! ! ! ! ! ! ! ! ! !
! ! ! ! ! ! ! ! ! ! ! ! ! ! ! ! ! ! !
! ! ! ! ! ! ! ! ! ! ! ! ! ! ! ! ! !
! ! ! ! ! ! ! ! ! ! ! ! ! ! ! ! ! !
! ! ! ! ! ! ! ! ! ! ! ! ! ! ! ! ! !
! ! ! ! ! ! ! ! ! ! ! ! ! ! ! ! ! !
! ! ! ! ! ! ! ! ! ! ! ! ! ! ! ! ! !
! ! ! ! ! ! ! ! ! ! ! ! ! ! ! ! ! !
! ! ! ! ! ! ! ! ! ! ! ! ! ! ! ! ! !
! ! ! ! ! ! ! ! ! ! ! ! ! ! ! ! ! !
! ! ! ! ! ! ! ! ! ! ! ! ! ! ! ! ! !
! ! ! ! ! ! ! ! ! ! ! ! ! ! ! ! ! !
! ! ! ! ! ! ! ! ! ! ! ! ! ! ! ! ! !
! ! ! ! ! ! ! ! ! ! ! ! ! ! ! ! ! !
! ! ! ! ! ! ! ! ! ! ! ! ! ! ! ! ! !
! ! ! ! ! ! ! ! ! ! ! ! ! ! ! ! ! !
! ! ! ! ! ! ! ! ! ! ! ! ! ! ! ! ! !
! ! ! ! ! ! ! ! ! ! ! ! ! ! ! ! ! !
! ! ! ! ! ! ! ! ! !
! ! ! ! ! ! ! ! ! !
! ! ! ! ! ! ! ! ! !
! ! ! ! ! ! ! ! ! !
! ! ! ! ! ! ! ! ! !
! ! ! ! ! ! ! ! ! !
! ! ! ! ! ! ! ! ! !
! ! ! ! ! ! ! ! ! !
! ! ! ! ! ! ! ! ! !
! ! ! ! ! ! ! ! !
! ! ! ! ! ! ! ! !
! ! ! ! ! ! ! ! !
! ! ! ! ! ! ! ! !
! ! ! ! ! ! ! ! !
! ! ! ! ! ! ! ! !
! ! ! ! ! ! ! ! !
! ! ! ! ! ! ! ! !
! ! ! ! !
! ! ! ! !
! ! ! ! !
! ! ! ! !
! ! ! ! !
! ! ! ! !
! ! ! ! !
! ! ! !
! ! ! !
! ! ! !
! ! ! !
! ! ! !
! ! ! !
! ! ! ! ! !
! ! ! ! ! !
! ! ! ! ! !
! ! ! ! ! !
! ! ! ! ! !
! ! ! ! !
! ! ! ! !
! ! ! ! !
! ! ! ! !
! ! ! ! !
! ! ! ! ! !
! ! ! ! ! !
! ! ! ! ! !
! ! ! ! ! !
! ! ! ! ! !
! ! ! ! ! !
! ! ! ! ! !
! ! ! ! ! !
! ! ! ! ! !
! ! ! ! ! !
! ! ! ! ! !
! ! ! !
! ! ! !
! ! ! !
! ! ! !
! ! ! !
! ! ! !
! ! ! ! ! !
! ! ! ! ! !
! ! ! ! ! !
! ! ! ! ! !
! ! ! ! ! !
! ! ! ! ! !
! ! ! ! ! !
! ! ! ! ! !
! ! ! ! ! !
! ! ! ! ! !
! ! ! ! ! !
! ! ! ! ! !
! ! ! ! ! !
! ! ! ! ! !
! ! ! ! ! !
! ! ! ! ! !
! ! ! ! ! !
! ! ! ! ! !
! ! ! ! ! !
! ! ! ! ! !
! ! ! ! ! !
! ! ! ! !
! ! ! ! !
! ! ! ! !
! ! ! ! !
! ! ! ! !
! ! ! ! ! !
! ! ! ! ! !
! ! ! ! ! !
! ! ! ! ! !
! ! ! ! ! !
! ! ! ! ! !
! ! ! ! ! !
! ! ! ! ! !
! ! ! ! ! !
! ! ! ! ! !
! ! ! !
! ! ! !
! ! ! !
! ! ! !
! ! !
! ! !
! ! !
! ! !
! ! ! !
! ! ! !
! ! ! !
! ! ! !
! ! ! !
! ! ! !
! ! ! ! ! ! ! ! ! ! ! ! ! ! !
! ! ! ! ! ! ! ! ! ! ! ! ! ! !
! ! ! ! ! ! ! ! ! ! ! ! ! ! !
! ! ! ! ! ! ! ! ! ! ! ! ! ! !
! ! ! ! ! ! ! ! ! ! ! ! ! ! !
! ! ! ! ! ! ! ! ! ! ! ! ! ! !
! ! ! ! ! ! ! ! ! ! ! ! ! ! !
! ! ! ! ! ! ! ! ! ! ! ! ! ! !
! ! ! ! ! ! ! ! ! ! ! ! ! ! !
! ! ! ! ! ! ! ! ! ! ! ! ! ! !
! ! ! ! ! ! ! ! ! ! ! ! ! ! !
! ! ! ! ! ! ! ! ! ! ! ! ! !
! ! ! ! ! ! ! ! ! ! ! ! ! !
! ! ! ! ! ! ! ! ! ! ! ! ! !
! ! ! ! ! ! ! ! ! ! ! ! ! !
! ! ! ! ! ! ! ! ! ! ! ! ! !
! ! ! ! ! ! ! ! ! ! ! ! ! !
! ! ! ! ! ! ! ! ! ! ! ! ! !
! ! ! ! ! ! ! ! ! ! ! ! ! !
! ! ! ! ! ! ! ! ! ! ! ! ! !
! ! ! ! ! ! ! ! ! ! ! ! ! !
! ! ! !
! ! ! !
! ! ! !
! ! !
! ! !
! ! !
! ! ! ! ! !
! ! ! ! ! !
! ! ! ! ! !
! ! ! ! ! !
! ! ! ! ! !
! ! ! ! ! !
! ! ! ! ! !
! ! ! ! ! !
! ! ! ! ! !
! ! ! ! ! !
! ! ! ! ! !
! ! ! ! ! !
! ! ! ! ! !
! ! ! ! ! !
! ! ! !
! ! ! !
! ! ! !
! ! ! !
! ! !
! ! !
! ! !
! ! !
! ! ! ! ! ! !
! ! ! ! ! ! !
! ! ! ! ! ! !
! ! ! ! ! ! !
! ! ! ! ! ! !
! ! ! ! ! ! !
! ! ! ! ! ! !
! ! ! ! ! !
! ! ! ! ! !
! ! ! ! ! !
! ! ! ! ! !
! ! ! ! ! !
! ! ! ! ! !
! ! ! ! ! ! ! ! !
! ! ! ! ! ! ! ! !
! ! ! ! ! ! ! ! !
! ! ! ! ! ! ! ! !
! ! ! ! ! ! ! ! !
! ! ! ! ! ! ! ! !
! ! ! ! ! ! ! ! !
! ! ! ! ! ! ! ! !
! ! ! ! ! ! ! ! !
! ! !
! ! !
! ! !
! ! !
! !
! !
! !
! !
! ! ! ! ! ! !
! ! ! ! ! ! !
! ! ! ! ! ! !
! ! ! ! ! ! !
! ! ! ! ! ! !
! ! ! ! ! !
! ! ! ! ! !
! ! ! ! ! !
! ! ! ! ! !
! ! ! ! ! ! ! ! ! !
! ! ! ! ! ! ! ! ! !
! ! ! ! ! ! ! ! ! !
! ! ! ! ! ! ! ! ! !
! ! ! ! ! ! ! ! ! !
! ! ! ! ! ! ! ! ! !
! ! ! ! ! ! ! ! !
! ! ! ! ! ! ! ! !
! ! ! ! ! ! ! ! !
! ! ! ! ! ! ! ! !
! ! ! ! ! ! ! ! !
! ! ! ! ! ! ! ! !
! ! !
! ! !
! ! !
! ! !
! ! !
! ! !
! ! !
! ! ! ! ! !
! ! ! ! ! !
! ! ! ! ! !
! ! ! ! ! !
! ! ! ! ! !
! ! ! ! ! !
! ! ! ! !
! ! ! ! !
! ! ! ! !
! ! ! ! !
! ! ! ! !
! ! ! ! ! !
! ! ! ! ! !
! ! ! ! ! !
! ! ! ! ! !
! ! ! ! ! !
! ! ! ! ! !
! ! ! ! ! !
! ! ! ! ! !
! ! ! ! ! !
! ! ! ! ! !
! ! ! ! ! !
! ! ! ! !
! ! ! ! !
! ! ! ! !
! ! ! ! !
! ! ! ! !
! ! ! ! !
! ! ! ! !
! ! ! ! !
! ! ! ! !
! ! ! ! !
! ! ! ! ! ! !
! ! ! ! ! ! !
! ! ! ! ! ! !
! ! ! ! ! ! !
! ! ! ! ! ! !
! ! ! ! ! ! !
! ! ! ! ! ! !
! ! ! ! ! ! !
! ! ! ! ! ! !
! ! ! ! ! ! !
! ! ! ! ! ! !
! ! ! ! ! !
! ! ! ! ! !
! ! ! ! ! !
! ! ! ! ! !
! ! ! ! ! !
! ! ! ! !
! ! ! ! !
! ! ! ! !
! ! ! ! !
! ! ! !
! ! ! !
! ! ! !
! ! ! !
! ! !
! ! !
! ! !
! ! !
! ! ! !
! ! ! !
! ! ! !
! ! !
! ! !
! ! ! ! !
! ! ! ! !
! ! ! ! !
! ! ! ! !
! ! ! ! !
! ! ! ! !
! ! ! ! !
! ! ! ! !
! ! ! ! !
! ! ! ! !
! ! ! ! !
! ! ! ! ! !
! ! ! ! ! !
! ! ! ! ! !
! ! ! ! ! !
! ! ! ! ! !
! ! ! ! !
! ! ! ! !
! ! ! ! !
! ! ! ! !
! ! ! ! !
! ! ! ! ! ! ! ! ! ! ! ! ! ! ! ! ! ! ! !
! ! ! ! ! ! ! ! ! ! ! ! ! ! ! ! ! ! ! !
! ! ! ! ! ! ! ! ! ! ! ! ! ! ! ! ! ! ! !
! ! ! ! ! ! ! ! ! ! ! ! ! ! ! ! ! ! ! !
! ! ! ! ! ! ! ! ! ! ! ! ! ! ! ! ! ! ! !
! ! ! ! ! ! ! ! ! ! ! ! ! ! ! ! ! ! ! !
! ! ! ! ! ! ! ! ! ! ! ! ! ! ! ! ! ! ! !
! ! ! ! ! ! ! ! ! ! ! ! ! ! ! ! ! ! ! !
! ! ! ! ! ! ! ! ! ! ! ! ! ! ! ! ! ! ! !
! ! ! ! ! ! ! ! ! ! ! ! ! ! ! ! ! ! ! !
! ! ! ! ! ! ! ! ! ! ! ! ! ! ! ! ! ! ! !
! ! ! ! ! ! ! ! ! ! ! ! ! ! ! ! ! ! ! !
! ! ! ! ! ! ! ! ! ! ! ! ! ! ! ! ! ! ! !
! ! ! ! ! ! ! ! ! ! ! ! ! ! ! ! ! ! ! !
! ! ! ! ! ! ! ! ! ! ! ! ! ! ! ! ! ! ! !
! ! ! ! ! ! ! ! ! ! ! ! ! ! ! ! ! ! ! !
! ! ! ! ! ! ! ! ! ! ! ! ! ! ! ! ! ! ! !
! ! ! ! ! ! ! ! ! ! ! ! ! ! ! ! ! ! ! !
! ! ! ! ! ! ! ! ! ! ! ! ! ! ! ! ! ! ! !
! ! ! ! ! ! ! ! ! ! ! ! ! ! ! ! ! ! ! !
! ! ! ! ! ! ! ! ! ! ! ! ! ! ! ! ! ! ! !
! ! ! ! ! ! ! ! ! ! ! ! ! ! ! ! ! ! ! !
! ! ! ! ! ! ! ! ! ! ! ! ! ! ! ! ! ! ! !
! ! ! ! ! ! ! ! ! ! ! ! ! ! ! ! ! ! ! !
! ! ! ! ! ! ! ! ! ! ! ! ! ! ! ! ! ! ! !
! ! ! ! ! ! ! ! ! ! ! ! ! ! ! ! ! ! ! !
! ! ! ! ! ! ! ! ! ! ! ! ! ! ! ! ! ! ! !
! ! ! ! ! ! ! ! ! ! ! ! ! ! ! ! ! ! ! !
! ! ! ! ! ! ! ! ! ! ! ! ! ! ! ! ! ! ! !
! ! ! ! ! ! ! ! ! ! ! ! ! ! ! ! ! ! ! !
! ! ! ! ! ! ! ! ! ! ! ! ! ! ! ! ! ! ! !
! ! ! ! ! ! ! ! ! ! ! ! ! ! ! ! ! ! ! !
! ! ! ! ! ! ! ! ! ! ! ! ! ! ! ! ! ! ! !
1
2
Stark14
Wood2
Darke1
Scioto2
Wayne3
Perry1
Clark1
Allen1
Butler5
Lorain4
Logan1 Union
2
Trumbull10
Hardin2
Henry1
Franklin6
Miami3
Fulton4
Erie1
Hancock3
Putnam1
Lucas5
Carroll1
Shelby1
Richland6
Clinton1
Greene1
Muskingum2
Marion3
Medina2
Warren1
Holmes1
Guernsey1
Madison1
Washington6
Coshocton3
Geauga1
Summit7
Jackson2
Tuscarawas3
Delaware2
Williams2
Paulding1
Defiance1
Auglaize2
Cuyahoga19
Wyandot1
Hamilton3
Columbiana7
Mahoning10
Lake5
Jefferson2
Montgomery9
Ross
Pike
Knox
Licking
AdamsGallia
HuronSeneca
Brown
Athens
Meigs
Ashtabula
NoblePreble
Mercer
Portage
Belmont
Vinton
Fairfield
Highland
Monroe
FayettePickaway Morgan
Hocking
Ashland
Morrow
Clermont
Harrison
Lawrence
Van WertCrawford
Sandusky
Champaign
Ottawa
Columbus
Akron
Toledo
Dayton
Cincinnati,OH-KY-IN
Cleveland-Elyria
Ohio Steel IndustryEstablishments by County
Statewide: 180
Steel IndustryEstablishments
in County
! ! ! ! ! ! !
! ! ! ! ! ! !
! ! ! ! ! ! !
! ! ! ! ! ! !
! ! ! ! ! ! !
! ! ! ! ! ! !
! ! ! ! ! ! !
! ! ! ! ! ! !
11 - 19
! ! ! !
! ! ! !
! ! !
! ! !
6 - 10
! ! !
! ! !
! !
! !
2 - 5
! !
! !
1
None
Source:2015 County Business Patterns
U.S. Census Bureau
Prepared by:Office of Research
Ohio Development Services AgencyNovember 2017
R102717A
18
Large Metro*
1 Canton-Massillon, OH2 Youngstown-Warren- Boardman, OH-PA
*Only those portions of the 8 MetropolitanStatistical Areas (Metros) that contain 2 or
more counties in Ohio are shown.

THE DISTRIBUTION OF INDUSTRY ESTABLISHMENTS IN OHIO
The map above illustrates the distribution of the 180 iron and steel industry establishments across Ohio according to the latest County Business Patterns data. Fifty-three counties had at least one industry establishment. However, just over one-half of the establishments were found in 10 counties: Cuyahoga had 19; Stark, 14; Mahoning and Trumbull, 10 each; Montgomery, nine; Columbiana and Summit, seven each; and Franklin, Richland and Washington, six each. The remain-ing 43 counties with establishments each had from one to five. One way to look at the map is to note the clustering of establishments in Northeastern metropolitan areas (MAs) long-noted for iron and steel operations. Canton-Massillon, Cleveland-Elyria, Mansfield and Youngstown-Warren, a total of 10 counties, have 72 establishments, or 40 percent of the industry total. This concentration is associated with the presence of nine major melt facilities in five counties in these MAs: Cuyahoga (ArcelorMittal’s two, and Charter), Lorain (Republic), Mahoning (Vallourec), Richland (AK Steel and Arcelor) and Stark (Republic and TimkenSteel). The five counties and these companies combine for roughly 64 percent of the state’s major melt capacity, including two of the three basic oxy-gen process sites. (The remaining major melt sites in the area use electric arc furnaces.) Yet 60 percent the industry establishments are outside of Northeastern Ohio regardless of metropolitan status. However, 14 counties in the Cincinnati, Columbus, Dayton and Toledo MAs combined for 45 establishments – 25 percent of Ohio’s total, including two major melt facilities in Butler and Fulton Counties (AK Steel and North Star BlueScope, respectively). Marion and Defiance Counties are the non-metropolitan exceptions with major establishments: Nucor and General Motors (the latter is Ohio’s largest foundry operator).
19
See Table A6
! ! ! ! ! ! ! ! ! !
! ! ! ! ! ! ! ! ! !
! ! ! ! ! ! ! ! ! !
! ! ! ! ! ! ! ! ! !
! ! ! ! ! ! ! ! ! !
! ! ! ! ! ! ! ! ! !
! ! ! ! ! ! ! ! ! !
! ! ! ! ! ! ! ! ! !
! ! ! ! ! ! ! ! ! !
! ! ! ! ! ! ! ! !
! ! ! ! ! ! ! ! !
! ! ! ! ! ! ! ! !
! ! ! ! ! ! ! ! !
! ! ! ! ! ! ! ! !
! ! ! ! ! ! ! ! !
! ! ! ! ! ! ! ! !
! ! ! ! ! ! ! ! !
! ! ! !
! ! ! !
! ! ! !
! ! !
! ! !
! ! !
! ! ! ! ! ! ! !
! ! ! ! ! ! ! !
! ! ! ! ! ! ! !
! ! ! ! ! ! ! !
! ! ! ! ! ! ! !
! ! ! ! ! ! ! !
! ! ! ! ! ! ! !
! ! ! ! ! ! !
! ! ! ! ! ! !
! ! ! ! ! ! !
! ! ! ! ! ! !
! ! ! ! ! ! !
! ! ! ! ! ! !
! ! ! ! ! ! !
! ! ! !
! ! ! !
! ! ! !
! ! ! !
! ! ! !
! ! !
! ! !
! ! !
! ! !
! ! !
! ! !
! ! !
! ! !
! ! !
! ! !
! !
! !
! !
! !
! ! ! ! ! ! ! ! ! !
! ! ! ! ! ! ! ! ! !
! ! ! ! ! ! ! ! ! !
! ! ! ! ! ! ! ! ! !
! ! ! ! ! ! ! ! ! !
! ! ! ! ! ! ! ! ! !
! ! ! ! ! ! ! ! ! !
! ! ! ! ! ! ! ! ! !
! ! ! ! ! ! ! ! ! !
! ! ! ! ! ! ! ! ! !
! ! ! ! ! ! ! ! ! !
! ! ! ! ! ! ! ! ! !
! ! ! ! ! ! ! ! ! !
! ! ! ! ! ! ! ! ! !
! ! ! ! ! ! ! ! ! !
! ! !
! ! !
! ! !
! ! !
! ! !
! ! !
! ! !
! ! !
! ! !
! ! !
! ! !
! ! !
! ! ! !
! ! ! !
! ! ! !
! ! ! !
! ! ! ! !
! ! ! ! !
! ! ! ! !
! ! ! ! !
! ! ! ! !
! ! ! ! !
! ! ! ! !
! ! ! ! !
! ! ! ! !
! ! ! ! !
! ! ! ! !
! ! ! !
! ! ! !
! ! ! !
! ! !
! ! !
! ! !
! ! ! ! ! ! ! !
! ! ! ! ! ! ! !
! ! ! ! ! ! ! !
! ! ! ! ! ! ! !
! ! ! ! ! ! ! !
! ! ! ! ! ! ! !
! ! ! ! ! ! ! !
! ! ! ! ! ! ! !
! ! ! ! ! ! ! !
! ! ! ! ! ! ! !
! ! ! ! ! ! ! !
! ! ! ! ! ! !
! ! ! ! ! ! !
! ! ! ! ! ! !
! ! ! ! ! ! !
! ! ! ! ! ! !
! ! ! ! ! ! !
! ! ! ! ! ! !
! ! ! ! ! ! !
! ! ! ! ! ! !
! ! ! ! ! ! !
! ! ! ! ! ! ! ! !
! ! ! ! ! ! ! ! !
! ! ! ! ! ! ! ! !
! ! ! ! ! ! ! ! !
! ! ! ! ! ! ! ! !
! ! ! ! ! ! ! ! !
! ! ! ! ! ! ! ! !
! ! ! ! ! ! ! ! !
! ! ! ! ! ! ! ! !
! ! ! ! ! ! ! ! !
! ! ! ! ! ! ! ! !
! ! ! ! ! ! ! !
! ! ! ! ! ! ! !
! ! ! ! ! ! ! !
! ! ! ! ! ! ! !
! ! ! ! ! ! ! !
! ! ! ! ! ! ! !
! ! ! ! ! ! ! !
! ! ! ! ! ! ! !
! ! ! ! ! ! ! !
! ! ! ! ! ! ! !
! ! ! ! ! ! ! !
! ! ! !
! ! ! !
! ! ! !
! ! !
! ! !
! ! ! ! ! ! !
! ! ! ! ! ! !
! ! ! ! ! ! !
! ! ! ! ! ! !
! ! ! ! ! ! !
! ! ! ! ! !
! ! ! ! ! !
! ! ! ! ! !
! ! ! ! ! !
! ! ! ! ! !
! ! ! ! ! !
! ! ! ! ! !
! ! ! ! ! !
! ! ! ! ! !
! ! ! ! ! !
! ! ! ! ! !
! ! ! ! ! !
! ! ! ! !
! ! ! ! !
! ! ! ! !
! ! ! ! !
! ! ! ! !
! ! ! ! !
! ! ! ! !
! ! ! ! !
! ! ! ! !
! ! ! ! ! ! ! ! ! !
! ! ! ! ! ! ! ! ! !
! ! ! ! ! ! ! ! ! !
! ! ! ! ! ! ! ! ! !
! ! ! ! ! ! ! ! ! !
! ! ! ! ! ! ! ! ! !
! ! ! ! ! ! ! ! ! !
! ! ! ! ! ! ! ! ! !
! ! ! ! ! ! ! ! ! !
! ! ! ! ! ! ! ! ! !
! ! ! ! ! ! ! ! ! !
! ! ! ! ! ! ! ! ! !
! ! ! ! ! ! ! ! ! !
! ! ! ! ! ! ! ! !
! ! ! ! ! ! ! ! !
! ! ! ! ! ! ! ! !
! ! ! ! ! ! ! ! !
! ! ! ! ! ! ! ! !
! ! ! ! ! ! ! ! !
! ! ! ! ! ! ! ! !
! ! ! ! ! ! ! !
! ! ! ! ! ! ! !
! ! ! ! ! ! ! !
! ! ! ! ! ! ! !
! ! ! ! ! ! ! !
! ! ! ! ! ! ! !
! ! ! ! ! ! ! !
! ! ! ! ! ! ! ! !
! ! ! ! ! ! ! ! !
! ! ! ! ! ! ! ! !
! ! ! ! ! ! ! ! !
! ! ! ! ! ! ! ! !
! ! ! ! ! ! ! ! !
! ! ! ! ! ! ! ! !
! ! ! ! ! ! ! ! !
! ! ! ! ! ! ! ! !
! ! ! ! ! ! ! !
! ! ! ! ! ! ! !
! ! ! ! ! ! ! !
! ! ! ! ! ! ! !
! ! ! ! ! ! ! !
! ! ! ! ! ! ! !
! ! ! ! ! ! ! !
! ! ! ! ! ! ! !
! ! ! ! ! ! ! !
! ! !
! ! !
! ! !
! ! !
! ! !
! ! ! !
! ! ! !
! ! ! !
! ! !
! ! !
! ! !
! ! ! ! ! ! ! ! ! ! ! ! ! ! ! ! ! ! !
! ! ! ! ! ! ! ! ! ! ! ! ! ! ! ! ! ! !
! ! ! ! ! ! ! ! ! ! ! ! ! ! ! ! ! ! !
! ! ! ! ! ! ! ! ! ! ! ! ! ! ! ! ! ! !
! ! ! ! ! ! ! ! ! ! ! ! ! ! ! ! ! ! !
! ! ! ! ! ! ! ! ! ! ! ! ! ! ! ! ! ! !
! ! ! ! ! ! ! ! ! ! ! ! ! ! ! ! ! ! !
! ! ! ! ! ! ! ! ! ! ! ! ! ! ! ! ! ! !
! ! ! ! ! ! ! ! ! ! ! ! ! ! ! ! ! ! !
! ! ! ! ! ! ! ! ! ! ! ! ! ! ! ! ! ! !
! ! ! ! ! ! ! ! ! ! ! ! ! ! ! ! ! ! !
! ! ! ! ! ! ! ! ! ! ! ! ! ! ! ! ! ! !
! ! ! ! ! ! ! ! ! ! ! ! ! ! ! ! ! ! !
! ! ! ! ! ! ! ! ! ! ! ! ! ! ! ! ! ! !
! ! ! ! ! ! ! ! ! ! ! ! ! ! ! ! ! ! !
! ! ! ! ! ! ! ! ! ! ! ! ! ! ! ! ! ! !
! ! ! ! ! ! ! ! ! ! ! ! ! ! ! ! ! ! !
! ! ! ! ! ! ! ! ! ! ! ! ! ! ! ! ! !
! ! ! ! ! ! ! ! ! ! ! ! ! ! ! ! ! !
! ! ! ! ! ! ! ! ! ! ! ! ! ! ! ! ! !
! ! ! ! ! ! ! ! ! ! ! ! ! ! ! ! ! !
! ! ! ! ! ! ! ! ! ! ! ! ! ! ! ! ! !
! ! ! ! ! ! ! ! ! ! ! ! ! ! ! ! ! !
! ! ! ! ! ! ! ! ! ! ! ! ! ! ! ! ! !
! ! ! ! ! ! ! ! ! ! ! ! ! ! ! ! ! !
! ! ! ! ! ! ! ! ! ! ! ! ! ! ! ! ! !
! ! ! ! ! ! ! ! ! ! ! ! ! ! ! ! ! !
! ! ! ! ! ! ! ! ! ! ! ! ! ! ! ! ! !
! ! ! ! ! ! ! ! ! ! ! ! ! ! ! ! ! !
! ! ! ! ! ! ! ! ! ! ! ! ! ! ! ! ! !
! ! ! ! ! ! ! ! ! ! ! ! ! ! ! ! ! !
! ! ! ! ! ! ! ! ! ! ! ! ! ! ! ! ! !
! ! ! ! ! ! ! ! ! ! ! ! ! ! ! ! ! !
! ! ! ! ! ! !
! ! ! ! ! ! !
! ! ! ! ! ! !
! ! ! ! ! ! !
! ! ! ! ! ! !
! ! ! ! ! ! !
! ! ! ! ! !
! ! ! ! ! !
! ! ! ! ! !
! ! ! ! ! !
! ! ! ! ! !
! ! ! ! ! !
! ! !
! ! !
! ! !
! ! !
! ! !
! ! !
! ! !
! ! ! ! ! !
! ! ! ! ! !
! ! ! ! ! !
! ! ! ! ! !
! ! ! ! ! !
! ! ! ! !
! ! ! ! !
! ! ! ! !
! ! ! ! !
! ! ! ! !
! ! ! ! ! ! ! ! !
! ! ! ! ! ! ! ! !
! ! ! ! ! ! ! ! !
! ! ! ! ! ! ! ! !
! ! ! ! ! ! ! ! !
! ! ! ! ! ! ! ! !
! ! ! ! ! ! ! ! !
! ! ! ! ! ! ! ! !
! ! ! ! ! ! ! !
! ! ! ! ! ! ! !
! ! ! ! ! ! ! !
! ! ! ! ! ! ! !
! ! ! ! ! ! ! !
! ! ! ! ! ! ! !
! ! ! ! ! ! ! !
! ! ! ! ! ! !
! ! ! ! ! ! !
! ! ! ! ! ! !
! ! ! ! ! ! !
! ! ! ! ! ! !
! ! ! ! ! !
! ! ! ! ! !
! ! ! ! ! !
! ! ! ! ! !
! ! ! ! ! !
! ! ! ! ! !
! ! ! ! ! !
! ! ! ! ! !
! ! ! ! ! !
! ! ! ! ! !
! ! ! ! ! !
! ! ! ! ! !
! ! ! ! ! !
! ! ! ! ! !
! ! ! ! ! !
! ! ! ! ! !
! ! ! ! ! !
! ! ! ! ! !
! ! ! ! ! !
! ! ! ! ! !
! ! ! ! ! !
! ! ! ! ! !
! ! ! ! ! !
! ! ! ! ! !
! ! ! ! ! !
! ! ! ! ! !
! ! ! ! !
! ! ! ! !
! ! ! ! !
! ! ! ! !
! ! ! ! !
! ! ! ! ! ! ! ! ! ! ! ! ! ! ! ! !
! ! ! ! ! ! ! ! ! ! ! ! ! ! ! ! !
! ! ! ! ! ! ! ! ! ! ! ! ! ! ! ! !
! ! ! ! ! ! ! ! ! ! ! ! ! ! ! ! !
! ! ! ! ! ! ! ! ! ! ! ! ! ! ! ! !
! ! ! ! ! ! ! ! ! ! ! ! ! ! ! ! !
! ! ! ! ! ! ! ! ! ! ! ! ! ! ! ! !
! ! ! ! ! ! ! ! ! ! ! ! ! ! ! ! !
! ! ! ! ! ! ! ! ! ! ! ! ! ! ! ! !
! ! ! ! ! ! ! ! ! ! ! ! ! ! ! ! !
! ! ! ! ! ! ! ! ! ! ! ! ! ! ! ! !
! ! ! ! ! ! ! ! ! ! ! ! ! ! ! ! !
! ! ! ! ! ! ! ! ! ! ! ! ! ! ! ! !
! ! ! ! ! ! ! ! ! ! ! ! ! ! ! ! !
! ! ! ! ! ! ! ! ! ! ! ! ! ! ! ! !
! ! ! ! ! ! ! ! ! ! ! ! ! ! ! ! !
! ! ! ! ! ! ! ! ! ! ! ! ! ! ! ! !
! ! ! ! ! ! ! ! ! ! ! ! ! ! ! ! !
! ! ! ! ! ! ! ! ! ! ! ! ! ! ! ! !
! ! ! ! ! ! ! ! ! ! ! ! ! ! ! ! !
! ! ! ! ! ! ! ! ! ! ! ! ! ! ! ! !
! ! ! ! ! ! ! ! ! ! ! ! ! ! ! ! !
! ! ! ! ! ! ! ! ! ! ! ! ! ! ! ! !
! ! ! ! ! ! ! ! ! ! ! ! ! ! ! ! !
! ! ! ! ! ! ! ! ! ! ! ! ! ! ! ! !
! ! ! ! ! ! ! ! ! ! ! ! ! ! ! ! !
! ! ! ! ! ! ! ! ! ! ! ! ! ! ! ! !
! ! ! !
! ! ! !
! ! ! !
! ! ! !
! ! !
! ! !
! ! !
! ! !
! ! ! !
! ! ! !
! ! ! !
! ! ! !
! ! ! !
! ! ! !
! ! ! ! ! ! ! ! ! ! ! ! ! ! !
! ! ! ! ! ! ! ! ! ! ! ! ! ! !
! ! ! ! ! ! ! ! ! ! ! ! ! ! !
! ! ! ! ! ! ! ! ! ! ! ! ! ! !
! ! ! ! ! ! ! ! ! ! ! ! ! ! !
! ! ! ! ! ! ! ! ! ! ! ! ! ! !
! ! ! ! ! ! ! ! ! ! ! ! ! ! !
! ! ! ! ! ! ! ! ! ! ! ! ! ! !
! ! ! ! ! ! ! ! ! ! ! ! ! ! !
! ! ! ! ! ! ! ! ! ! ! ! ! ! !
! ! ! ! ! ! ! ! ! ! ! ! ! ! !
! ! ! ! ! ! ! ! ! ! ! ! ! !
! ! ! ! ! ! ! ! ! ! ! ! ! !
! ! ! ! ! ! ! ! ! ! ! ! ! !
! ! ! ! ! ! ! ! ! ! ! ! ! !
! ! ! ! ! ! ! ! ! ! ! ! ! !
! ! ! ! ! ! ! ! ! ! ! ! ! !
! ! ! ! ! ! ! ! ! ! ! ! ! !
! ! ! ! ! ! ! ! ! ! ! ! ! !
! ! ! ! ! ! ! ! ! ! ! ! ! !
! ! ! ! ! ! ! ! ! ! ! ! ! !
! ! ! ! ! !
! ! ! ! ! !
! ! ! ! ! !
! ! ! ! ! !
! ! ! ! ! !
! ! ! ! ! !
! ! ! ! ! !
! ! ! ! ! !
! ! ! ! ! !
! ! ! ! ! !
! ! ! ! ! !
! ! ! ! ! !
! ! ! ! ! !
! ! ! ! ! !
! ! ! ! ! !
! ! ! ! ! !
! ! ! ! ! !
! ! ! ! ! !
! ! ! ! ! !
! ! ! ! ! !
! ! ! ! ! !
! ! ! ! ! !
! ! ! ! ! !
! ! ! ! ! !
! ! ! ! ! !
! ! ! ! ! !
! ! ! ! ! !
! ! ! ! ! !
! ! ! ! ! !
! ! ! ! ! !
! ! ! ! ! !
! ! ! ! ! !
! ! ! ! ! !
! ! ! ! ! !
! ! ! ! ! !
! ! ! ! ! !
! ! ! ! ! !
! ! ! ! ! ! !
! ! ! ! ! ! !
! ! ! ! ! ! !
! ! ! ! ! ! !
! ! ! ! ! ! !
! ! ! ! ! ! !
! ! ! ! ! ! !
! ! ! ! ! !
! ! ! ! ! !
! ! ! ! ! !
! ! ! ! ! !
! ! ! ! ! !
! ! ! ! ! !
! ! ! ! ! ! ! ! !
! ! ! ! ! ! ! ! !
! ! ! ! ! ! ! ! !
! ! ! ! ! ! ! ! !
! ! ! ! ! ! ! ! !
! ! ! ! ! ! ! ! !
! ! ! ! ! ! ! ! !
! ! ! ! ! ! ! ! !
! ! ! ! ! ! ! ! !
! ! !
! ! !
! ! !
! ! !
! !
! !
! !
! !
! ! ! ! ! ! !
! ! ! ! ! ! !
! ! ! ! ! ! !
! ! ! ! ! ! !
! ! ! ! ! ! !
! ! ! ! ! !
! ! ! ! ! !
! ! ! ! ! !
! ! ! ! ! !
! ! ! ! ! ! ! ! ! !
! ! ! ! ! ! ! ! ! !
! ! ! ! ! ! ! ! ! !
! ! ! ! ! ! ! ! ! !
! ! ! ! ! ! ! ! ! !
! ! ! ! ! ! ! ! ! !
! ! ! ! ! ! ! ! !
! ! ! ! ! ! ! ! !
! ! ! ! ! ! ! ! !
! ! ! ! ! ! ! ! !
! ! ! ! ! ! ! ! !
! ! ! ! ! ! ! ! !
! ! ! ! !
! ! ! ! !
! ! ! ! !
! ! ! ! !
! ! ! ! !
! ! ! ! !
! ! ! ! !
! ! ! ! !
! ! ! ! !
! ! ! ! !
! ! ! ! !
! ! ! ! !
! ! ! ! !
! ! ! ! ! !
! ! ! ! ! !
! ! ! ! ! !
! ! ! ! ! !
! ! ! ! ! !
! ! ! ! ! !
! ! ! ! !
! ! ! ! !
! ! ! ! !
! ! ! ! !
! ! ! ! !
! ! ! !
! ! ! !
! ! ! !
! ! ! !
! ! ! !
! ! ! !
! ! ! !
! ! !
! ! !
! ! !
! ! !
! ! !
! ! !
! ! ! ! ! ! !
! ! ! ! ! ! !
! ! ! ! ! ! !
! ! ! ! ! ! !
! ! ! ! ! ! !
! ! ! ! ! ! !
! ! ! ! ! ! !
! ! ! ! ! ! !
! ! ! ! ! ! !
! ! ! ! ! ! !
! ! ! ! ! ! !
! ! !
! ! !
! ! !
! ! !
! ! !
! ! !
! ! ! !
! ! ! !
! ! ! !
! ! ! !
! ! !
! ! !
! ! !
! ! !
! ! ! !
! ! ! !
! ! ! !
! ! !
! ! !
! ! ! ! !
! ! ! ! !
! ! ! ! !
! ! ! ! !
! ! ! ! !
! ! ! ! !
! ! ! ! !
! ! ! ! !
! ! ! ! !
! ! ! ! !
! ! ! ! !
! ! ! ! ! !
! ! ! ! ! !
! ! ! ! ! !
! ! ! ! ! !
! ! ! ! ! !
! ! ! ! !
! ! ! ! !
! ! ! ! !
! ! ! ! !
! ! ! ! !
! ! ! ! ! ! ! ! ! ! ! ! ! ! ! ! ! ! ! !
! ! ! ! ! ! ! ! ! ! ! ! ! ! ! ! ! ! ! !
! ! ! ! ! ! ! ! ! ! ! ! ! ! ! ! ! ! ! !
! ! ! ! ! ! ! ! ! ! ! ! ! ! ! ! ! ! ! !
! ! ! ! ! ! ! ! ! ! ! ! ! ! ! ! ! ! ! !
! ! ! ! ! ! ! ! ! ! ! ! ! ! ! ! ! ! ! !
! ! ! ! ! ! ! ! ! ! ! ! ! ! ! ! ! ! ! !
! ! ! ! ! ! ! ! ! ! ! ! ! ! ! ! ! ! ! !
! ! ! ! ! ! ! ! ! ! ! ! ! ! ! ! ! ! ! !
! ! ! ! ! ! ! ! ! ! ! ! ! ! ! ! ! ! ! !
! ! ! ! ! ! ! ! ! ! ! ! ! ! ! ! ! ! ! !
! ! ! ! ! ! ! ! ! ! ! ! ! ! ! ! ! ! ! !
! ! ! ! ! ! ! ! ! ! ! ! ! ! ! ! ! ! ! !
! ! ! ! ! ! ! ! ! ! ! ! ! ! ! ! ! ! ! !
! ! ! ! ! ! ! ! ! ! ! ! ! ! ! ! ! ! ! !
! ! ! ! ! ! ! ! ! ! ! ! ! ! ! ! ! ! ! !
! ! ! ! ! ! ! ! ! ! ! ! ! ! ! ! ! ! ! !
! ! ! ! ! ! ! ! ! ! ! ! ! ! ! ! ! ! ! !
! ! ! ! ! ! ! ! ! ! ! ! ! ! ! ! ! ! ! !
! ! ! ! ! ! ! ! ! ! ! ! ! ! ! ! ! ! ! !
! ! ! ! ! ! ! ! ! ! ! ! ! ! ! ! ! ! ! !
! ! ! ! ! ! ! ! ! ! ! ! ! ! ! ! ! ! ! !
! ! ! ! ! ! ! ! ! ! ! ! ! ! ! ! ! ! ! !
! ! ! ! ! ! ! ! ! ! ! ! ! ! ! ! ! ! ! !
! ! ! ! ! ! ! ! ! ! ! ! ! ! ! ! ! ! ! !
! ! ! ! ! ! ! ! ! ! ! ! ! ! ! ! ! ! ! !
! ! ! ! ! ! ! ! ! ! ! ! ! ! ! ! ! ! ! !
! ! ! ! ! ! ! ! ! ! ! ! ! ! ! ! ! ! ! !
! ! ! ! ! ! ! ! ! ! ! ! ! ! ! ! ! ! ! !
! ! ! ! ! ! ! ! ! ! ! ! ! ! ! ! ! ! ! !
! ! ! ! ! ! ! ! ! ! ! ! ! ! ! ! ! ! ! !
! ! ! ! ! ! ! ! ! ! ! ! ! ! ! ! ! ! ! !
! ! ! ! ! ! ! ! ! ! ! ! ! ! ! ! ! ! ! !
Stark4,993
Wood158
Darke7
Scioto209
Wayne695
Perry143
Clark66
Allen66
Butler2,046
Lorain1,476
Logan3
Union10
Trumbull966
Hardin143
Henry28
Franklin1,366
Miami314
Fulton190
Erie143
Hancock173
Putnam143
Lucas257
Carroll15
Shelby28
Richland1,158
Clinton15
Greene28
Muskingum285
Marion428
Medina95
Warren15
Holmes3
Guernsey143
Madison28
Washington518
Coshocton733
Geauga3
Summit260
Jackson145
Tuscarawas300
Delaware209
Williams43
Paulding28
Defiance1,183
Auglaize171
Cuyahoga3,233
Wyandot143
Hamilton377
Columbiana228
Mahoning775
Lake904
Jefferson31
Montgomery275
Ross
Pike
Knox
Licking
AdamsGallia
HuronSeneca
Brown
Athens
Meigs
Ashtabula
NoblePreble
Mercer
Portage
Belmont
Vinton
Fairfield
Highland
Monroe
FayettePickaway Morgan
Hocking
Ashland
Morrow
Clermont
Harrison
Lawrence
Van WertCrawford
Sandusky
Champaign
Ottawa
Columbus
Akron
Toledo
Dayton
Cincinnati,OH-KY-IN
Cleveland-Elyria
1
2
Ohio Steel IndustryEmployment by County*
Statewide: 25,821
Steel IndustryEmploymentin County*
! ! ! ! ! !
! ! ! ! ! !
! ! ! ! ! !
! ! ! ! ! !
! ! ! ! ! !
! ! ! ! ! !
! ! ! ! ! !
! ! ! ! ! !
2,000 - 4,993
! ! ! !
! ! ! !
! ! !
! ! !
500 - 1,999
! !
! !
! !
! !
100 - 499
! !
!
1 - 99
None
Source:2015 County Business Patterns
U.S. Census Bureau
Prepared by:Office of Research
Ohio Development Services AgencyNovember 2017
R102717A
20
*County employment figures shown on thismap should be considered estimates.
Large Metro**
**Only those portions of the 8 MetropolitanStatistical Areas (Metros) that contain 2 or
more counties in Ohio are shown.
1 Canton-Massillon, OH2 Youngstown-Warren- Boardman, OH-PA

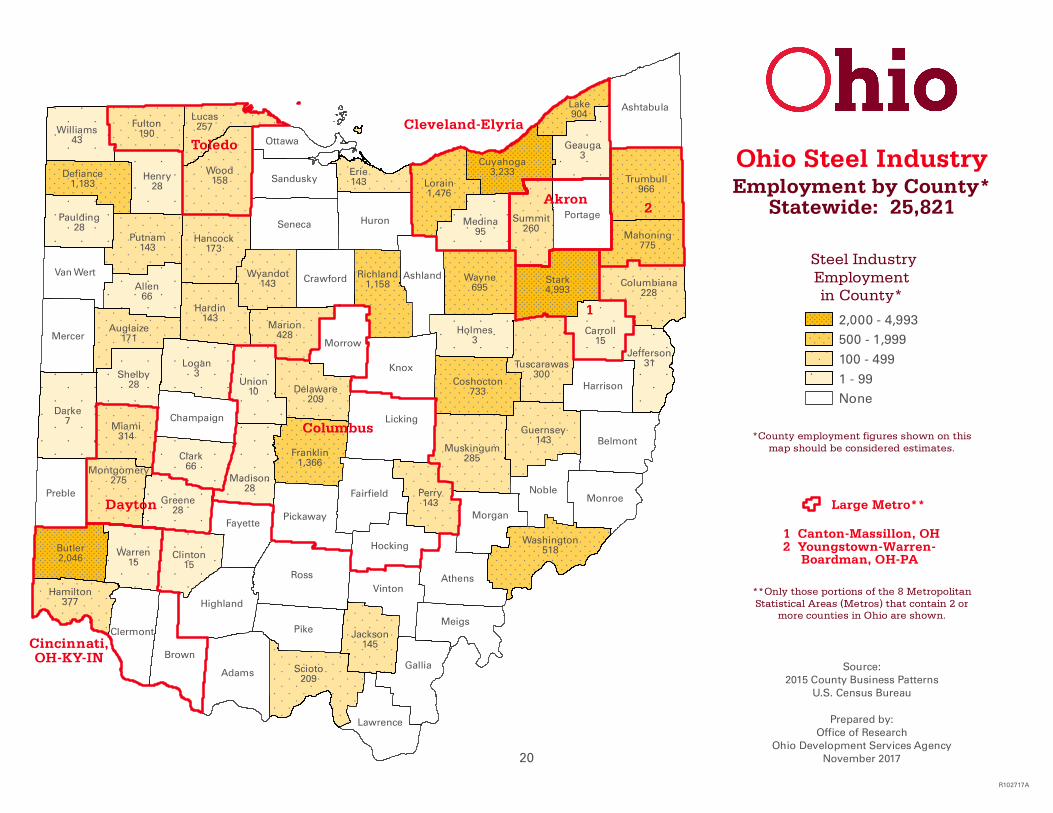
THE DISTRIBUTION OF INDUSTRY EMPLOYMENT IN OHIO
Employment is even more concentrated than the distribution of establishments; seven counties account for three-fifths of the industry jobs in Ohio. Stark topped the list with nearly 5,000, followed by Cuyahoga with 3,200-plus and Butler with at least 2,000. Defiance, Franklin, Richland and Lorain had between 1,100 and 1,500 each. Six counties had between 500 to 1,000 industry jobs: Coshocton, Lake, Mahoning, Trumbull, Washington and Wayne; 22 had 100 to 499, and 18 had 1 to 99 jobs.5 Counties with at least 500 employees often are associated with the facilities of notable industry companies: Butler is home to AK Steel; Coshocton has AK Steel and McWane; Cuyahoga has ArcelorMittal and Charter Steel; Defiance has a Gen-eral Motors foundry; Franklin is home to Worthington Industries; Lorain has Republic Steel and U.S. Steel; Mahoning has Vallourec Star; Richland has AK Steel and ArcelorMittal; Stark is home to Timken and has Republic Steel, including the latter’s regional headquarters; Trumbull has the Worthington Industries subsidiary Dietrich Industries. Lake and Wayne appear are exceptions in this regard. (The converse exception is Marion County, which has less than 500 employees, but has ArcelorMittal and Nucor establishments.)6
21
See Table A6

This page intentionally blank
22

TRENDS
23
14.5
16.3
17.7
16.5 16.8
14.2
15.516.1
16.7 16.416.8
15.8
16.817.5
18.3
15.7
14.6
13.1
15.816.4
15.9 16.1
14.8
6.6
9.3
11.6
13.7
11.5
12.6
11.3
9.7
17.8%18.2%
17.7%
16.9%17.0%
16.2%
16.7%16.5%16.6%
15.7%16.0%
14.6%
15.4%
16.3%16.3%
15.8%
14.5%
12.7%
14.4%
15.7%
14.6%14.9%
14.6%
10.1%10.4%
12.2%
14.0%
12.0%
13.0%13.0%
11.0%
0.0%
2.0%
4.0%
6.0%
8.0%
10.0%
12.0%
14.0%
16.0%
18.0%
20.0%
0.0
2.0
4.0
6.0
8.0
10.0
12.0
14.0
16.0
18.0
20.0
`86 `87 `88 `89 `90 `91 `92 `93 `94 `95 `96 `97 `98 `99 `00 `01 `02 `03 `04 `05 `06 `07 `08 `09 `10 `11 `12 `13 `14 `15 `16*
Perc
en
t o
f U
.S.
Millio
ns o
f N
et
To
ns
Estimated Raw Steel Production in Ohio, 1986-2016
Raw Steel Production Percent of U.S.
Sources: American Iron and Steel Institute; Hill, et.al.; U.S. Geological Survey
24
* - Preliminary

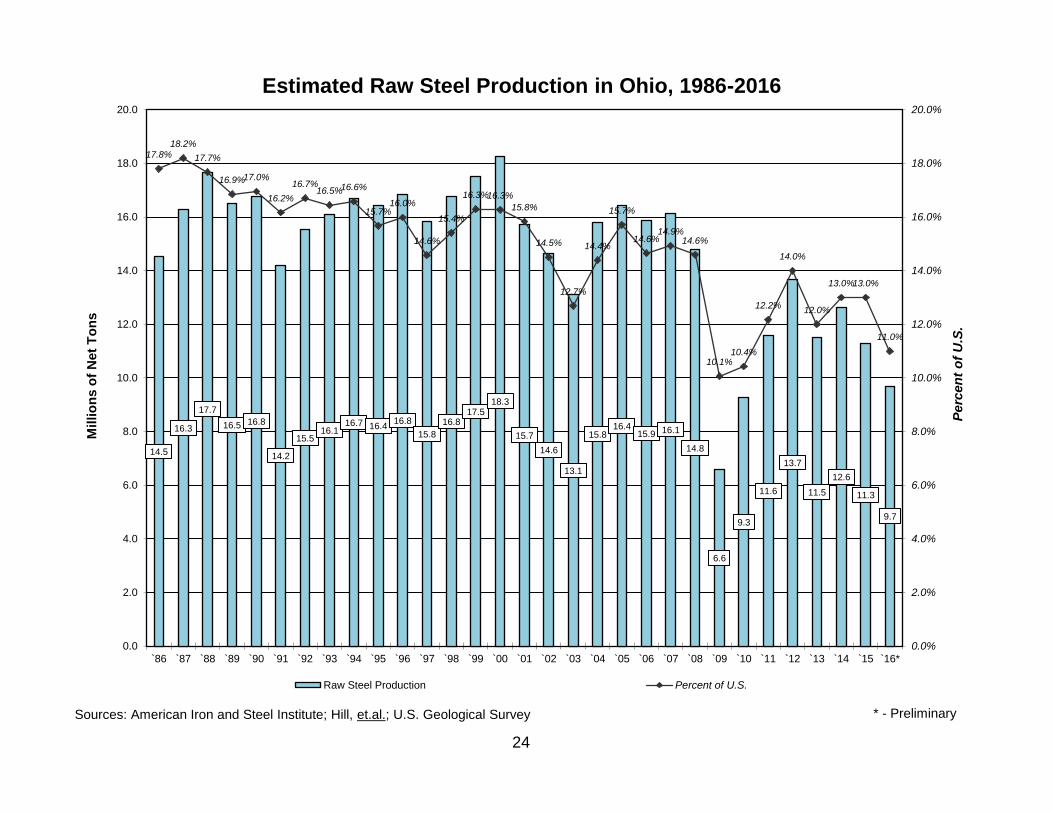
RAW STEEL PRODUCTION Raw steel production is the core of the iron and steel industry, the immediate or proximate starting point for all goods wholly or partially made of steel. The chart above illustrates the cyclical nature of the raw steel production in Ohio, with the relatively low output volumes during 1991, 2003 and 2009 closely corresponding with the depths of national reces-sions, and the relatively high output volumes during 1990, 2000 and 2007 matching the peaks (or ends) of national eco-nomic expansions. However, writers following the industry in Ohio believe the state’s recent drop in raw steel production – even as its and the U.S. economy have continued expanding – is at least partially due to the reduced demand for pipes used in extracting natural gas and oil from the Utica and Marcellus shale formations, and ultimately to lower prices for the latter (e.g., McCafferty, 2016).7 The highly cyclical character of raw steel production reflects the use of relatively large amounts of steel in products with high sale prices: transportation equipment, big appliances and machinery, some fabricated metal products, and non-residential construction projects. These steel-using industries tend to highly cyclical in response to changing consumer demand. When business is good and jobs are plentiful, consumers – individuals, families and organizations – feel con-fident in purchasing expensive goods. Conversely, consumers cut back or delay expenditures for the same goods during economic hard times, preferring to repair instead of replace (drawn from Levy, 2014, and Corridore, 2014; also see Hadid, 2017).8 The earlier part of economic recoveries and expansions generally are led by increasing demand for consumer durables: motor vehicles, appliances and other domestic equipment. By contrast, the demand for capital goods such as those used in non-residential construction, machinery and commercial equipment typically increases after the recovery is well under way and the demand for consumer durables plateaus (Larkin, 2013: O6). Overall, then, steel industry ship-ments continue throughout an economic expansion. The chart above also records how the percentage of U.S. raw steel production coming from Ohio seems to have trended lower during the last three decades, although year-to-year variations may be pronounced. Including data from Appendix Table A7, Ohio averaged 16.8 percent of U.S. raw steel production during the 1970s, 16.5 percent during the 1980s, 16.1 percent during the 1990s, but 14.5 percent during the 2000s, and 12.3 percent from 2010 through 2016. This may be due to the spread of minimills (which principally recycle steel) across the country as well as the latter’s increasing share of raw steel production. Despite the yearly variations and the slightly lower percentages, Ohio ranked second in raw steel pro-duction for every year shown above; 1981 was the last year it ranked third. Raw steel production methods have shifted over the years with technological advances. The chart on the following page illustrates (1) the demise of open hearth furnaces in favor of more efficient basic oxygen process furnaces (BOPFs) for primary steel production and (2) the growing role of electric arc furnaces (EAFs) for recycling in raw steel production.
25

4.1 3.05.1 4.5 3.5
1.6
58.7 58.9
58.0 59.6
59.160.0 62.0 60.6 60.7 59.6
57.4 56.2 54.9 53.8 53.0 52.649.6 49.0 47.9
45.042.9 41.8 42.6
38.2 38.7 39.7 40.9 39.437.4 37.0
33.0
37.2 38.1 36.9 35.9 37.3 38.4 38.0 39.4 39.3 40.442.6 43.8 45.1 46.2 47.0 47.4
50.4 51.0 52.155.0
57.1 58.2 57.4
61.8 61.3 60.3 59.1 60.662.6 63.0
67.0
55.2
59.8
61.3
64.8
67.4
75.8
79.3
85.7
89.591.1
93.294.7 95.5 95.6
96.4 97.2 97.2 97.3 97.1 96.8 96.7 96.7 96.4 97.0 97.4 98.0 98.6 98.8 98.5 99.0 99.0
0.0
10.0
20.0
30.0
40.0
50.0
60.0
70.0
80.0
90.0
100.0
0.0
10.0
20.0
30.0
40.0
50.0
60.0
70.0
80.0
90.0
100.0
`86 `87 `88 `89 `90 `91 `92 `93 `94 `95 `96 `97 `98 `99 `00 `01 `02 `03 `04 `05 `06 `07 `08 `09 `10 `11 `12 `13 `14 `15 `16*
Perc
en
t C
on
tin
uo
us
ly C
ast
Pe
rcen
tag
es
by F
urn
ac
e T
yp
eU.S. Raw Steel Production, 1986-2016
Percentages by Furnace Type and Cast
Open Hearth Basic Oxygen Process Electric Arc Continous
26
Sources: American Iron and Steel Institute; U.S. Geological Survey * - Preliminary

Iron and steel production was a vertically integrated process dominated by large companies for much of the 20th century. The companies owned the materials and equipment used at each step of the primary production process. These usually included the mines of iron ores, coal and fluxes, the coke ovens, the furnaces, the breakdown mills, and the service and distribution centers (i.e., wholesalers) for steel slitting and sales to end users (Larkin, 2013: O1). 91.6 percent of the raw steel produced in the U.S. during 1960 was made by this integrated primary production process (further described in the Appendices); only 8.4 percent came from mills focused exclusively on recycling scrap (cited by Larkin, 2013: O2 & O3). In contrast to primary producers, minimills make steel principally by recycling ferrous scrap in EAFs, although some can substitute directly reduced iron when scrap prices are high. Doing so means that they avoid the costs associated with blast- and BOPFs, coke ovens and equipment to handle raw materials. (Raw materials and the greater energy required for primary steel making are about two-thirds of the costs of primary producers.) Consequently, capital costs for minimills are much lower than for primary producers. Lower capital costs, a leaner management structure, and more flexible, less costly labor arrangements allowed minimills to undercut the prices primary producers would charge for the same products (Larkin, 2013: O1, O3; also Hadid, 2017). (Primary steelmakers also incorporate scrap. That reduces their costs some-what, but cannot compensate for their greater capital requirements and expenses.) Minimills initially were limited to lower-quality commodity products, but have increased their collective market share as quality improved. One key to their expansion was the development of thin slab and strip casters. These bypassed the need for reducing stands, permitting the direct production of thin slabs and strips from molten raw steel. (North Star Blue-Scope Steel is an Ohio minimill using such technology.) While primary producers also adopted them, they benefitted minimills more by the reduction of capital needed to compete in markets for higher quality goods such as pipes, plates, strips and sheets. Such items had been the domain of primary producers, but they were forced to abandon markets for specific products as minimills’ quality improved. Ultimately, then, it has been interrelated technological advances and reduced costs that enabled minimills to increase their share of domestic raw steel production at the expense of primary producers. Nevertheless, primary producers have remained the source for the highest-grade goods (Larkin, 1994, 1995, 2005, 2013).9
27
See Table A7

$4,588
$3,246
$4,014 $3,940
$520
$3,263
$3,722
$2,754$2,938
$3,309$3,057
$1,377
$1,697
$1,325$1,290
$674
$639
$680
$1,002$920
$917
$715
15.1%
12.6%
13.5% 13.6%
6.7%
11.9%12.2%
11.4%
10.7%
11.6%
11.2%
0.0%
2.0%
4.0%
6.0%
8.0%
10.0%
12.0%
14.0%
16.0%
$0
$1,000
$2,000
$3,000
$4,000
$5,000
$6,000
$7,000
$8,000
2005 2006 2007 2008 2009 2010 2011 2012 2013 2014 2015*
To
tal a
s P
erc
en
t o
f U
.S.
To
tal
(Mil
lio
ns
)Value-Added in Ohio's Iron and Steel Products Groups, 2005-2015
(NAICS 3311-2, Standardized on 2009)
3311: Iron & Steel Mill Products 3312: Steel Products from Purchased Steel 3311-2: Percent of U.S. Total
28
Sources: U.S. Bureaus of the Census and Labor Statistics
$4,225
* - Preliminary
$3,773
$5,965
$4,943
$5,339$5,230
$1,194
$3,902
$4,403
$3,756$3,858

PRODUCTION AS MEASURED BY VALUE-ADDED
Value-added (VA) data for the iron-steel-ferroalloys and steel-products-from-purchased-steel groups (NAICS 3311 and 3312) provide a broader picture of industry output in Ohio than raw steel production alone. Figures seen in the chart above have been adjusted with the associated producer price indexes to remove the effects of inflation and deflation to give a better sense of how production volumes may have changed.10 (Unadjusted figures for both groups as well as sum-mary figures combining the two also are shown in Appendix Table A8 along with the producer price index values.) The combined volume appears highest in 2005 and fluctuated around $5 billion from 2006 through 2008. Production fell to less than $1.2 billion at the depths of the recession in 2009, but rebounded in 2010 to $3.9 billion and fluctuated there-after. Post-recession combined output remained below pre-recession levels in this time period. The chart above shows that an average of 75.9 percent of combined output came from the iron-steel-ferroalloys group (3311; the VA data include the value of raw steel produced as well as the value of intermediate and end-use goods made where the raw steel is produced). Group output varied between $3.2 and $4.6 billion before the recession, was just $520 million in 2009, and varied between $2.7 and $3.8 billion post-recession. (This compares with raw steel production, which ranged between 14.7 and 16.5 million tons during 2005-2008, fell to less than 6.6 million tons in 2009, and fluctuated be-tween 11.2 and 13.7 million tons during 2011-2015.) Output from the products-from-purchased-steel group (3312) averaged 24.1 percent of the combined total. 2009 was the only year when the output exceeded that of the iron-steel-ferroalloys group. Output ranged between $1.2 and $1.7 billion during 2005-2008, was between $600 and $700 million during the recession and the first two years of the recovery (2009-2011), and has remained above $700 million but below pre-recession levels since. This record of change, when com-bined with the record of iron-steel-ferroalloys, means both groups are part of the generally lower post-recession levels of combined output. The chart above also places the combined output of the two groups in a national context: it ranged from 12.6 and 15.1 percent of the corresponding U.S. total before the recession, was 6.7 percent in 2009, and ranged from 10.7 to 12.2 per-cent post-recession. Additional data in Appendix Table A8 show that VA percentages of iron-steel-ferroalloys from Ohio ranged from 10.3 to 14.6 in 2005-2008, was 3.5 percent in 2009, and ranged from 10.4 to 12.5 thereafter. This contrasts with the percentages of steel-products-from-purchased-steel: 16.9 to 25.6 during 2003-2009 vs. 10.8 to 15.1 thereafter. Consequently, it appears that the post-recession lower portion of combined output mostly reflects the post-recession lower portion of steel-products-from-purchased-steel (3312 instead of 3311).
29
See Table A8

$226
$390$409
$265
$113
$173
$284$253
$371
$126$150
$52
$72$59
$57
$54
$18
$177
$351
$48
$140
$63
12.8%
20.7%
12.7%
6.4%
4.8%5.1%
11.7%
12.9%
10.3%
8.9%
8.4%
0.0%
3.0%
6.0%
9.0%
12.0%
15.0%
18.0%
21.0%
$0
$100
$200
$300
$400
$500
$600
$700
2005 2006 2007 2008 2009 2010 2011 2012 2013 2014 2015*
To
tal as P
erc
en
t o
f U
.S. T
ota
l
(Mil
lio
ns)
Capital Expenditures in Ohio's Iron and Steel Products Groups, 2005-2015(NAICS 3311-2, in Current Dollars)
3311: Iron & Steel Mill Products 3312: Steel Products from Purchased Steel 3311-2: Percent of U.S. Total
$461
$267
$313
$278
$462 $468
$322
$166
$191
30
Source: U.S. Census Bureau * - Preliminary
$604
$419

CAPITAL EXPENDITURES Capital expenditures (CE) are funds spent for land, buildings and equipment used in manufacturing. The chart above shows combined CE for the iron-steel-ferroalloys and steel-product-from-purchased-steel groups (NAICS 3311 and 3312) have varied widely over the years: from $166 million in 2009 to $604 million in 2012. (No adjustment has been made for inflation.) As percentages of corresponding national totals, they ranged from 4.8 in 2009 to 20.7 in 2003. These varia-tions are evident for each group: from $113 to $409 million by iron-steel-ferroalloy producers, and from $18 to $351 million by manufacturers of steel products from purchased steel. The corresponding percentages of U.S. totals ranged from 3.7 to 21.3 and 3.9 to 21.8 (see Appendix Table A9). While national CE may normally fluctuate over business cycles, CE within one state appear as episodic and hugely variable; hence these great variations in absolute and proportional CE seen above. Seen in this context, long-term averages provide a better understanding of state-level CE. On average, CE for iron-steel-ferroalloy production in Ohio were 9.0 percent of the national total, and steel-products-from-purchased-steel CE were 13.8 percent of the national total. Together, they were 10.0 percent of the combined U.S. total. Capital intensity (CI) – the ratio of CE to the labor costs – varies by group. CI in iron-steel-ferroalloys is relatively high when compared with the overall average for manufacturing (Hadid, 2017); costs for primary steelmakers can reach $2,000 per ton of capacity, while those for minimills are about $500 per ton (Larkin, 2013: O1). This amounts to hundreds of mil-lions of dollars for new operations or substantial upgrades of current facilities for whatever reason: efficiently producing steel at competitive prices, meeting environmental regulations, etc. This contrasts with the less-than-average to average CI of the steel-products-from-purchased-steel (Leach, 2017; Yucel, 2017b) group because steel is purchased. Large scale, mass production by foundries is more capital intensive than batch and job work (Yucel, 2017a). Comparing the national portions of CE and value-added (VA) in Ohio yields further insights into the industry here. As seen in Appendix Tables A8 and A9, 11.5 percent of U.S. VA in the iron-steel-ferroalloys group came from Ohio during 2005-2015 (unadjusted for inflation), while such mills here received 9.0 percent of CE – a ratio of 1.28 to 1. The corre-sponding VA::CE ratio for the steel-products-from-purchased-steel group was 1.06 to 1. The combined VA::CE ratio was 1.08 to 1. It appears companies in Ohio generally have generally emphasized production during this time. Any number of factors may help explain this broad conclusion: given the concentration of primary steel production here and that primary steel makers have had larger financial liabilities than minimills, less money may have been available for CE (Larkin, 2013: I4); or it may reflect minimills’ growing share of raw steel production; or it may reflect the CE for minimills in more rapidly growing parts of the U.S.; or a greater focus on production automation, inventory and order management, and less on new products (Hadid, 2017; Leach, 2017; Yucel, 2017a, 2017b). The list could go on.
31
See Tables A8 & A9

73 7064 62 62 60 55
61 58 59 56
7163
6964
5552 61
60
51 5454
90
8175
69
70 75 7270
6670
70
9.5%
8.9%
8.5%8.7%
9.2%9.1% 9.2%
9.4%
9.1%9.4%
9.1%
0.0%
2.0%
4.0%
6.0%
8.0%
10.0%
0
60
120
180
240
300
2005 2006 2007 2008 2009 2010 2011 2012 2013 2014 2015
To
tal as P
erc
en
t o
f U
.S.
Oh
io E
mp
loym
en
tEstablishment Trends in Ohio's Iron and Steel Industry
by Group, 2005-2015
3311: Iron & Steel Mill Products 3312: Steel Products from Purchased Steel 33151: Ferrous Foundries Total as Percent of U.S.
32
Source: U.S. Census Bureau
180183
234
214208
195
187 187 188 191
175

ESTABLISHMENTS
The chart above shows the number iron and steel industry establishments in Ohio fell 23.1 percent from 234 in 2005 to 180 in 2015. Decreasing numbers characterized the three principal industry sectors in nearly equal proportions: 23.3 percent in iron-steel-ferroalloys (NAICS 3311), 23.9 percent in steel products from purchased steel (3312) and 22.2 per-cent in ferrous metal foundries (33151). Specific industry figures in Appendix Table A10 show more variation. On one hand, the numbers of wire drawing plants (331222) and non-investment steel foundries (331513) fluctuated but showed net increases of 30.8 and 21.4 percent, while the number of steel investment foundries (331512) showed no net change during this time. On the other hand, the number of plants rolling steel shapes (331221) and the number of iron foundries (331511) fell 43.3 and 37.1 percent, respectively.11 What happened in Ohio was broadly part of changes seen in across America: iron-steel-ferroalloy plants fell 28.1 percent, and ferrous foundries fell 22.3 percent. However, the total number of U.S. steel-products-from-purchased steel fell only 6.8 percent, which reflected the 7.9 gain in pipe-and-tube plants (33121) partially offsetting the 13.8 decrease in rolling and drawing (33122). Overall, total number of U.S. iron and steel industry establishments fell 19.8 percent. Thus, despite the large declines in numbers, the percentage of industry establishments in Ohio merely slipped from 9.5 to 9.1 over the decade. Analysts have cited a number of factors to explain the declining establishment numbers: market in-roads from imports and by producers of alternative materials; reduced demand for remaining uses; companies leaving the business; the closure of more labor intensive plants in favor of more modern, more automated facilities; consolidation as companies merge to at-tain the advantages of greater size (such as administrative efficiency, economies of scale, less burdensome capital ex-penditures, product diversity to stabilize income, greater market share, greater bargaining power in markets – both for purchasing inputs and selling outputs), etc. (Hadid, 2017; Larkin, 2013: O2; Leach, 2017; Yucel, 2017a, 2017b). These factors also affected long-term employment trends.
33
See Tables A10

17,072 16,461
14,186
17,347
13,58712,757 13,547 13,542
11,887 11,91213,113
6,6006,415
5,993
4,364
4,1633,870
4,3335,462
5,616 5,8185,441
10,3419,912
8,942
9,004
7,433
6,668
6,397
6,626
7,039 7,0337,267
13.6%
13.1%
11.9%
12.9%
11.8% 11.8%11.5% 11.4%
11.1%11.4%
11.8%
0.0%
2.0%
4.0%
6.0%
8.0%
10.0%
12.0%
14.0%
0
6,000
12,000
18,000
24,000
30,000
36,000
42,000
2005 2006 2007 2008 2009 2010 2011 2012 2013 2014 2015
To
tal as P
erc
en
t o
f U
.S.
Oh
io E
mp
loym
en
tEmployment Trends in Ohio's Iron and Steel Industry
by Group, 2005-2015
3311: Iron & Steel Mill Products 3312: Steel Products from Purchased Steel 33151: Ferrous Foundries Total as Percent of U.S.
34
Source: U.S. Census Bureau
25,821
24,763
34,013
32,788
29,12130,715
25,183
23,29524,277
25,630
24,542

EMPLOYMENT
Total employment in Ohio’s iron and steel industry fell from 34,000 in 2005 to about 23,300 in 2010, a 31.5 percent de-cline. That otherwise steady decline was interrupted in 2008 as employment rose by about 1,400, but resumed falling in the wake of the Great Recession. Employment rose 10.8 percent from 2010 to 25,800-plus in 2015, but not without inter-ruption. The net change over this decade was a loss of almost 8,200 jobs, a 24.1 percent decline. The chart above shows that this pattern of larger losses in the first half of the decade followed by smaller gains in the second half was seen in all three groups, but not in equal numbers or proportions. Most of the net losses from 2005 to 2015 occurred in the iron-steel-ferroalloys group (NAICS 3311) – well over 3,900, a 23.2 percent decrease. More than 3,000 jobs were lost in foundries (33151) – a 29.7 percent drop, while 1,100-plus jobs were lost at plants making steel products from purchased steel (3312) – a 17.6 percent decline. Figures in Appendix Table A11 show some small exceptions to these broader trends: employment at steel wire drawing plants and non-investment steel foundries (331222 and 331513) more than doubled over the decade, employment at pipe and tube plants (33121) saw a net increase of 10.3 percent, while jobs counts at steel investment foundries (331512) fluctuated but were essentially the same after 10 years. The changes here were part of roughly similar changes seen across the nation. Data in Appendix Table A11 show net declines of 5.6 percent in iron-steel-ferroalloys employment and a 28.7 percent drop in foundry jobs. However, employ-ment at steel-products-from-purchased-steel had a net gain of 5.4 percent on the strength of a 21.9 percent increase in the pipe-and-tubes subgroup, which more than offset losses in the rolling and drawing subgroup. The net effect for the industry was limited to a 12.2 percent loss over the decade. The less-drastic job losses for the nation meant that Ohio’s portion of U.S. iron and steel industry employment fell from 13.6 to 11.8 percent. More-current data from the U.S. Bureau of Labor Statistics’ Quarterly Census of Employment and Wages (U.S. BLS QCEW) show an 8.4 percent decrease in industry employment from 2015 to 2016 in Ohio. Small gains in products-from-purchased-steel were not enough to offset losses in the other groups.12 Across the nation all three groups experienced jobs losses, combining for a 7.5 percent decrease (U.S. BLS, 2017).
35
See Table A11
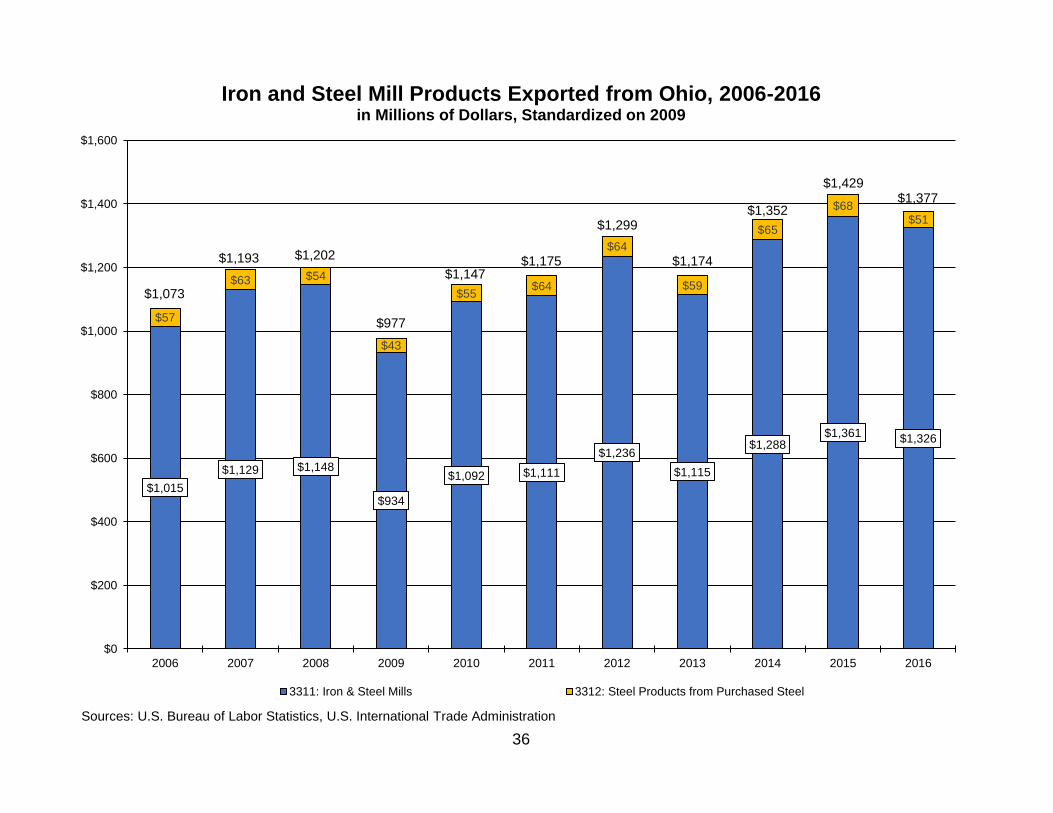
$1,015
$1,129 $1,148
$934
$1,092 $1,111
$1,236
$1,115
$1,288$1,361 $1,326
$57
$63 $54
$43
$55$64
$64
$59
$65
$68$51
$0
$200
$400
$600
$800
$1,000
$1,200
$1,400
$1,600
2006 2007 2008 2009 2010 2011 2012 2013 2014 2015 2016
Iron and Steel Mill Products Exported from Ohio, 2006-2016in Millions of Dollars, Standardized on 2009
3311: Iron & Steel Mills 3312: Steel Products from Purchased Steel
$1,073
$1,193 $1,202
$977
$1,147$1,175
$1,299
$1,174
$1,352
$1,429$1,377
Sources: U.S. Bureau of Labor Statistics, U.S. International Trade Administration
36

EXPORTS FROM OHIO
The chart above illustrates the growth of exports from Ohio’s iron and steel products groups (NAICS 3311 and 3312) from 2006 to 2016 after adjusting for inflationary and deflationary prices fluctuations. The summary value of exports grew 28.3 percent from just over $1.07 billion in 2006 to almost $1.38 billion in 2016. This is due to the 30.6 percent growth of iron, steel and ferroalloy products (3311, blue) from $1.01-plus billion in 2006 to about $1.33 billion in 2016. Exports of pro-ducts made from purchased steel (3312, gold) ranged from $43 to $68 million with no discernable trend evident. Exports for both groups peaked in 2015. The chart also shows the overwhelming majority of exports were made by iron, steel and ferroalloy producers (3311) each year. The 11-year average was 95.2 percent of the two-group sum. This reflects two underlying market characteristics:
1. although exports are a relatively more important market for pipe and tube makers using purchased steel (33121) than for iron, steel and ferroalloys producers, the export market for the latter is much larger than for the former in absolute size (compare Hadid, 2017; Leach, 2017); and
2. exports are a tiny portion of the also-small market of rolled and drawn products made from purchased steel (33122) (Yucel, 2017b).12
Data in Appendix Table A12 show 67.9 percent of iron, steel and ferroalloy products (3311) exported from Ohio went to Canada during the 2006-2016 period, followed by Mexico with 14.1 percent. The remaining 18.0 percent of such exports were spread across 150 other countries (U.S. International Trade Administration, 2017).
37
See Table A12

1995 1996 1997 1998 1999 2000 2001 2002 2003 2004 2005 2006 2007 2008 2009 2010 2011 2012 2013 2014 2015 2016
Steel Mill Prdct Shpmnts 88.4 91.5 96.0 92.9 96.3 99.0 89.7 90.7 96.1 101.0 95.2 99.3 96.5 89.4 56.4 75.7 83.3 87.0 86.6 89.1 78.5 78.0
Imports: Steel Mill Prdcts 22.1 26.5 28.3 37.7 32.4 34.4 27.3 29.6 21.0 32.5 29.1 41.1 30.2 29.0 14.7 21.7 25.9 30.4 29.2 40.2 35.2 30.0
Index Value of Dollar 92.5 97.4 104.4 116.5 116.9 119.5 125.9 126.7 119.1 113.6 110.7 108.5 103.4 99.9 105.7 101.8 97.2 99.8 101.0 104.1 117.2 122.7
Exports: % of Shpmnts 7.2% 5.0% 5.7% 5.4% 5.1% 6.0% 6.2% 6.0% 2.6% 7.1% 8.9% 8.9% 10.5% 13.6% 14.9% 14.5% 14.6% 14.4% 13.3% 12.2% 11.5% 11.5%
0.0%
2.0%
4.0%
6.0%
8.0%
10.0%
12.0%
14.0%
16.0%
0.0
20.0
40.0
60.0
80.0
100.0
120.0
140.0
160.0
Exp
ort
s a
s a
Perc
en
tag
e o
fT
ota
l S
teel M
ill P
rod
uc
t S
hip
men
ts
Ste
el M
ill P
rod
uc
t S
hip
men
ts a
nd
Im
po
rts
(in
Mil
lio
ns
of
Metr
ic T
on
s)
an
dth
e I
nd
ex V
alu
e o
f th
e D
oll
ar
U.S. Imports, Exports and the Value of the Dollar
38
Sources: U.S. Geological Survey, Federal Reserve Board 2016 figures are preliminary
NOTES ON U.S. IMPORTS AND EXPORTS
The chart above illustrates two relationships. The green lines show an inverse relationship between the indexed value of the dollar and exports of steel mill products as a percentage of all steel mill product shipments. Increasing values of the dollar from 1995 to 2002 or 2003 and from 2011 to 2016 are accompanied by a declining role of exports in total steel mill product shipments. Conversely, exports played an increasingly important role in total steel mill product shipments from 2002 or 2003 to 2009-to-2011 as the index value of the dollar fell. This is because the generally lower value of the dollar makes it easier for foreign companies in many nations to buy American-made products. The blue columns show a different relationship: the amounts of imported and American-made steel mill products generally tend to rise and fall together – most notably from 2006 to 2016. Sometimes imports fall when the value of the dollar is high (e.g., 1998 to 2003) and rise when the value of the dollar is falling (e.g., 2004 to 2006 and 2011 to 2014). Total im-ports appear to have less to do with the value of the dollar when compared with overall demand or apparent consumption. (See Appendix Table A13 for more detail.)14 A complicating factor in the relationships is imports of semi-finished products – a subset of all steel mill product imports – can become part of domestically made finished products (Larkin, 2007). Nev-ertheless, some industry analysts maintain a high dollar value helped imports gain and keep a significant portion of the U.S. market (Hadid, 2017; Leach, 2017). Other advantages facilitating imports at one time or another were lower costs (whether for labor or due to less regulation), more modern equipment, foreign government subsidies and low or even no U.S. import barriers (Larkin, 2013).15 Furthermore, consumers will buy from anyone who can supply inexpensive steel because it helps them to compete at home and abroad (Miller, 2012). Indeed, imports often are necessary as apparent steel consumption often exceeds domestic steel production (see U.S. Geological Survey, 1996-2017). Industry analysts also note:
• exports are relatively more important for iron, steel, ferroalloy and pipe-and-tube makers (NAICS 3311 and 33121) than they are for those manufacturing rolled, drawn and foundry products (33122 and 33151) (Hadid, 2017; Leach, 2017; Yucel, 2017a, 2017b);
• imports exceed exports in the iron-steel-ferroalloys and products-from-purchased-steel groups (3311-2) (Hadid, 2017; Leach, 2017; Yucel, 2017b); but exports exceed imports of foundry products (33151) (Yucel, 2017a); and
• net import reliance often is considerably less than gross import figures suggest (U.S. Geological Survey, 1996-2017).16
39
See Table A13

This page intentionally blank
40

OVERVIEW AND OUTLOOKS
41

AN OVERVIEW OF THE INDUSTRY The iron and steel industry consists of organizations using raw materials and ferrous scrap to create semi-finished and finished products for organizations in many other industries. The major markets for iron and steel mill products (NAICS 3311) are establishments:
• purchasing iron and steel to make pipes, tubes, rolled, drawn and foundry goods (3312 and 33151, the secondary manufacturers) (Yucel, 2015);
• fabricating metal products and assembling machinery (332 and 333);
• manufacturing transportation equipment (336), especially motor vehicles, campers, trailers and parts (3361-3);
• firms constructing non-residential buildings (2362 and 23812) and infrastructure – utilities plants (2371), highways and bridges (2373);
• wholesalers (42351), who custom-cut goods and sell to a variety of smaller-order clients; and
• exports (Hadid, 2017). Secondary producers exist because they have the expertise with state-of-the-art technologies to meet customers’ exact-ing specifications more rapidly and efficiently than iron and steel makers (3311) can. Their principal markets are:
• for pipe and tube makers – establishments moving fluids, meaning goods for extracting, refining and transporting oil, natural gas and derived products (211, 324 and 486), producing dairy and beverage goods (3115 and 3121), manu-facturing pulp, paper, appliances (3221, 3352) and transportation equipment or components, distributing natural gas (2212), handling water and sewage (2213), as well as associated construction firms and wholesale suppliers; exports also are significant (Leach, 2017);
• for manufacturers of rolled and drawn goods – establishments fabricating metal products, particularly containers, wires and springs (3324 and 3326), making appliances (3352), transportation equipment and components, generating, trans-mitting and locally distributing electric power (2211), extracting, refining and transporting oil and gas, as well as asso-ciated construction firms and wholesale suppliers (Yucel, 2017b);
• for foundries – molds and stocks used by iron, steel and fabricated metal products manufacturers (3311-2, 332), as well as other goods used in machinery, transportation equipment and construction (Yucel, 2017a).
Given the highly cyclical nature of many of its key markets – goods used in extracting, processing or transporting fluids, non-residential construction, fabricated metals, machinery, transportation equipment, etc. – most of the iron and steel industry is in turn highly cyclical. These individual market cycles may not be highly correlated with one another, but they ultimately and largely are driven by household and business consumption of durable goods, which often are expensive. Businesses and households are more likely to buy durable goods when they are confident they can afford them. Con-versely, they reduce or delay such expenditures when business is not so good.17
42

As organizations providing products – all made from a few key elements – to overlapping markets, domestic iron and steel industry organizations compete not only with one another, but with foreign producers using the same elements as well as other organizations using alternative materials for similar products for the same markets. They also must deal with organ-izations supplying their inputs and equipment as well as governmental regulations affecting their operations. Changes in these inter-organizational relationships, technologies and markets affect industry firms to varying degrees. Perhaps the most significant long-term change has been the reduced demand for iron and steel products, evidenced by the long term downward trend in raw steel production (see Appendix Table A7) in contrast to U.S. population and real economic growth over the decades. Several interrelated factors are thought to largely explain the change: those reducing the demand for steel, those affecting the rise of minimills, technological advances and the growth of imports. Changes in the motor vehicle industry exemplify the reduced demand for iron and steel products. Direct shipments to the industry fell 37.1 percent from 23.2 million tons in 1973 to 14.6 million tons in 2012 (Larkin, 2013: O2). Two factors help explain its reduced demand: (1) the long-term increase in imported motor vehicles displaced sales of U.S.-brand vehicles, with the consequence that imported vehicles do not use domestically made iron and steel; and (2) companies’ efforts to improve fuel efficiency. The easiest way to improve fuel efficiency has been to reduce vehicle weight. To that end, as-semblers made vehicles smaller – that choice alone uses less iron and steel – and replaced some iron and steel compo-nents with ones made from lighter weight aluminum, plastics and other materials.18 Steelmakers – among them ArcelorMittal here in Ohio – responded to demands for reduced weight by developing tougher alloys that weigh less (see Schoenberger, 2013),19 and near net shape casting reduced the need for machining parts. Consequently, iron and steel makers regained some of the business lost to manufacturers of alternative materials. (How-ever, recent research and development (R&D) activities – and any subsequent capital expenditures – have focused less on new products and more on improving current product quality and production processes – the latter through automation and computerization for increased efficiency and productivity, and the associated cost reductions and better inventory management. Meeting environmental regulations also has been an R&D goal (Hadid, 2017; Leach, 2017; Yucel, 2017a, 2017b). Steel makers also have expanded into markets such as residential construction (Hadid, 2017). At the same time demand for iron and steel was declining, raw steel production was shifting to minimills as electric arc furnace use expanded and technological advances reduced costs. Foreign producers also gained market share at the expense of domestic producers. Primary steelmakers initially sought to stay competitive by reducing fixed costs, variously selling coal and iron ore assets, selling or shutting coke ovens, and/or spinning-off service and distribution centers.20 In effect, they vertically de-integrated (Larkin, 2007; 2013: O2, O4 & O7). A few even left primary steelmaking, becoming secondary producers by purchasing semi-finished products for further processing or by focusing on specialty steels.
43

However, this strategy left companies to the vicissitudes of the markets. Subsequent price increases for raw materials prompted the remaining companies to vertically re-integrate – to a degree – as part of their efforts to control costs and as-sure steady supplies.21 The actions of two companies in Ohio were part of this movement: ArcelorMittal bought-out other owners of Canada’s Wabush Mines (Wire Report, 2007), and AK Steel acquired Solar Fuel for its reserves of low-volatile metallurgical coal, and formed a joint venture with Magnetation in iron ore production (Larkin, 2013: O3). The consolida-tions and cost reductions also made domestic steelmakers more competitive with their foreign-based rivals. In addition, foreign-based companies were affected by higher costs for raw materials and transportation (Larkin, 2013: I4). Still, fo-reign companies remain highly competitive given their advantages and the pressure of global overcapacity (Hadid, 2017). Similarly, high scrap prices compelled some minimills to internal sourcing, either by purchasing scrap suppliers or by pro-ducing directly reduced iron themselves. This vertical integration raised their fixed costs, reducing an advantage vis-à-vis primary producers, whom they now more closely resemble (Larkin, 2013: I2-I3, O3-O4). (High scrap prices alone reduce minimills’ cost advantage; primary producers are less affected by such high prices because they typically use a 3::1 ratio of pig iron to scrap for steel production (Larkin, 2007: 10).) Despite cost reduction efforts, the combination of reduced customer demand and the market share gains by minimills and foreign producers forced a substantial contraction of primary steel (and associated pig iron) production. Inefficient plants were closed, and the number of primary steel companies was reduced via bankruptcies and mergers (Larkin, 2013: O2; also see U.S. Geological Survey, 1996-2017). Some saw opportunities in the bankruptcies. One example involving fa-cilities in Ohio illustrates. W.L. Ross formed the International Steel Group (ISG) by purchasing the only the assets of LTV, Bethlehem and Weirton. This became feasible and attractive when the Pension Benefit Guaranty Corp. assumed the pension plans and health care benefits of the liquidating companies.22 Successor companies also controlled costs by reducing the size of their work forces, including fewer levels of management, and changing work rules and classifications to permit greater flexibility in what people do. Indeed, ISG’s management structure resembled that of a minimill, and it operated so efficiently (probably using more modern equipment, too) that it produced 90 percent of what LTV did with only one-fourth of the production workers. ISG subsequently merged with Ispat International NV to form Mittal NV. In turn, the merger of Arcelor and Mittal created the world’s largest steel company (Larkin, 2005, 2007).23 Such selective asset purchases were part of the international consolidation of the industry. While globalization has been blamed for the relentless pressure on U.S.-based manufacturers, it also afforded American plants that are part of multi-national companies the opportunity to improve efficiency by learning from co-workers overseas. For example, ArcelorMit-tal’s Burns Harbor, Indiana, plant improved productivity by adopting the best practices of a similar ArcelorMittal plant in Belgium. This included modern equipment and the related automation – particularly computerization – of much of the pro-cess (which lead to the improvement of workers’ skills), greater flexibility in performing tasks, and a kaizen-like attention to
44

the details of process improvement. The steel industry is part of the encompassing trend in American manufacturing: few-er-but-more-highly-skilled workers in more automated factories (Miller, 2012). Another consequence of consolidation is that U.S. iron and steel production (NAICS 3311) is now close to oligopolistic. The five largest companies – AK Steel, ArcelorMittal, Nucor, Steel Dynamics and U.S. Steel – accounted for 57.8 percent of revenue (Hadid, 2017). (AK, ArcelorMittal and Nucor have notable such operations in Ohio.) Oligopolistic is less appli-cable to other industry segments: the five largest pipe and tubes companies (33121) have 19.2 percent of industry reve-nue (Leach, 2017, Vallourec is the biggest in Ohio); the four largest rolling and drawing companies (33122) have less than 20 percent of industry revenue (Yucel, 2017b, Worthington Industries is the largest in the U.S.); and the four largest inde-pendent foundry companies (33151) have less than 25 percent of industry revenue (Yucel, 2017a, none appear to have operations here). Despite trends towards oligopoly, the iron and steel industry generally remains highly competitive due to its organizational environment. Iron and steel makers compete with manufacturers using alternative materials (mostly aluminum and plas-tics) for contracts to supply goods to major buyers (who are important revenue sources and may have significant bargain-ing power). Even when steel is chosen, domestic producers compete with imports, which are a significant portion of do-mestic consumption (Hadid, 2017; U.S. Geological Survey, 2017). Similarly, pipe and tube manufacturers compete with others using cement, pre-stressed concrete, cast iron (from foundries) or fiberglass-reinforced plastics; again, when steel is chosen, domestic producers compete with imports, which have an even larger portion of the U.S. market (Leach, 2017). Manufacturers of rolled and drawn products compete with others using aluminum, composites, concrete or wood to supply many of the same markets (Yucel, 2017b). Competition is less intense among foundries, due in part to smaller produc-tion volumes, closer collaboration with buyers in customizing products, and the minimal role of imports (Yucel, 2017a). Like many business establishments, the iron and steel industry is subject to governmental regulations concerning zoning, pollution, working conditions, and health and safety. Most of the industry differs little from many other manufacturers in these regards (Hadid, 2017; Leach, 2017; Yucel, 2017a); the exception is rolling and drawing purchased steel is compara-tively lightly regulated (Yucel, 2017b). Conversely, governmental assistance is provided to industry organizations in vari-ous forms. While industry production is not subsidized, loans have been provided in times of financial crises. Tariffs on imports are common, but usually remain low if applicable at all. Antidumping and countervailing duties can be much high-er, but they are targeted at specific countries and subject to review by the World Trade Organization. Quotas have been negotiated on occasion. In addition, federally funded transportation and infrastructure projects require purchases of U.S-made foundry products (Hadid, 2017; Leach, 2017; Yucel, 2015, 2017a). While industry organizations have long sought and obtained these protections as remedies for allegedly unfair trade practices, foreign producers and domestic consum-ers have argued their cases in response, and the U.S. government has granted exceptions to them (Larkin, 2013).
45

Foundries stand apart from the rest of the iron and steel industry in some ways. Some foundries mass produce one or a few items and require large investments to realize economies of scale and stay competitive, and the speed of conveyance is important for efficient production at such establishments. Such foundries typically are divisions of industrial machinery makers or motor vehicle assemblers. Others make one item at a time with little or no movement of the product. Some fall in between the two extremes, making small production runs; here, production setups remain flexible and speed is deter-mined by the rate at which molds can be made. Because so much of foundry production is either proprietary for a parent or customized for myriad uses (producers and consumers collaborate on product design in both circumstances), barriers to entry are lower than for the rest of the industry, and the industry remains fragmented despite recent mergers and ac-quisitions. These factors also help explain why competition within the industry is about average, exports are a small mar-ket for foundries, imports an even smaller part of the domestic market, and why foundries have been relatively unaffected by globalization (Goddard, 2015: 7, 16, 20, 22-23, 29).
46

THE NEAR- AND LONG-TERM OUTLOOKS HERE Many of the industry characteristics and their impacts producing the trends described in preceding sections are expected to continue into the foreseeable future. Bearing these varied and sometimes countervailing factors in mind, iron and steel industry analysts have made these national forecasts:
• U.S. demand and industry output are expected to grow in the near term – more rapidly in the next couple of years and slower in the following years to 2022;
• The number of jobs is expected to continue growing for the next couple of years, but may plateau or grow very slowing in the following years to 2022;
• Exports are expected to grow – more rapidly in the next couple of years and slower in the following years to 2022, but not quite as rapidly as imports; consequently, the trade deficit is expected to grow;
• However, the differential growth rates between imports and exports are not expected to substantially alter their res-pective roles in meeting domestic demand or the importance of exports; percentage changes from 2016 to 2022 for the industry as a whole and its constituent groups and sub-groups range from -0.6 to 1.1 percent; and
• The numbers of industry companies and establishments may increase for the next couple of years, but are expected to decline in the following years to 2022; the slightly greater net percentage declines in companies when compared with establishments means the industry is expected to further consolidate through mergers and acquisitions; (drawn from Hadid, 2017; Leach, 2017; Yucel, 2017a, 2017b).
There are exceptions to these generalizations as well as variations on them:
• Growth in demand and industry output is expected to be fastest for iron-and-steel mill product shipments (NAICS 3311) and slowest for rolling-and-drawing (33122), with other sub-groups in between;
• Job growth is expected to be faster in pipes-and-tubes (33121) and steel mill products, and slower in rolling-and-draw-ing, but foundry (33151) employment may decline;
• Export growth is expected to be faster in pipes-and-tubes and iron-and-steel products, and slower in foundries and rolled-and-drawn products;
• Import growth is expected to be fastest in iron-and-steel products and slowest in foundry products, with other sub-groups in between;
• The trade deficit is expected to grow fastest in iron-and steel-products, and slower in pipes-and-tubes; however, the trade surplus in foundry products is expected to continue; and
• The numbers of pipes-and-tubes companies and establishments are expected to grow (compare Hadid, 2017; Leach, 2017; Yucel, 2017a, 2017b).
47

The forecasts for industry output and job growth, and even higher company and establishment counts, during the next couple of years, may be based on expectations of strong or increasing demand from key markets – extracting, handling and transporting fluids, construction, transportation equipment and other durable goods industries, and ultimately by a continuation of the current overall expansion. Export and import growth may be parts of this arc. (However, there are no explicit predictions regarding changes in the value of the dollar.) The slow-to-flat following years to 2022 may represent analysts’ anticipating a peak of the current expansion and/or an emphasis on the longer-term, cycle-independent effects of competition (including with alternative materials), industry consolidation and technological advancements. The impact of these continuing trends could be the reasons company and establishment counts are expected to fall and employment to level-off. Over the longer term – i.e. regardless of cyclical or other short-term changes – the U.S. Bureau of Labor Statistics (BLS) (2015) expects national output from the iron-steel-ferroalloy and steel-products-from-purchased-steel groups (NAICS 3311 and 3312) to grow at average annual rates of 0.6 and 0.8 percent, respectively, from 2014 through 2024. Both are less than the 2.2 percent average annual rate forecast for the overall economy, and characteristic of mature industries. This longer-term trend has little association with prospects for employment growth in the industry:
• On one hand, both the U.S. BLS and the Ohio Dept. of Job and Family Services’ Labor Market Information division (ODJFS-LMI, 2016) project a net increase in jobs during 2014-2024 in the steel-products-from-purchased-steel group; 4.5 percent in Ohio and 3.5 percent for the U.S.;
• On the other hand, ODJFS-LMI foresees almost no change – a 0.8 percent loss – in iron-steel-ferroalloys employment here, while the U.S. BLS expects a 3.7 decline over the decade;
• The combined figures shown in Appendix Table A14 are a 1.6 percent increase in Ohio from 16,310 to 16,570, and a 0.9 percent decrease from 151,600 to 150,300 for the nation;
• All of these industry-specific projections are less than those for overall employment growth – 5.3 percent in Ohio and 6.5 percent for the nation.24
48
See Table A14

This page intentionally blank
49

APPENDICES
50

DETAILED TABLES
51

Table A1: Notable^ Iron and Steel Manufacturing Companies in Ohio, 2017
Parent/Company/Division NAICS City Total at Site
AK Steel Holding Corp.* 3,296
AK Steel Corp. (HQ) 551114 West Chester 300
AK Steel Corp.2
3311 Middletown 2,100
AK Steel Corp.2
3311 Mansfield 333
AK Steel Corp.2
331221 Coshocton 420
AK Steel Corp.2
331221 Zanesville 143
Allegheny Technologies, Inc.*/Allegheny Ludlum, LLC 331221 Louisville 26
Arcelormittal SA*3
2,553
ArcelorMittal USA LLC (regional HQ) 551114 Richfield 30
ArcelorMittal Cleveland LLC (east and west sites combined) 3311 Cleveland 1,927
ArcelorMittal Tubular Products 33121 Shelby 496
ArcelorMittal Tubular Products 33121 Marion 100
BlueScope Steel Ltd./North Star BlueScope4
3311 Delta 380
Carpenter Technology Corp.*/Latrobe Specialty Metals Co., LLC 331222 Wauseon 76
Charter Manufacturing Co., Inc./Charter Steel Division5
3311 Cleveland 330
General Motors Co.*/Defiance Casting3
331511 Defiance 1,128
Industrias CH, SAB de CV6
725
Republic Steel Hot-rolled Plant (regional HQ) 551114 Canton 100
Republic Steel Canton Bloom Casting 3311 Canton 400
Republic Steel Hot-rolled Bar Plant7
331221 Lorain 10
Republic Steel Cold-finished Plant 331221 Massillon 200
Republic Steel Wire Processing Division 331222 Solon 15
Leggett & Platt, Inc.*/Solon Specialty Wire Co. 331222 Solon 25
McWane, Inc. (fka Clow Water Systems)8
331511 Coshocton 425
Mitsui & Co., Ltd.*6
130
Steel Technologies LLC 331221 Ottawa 100
Steel Technologies LLC 331221 Willoughby 30
Nucor Corp.* 284
Nucor Bright Bar Orrville LLC 331221 Orrville 19
Nucor Steel Marion, Inc.3
3311 Marion 265
Jobs1
52

Table A1: Notable^ Iron and Steel Manufacturing Companies in Ohio, 2017
Parent/Company/Division NAICS City Total at Site
Jobs1
Osco Industries, Inc.3
410
Osco Industries, Inc. 331511 Portsmouth 200
Osco Industries, Inc. 331511 New Boston 70
Osco Industries, Inc. 331511 Jackson 140
TimkenSteel Corp.9
1,934
TimkenSteel Corp. (HQ) 551114 Canton 187
TimkenSteel Corp. (Faircrest, Gambrinus & Harrison) 3311 Canton 1,650
TimkenSteel Corp. (St. Clair) 331221 Eaton 97
United States Steel Corp.*10
33121 Lorain 167
Vallourec SA/Vallourec Star, LP11
33121 Youngstown 550
Westinghouse Air Brake Technologies Corp.*/Wabtec/Sancast12
331511 Coshocton 40
Worthington Industries, Inc.* 840
Worthington Industries, Inc. (HQ) 551114 Worthington 250
Worthington Steel Co. 331513 Monroe 165
Worthington Steel Co. 331221 Cleveland 175 Worthington Steelpac Systems 331513 Columbus 250
Notes : ^ - "notable" means either (a) a Fortune U.S.-1,000 or Global-500 company, (b) a company employing at least 400
people in Ohio, or (c ) a major melt facility; * - a Fortune company; 1 - jobs figures are from Hoover's (2017) unless otherwise
noted; they are the best available estimates, but their accuracy cannot be guaranteed; 2 - jobs figures at least partially based
on U.S. Census Bureau (2017b); 3 - jobs figures from company website(s); 4 - jobs figure from Binsted (2016); 5 - jobs figure
from Plain-Dealer (2017), with 25 expected to be added in 2018; 6 - jobs figures from Office of Research (2016a); 7 - the plant
is changing to pig iron production with new jobs expected (Payerchin, 2017); 8 - jobs figure from Hannahs (2017); 9 - HQ jobs
figure derived from McKinnon (2015); Faircrest-Gambrinus-Harrison figure is company-reported union only; 10 - jobs figure
derived from Nix (2016); 11 - jobs figure from Tribune-Chronicle (2017); 12 - jobs figure from Williams (2017). Sources : Bin-
sted (2016), Fortune (2017), Hannahs (2017), Hoover's (2017), McKinnon (2015), Nix (2016), Office of Research (2016a), Pay-
erchin (2017), Plain-Dealer (2107), Tribune-Chronicle (2017), U.S. Census Bureau (2017b), Williams (2017) and company
websites (2017).
Prepared by: Office of Research, Ohio Development Services Agency. Telephone 614-466-2116 (DL, 10/17).
53

Table A2: Expansion and Attraction Announcements in Ohio's Iron and Steel Industry, 2013-16
NAICS New or Announced Anticipated Space
Year Company Area Code* Product Expanded Investment New Jobs (Sq. Ft.)
2013 ArcelorMittal Inc Cleveland 33111 Steel Expanded $55,000,000
2013 GKN Sinter Metals LLC Gallipolis 33111 Metal products Expanded $10,000,000 50
2013 Heidtman Steel Products Inc Toledo 331221 Rolled steel Expanded $5,700,000 18
2013 Louis G Freeman Co Inc Fremont 33111 Steel products Expanded $4,200,000 12
2013 Northlake Steel Corp Liverpool Twp 33111 Steel products Expanded $2,200,000 3 39,000
2013 O S Kelly Corp Springfield 331511 Foundry - piano parts Expanded $1,000,000 24,000
2013 Vallourec Star LP Youngstown 33121 Steel pipe Expanded $65,000,000
2013 Worthington Industries Columbus 331221 Steel Expanded $1,200,000
2013 Subtotals $144,300,000 83 63,000
2014 ArcelorMittal Tubular Products USA LLC Shelby 3312 Tubular steel Expanded $29,100,000 45
2014 Charter Manufacturing Co Perry Twp 3311 Steel wire Expanded 52,000
2014 Harbor Castings, Inc Cuyahoga Falls 33151 Castings New $1,075,000 16
2014 JMC Steel/Wheatland Tube Warren 3312 Steel tubing Expanded $1,700,000
2014 Liberty Castings Company LLC Delaware 33151 Metal castings Expanded $10,100,000 52 14,000
2014 Timken Steel Corp Perry Twp 3311 Steel heat treating Expanded $42,000,000 13
2014 Subtotals $83,975,000 126 66,000
2015 Charter Manufacturing Co. Cuyahoga Heights 3311 Steel Expanded $6,000,000 20 48,000
2015 Major Metals Company Washington Twp 3312 Metal tubing Expanded $1,500,000 18
2015 Precision Strip Inc Kenton 3312 Steel Expanded $1,000,000 200,000
2015 Subtotals $8,500,000 38 248,000
2016 Hi Tech Wire, Inc. St. Henry 3312 Wire products Expanded $2,300,000 5 27,000
2016 Jackson Tube Service, Inc. Piqua 3312 Metal tubing Expanded $1,300,000 19,000
2016 Worthington Steel Co York Twp 3311 Galvanized steel Expanded $11,600,000 26
2016 Subtotals $15,200,000 31 46,000
Grand Totals $251,975,000 278 423,000
Note: * - NAICS codes are less detailed after 2013.
Source: Office of Research, ODSA (2014b-2017b).
Prepared by: Office of Research, Ohio Development Services Agency. Telephone 614/466-2116 (DL, 10/17).
54

Table A3: Iron and Steel Industry Concentration in Ohio
Ohio as
Year, Subject & Amount Distribution U.S. Totals a PercentNAICS Codes Industry Title (millions) in Ohio (millions) of the U.S.
2015 GDP*: Total $607,326 $17,925,143 3.4%
331 Primary Metals $6,091 $55,923 10.9%
2015 Value-Added:
331* Primary Metals $9,853 100.0% $81,072 12.2%
3311-2 Iron & Steel Industry (Exc. Foundries) $4,039 41.0% $36,050 11.2%
3311 Iron & Steel Mills & Ferroalloys $3,290 33.4% $29,305 11.2%
3312 Steel Products from Purchased Steel $749 7.6% $6,745 11.1%
2012 Value-Added: Primary Metals $7,998 $85,371 9.4%
3311-2, 33151 Iron & Steel Industry $5,716 100.0% $51,732 11.0%
3311 Iron & Steel Mills & Ferroalloys $3,501 61.2% $32,409 12.7%
3312 Steel Products from Purchased Steel $1,196 20.9% $9,038 13.2%
33121 Iron & Steel Pipes & Tubes $833 14.6% $5,088 16.4%
33122 Rolling & Drawing Purchased Steel $363 6.4% $3,950 9.2%
331221 Rolled Steel Shapes $217 3.8% $2,135 10.2%
331222 Steel Wire Drawing $146 2.6% $1,815 8.1%
33151 Ferrous Metal Foundries $1,019 17.8% $10,286 9.9%
331511 Iron Foundries $438 7.7% $5,552 7.9%
331512 Steel Investment Foundries $330 5.8% $2,400 13.7% 331513 Steel Foundries (Exc. Investment) $251 4.4% $2,334 10.7%
Notes: * - Gross Domestic Product (GDP) figures are subject revision; due to minor technical differences, state GDP
figures are analogous to, but not identical with, national GDP; GDP figures for primary metals are less than value-
added (VA) figures because GDP subtracts additional costs included in VA; exc. - except.
Sources: U.S. Bureau of the Census (2017a, 2015c); U.S. Bureau of Economic Analysis (2017).
From Ohio
55

Table A4: Establishments and Employment in the Iron and Steel Industry, Ohio and U.S., 2015
Mean per Mean per
NAICS Estab- Employ- Estab- Estab- Employ- Estab- Estab- Employ-
Codes Short Title lishments ment lishment lishments ment lishment lishments ment
Total Covered Employment 251,668 4,719,985 18.8 7,663,938 124,085,947 16.2 3.3% 3.8%
3311-2, 51 Iron & Steel Industry 180 25,821 143.5 1,979 219,322 110.8 9.1% 11.8%
3311 Iron & steel mills & ferroalloys 56 13,113 234.2 603 103,853 172.2 9.3% 12.6%
3312 Steel product mfg. from purchased steel 54 5,441 100.8 667 48,684 73.0 8.1% 11.2%
33121 Iron, steel pipe & tube mfg. from purchased steel 20 3,564 178.2 247 25,080 101.5 8.1% 14.2%
33122 Rolling & drawing of purchased steel 34 1,877 55.2 420 23,604 56.2 8.1% 8.0%
331221 Rolled steel shapes 17 932 54.8 176 8,501 48.3 9.7% 11.0%
331222 Steel wire drawing 17 945 55.6 244 15,103 61.9 7.0% 6.3%
33151 Ferrous metal foundries 70 7,267 103.8 709 66,785 94.2 9.9% 10.9%
331511 Iron foundries 39 3,816 97.8 387 36,467 94.2 10.1% 10.5%
331512 Steel investment foundries 14 1,741 124.4 118 14,206 120.4 11.9% 12.3%
331513 Steel foundries (exc. investment) 17 1,710 100.6 204 16,112 79.0 8.3% 10.6%
Abbreviations used: exc. - excluding; mfg. - manufacturing.
Source: U.S. Bureau of the Census (2017b).
Prepared by: Office of Research, Ohio Development Services Agency. Telephone 800/848-1300, or 614/466-2116 (DL, 10/17).
56
Ohio as a Per-
cent of the U.S.
Ohio U.S.
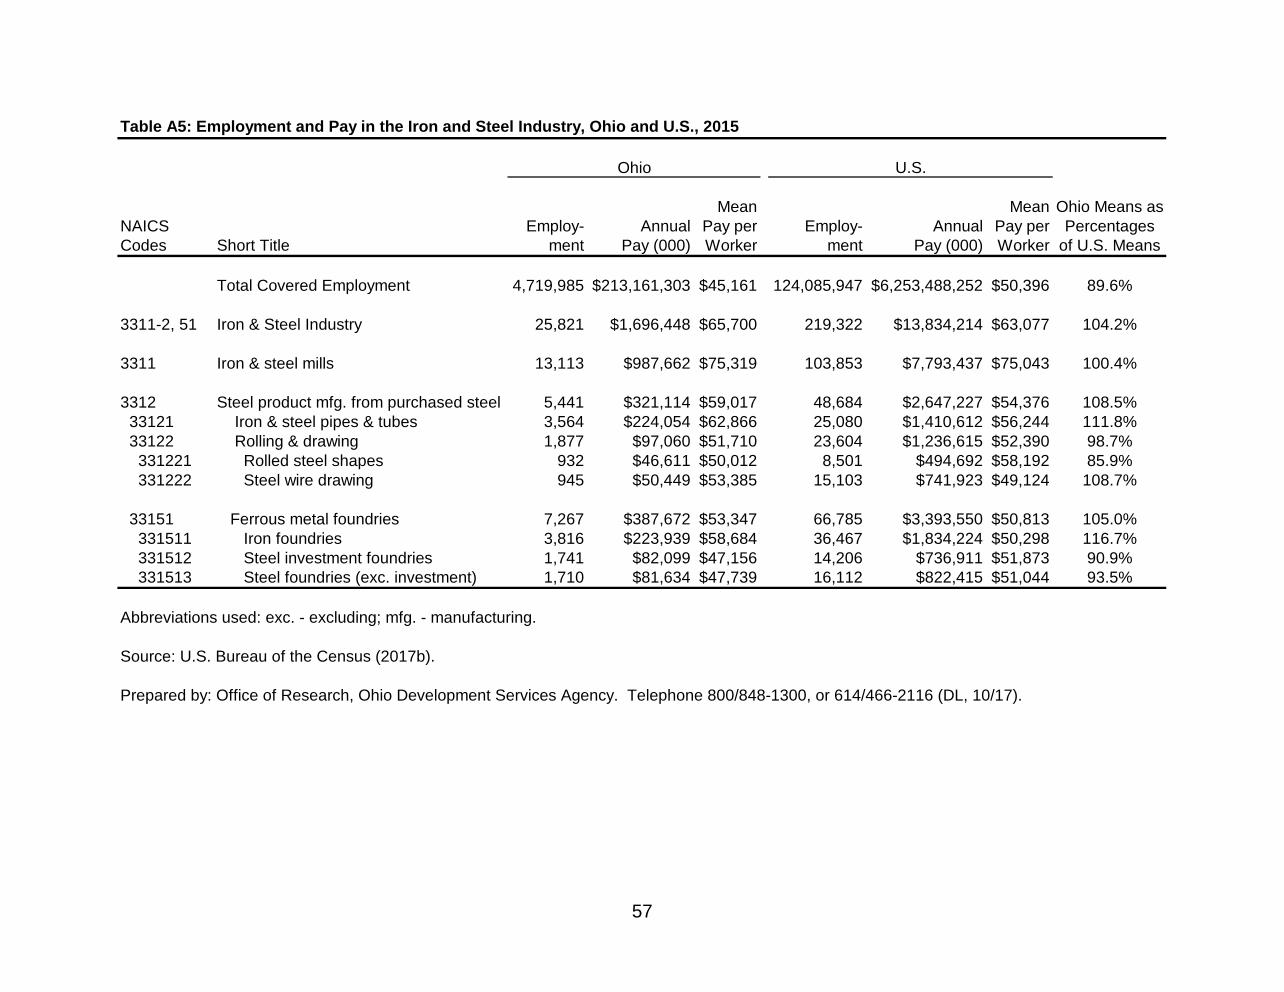
Table A5: Employment and Pay in the Iron and Steel Industry, Ohio and U.S., 2015
Mean Mean Ohio Means as
NAICS Employ- Annual Pay per Employ- Annual Pay per Percentages
Codes Short Title ment Pay (000) Worker ment Pay (000) Worker of U.S. Means
Total Covered Employment 4,719,985 $213,161,303 $45,161 124,085,947 $6,253,488,252 $50,396 89.6%
3311-2, 51 Iron & Steel Industry 25,821 $1,696,448 $65,700 219,322 $13,834,214 $63,077 104.2%
3311 Iron & steel mills 13,113 $987,662 $75,319 103,853 $7,793,437 $75,043 100.4%
3312 Steel product mfg. from purchased steel 5,441 $321,114 $59,017 48,684 $2,647,227 $54,376 108.5%
33121 Iron & steel pipes & tubes 3,564 $224,054 $62,866 25,080 $1,410,612 $56,244 111.8%
33122 Rolling & drawing 1,877 $97,060 $51,710 23,604 $1,236,615 $52,390 98.7%
331221 Rolled steel shapes 932 $46,611 $50,012 8,501 $494,692 $58,192 85.9%
331222 Steel wire drawing 945 $50,449 $53,385 15,103 $741,923 $49,124 108.7%
33151 Ferrous metal foundries 7,267 $387,672 $53,347 66,785 $3,393,550 $50,813 105.0%
331511 Iron foundries 3,816 $223,939 $58,684 36,467 $1,834,224 $50,298 116.7%
331512 Steel investment foundries 1,741 $82,099 $47,156 14,206 $736,911 $51,873 90.9%
331513 Steel foundries (exc. investment) 1,710 $81,634 $47,739 16,112 $822,415 $51,044 93.5%
Abbreviations used: exc. - excluding; mfg. - manufacturing.
Source: U.S. Bureau of the Census (2017b).
Prepared by: Office of Research, Ohio Development Services Agency. Telephone 800/848-1300, or 614/466-2116 (DL, 10/17).
57
Ohio U.S.

Table A6: Establishments and Employment in Ohio's Iron and Steel Industry, by County, 2015
Estab- Employ- Estab- Employ- Estab- Employ-
Area Name lishments ment* Area Name lishments ment* Area Name lishments ment*
Ohio 180 25,821 Greene 1 28 Morrow 0 0
Guernsey 1 143 Muskingum 2 285
Adams 0 0 Hamilton 3 377 Noble 0 0
Allen 1 66 Hancock 3 173 Ottawa 0 0
Ashland 0 0 Hardin 2 143 Paulding 1 28
Ashtabula 0 0 Harrison 0 0 Perry 1 143
Athens 0 0 Henry 1 28 Pickaway 0 0
Auglaize 2 171 Highland 0 0 Pike 0 0
Belmont 0 0 Hocking 0 0 Portage 0 0
Brown 0 0 Holmes 1 3 Preble 0 0
Butler 5 2,046 Huron 0 0 Putnam 1 143
Carroll 1 15 Jackson 2 145 Richland 6 1,158
Champaign 0 0 Jefferson 2 31 Ross 0 0
Clark 1 66 Knox 0 0 Sandusky 0 0
Clermont 0 0 Lake 5 904 Scioto 2 209
Clinton 1 15 Lawrence 0 0 Seneca 0 0
Columbiana 7 228 Licking 0 0 Shelby 1 28
Coshocton 3 733 Logan 1 3 Stark 14 4,993
Crawford 0 0 Lorain 4 1,476 Summit 7 260
Cuyahoga 19 3,233 Lucas 5 257 Trumbull 10 966
Darke 1 7 Madison 1 28 Tuscarawas 3 300
Defiance 1 1,183 Mahoning 10 775 Union 2 10
Delaware 2 209 Marion 3 428 Van Wert 0 0
Erie 1 143 Medina 2 95 Vinton 0 0
Fairfield 0 0 Meigs 0 0 Warren 1 15
Fayette 0 0 Mercer 0 0 Washington 6 518
Franklin 6 1,366 Miami 3 314 Wayne 3 695
Fulton 4 190 Monroe 0 0 Williams 2 43
Gallia 0 0 Montgomery 9 275 Wood 2 158
Geauga 1 3 Morgan 0 0 Wyandot 1 143
Note: * - All county employment figures should be considered estimates. The fact that the sum of the county figures, 25,393, is 98.3 percent of the state
state total, 25,821, means that the county estimates tend to be slightly low.
Sources: Gearino (2015), ODSA (2016a), U.S. Bureau of the Census (2017b) and various company websites (2015).
Prepared by: Office of Research, Ohio Development Services Agency. Telephone 614-466-2116 (DL, 10/17).
58

Table A7: Raw Steel Production in Ohio and the U.S., 1971-2016 (in thousands of net tons, except ranks and percentages)
Percent Percent Percent Percent
Change Change Ohio as Change Change Ohio as
Raw from Raw from Percent Ohio's Raw from Raw from Percent Ohio's
Steel Prior Steel Prior of U.S. Rank Steel Prior Steel Prior of U.S. Rank
Year Output Year Output Year Output in U.S. Year Output Year Output Year Output in U.S.
1971 20,064 -7.5% 120,443 -8.4% 16.7% 2 1994 16,683 3.6% 100,579 2.8% 16.6% 2
1972 23,851 18.9% 133,241 10.6% 17.9% 2 1995 16,444 -1.4% 104,930 4.3% 15.7% 2
1973 26,510 11.1% 150,799 13.2% 17.6% 2 1996 16,837 2.4% 105,309 0.4% 16.0% 2
1974 25,251 -4.7% 145,720 -3.4% 17.3% 2 1997 15,827 -6.0% 108,561 3.1% 14.6% 2
1975 19,620 -22.3% 116,642 -20.0% 16.8% 3 1998 16,758 5.9% 108,752 0.2% 15.4% 2
1976 22,419 14.3% 128,000 9.7% 17.5% 2 1999 17,499 4.4% 107,395 -1.2% 16.3% 2
1977 21,466 -4.3% 125,333 -2.1% 17.1% 3 2000 18,263 4.4% 112,242 4.5% 16.3% 2
1978 21,268 -0.9% 137,031 9.3% 15.5% 3 2001 15,726 -13.9% 99,321 -11.5% 15.8% 2
1979 21,082 -0.9% 136,341 -0.5% 15.5% 3 2002 14,646 -6.9% 100,958 1.6% 14.5% 2
1980 16,100 -23.6% 111,835 -18.0% 14.4% 3 2003 13,100 -10.6% 103,261 2.3% 12.7% 2
1981 18,096 12.4% 120,828 8.0% 15.0% 3 2004 15,807 20.7% 109,879 6.4% 14.4% 2
1982 12,181 -32.7% 74,577 -38.3% 16.3% 2 2005 16,432 4.0% 104,605 -4.8% 15.7% 2
1983 14,586 19.7% 84,615 13.5% 17.2% 2 2006 15,856 -3.5% 108,234 3.5% 14.6% 2
1984 15,438 5.8% 92,528 9.4% 16.7% 2 2007 16,146 1.8% 108,138 -0.1% 14.9% 2
1985 14,094 -8.7% 88,259 -4.6% 16.0% 2 2008 14,778 -8.5% 101,297 -6.3% 14.6% 2
1986 14,522 3.0% 81,606 -7.5% 17.8% 2 2009 6,590 -55.4% 65,460 -35.4% 10.1% 2
1987 16,267 12.0% 89,151 9.2% 18.2% 2 2010 9,257 40.5% 88,731 35.5% 10.4% 2
1988 17,662 8.6% 99,924 12.1% 17.7% 2 2011 11,596 25.3% 95,237 7.3% 12.2% 2
1989 16,506 -6.5% 97,943 -2.0% 16.9% 2 2012 13,688 18.0% 97,774 2.7% 14.0% 2
1990 16,769 1.6% 98,906 1.0% 17.0% 2 2013 11,495 -16.0% 95,790 -2.0% 12.0% 2
1991 14,210 -13.9% 87,896 -10.3% 16.2% 2 2014 12,639 10.0% 97,223 1.5% 13.0% 2
1992 15,524 -7.4% 92,949 -6.0% 16.7% 2 2015 11,292 -10.7% 86,861 -10.7% 13.0% 2
1993 16,101 3.7% 97,877 5.3% 16.5% 2 2016* 9,700 -14.1% 88,184 1.5% 11.0% 2
Notes: * - preliminary, subject to revision; data after 2011 from the U.S. Geological Survey.
Sources: American Iron and Steel Institute (1974, 1978, 1982, 1987, 1989, 1992, 1996, 1998, 2000, 2002, 2004, 2007), Hill, et.al. (2012),
U.S. Geological Survey (2015, 2017).
Prepared by: Office Research, Ohio Development Services Agency. Telephone 614/466-2116 (DL, 10/17).
U.S.
59
Ohio U.S. Ohio

Table A8: Trends in Value-Added for Ohio and the U.S., 2005-2015
`05-`15
Area Name / NAICS: Title 2005 2006 2007 2008 2009 2010 2011 2012 2013 2014 2015* Averages
In millions of current dollars:
Ohio: 331(p) - Iron, steel, ferroalloys & products $5,824 $5,154 $5,958 $6,935 $1,194 $4,554 $5,779 $4,697 $4,560 $5,144 $4,039 $4,894
3311: Iron & steel mills & ferroalloys $4,539 $3,549 $4,680 $5,381 $520 $3,864 $4,956 $3,501 $3,513 $4,095 $3,290 $3,808
3312: Steel products from purchased steel $1,284 $1,605 $1,278 $1,554 $674 $689 $822 $1,196 $1,047 $1,049 $749 $1,086
U.S.: 331(p) - Iron, steel, ferroalloys & products $38,521 $41,618 $44,575 $51,517 $17,736 $38,183 $47,387 $41,446 $42,675 $44,355 $36,050 $40,369
3311: Iron & steel mills & ferroalloys $31,173 $34,367 $37,002 $43,262 $14,715 $31,862 $39,770 $32,409 $33,951 $35,852 $29,305 $33,061
3312: Steel products from purchased steel $7,348 $7,251 $7,573 $8,255 $3,021 $6,321 $7,616 $9,038 $8,724 $8,503 $6,745 $7,309
Ohio as a percentage of U.S. value-added:
331(p): Iron, steel, ferroalloys & products 15.1% 12.4% 13.4% 13.5% 6.7% 11.9% 12.2% 11.3% 10.7% 11.6% 11.2% 12.1%
3311: Iron & steel mills & ferroalloys 14.6% 10.3% 12.6% 12.4% 3.5% 12.1% 12.5% 10.8% 10.3% 11.4% 11.2% 11.5%
3312: Steel products from purchased steel 17.5% 22.1% 16.9% 18.8% 22.3% 10.9% 10.8% 13.2% 12.0% 12.3% 11.1% 14.9%
For constant dollars, standardized on 2009:
Producer Price Index for 3311: 136.4 150.7 160.8 188.3 137.9 163.3 183.6 175.3 164.8 170.7 148.4
Producer Price Index for 3312: 146.1 148.2 151.1 188.7 156.6 168.9 189.3 187.0 178.3 179.2 164.0
Ohio: 331(p) - Iron, steel, ferroalloys & products $5,965 $4,943 $5,339 $5,230 $1,194 $3,902 $4,403 $3,756 $3,858 $4,225 $3,773 $4,235
3311: Iron & steel mills & ferroalloys $4,588 $3,246 $4,014 $3,940 $520 $3,263 $3,722 $2,754 $2,938 $3,309 $3,057 $3,214
3312: Steel products from purchased steel $1,377 $1,697 $1,325 $1,290 $674 $639 $680 $1,002 $920 $917 $715 $1,021
U.S.: 331(p) - Iron, steel, ferroalloys & products $39,383 $39,106 $39,585 $38,531 $17,736 $32,768 $36,170 $33,062 $36,062 $36,395 $33,671 $34,770
3311: Iron & steel mills & ferroalloys $31,506 $31,440 $31,733 $31,680 $14,715 $26,907 $29,870 $25,494 $28,400 $28,965 $27,229 $27,995
3312: Steel products from purchased steel $7,877 $7,666 $7,852 $6,851 $3,021 $5,861 $6,300 $7,568 $7,662 $7,430 $6,442 $6,775
Ohio as a percentage of U.S. value-added:
331(p): Iron, steel, ferroalloys & products 15.1% 12.6% 13.5% 13.6% 6.7% 11.9% 12.2% 11.4% 10.7% 11.6% 11.2% 12.2%
3311: Iron & steel mills & ferroalloys 14.6% 10.3% 12.6% 12.4% 3.5% 12.1% 12.5% 10.8% 10.3% 11.4% 11.2% 11.5%
3312: Steel products from purchased steel 17.5% 22.1% 16.9% 18.8% 22.3% 10.9% 10.8% 13.2% 12.0% 12.3% 11.1% 15.1%
Notes: * - Preliminary, subject to revision.
Sources: U.S. Bureau of the Census (2007a-2017a, 2013c, 2015c), U.S. Bureau of Labor Statistics (2017).
Prepared by: Office of Research, Ohio Development Services Agency. Telephone 800/848-1300 or 614/466-2116 (DL, 10/17).
Year
60

Table A9: Trends in Capital Expenditures for Ohio and the U.S., 2005-2015 (in millions of current dollars)
`05-`15
Area Name / NAICS: Title 2005 2006 2007 2008 2009 2010 2011 2012 2013 2014 2015* Averages
Ohio: 331(p) - Iron, steel, ferroalloys & products $278 $462 $468 $322 $166 $191 $461 $604 $419 $267 $213 $385
3311: Iron & steel mills & ferroalloys $226 $390 $409 $265 $113 $173 $284 $253 $371 $126 $150 $276
3312: Steel products from purchased steel $52 $72 $59 $57 $54 $18 $177 $351 $48 $140 $63 $109
U.S.: 331(p) - Iron, steel, ferroalloys & products $2,170 $2,225 $3,672 $5,002 $3,459 $3,752 $3,948 $4,682 $4,080 $2,991 $2,538 $3,852
3311: Iron & steel mills & ferroalloys $1,800 $1,832 $3,220 $4,506 $3,021 $3,289 $2,634 $3,071 $3,302 $2,294 $1,659 $3,063
3312: Steel products from purchased steel $370 $393 $452 $496 $438 $463 $1,314 $1,612 $778 $697 $879 $789
Ohio as a percentage of U.S. capital expenditures:
331(p): Iron, steel, ferroalloys & products 12.8% 20.7% 12.7% 6.4% 4.8% 5.1% 11.7% 12.9% 10.3% 8.9% 8.4% 10.0%
3311: Iron & steel mills & ferroalloys 12.6% 21.3% 12.7% 5.9% 3.7% 5.2% 10.8% 8.2% 11.2% 5.5% 9.0% 9.0%
3312: Steel products from purchased steel 13.9% 18.2% 13.0% 11.5% 12.3% 3.9% 13.5% 21.8% 6.2% 20.1% 7.1% 13.8%
Ratio: Percentage of Valued-Added in Ohio to
to Percentage of Capital Expenditures in Ohio:
331(p): Iron, steel, ferroalloys & products 1.18 0.60 1.05 2.09 1.40 2.35 1.04 0.88 1.04 1.30 1.34 1.21
3311: Iron & steel mills & ferroalloys 1.16 0.49 1.00 2.11 0.95 2.31 1.16 1.31 0.92 2.07 1.24 1.28
3312: Steel products from purchased steel 1.25 1.22 1.30 1.64 1.82 2.82 0.80 0.61 1.95 0.61 1.56 1.08
Notes: * - Preliminary, subject to revision; p - part.
Sources: U.S. Bureau of the Census (2007a-2017a, 2013c, 2015c).
Prepared by: Office of Research, Ohio Development Services Agency. Telephone 800/848-1300 or 614/466-2116 (DL, 10/17).
Year
61
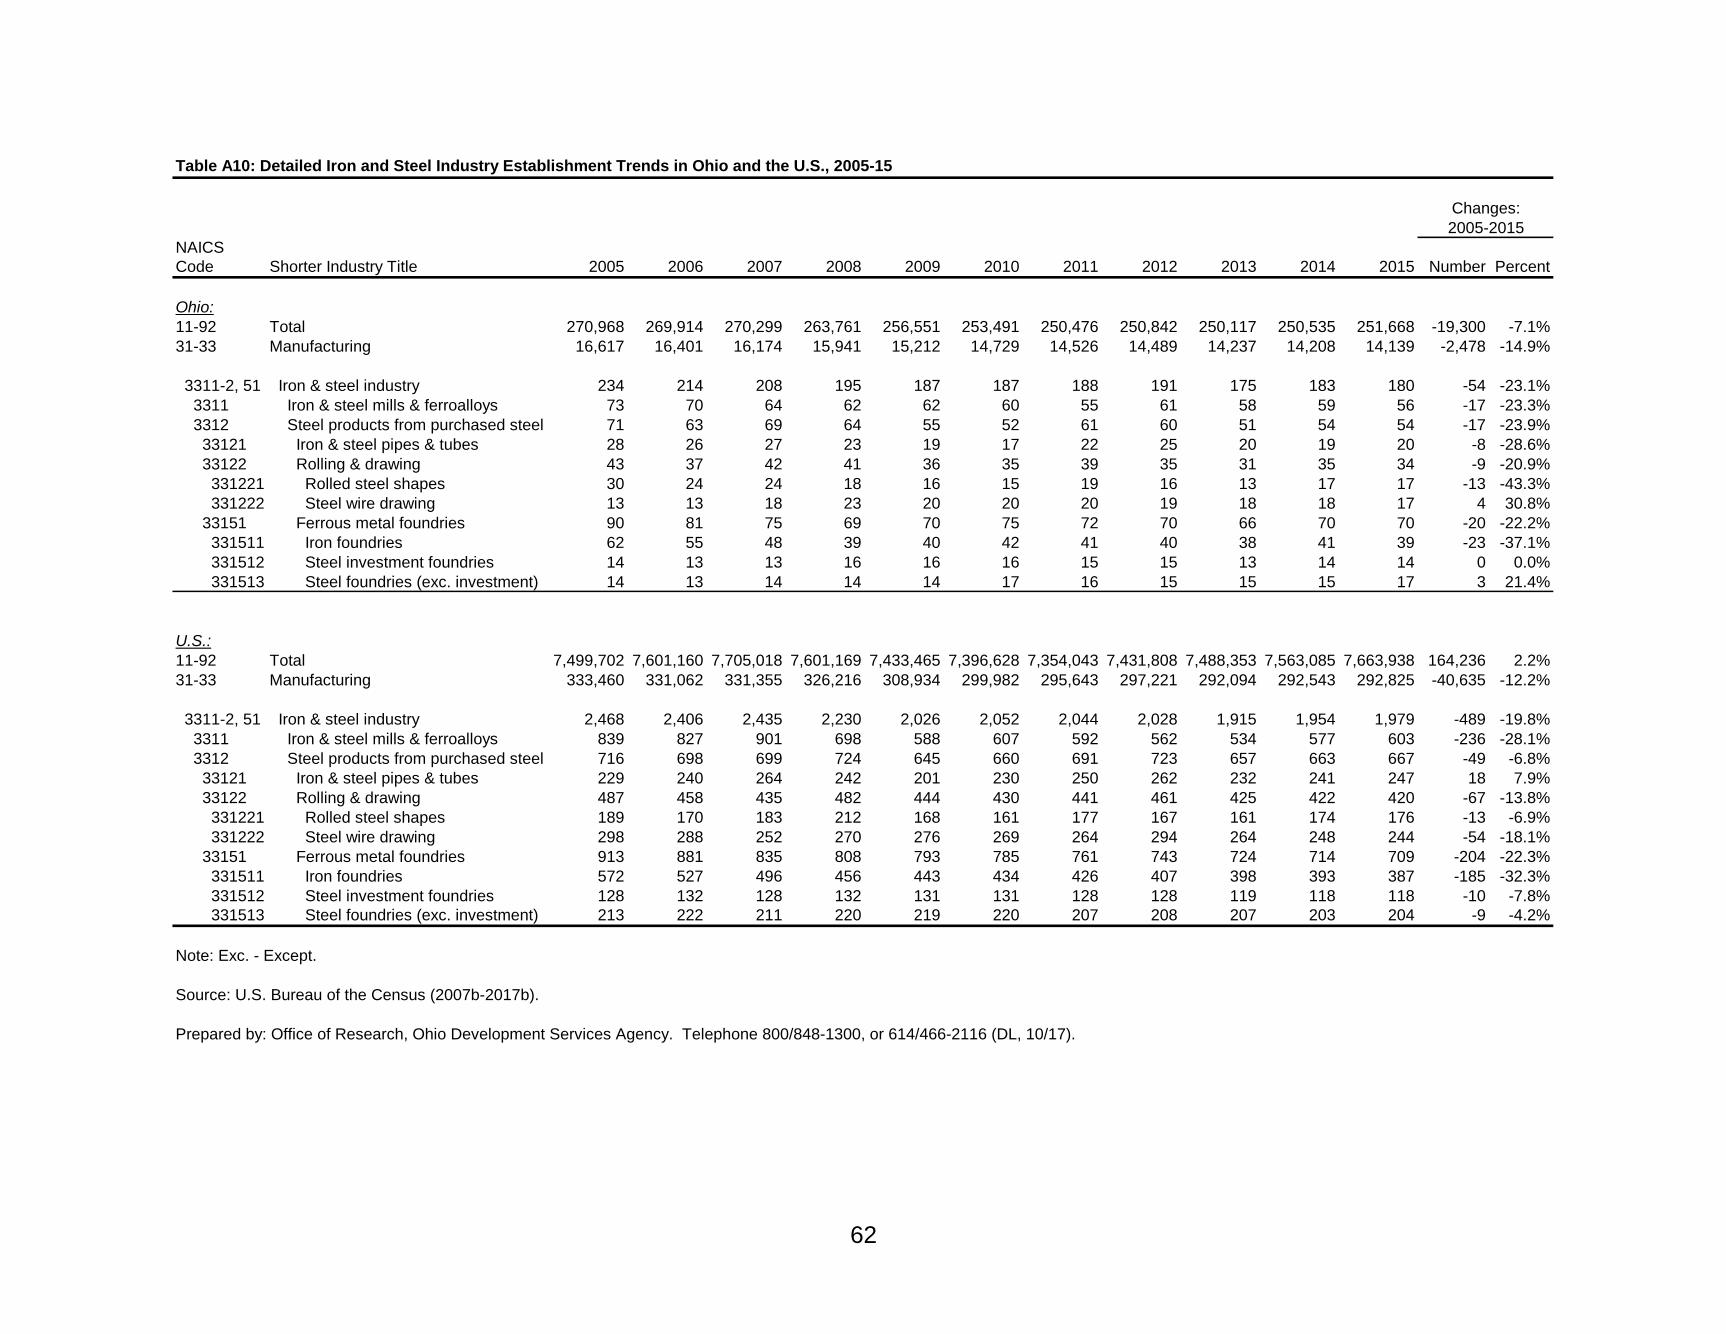
Table A10: Detailed Iron and Steel Industry Establishment Trends in Ohio and the U.S., 2005-15
NAICS
Code Shorter Industry Title 2005 2006 2007 2008 2009 2010 2011 2012 2013 2014 2015 Number Percent
Ohio:
11-92 Total 270,968 269,914 270,299 263,761 256,551 253,491 250,476 250,842 250,117 250,535 251,668 -19,300 -7.1%
31-33 Manufacturing 16,617 16,401 16,174 15,941 15,212 14,729 14,526 14,489 14,237 14,208 14,139 -2,478 -14.9%
3311-2, 51 Iron & steel industry 234 214 208 195 187 187 188 191 175 183 180 -54 -23.1%
3311 Iron & steel mills & ferroalloys 73 70 64 62 62 60 55 61 58 59 56 -17 -23.3%
3312 Steel products from purchased steel 71 63 69 64 55 52 61 60 51 54 54 -17 -23.9%
33121 Iron & steel pipes & tubes 28 26 27 23 19 17 22 25 20 19 20 -8 -28.6%
33122 Rolling & drawing 43 37 42 41 36 35 39 35 31 35 34 -9 -20.9%
331221 Rolled steel shapes 30 24 24 18 16 15 19 16 13 17 17 -13 -43.3%
331222 Steel wire drawing 13 13 18 23 20 20 20 19 18 18 17 4 30.8%
33151 Ferrous metal foundries 90 81 75 69 70 75 72 70 66 70 70 -20 -22.2%
331511 Iron foundries 62 55 48 39 40 42 41 40 38 41 39 -23 -37.1%
331512 Steel investment foundries 14 13 13 16 16 16 15 15 13 14 14 0 0.0%
331513 Steel foundries (exc. investment) 14 13 14 14 14 17 16 15 15 15 17 3 21.4%
U.S.:
11-92 Total 7,499,702 7,601,160 7,705,018 7,601,169 7,433,465 7,396,628 7,354,043 7,431,808 7,488,353 7,563,085 7,663,938 164,236 2.2%
31-33 Manufacturing 333,460 331,062 331,355 326,216 308,934 299,982 295,643 297,221 292,094 292,543 292,825 -40,635 -12.2%
3311-2, 51 Iron & steel industry 2,468 2,406 2,435 2,230 2,026 2,052 2,044 2,028 1,915 1,954 1,979 -489 -19.8%
3311 Iron & steel mills & ferroalloys 839 827 901 698 588 607 592 562 534 577 603 -236 -28.1%
3312 Steel products from purchased steel 716 698 699 724 645 660 691 723 657 663 667 -49 -6.8%
33121 Iron & steel pipes & tubes 229 240 264 242 201 230 250 262 232 241 247 18 7.9%
33122 Rolling & drawing 487 458 435 482 444 430 441 461 425 422 420 -67 -13.8%
331221 Rolled steel shapes 189 170 183 212 168 161 177 167 161 174 176 -13 -6.9%
331222 Steel wire drawing 298 288 252 270 276 269 264 294 264 248 244 -54 -18.1%
33151 Ferrous metal foundries 913 881 835 808 793 785 761 743 724 714 709 -204 -22.3%
331511 Iron foundries 572 527 496 456 443 434 426 407 398 393 387 -185 -32.3%
331512 Steel investment foundries 128 132 128 132 131 131 128 128 119 118 118 -10 -7.8%
331513 Steel foundries (exc. investment) 213 222 211 220 219 220 207 208 207 203 204 -9 -4.2%
Note: Exc. - Except.
Source: U.S. Bureau of the Census (2007b-2017b).
Prepared by: Office of Research, Ohio Development Services Agency. Telephone 800/848-1300, or 614/466-2116 (DL, 10/17).
62
Changes:
2005-2015

Table A11: Detailed Iron and Steel Industry Employment Trends in Ohio and the U.S., 2005-15
NAICS
Code Shorter Industry Title 2005 2006 2007 2008 2009 2010 2011 2012 2013 2014 2015 Number Percent
Ohio:
11-92 Total (in thousands) 4,762.6 4,825.5 4,782.1 4,728.4 4,460.6 4,352.5 4,432.8 4,548.1 4,587.1 4,636.8 4,720.0 -42.6 -0.9%
31-33 Manufacturing (in thousands) 792.8 787.9 761.2 742.8 638.5 599.1 614.0 630.5 632.7 643.0 663.9 -128.9 -16.3%
3311-2, 51 Iron & steel industry 34,013 32,788 29,121 30,715 25,183 23,295 24,277 25,630 24,542 24,763 25,821 -8,192 -24.1%
3311 Iron & steel mills & ferroalloys 17,072 16,461 14,186 17,347 13,587 12,757 13,547 13,542 11,887 11,912 13,113 -3,959 -23.2%
3312 Steel products from purchased steel 6,600 6,415 5,993 4,364 4,163 3,870 4,333 5,462 5,616 5,818 5,441 -1,159 -17.6%
33121 Iron & steel pipes & tubes 3,231 3,183 2,815 2,067 2,031 1,799 2,033 3,495 3,446 3,480 3,564 333 10.3%
33122 Rolling & drawing 3,369 3,232 3,178 2,297 2,132 2,071 2,300 1,967 2,170 2,338 1,877 -1,492 -44.3%
331221 Rolled steel shapes 2,903 2,791 2,685 1,488 1,427 1,325 1,493 1,078 1,285 1,447 932 -1,971 -67.9%
331222 Steel wire drawing 466 441 493 809 705 746 807 889 885 891 945 479 102.8%
33151 Ferrous metal foundries 10,341 9,912 8,942 9,004 7,433 6,668 6,397 6,626 7,039 7,033 7,267 -3,074 -29.7%
331511 Iron foundries 7,827 7,675 6,531 5,330 4,117 3,958 3,706 3,775 3,932 3,674 3,816 -4,011 -51.2%
331512 Steel investment foundries 1,735 1,429 1,472 2,671 2,302 1,731 1,832 1,740 1,401 1,643 1,741 6 0.3%
331513 Steel foundries (exc. investment) 779 808 939 1,003 1,014 979 859 1,111 1,706 1,716 1,710 931 119.5%
U.S.:
11-92 Total (in thousands) 116,317.0 119,917.2 120,604.3 120,903.6 114,509.6 111,970.1 113,426.0 115,938.5 118,266.3 121,079.9 124,085.9 7,768.9 6.7%
31-33 Manufacturing (in thousands) 13,667.3 13,631.7 13,320.2 13,096.2 11,633.0 10,862.8 10,984.4 11,192.0 11,276.4 11,424.3 11,605.5 -2,061.8 -15.1%
3311-2, 51 Iron & steel industry 249,853 251,219 244,443 237,244 213,003 198,021 210,486 224,690 220,349 217,787 219,322 -30,531 -12.2%
3311 Iron & steel mills & ferroalloys 109,957 110,790 109,998 109,584 102,212 95,655 100,940 105,309 102,778 101,291 103,853 -6,104 -5.6%
3312 Steel products from purchased steel 46,193 47,069 44,492 43,378 39,868 38,825 41,090 47,669 48,221 48,844 48,684 2,491 5.4%
33121 Iron & steel pipes & tubes 20,571 21,543 21,439 18,275 16,753 16,145 17,411 25,592 26,089 26,360 25,080 4,509 21.9%
33122 Rolling & drawing 25,622 25,526 23,053 25,103 23,115 22,680 23,679 22,077 22,132 22,484 23,604 -2,018 -7.9%
331221 Rolled steel shapes 10,322 10,857 9,632 10,458 9,200 9,971 10,457 7,836 7,559 7,783 8,501 -1,821 -17.6%
331222 Steel wire drawing 15,300 14,669 13,421 14,645 13,915 12,709 13,222 14,241 14,573 14,701 15,103 -197 -1.3%
33151 Ferrous metal foundries 93,703 93,360 89,953 84,282 70,923 63,541 68,456 71,712 69,350 67,652 66,785 -26,918 -28.7%
331511 Iron foundries 60,892 59,209 55,075 49,276 39,676 36,193 37,872 38,286 37,763 37,159 36,467 -24,425 -40.1%
331512 Steel investment foundries 15,847 16,429 16,777 17,786 15,495 13,474 14,612 15,190 14,118 13,745 14,206 -1,641 -10.4%
331513 Steel foundries (exc. investment) 16,964 17,722 18,101 17,220 15,752 13,874 15,972 18,236 17,469 16,748 16,112 -852 -5.0%
Note: Exc. - Except.
Source: U.S. Bureau of the Census (2007b-2017b).
Prepared by: Office of Research, Ohio Development Services Agency. Telephone 800/848-1300, or 614/466-2116 (DL, 10/17).
Changes:
2005-2015
63

Table A12: Trends in Exports from Ohio, 2006-2016*
`06-`16
Industry 2006 2007 2008 2009 2010 2011 2012 2013 2014 2015 2016 Averages
In millions of current dollars:
331(p) - Iron, steel, ferroalloys & products $1,164 $1,378 $1,633 $977 $1,352 $1,556 $1,646 $1,400 $1,667 $1,536 $1,389
3311: Iron & steel mills & ferroalloys $1,110 $1,317 $1,568 $934 $1,292 $1,479 $1,570 $1,332 $1,593 $1,465 $1,337
3312: Steel products from purchased steel $54 $61 $65 $43 $59 $77 $76 $68 $74 $72 $52
Iron, steel, ferroalloys & products to:
Canada $847 $926 $1,047 $639 $910 $995 $1,059 $892 $1,044 $938 $889 67.9%
Mexico $100 $136 $166 $105 $158 $204 $228 $219 $272 $280 $247 14.1%
150 other countries $163 $254 $355 $191 $224 $281 $284 $221 $278 $247 $201 18.0%
For constant dollars, standardized on 2009:
Producer Price Index for 3311: 150.7 160.8 188.4 137.9 163.3 183.6 175.3 164.8 170.7 148.4 139.0
Producer Price Index for 3312: 148.2 151.1 188.8 156.7 168.9 189.3 187.0 178.3 179.2 164.0 160.0
331(p) - Iron, steel, ferroalloys & products $1,073 $1,193 $1,202 $977 $1,147 $1,175 $1,299 $1,174 $1,352 $1,429 $1,377 $1,218
3311: Iron & steel mills & ferroalloys $1,015 $1,129 $1,148 $934 $1,092 $1,111 $1,236 $1,115 $1,288 $1,361 $1,326 $1,159
3312: Steel products from purchased steel $57 $63 $54 $43 $55 $64 $64 $59 $65 $68 $51 $58
Note: * - dollar figures in this table are not comparable with the value-added figures in table A8.
Sources: U.S. Bureau of Labor Statistics (2017), U.S. International Trade Administration (2017).
Prepared by: Office of Research, Ohio Development Services Agency. Telephone 614/466-2116 (DL, 11/17).
Year
64

Table A13: U.S. Imports and Exports of Steel Mill Products (Millions of Metric Tons) and Derived Statistics, 1995-2016
1995 1996 1997 1998 1999 2000 2001 2002 2003 2004 2005
Steel Mill Products Shipments 88.4 91.5 96.0 92.9 96.3 99.0 89.7 90.7 96.1 101.0 95.2
Exports of Steel Mill Products 6.4 4.6 5.5 5.0 4.9 5.9 5.6 5.4 2.5 7.2 8.5
Exports as a Percentage of 7.2% 5.0% 5.7% 5.4% 5.1% 6.0% 6.2% 6.0% 2.6% 7.1% 8.9%
Steel Mill Product Shipments
Imports of Steel Mill Products 22.1 26.5 28.3 37.7 32.4 34.4 27.3 29.6 21.0 32.5 29.1
Apparent Steel Consumption1
108.0 108.0 114.0 118.0 116.0 120.0 107.0 107.0 107.0 117.0 113.0
Gross Import Reliance as Percentage 20% 25% 25% 32% 28% 29% 26% 28% 20% 28% 26%
of Apparent Consumption2
Net Import Reliance as a Percentage 21% 15% 15% 22% 17% 18% 16% 15% 10% 14% 15%
of Apparent Consumption3
Index Value of the Dollar 92.5 97.4 104.4 116.5 116.9 119.5 125.9 126.7 119.1 113.6 110.7
2006 2007 2008 2009 2010 2011 2012 2013 2014 2015 2016*
Steel Mill Products Shipments 99.3 96.5 89.4 56.4 75.7 83.3 87.0 86.6 89.1 78.5 78.0
Exports of Steel Mill Products 8.8 10.1 12.2 8.4 11.0 12.2 12.5 11.5 10.9 9.0 9.0
Exports as a Percentage of 8.9% 10.5% 13.6% 14.9% 14.5% 14.6% 14.4% 13.3% 12.2% 11.5% 11.5%
Steel Mill Product Shipments
Imports of Steel Mill Products 41.1 30.2 29.0 14.7 21.7 25.9 30.4 29.2 40.2 35.2 30.0
Apparent Steel Consumption1
120.0 114.0 102.0 63.0 80.0 90.0 98.0 98.0 107.0 99.0 94.0
Gross Import Reliance as Percentage 34% 26% 28% 23% 27% 29% 31% 30% 38% 36% 32%
of Apparent Consumption2
Net Import Reliance as a Percentage 17% 16% 13% 11% 6% 7% 11% 12% 30% 22% 16%
of Apparent Consumption3
Index Value of the Dollar 108.5 103.4 99.9 105.7 101.8 97.2 99.8 101.0 104.1 117.2 122.7
Notes : * - preliminary, earlier years are revised; 1 - Apparent Steel Consumption - given by the U.S. Geological Survey; it adds
imports to Steel Mill Product Shipments, subtracts Exports, and makes adjustments for industry stock changes, imports of semi-
finished products, etc.; 2 - Imports divided by Apparent Consumption; 3 - given by the U.S. Geological Survey. Sources : U.S.
Geological Survey (1996-2017), Federal Reserve Board (2017). Prepared by : Office of Research, Ohio Development Ser-
vices Agency. Telephone 614/466-2116 (DL, 11/17).
65

Table A14: Projections for Iron and Steel Industry Group Changes in Ohio and the U.S., 2014-2024*
Forecast
Annual
NAICS Growth in Actual Projected
Code Shorter Industry Title Output^ 2014 2024 Number Percent
Ohio Total n.a. 5,644,600 5,944,800 300,200 5.3%
31-33 Manufacturing n.a. 674,260 646,050 -28,210 -4.2%
331(p) Iron, steel, ferroalloys & products n.a. 16,310 16,570 260 1.6%
3311 Iron & steel mills & ferrroalloys n.a. 8,940 8,870 -70 -0.8%
3312 Steel products from purchased steel n.a. 7,370 7,700 330 4.5%
U.S. Total 2.2% 150,539,900 160,328,800 9,788,900 6.5%
31-33 Manufacturing 1.9% 12,188,300 11,374,200 -814,100 -6.7%
331(p) Iron, steel, ferroalloys & products n.a. 151,600 150,300 -1,300 -0.9%
3311 Iron & steel mills & ferrroalloys 0.6% 91,400 88,000 -3,400 -3.7%
3312 Steel products from purchased steel 0.8% 60,200 62,300 2,100 3.5%
Notes: * - Projections have not been made for ferrous metal foundries (NAICS 33151) or the industry as a whole.
^ - Gross Duplicate Output, which includes the values of intermediate goods and services as well as the final values
characteristic of the Gross Domestic Product.
n.a. - not available.
Sources: U.S. BLS (2015), ODJFS-LMI (2016).
Prepared by: Office of Research, Ohio Development Services Agency. Telephone 614/466-2116 (DL, 10/17).
66
Jobs
Changes: 2014-2024

Industry Definition and Examples of Products
The nation’s industry statistics have been collected under the North American Industry Classification System (NAICS) starting in 1997 (Office of Management and Budget, 1998). Establishments producing goods or services sufficiently alike are classified in the same industry, and assigned a six-digit code number. Closely related industries form an industry group. The first four digits of the industry code indicate the group to which the industries belong. (A five-digit code de-fines a subgroup when it subsumes more than one six-digit code; otherwise, it defines an industry.) In this report the iron and steel industry is defined as the combination of two groups and a subgroup: iron and steel mill and ferroalloy manufac-turing (NAICS 3311), steel product manufacturing from purchased steel (3312), and ferrous metal foundries (33151). Mostly minor changes have been made to the system with each subsequent economic census. The changes had no im-pact on the industry definition until 2012, when iron and steel vs. ferroalloy production – heretofore two industries – were combined into 331110. The current definitions and examples of specific industry products follow. 3311 Iron & Steel Mills & Ferroalloys. 33111 Iron & Steel Mills & Ferroalloys. 331110 Iron & Steel Mills & Ferroalloys. Activities include the direct reduction of iron ore, producing pig iron, con-
verting pig iron into steel and/or producing elements (ferroalloys) that may be added to molten steel to alter or improve the resulting metal’s characteristics. Common ferroalloys include chromium, manganese, molyb-denum, nickel, niobium, silicon, titanium, tungsten and vanadium. (See alloy steels in the glossary for fur-ther discussion.) Steel products such as bars, pipes, plates, rods, sheets, strips, tubes and wire are includ-ed in this industry if they are made where the metal is produced. Likewise, coke ovens may be included if they are integrated with the establishment; otherwise, they are classified elsewhere. Non-ferrous alloy man-ufacturing is classified elsewhere.
3312 Steel Products from Purchased Steel. Products in this group are not made at establishments where the raw iron or steel is produced.
33121 Iron & Steel Pipes & Tubes from Purchased Steel. Examples include welded, riveted, and seamless pipes and tubes of many sizes and for many purposes and products.
33122 Rolling & Drawing Purchased Steel. 331221 Rolled Steel Shapes. Activities include rolling and drawing shapes such as plates, sheets, strips, rods and
bars from purchased steel. 331222 Steel Wire Drawing. Establishments in this industry draw wire from purchased steel. Products include non-
insulated wires and ropes, fencing, nails, spikes, staples, tacks and woven steel wire cloth – galvanized or not – if made where the wire is produced; also included are powders, paste and flakes (Yucel, 2015). Similar products made from purchased wire are classified as fabricated metal products (332).
67

33151 Ferrous Metal Foundries. Establishments in this sub-group purchase and reheat iron or steel, pouring the molten metal into molds of a desired shape to make castings. The casting is removed once the metal has solidified. They may also perform further operations such as cleaning and deburring, but activities such as threading or machining that transform castings into more-finished products may lead to classification outside of the industry. Foundry operations at the same establishment where the raw iron or steel is produced are classified in 331110. Ferrous castings are used in “virtually all industrial and manufacturing applications” (Goddard, 2015: 14). There are differences between iron and steel castings beyond the defining carbon content (see the Glos-sary.) Iron products have a lower melting temperature, and shrink less while solidifying, consequently allow-ing them to be cast into more complex shapes using less energy, less expensive and less specialized equip-ment. On the other hand, steel castings are easier to weld, and have greater strength, ductility, and wear, heat and corrosion resistance, due in part to their incorporation of alloys (again, see the Glossary). Steel castings are used in bridge and building supports, tools and dies, valves, pumps, compressors and other mechanical components for agricultural, power generation and transportation equipment and sporting goods (Goddard, 2015: 14-15). The choice between iron and steel turns on cost and required performance char-acteristics. As measured by volume, iron castings are the larger part of this subgroup (Goddard, 2015: 4).
331511 Iron Foundries. Establishments in this industry melt and pour the pig iron or iron alloys they purchased into molds. Analysts still distinguish between gray and ductile iron foundries. Gray iron has a high carbon con-tent; it is used in engine blocks, differential, power-transmission and pump-housings, fire hydrants, lamp-posts, manhole covers, skillets, storm grates and drains, etc., because it can be cast into complex shapes at low cost, withstands high temperatures and pressures, and resists corrosion and wear. However, it is brittle when compared with other iron and steel products. Ductile iron can be stretched, drawn and hammered be-cause its higher magnesium content gives it greater tensile strength; it is used for cam- and crankshafts, pipes, tubes and associated fittings (Goddard, 2015: 13-15).
331512 Steel Investment Foundries. Investment foundries create seamless molds by covering a wax shape with refractory slurry. The wax is melted and drained after the slurry hardens. Highly detailed and consistent castings may be made from such molds. Investment foundry products are used in sporting goods, industrial valves, small arms, turbines and transportation equipment (Goddard, 2015: 14) – the production or assem-bly of which are classified in other industries.
331513 Steel Foundries (exc. Investment). The difference between investment and non-investment casting is the former destroys the mold used in the casting process and the latter re-uses the mold (Goddard, 2015: 14). Consequently, non-investment castings generally are less expensive than investment castings.
68
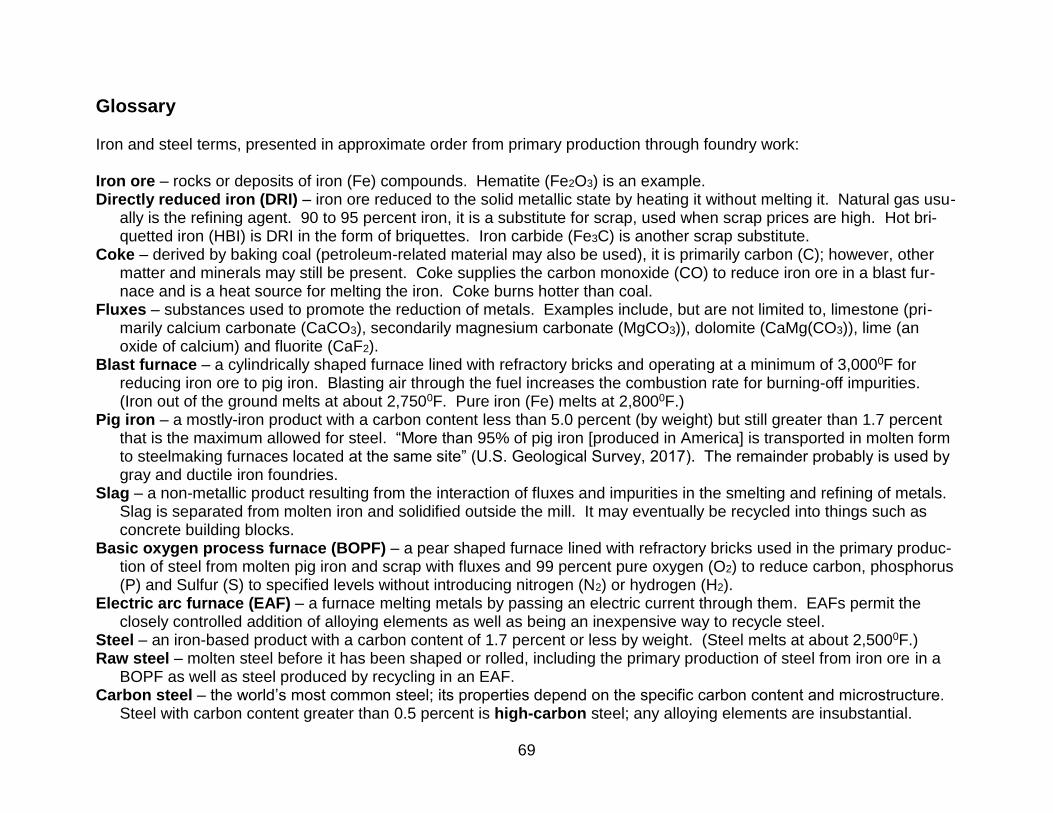
Glossary
Iron and steel terms, presented in approximate order from primary production through foundry work: Iron ore – rocks or deposits of iron (Fe) compounds. Hematite (Fe2O3) is an example. Directly reduced iron (DRI) – iron ore reduced to the solid metallic state by heating it without melting it. Natural gas usu-
ally is the refining agent. 90 to 95 percent iron, it is a substitute for scrap, used when scrap prices are high. Hot bri-quetted iron (HBI) is DRI in the form of briquettes. Iron carbide (Fe3C) is another scrap substitute.
Coke – derived by baking coal (petroleum-related material may also be used), it is primarily carbon (C); however, other matter and minerals may still be present. Coke supplies the carbon monoxide (CO) to reduce iron ore in a blast fur-nace and is a heat source for melting the iron. Coke burns hotter than coal.
Fluxes – substances used to promote the reduction of metals. Examples include, but are not limited to, limestone (pri-marily calcium carbonate (CaCO3), secondarily magnesium carbonate (MgCO3)), dolomite (CaMg(CO3)), lime (an oxide of calcium) and fluorite (CaF2).
Blast furnace – a cylindrically shaped furnace lined with refractory bricks and operating at a minimum of 3,0000F for reducing iron ore to pig iron. Blasting air through the fuel increases the combustion rate for burning-off impurities. (Iron out of the ground melts at about 2,7500F. Pure iron (Fe) melts at 2,8000F.)
Pig iron – a mostly-iron product with a carbon content less than 5.0 percent (by weight) but still greater than 1.7 percent that is the maximum allowed for steel. “More than 95% of pig iron [produced in America] is transported in molten form to steelmaking furnaces located at the same site” (U.S. Geological Survey, 2017). The remainder probably is used by gray and ductile iron foundries.
Slag – a non-metallic product resulting from the interaction of fluxes and impurities in the smelting and refining of metals. Slag is separated from molten iron and solidified outside the mill. It may eventually be recycled into things such as concrete building blocks.
Basic oxygen process furnace (BOPF) – a pear shaped furnace lined with refractory bricks used in the primary produc-tion of steel from molten pig iron and scrap with fluxes and 99 percent pure oxygen (O2) to reduce carbon, phosphorus (P) and Sulfur (S) to specified levels without introducing nitrogen (N2) or hydrogen (H2).
Electric arc furnace (EAF) – a furnace melting metals by passing an electric current through them. EAFs permit the closely controlled addition of alloying elements as well as being an inexpensive way to recycle steel.
Steel – an iron-based product with a carbon content of 1.7 percent or less by weight. (Steel melts at about 2,5000F.) Raw steel – molten steel before it has been shaped or rolled, including the primary production of steel from iron ore in a
BOPF as well as steel produced by recycling in an EAF. Carbon steel – the world’s most common steel; its properties depend on the specific carbon content and microstructure.
Steel with carbon content greater than 0.5 percent is high-carbon steel; any alloying elements are insubstantial.
69

Alloy steels – steels with elements added to alter or improve their properties. Examples include chromium (Cr – at least 10 percent) and nickel (Ni) to produce stainless steel (which resists corrosion), and silicon (Si) to reduce energy loss in electrical steel. Other notable elements used to various degrees in alloy steels are molybdenum (Mo), niobium (Nb), tungsten (W) and vanadium (V) for luster, strength, toughness, wear and/or corrosion resistance. Given the various combinations of elements and processing technologies, there are well over 400 different grades of iron and steel pro-ducts.
Continuous casting – pouring molten metal from a ladle through a water-cooled mold for solidification into a specific shape. The process bypasses ingot teeming, stripping, soaking and some preliminary rolling steps thereby saving time, energy and money.
Net or short ton – 2,000 pounds; a long ton is a metric ton (1,000 kg.), or about 2,204.6 pounds. Semi-finished steel – the unrolled basic shapes of billets, blooms and slabs. Billet – a square or rectangular shape. Bloom – a square or rectangular shape larger than a billet.
Slab – usually 8-to-10 inches thick, and wider than a bloom. Refinements to continuous casting permitted the direct production of intermediate (4-to-6 inches thick) and thin (1.5-to-2 inches thick) slabs, bypassing the need for re-ducing stands and thereby saving additional time, energy and money.
Rolling – reducing or changing the cross-sectional area of a work-piece by the compressive forces of rotating rolls. The process is like squeezing clothes through the wringers of an old fashion washing machine. Flat rolled – processed on rolls with smooth faces, as opposed to grooved or cut faces used for structural or shaped
products. Common products include sheets, strips and plates. Hot rolled – processed after it has been reheated to at least 1,7000F, but below the steel’s melting point, then rolled
into the desired shape – most often coils. Cold rolled – usually processed without first reheating the steel. However, some rolling may be done at higher tem-
peratures so long as the steel stays below recrystallization thresholds, which range from 750 to 12900F. Cold roll-ing produces a smooth surface and makes the piece easier to machine as well as improving strength, hardness and ductility.
Drawing – pulling steel through a series of plates or dies to produce bars and wires of various gauges. Finished steel products include, but are not limited to:
Structural shapes – one example is an I-beam rolled and shaped from a bloom. Sheets – flat rolled from slabs, wider than 12 inches; by volume, the single largest class of products of the industry. Strips – flat rolled from slabs, less than 12 inches wide, but with a more precise control of thickness. Plates – flat rolled from slabs, thicker and heavier than sheets; a high-volume class of products primarily used in the
construction and heavy machinery industries. Bars – a high-volume class of products shaped and rolled into various forms from billets. Bars also may be cold-
70

drawn to improve strength, then turned, ground and polished to improve surface finish and control size and shape to the requested tolerance level.
Wires – the smallest, thinnest products. Pipes and tubes – welded products are made by rolling a strip into a loop and welding the edges to seal the gap;
seamless products are made by forcing a heated rod or billet through piercers or dies. Seamless products better resist corrosion and pressure; welded products can be longer, cost less and have shorter production times.
Foundries – jobbing foundries usually are independent establishments producing a limited number of castings from cus-tom-made molds for their customers; captive foundries are part of vertically integrated companies making large num-bers of castings from a few molds to be used in the owner’s end products (e.g., motor vehicle engine blocks). They use iron and steels purchased from suppliers. Sand casting – this most common process uses sand as the mold material. Investment casting – uses the lost wax technique described in the Industry Definition section. Centrifugal casting – molten metal is forced into the mold by spinning in a centrifuge; it also may be used to make
pipes and tubes. Near net shape casting – casting metal in a thin and intricate-but-strong form that eliminates or reduces machining
requirements before use or installation of the product. Some iron and steel producers also engage in subsequent metal processing activities. These include: annealing – heat-ing and cooling steel to improve formability and surface durability; pickling – removing oxide or mill scale (which can form during hot rolling and annealing) from the surface by immersion in an acidic or alkaline solution in preparation for further processing; and galvanizing – coating steel with a layer of zinc (Z) for corrosion resistance; and slitting steel – cutting a sheet or strip of steel with rotary knives. These activities are part of the industry only when performed at establishments where the iron and steel industry products are made (NAICS 3311, 3312 and 331151); otherwise, they are fabricated metals products (332) or – in the case of slitting – a service provided by wholesalers (42351).
71

A Primer on Iron and Steel Production Processes
There are two basic types of steel mills: primary producers and minimills. Producing pig iron is the first step of the primary steel making process. Iron ore pellets, limestone and coke are loaded into a blast furnace. The heat melts the ore and the limestone. Two key chemical reactions occur: the carbon from the coke removes the oxygen from the ore, and the limestone removes some impurities. (The result of the latter reaction is called slag, and is removed from the blast fur-nace.25) In the second step, molten pig iron is transferred to a basic oxygen process furnace (BOPF) where contaminants such as phosphorus and sulfur are removed, and carbon, manganese and silicon are either removed or reduced to speci-fied levels. Ferrous scrap, directly reduced iron (DRI), and fluxes may be combined with molten pig iron in this step (Gni-dovec, 2003; Larkin, 1994, 1995, 2005; Miller, 1984). About 23 million metric tons of pig iron was produced in the U.S. in 2016, more than 95 percent of which was transferred in molten form to BOPFs at the same site (U.S. Geological Survey, 2017). Recent annual production capacities of almost all primary production mills ranged between two and five million net tons (AIM Market Research, 2013). By contrast, minimills neither produce pig iron nor use it as a raw material. They typically melt ferrous scrap with fluxes in electric arc furnaces (EAFs).26 The first EAFs had small capacities – hence the minimill moniker; now capacities range from 20,000 to 4.4 million net tons per year (AIM Market Research, 2013). EAFs dominate production for the slab and flat-rolled markets, but primary steelmaking still produces the highest quality steel. Both primary producers and minimills use EAFs to create alloy steels (Parker, 1984). Historically, primary producers located mills near their raw materials to minimize transportation costs, but minimills locate near their customers because ferrous scrap is ubiquitous (Larkin, 1994, 1995, 2007; Miller, 1984). The technology of iron and steel production has changed in additional ways over the decades. BOPFs completely re-placed the less efficient open-hearths for primary steel production by 1992 (American Iron and Steel Institute, 1974-2004), yet only 33 percent of the estimated 80 million metric tons of steel produced in the U.S. came from BOPFs in 2016; the other 67 percent came from EAFs (U.S. Geological Survey, 2017). Ingot teeming has almost disappeared as 99 percent of raw steel is continuously cast (U.S. Geological Survey, 2017), now yielding slabs, billets and blooms as little as 1.5 to 2.0 inches thick in a single step. Continuous casting not only created a better product but saved time, energy and money by eliminating breakdown mills and reducing stands (Larkin, 2007: 9-10). Rolling mill machinery is used to further work such semi-finished steel into finished products: slabs are processed into plates, sheets and strips; billets into bars, rods, and tube rounds; and blooms into structural shapes and rails (Larkin, 1994, 1995, 2007; Miller, 1984). Automation and improved techniques also have been applied to the production of pipes, tubes, wires and castings (Goddard, 2015; Leach, 2017; Yucel, 2017b).
72

NOTES: 1 GM has planned to phase-out iron engine block production at Defiance sometime in 2018 (Brooks, 2016). Manu-
facturing iron and steel products is not the principal business of General Motors, but its foundry and selected sites of other such companies are included because they have iron and steel industry establishments. Non-industry es-tablishments of companies whose principal business is iron and steel manufacturing also have been excluded. For example:
• AK Steel has a research and development facility (NAICS code 54171) in West Chester, and its AK Tube sub-sidiary in Walbridge is a tier-2 motor vehicle parts supplier (3363);
• ArcelorMittal makes tailored blanks for motor vehicles (33637) in Pioneer, coats steel (332812) in Obetz, and produces coke (324199) in Warren;
• Charter Steel has a fabricated metal products and distribution center (332 and 42351) in Fostoria;
• Nucor has a fabricated metals facility in Belpre and several sales offices elsewhere;
• TimkenSteel runs a scrap and salvage business based in Akron;
• U.S. Steel coats steel in Leipsic;
• Worthington Industries’ principal business is fabricated metal products. 2 Most data were compiled in 2013, the latest available. Warren Steel Holdings’ 441,000-ton capacity furnace was
operating at the time, but permanently closed in January 2016 (O’Brien, 2016), and is therefore excluded from the current list.
3 The 2012 data from Appendix Table A3 show the combined output of iron-steel-ferroalloys and steel-product-from-
purchased-steel amounts to 82.2 percent of the iron and steel industry total in Ohio. 4 VA and GDP are related measures. The BEA starts with the Census Bureau’s VA figures when estimating GDP for
manufacturing subsectors such as primary metals (NAICS 331) and subtracts additional costs such as purchased services in deriving the net contribution to GDP. VA data are available for iron and steel industries and groups, but GDP data are not. Consequently, VA is the best available measure for comparing the relative economic perfor-mance of industry groups and geographic areas on an annual basis. Specific data for subgroups – like ferrous foundries – and individual industries are found in the quinquennial Census of Manufactures.
5 Employment figures for all the counties should be regarded as estimates because the Census Bureau does not
disclose precise figures if doing so would violate the confidentiality of respondents. Instead, the Bureau provides a
73

range encompassing the jobs figure. Techniques thought to be fairly accurate on average can generate plausible estimates in these instances. Even when a specific figure is provided by the Bureau, a note describing an error term is often attached. Franklin County’s Columbus Castings, perhaps Ohio’s second-largest ferrous metals cast-ing plant in 2015, closed in 2016.
6 Appendix Table A1 lists a notable facility in Fulton County (North Star BlueScope in Delta), but the Census Bureau
(2015b) has nothing near the employment level shown in A1. Perhaps the Bureau classifies the establishment differently than this report, or perhaps employees of a temporary service agency (NAICS 56132) work there.
7 Older data in Appendix Table A9 show raw steel production volumes in Ohio during the 1970s surpassing 20 mil-
lion net tons in most years. 8 Adding to the cyclicality is the perception of price trends. Customers will buy more than they immediately need
when they believe prices will go even higher, but only buy what they absolutely need when they believe prices will go lower (Yucel, 2015: 16).
9 Primary producers have concentrated on making higher-value, coated flat-rolled sheet rather than commodity-
grade, hot-rolled sheet products. Higher-value goods are not only more profitable, they may be less price-sensi-tive, which helps cushion the impact of cyclical downturns. However, higher-value items also cost more to make, which still requires companies to control costs to make a profit (Larkin, 2013: H2).
10 Annual data for ferrous metal foundries sub-group (NAICS 33151) are not available. The current-dollar figures in
A8 for the two industry groups were adjusted for inflation by using the U.S. Bureau of Labor Statistics (BLS) (2017) producer price index values for the industry groups with both groups standardized on 2009.
11 Percentage changes often appear substantial if the numbers if the base year are small, which can be misleading in
the larger context. Furthermore, fluctuations in plant numbers – regardless of source – may be more than estab-lishments opening and closing. While some establishments may have gone out of business or been closed as part of a company consolidation, others may have been reclassified when production changed to make or emphasize a different product. Such production changes mean there is no way of knowing for sure exactly what has happened based on aggregate data alone.
12 Most of the statistics used in this report come from the Census Bureau or are derived from its data bases. The use
of one source takes advantage of an underlying consistency and uniformity of definitions and coverage across a
74

variety of subjects and geographic levels as well as providing a high degree of accuracy. However, BLS data have the advantage of timeliness even if its coverage differs in varying degrees from the Census Bureau’s. Statistics from the two Bureaus may also differ due to differences in how they classify the establishments as well as their collection methods.
13 Any ferrous metal foundry (NAICS 33151) export figures for Ohio from the U.S. International Trade Administration
are not readily available. 14 The index value of the dollar is an abstraction based on the exchange rates of the dollar vis-à-vis the currencies of
major U.S. trading partners. It may be a better predictor of U.S. export volumes than import volumes because most exports go to Canada and Mexico, two of our major trading partners, while most imports come from other nations who may not be major trading partners (see Hadid, 2017; Leach, 2017; Yucel, 2017a, 2017b) and whose specific exchange rates with the dollar may diverge from the index values.
15 It also is highly unlikely that any nation, including one as relatively open as America, will allow any foreign power to
flood its markets and threaten such a basic industrial capacity (Larkin, 2013: I10). 16 Just how large a role imports play in meeting domestic demand depends on how calculations are made. For ex-
ample, Hadid’s (2017) figures suggest import revenues are about 26 percent of domestic consumption, here de-fined as: = domestic revenues - export revenues + import revenues. Similarly, U.S. Geological Survey (USGS, 2017) figures show 30 million tons of “imports of steel mill products” amounted to 31.9 percent of 94 million tons of “apparent steel consumption” for 2016 – a gross indicator of import reliance. Yet the USGS states “net import reliance [emphasis added] as a percentage of apparent consumption” was 16 percent for 2016. “Apparent steel consumption” is defined as “steel shipments + imports – exports + adjustments for industry stock changes – semi-finished steel product imports,” a more complicated definition than the one above for domestic consumption. “Net import reliance” is defined as “imports – exports + adjustments for industry stock changes.” The USGS does not show all the numbers that go into calculating the final figures it presents; readers must take them as given.
17 The demand for food, oil and gas products and electric power may be constant, but demand for equipment used to
produce and provide such goods and services is not. 18 Other materials in this and other steel-consuming industries includes concrete and wood in construction, paper in
containers, fiberglass reinforced plastic pipes and magnesium in castings. The choice between iron-and-steel and alternative materials turns on the consideration of many factors: costs (of the material, the tooling, and the labor to
75
make the product), weight, aerodynamic qualities, production speed, surface finish and paint-ability, ease of recyc-ling, operating temperature, durability and corrosion resistance. Iron-and-steel goods have the advantages based on strength, durability (i.e., life expectancy), stability, versatility, ease of recycling, ability to operate in high temper-ature environments, surface finish and paint-ability, and sometimes cost. Market nuances can impact aggregate steel production. For example, consumers’ preferences shift to light trucks, which use more steel (Ford’s new F150 excepted) when fuel prices are low and away from light trucks when fuel prices are high. Steel can be made corro-sion resistant, but it becomes more expensive in the process (Larkin, 2005).
19 ArcelorMittal’s new alloy was so tough that the company had to install new rolling and shearing equipment to
handle it. 20 Larkin (2005) states that companies divesting their coke ovens did so because they were unwilling to make the
financial investments to meet the 1990 Clean Air Act Amendment requirements. Virtually all service and distribu-tion operations have been independent since 2003 – possibly earlier (Larkin, 2013: O4).
21 The rapid emergence of China as the world’s largest steelmaking country led to a long-term trend of substantially
higher prices for raw materials such as iron ores, coke, coal and ferrous scrap. These eased somewhat during the recent recession, rose with the recovery and increased demand for steel, but paused in 2012. The pause seemed due to slowing demand from the construction sector in China (which reflected a change in government policy). Price trends remain uncertain. On one hand, slower construction growth in China may reduce price pressure on raw materials. On the other hand, population growth and urbanization in Latin America and other Asian nations could increase price pressures (Larkin, 2013: I7).
22 Companies such as LTV and Wheeling-Pittsburgh Steel that had previously entered bankruptcy were not acquired
by other steel companies because they retained their liabilities for pension and health care benefits (Larkin, 2005). Surviving companies sought to reduce future pension costs by moving to defined-contribution plans and away from defined-benefit plans (Larkin, 2007: 12).
23 Mittal was required by the Justice Department to sell the Sparrows Point facility it had earlier acquired before final
approval of its merger with Arcelor (Matthews, 2007). 24 Neither the U.S. BLS nor ODJFS-LMI make projections for any five-digit sub-groups – such as ferrous metal foun-
dries (33151) – or six-digit industries.
76

25 Slag is mostly lime (CaO), silica, and alumina. While it is a byproduct of smelting and refining metals, it becomes an ingredient for other things – mostly road bases and concrete products for road surfaces. It also is spun into mineral wool for insulation, and used in sandblasting, railroad ballast, highway fill, and filters at sewage treatment plants (Gnidovec, 2003).
26 At least some EAF operators have tested DRI, iron carbide and hot briquetted iron as substitutes for expensive
scrap (Yucel, 2015). Slag also is produced in BOPFs and EAFs. Again, it is a byproduct of flux use (Gnidovec, 2003).
77

SOURCES AND REFERENCES CITED AIM Market Research, 2013
SteelPlant_N.America_AISI_ver_June252013.pdf. Pittsburgh, Pa.: the company. American Iron and Steel Institute (AISI), 1974, 1978, 1982, 1987, 1989, 1992, 1996, 1998, 2000, 2002, 2004, 2007 Annual Statistical Report. Washington, D.C.: the Institute. Various tables. Binsted, Tim, 2016
“Explosion rocks BlueScope’s North Star plant in Ohio, suffers $US5m damage,” May 9. Found at <http://www.smh.com.au/explosion-rocks-bluescope-north-star-plant-in-ohio... >.
Brooks, Robert, 2016 “GM to End Ductile Iron Production at Defiance,” November 25. Found at http://www.foundrymag.com/gm-end-ductile-iron-production-defiance.
Company Websites, 2015, 2017 Include, but are not limited to, AK Steel, Allegheny Ludlum, ArcelorMittal, Charter Manufacturing, Eramet, General Motors, Leggett & Platt, McWane, North Star BlueScope, Nucor, Osco Industries, Republic Steel, TimkenSteel, United States Steel, Vallourec Star, and Worthington Industries.
Corridore, Jim, 2014
“Heavy Equipment & Trucks,” Standard & Poor’s Industry Surveys (July). New York, NY: the McGraw-Hill Cos. Federal Reserve Board, 2017
Data found at <https://www.federalreserve.gov/releases/G5A/current/>. Fortune, 2017 See <http://www.fortune.com> for the U.S.-1,000 and Global-500>. Gearino, Dan, 2015
“Optimism reigns at Columbus Castings after recent industry turmoil,” July 12. Found at <http://www.dispatch.com/ content/stories/business/2015/07/12/… >.
78

Gnidovec, Dale, 2003 “Byproduct of ore-processing is valuable commodity itself,” the Columbus Dispatch, June 10, p. A7.
Goddard, Leah, 2015
“Ferrous Metal Foundry Products in the US,” IBIS World Industry Report 33151, April. Found at <http://www.ibisworld.com/>.
Google Earth, 2017
A software package. Hadid, Jonathon, 2017
“Iron & Steel Manufacturing in the US,” IBIS World Industry Report 33111, June. Found at <http://www.ibisworld.com/>.
Hannahs, Brandon, 2017
“Multimillion dollar expansion underway at McWane,” July 1. Found at <http://www.coshoctontribune.com/story/news/2017/07/01/multi-million-dollar-expansion-underway... >.
Hill, Edward W., et.al., 2012 “The State of Ohio’s Steel Industry” Urban Publications, Paper 118. Cleveland, Oh.: Cleveland State University. Hoover’s, 2017
Hoover’s (a D&B Co.) on-line database [machine-readable database] / prepared by the company. Austin, Tx.: the company [producer and distributor]. Includes what was known as the Harris Ohio Industrial Directory data.
Larkin, Leo J., 1994
“Steel and Heavy Machinery: Basic Analysis,” Standard & Poor’s Industry Surveys, January 6, pp. s28-s45. _______, 1995
“Steel and Heavy Machinery: Basic Analysis,” Standard & Poor’s Industry Surveys, February 16, Sec. 4, pp. s15-s31.
_______, 2005
“Metals: Industrial,” Standard & Poor’s Industry Surveys, January 20.
79

_______, 2007 “Metals: Industrial,” Standard & Poor’s Industry Surveys, July 12.
_______, 2013
“Metals: Industrial,” Standard & Poor’s Industry Surveys (March). New York: the McGraw-Hill Cos. PDF found at <http://www.netadvantage.standardandpoors.com/>.
Leach, Nathaniel, 2017 “Metal Pipe & Tube Manufacturing in the US,” IBIS World Industry Report 33121, July. Found at <http://www.ibisworld.com/>.
Levy, Efraim, 2014
“Autos & Auto Parts,” Standard & Poor’s Industry Surveys (July). New York, NY: the McGraw-Hill Cos.
Lexis-Nexis, 2017 Information found at <http://www.corporateaffiliations.com/>.
MacKinnon, Jim, 2015
“TimkenSteel’s latest job cuts to bring year’s total to 380,” October 30. Found at <http://www.ohio.com/business/ jim-mackinnon/... >.
Matthews, Robert G., 2007
“Mittal Sells Mill in U.S. as Part of Arcelor Deal,” the Wall Street Journal, August 3. Article found at <http://online.wsj.com/article_print/SB118610035418586814.html>.
McCafferty, Rachel, 2013
“So, what’s new at Timken? Try $265 million of investments in Canton,” May 16. Found at <http://www. crainscleveland.com/article/20150418/FREE/130419830/so… >.
_______, 2016
“Lorain’s steel industry is almost at a standstill,” April 24. Crain’s Cleveland Business. Miller, Jack R., 1984
“Steel Minimills,” Scientific American 250: 5 (May), pp. 32-39.
80

Miller, John W., 2012 “Indiana Steel Mill Revived With Lessons From Abroad,” the Wall Street Journal, May 21. Found at <http://online.wsj.com/article/>.
Nix, Katie, 2017
“Layoffs continue at U.S. Steel in Lorain; job losses estimated around 33,” December 8. Found at <http://www.chroniclet.com/Local-News/2016/12/08/Layoffs-continue-at-U-S-Steel-in-Lorain... >.
O’Brien, Dan, 2016
“’Unforeseen Conditions’ Closes Warren Steel Holdings,” (Youngstown) Business Journal, January 12. Office of Management and Budget, 1998
North American Industry Classification System. Lanham, Md.: Bernan Press. Office of Research, Ohio Development Services Agency (ODSA), 2016a
International Corporate Investments in Ohio Operations. Columbus, Oh.: ODSA. _______, 2014b-2017b
Ohio Private Investment Survey. Columbus, Oh.: ODSA. Ohio Dept. of Job and Family Services – Labor Market Information division (ODJFS-LMI), 2016
“Ohio Job Outlook,” found at <http://ohiolmi.com/proj/OhioJobOutlook.htm>. Parker, Sybil P. (Ed.), 1984
McGraw-Hill Dictionary of Scientific and Technical Terms (3rd ed.). New York: the company. Payerchin, Richard, 2017
“Republic Steel’s Lorain mill to produce pig iron,” July 25. Found at <http://www.morningjournal.com/article/MJ/20170725/NEWS/170129682>.
Plain Dealer, 2017 “Charter Steel to build new $150 million mill in Cuyahoga Heights,” February 1. Found at <http://www.cleveland.business/index.ssf/2017/01/charter_steel_to_build_new_150... >.
81

Schoenberger, Robert, 2013 “ArcelorMittal to upgrade portion of Flats steel plant; more high-strength steel planned,” the Cleveland Plain Dealer, April 16. Found at <http://www.cleveland.com/business/>.
Tribune-Chronicle, 2017
“Vallourec set to increase its workforce,” January 7. Found at <http://www.tribtoday.com/news/local-news/2017/01/vallourec-set-to-increase-its... >.
U.S. Bureau of the Census, 2007a-2017a
2005-2015 Annual Survey of Manufactures: Geographic Area Statistics, either in print or machine-readable format. Washington, D.C.: U.S. Government Printing Office. Also found at <http://www.census.gov>; look in the subject index and/or the data download pages.
_______, 2007b-2017b
County Business Patterns (Ohio & U.S.) 2005-2015, either in print or machine-readable format. Washington, D.C.: U.S. Government Printing Office. Also found at <http://www.census.gov>; look in the subject index and/or the data download pages.
_______, 2013c
2007 Census of Manufactures: Files EC0731 A1, I2 and I3. Files found at <http://factfinder2.census.gov/>.
_______, 2015c 2012 Census of Manufactures: Files EC1231 A1, I2 and I3. Files found at <http://www2.census.gov/>.
U.S. Bureau of Economic Analysis (BEA), 2017 See <http://www.bea.gov/>, and select “GDP by State and Metropolitan Area.”
U.S. Bureau of Labor Statistics (BLS), 2015
Data found at <http://www.bls.gov/emp/ep_table_207.htm>. _______, 2017
See <http://www.bls.gov/> for the quarterly census of employment and wages (QCEW) and the producer price indexes.
82

U.S. Geological Survey, 1996-2017 “Iron and Steel,” data found at <http://minerals.usgs.gov/minerals/pubs/commodity/iron_&_steel/index.html#mc5>.
U.S. International Trade Administration (ITA), 2017
See <http://tse.export.gov/tseoptions.aspx>. Wikipedia, 2017
Go to <https://en.wikipedia.org/wiki/Main_Page> and search for general information on iron, steel and associated production processes.
Williams, Joe, 2017
“OSHA cites SanCasT [sic] for violations,” January 18. Found at <http://www.coshoctontribune.com/story/news/2017/01/18/osha-cites-sancast-violations/96723404/... >.
Wire report, 2007
“Steelmaker planning to buy out co-owners of mine,” the Columbus Dispatch, September 6, p. C11. Yucel, Ibrahim, 2015
IBIS World Industry Reports 33111, 33121 & 33122, July, September & October. Found at <http://www.ibisworld.com/>.
_______, 2017a
“Ferrous Metal Foundry Products in the US,” IBIS World Industry Report 33151, April. Found at <http://www.ibisworld.com/>.
_______, 2017b
“Steel Rolling & Drawing in the US,” IBIS World Industry Report 33122, May. Found at <http://www.ibisworld.com/>.
83