advanced designs for fmri last update: january 18, 2012 last course: psychology 9223, w2010,...
TRANSCRIPT

Advanced Designsfor fMRI
http://www.fmri4newbies.com/
Last Update: January 18, 2012Last Course: Psychology 9223, W2010, University of Western Ontario
Jody CulhamBrain and Mind Institute
Department of PsychologyUniversity of Western Ontario


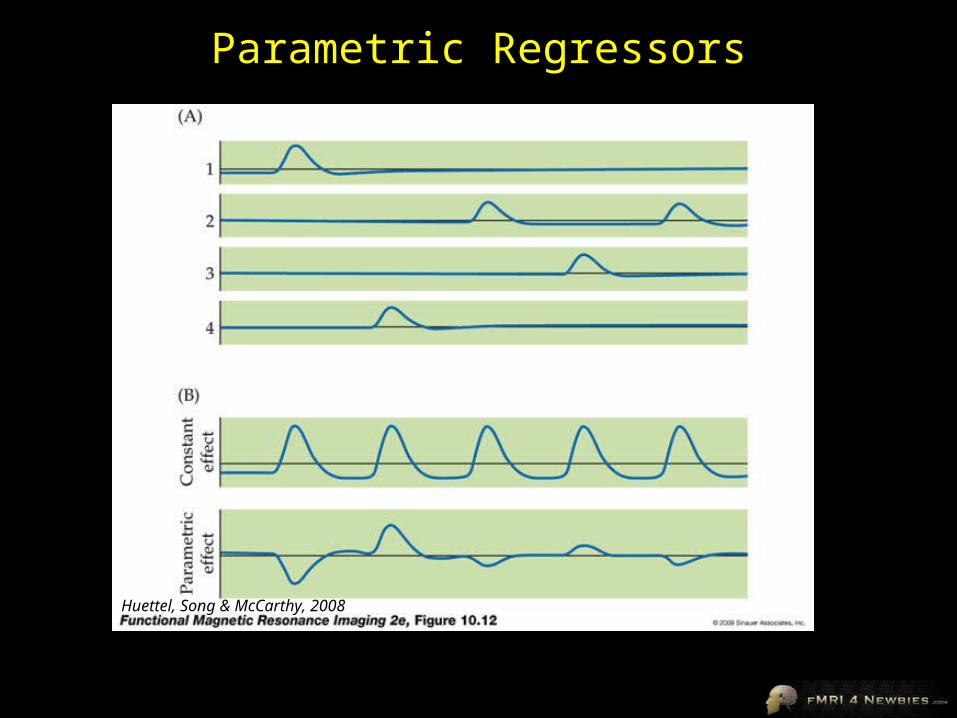
Why are parametric designs useful in fMRI?
• As we’ve seen, the assumption of pure insertion in subtraction logic is often false• (A + B) - (B) = A
• In parametric designs, the task stays the same while the amount of processing varies; thus, changes to the nature of the task are less of a problem • (A + A) - (A) = A• (A + A + A) - (A + A) = A

Parametric Designs in Cognitive Psychology
• introduced to psychology by Saul Sternberg (1969)
• asked subjects to memorize lists of different lengths; then asked subjects to tell him whether subsequent numbers belonged to the list
– Memorize these numbers: 7, 3
– Memorize these numbers: 7, 3, 1, 6
– Was this number on the list?: 3
• longer list lengths led to longer reaction times
• Sternberg concluded that subjects were searching serially through the list in memory to determine if target matched any of the memorized numbers
Saul Sternberg


Analysis of Parametric Designs
parametric variant: • passive viewing and tracking of 1, 2, 3, 4 or 5 balls
Culham, Cavanagh & Kanwisher, 2001, Neuron

Potential Problems
• Ceiling effects?– If you see saturation of the activation, how do you know
whether it’s due to saturation of neuronal activity or saturation of the BOLD response?
Perhaps the BOLD response cannot go any higher than this?
– Possible solution: show that under other circumstances with lower overall activation, the BOLD signal still saturates
Parametric variable
BOLDActivity


Factorial Designs• Example: Sugiura et al. (2005, JOCN) showed subjects pictures of objects and
places. The objects and places were either familiar (e.g., the subject’s office or the subject’s bag) or unfamiliar (e.g., a stranger’s office or a stranger’s bag)
• This is a “2 x 2 factorial design” (2 stimuli x 2 familiarity levels)

Factorial Designs• Main effects
– Difference between columns
– Difference between rows
• Interactions– Difference between columns depending on status of row (or vice versa)

Main Effect of Stimuli
• In LO, there is a greater activation to Objects than Places
• In the PPA, there is greater activation to Places than Objects

Main Effect of Familiarity
• In the precuneus, familiar objects generated more activation than unfamiliar objects

Interaction of Stimuli and Familiarity
• In the posterior cingulate, familiarity made a difference for places but not objects
Why do People like Factorial Designs?
• If you see a main effect in a factorial design, it is reassuring that the variable has an effect across multiple conditions
• Interactions can be enlightening and form the basis for many theories

Understanding Interactions
• Interactions are easiest to understand in line graphs -- When the lines are not parallel, that indicates an interaction is present
Unfamiliar Familiar
BrainActivation
Objects
Places

Combinations are Possible
• Hypothetical examples
Unfamiliar Familiar
BrainActivation
Objects
Places
Main effect of Stimuli+
Main Effect of Familiarity
No interaction (parallel lines)
Unfamiliar Familiar
Objects
Places
Main effect of Stimuli+
Main effect of Familiarity+
Interaction

Problems• Interactions can occur for many reasons that may or may not
have anything to do with your hypothesis• A voxelwise contrast can reveal a significant for many reasons• Consider the full pattern in choosing your contrasts and
understanding the implications
Unfamiliar Familiar
BrainActivation
(Baseline = 0)Objects
Places
Unfamiliar Familiar Unfamiliar Familiar
All these patterns show an interaction. Do they all support the theory that this brain area encodes familiar places?
Unfamiliar Familiar
0 0 0
0
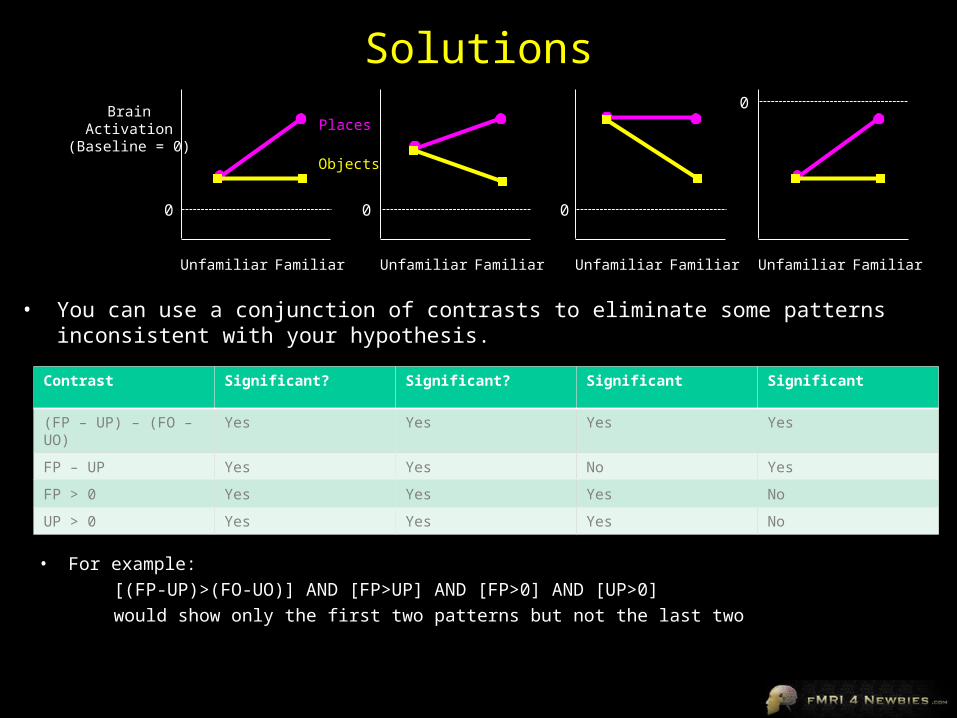
Solutions
• For example:
[(FP-UP)>(FO-UO)] AND [FP>UP] AND [FP>0] AND [UP>0]
would show only the first two patterns but not the last two
Contrast Significant? Significant? Significant Significant
(FP – UP) – (FO – UO) Yes Yes Yes Yes
FP – UP Yes Yes No Yes
FP > 0 Yes Yes Yes No
UP > 0 Yes Yes Yes No
Unfamiliar Familiar
BrainActivation
(Baseline = 0)Objects
Places
Unfamiliar Familiar Unfamiliar Familiar Unfamiliar Familiar
0 0 0
0
• You can use a conjunction of contrasts to eliminate some patterns inconsistent with your hypothesis.

Problems
• Interactions become hard to interpret – one recent psychology study suggests the human brain
cannot understand interactions that involve more than three factors
• The more conditions you have, the fewer trials per condition you have
Keep it simple!


Mental chronometry
• study of the timing of neural events• long history in psychology
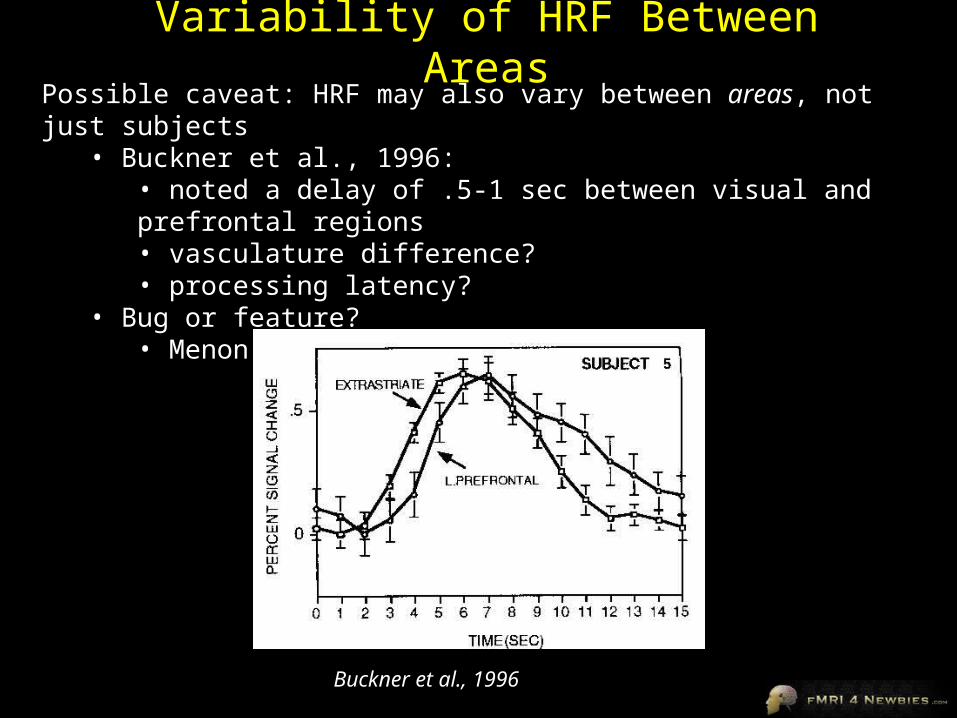
Variability of HRF Between AreasPossible caveat: HRF may also vary between areas, not just subjects
• Buckner et al., 1996: • noted a delay of .5-1 sec between visual and prefrontal regions• vasculature difference?• processing latency?
• Bug or feature? • Menon & Kim – mental chronometry
Buckner et al., 1996


Mental Chronometry
Data: Richter et al., 1997, NeuroReportFigures: Huettel, Song & McCarthy, 2004
Superior Parietal Cortex Superior Parietal Cortex

Mental Chronometry
Menon, Luknowsky & Gati, 1998, PNAS
Vary ISI
MeasureLatency
Diff

Challenges
• Works best with stimuli that have strong differences in timing (on the order of seconds)
• It can be really challenging to reliably quantify the latency in noisy signals

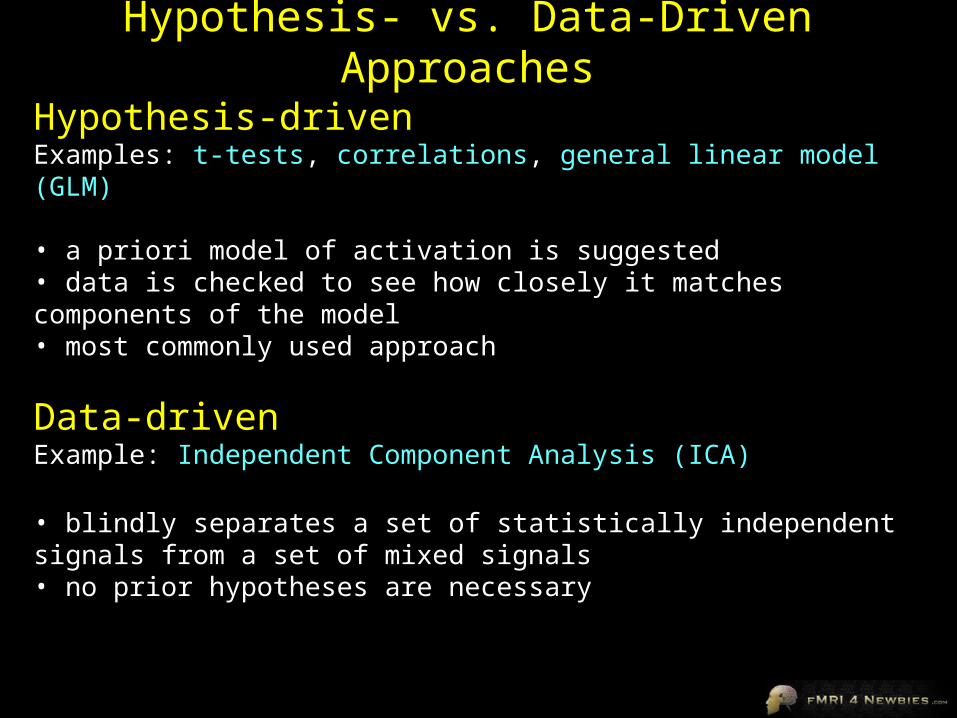
Hypothesis- vs. Data-Driven Approaches
Hypothesis-drivenExamples: t-tests, correlations, general linear model (GLM)
• a priori model of activation is suggested• data is checked to see how closely it matches components of the model• most commonly used approach
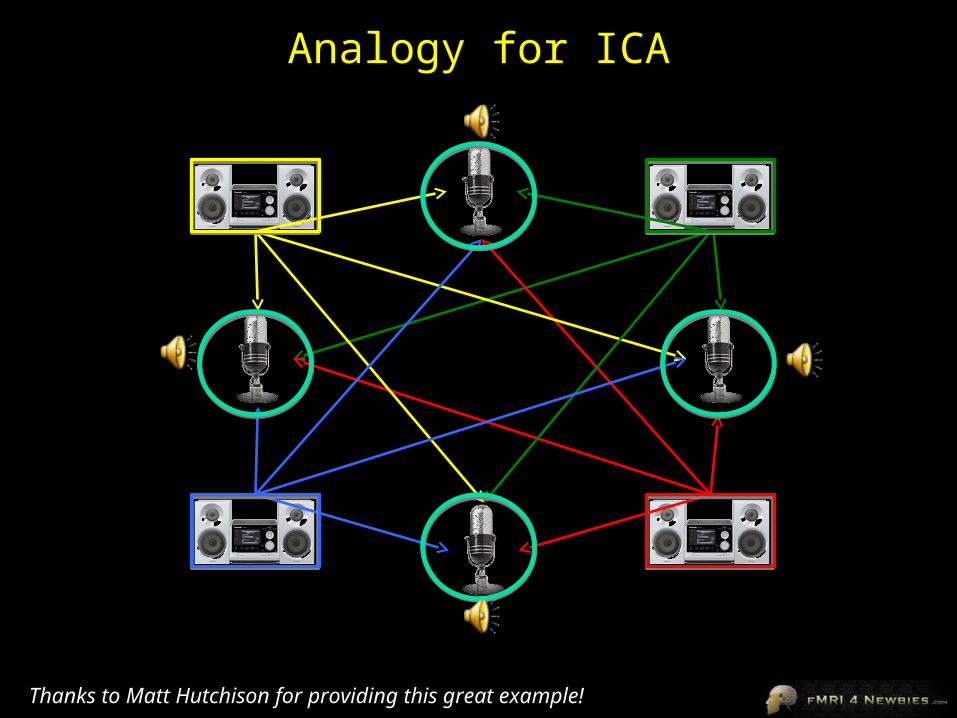
Data-drivenExample: Independent Component Analysis (ICA)
• blindly separates a set of statistically independent signals from a set of mixed signals• no prior hypotheses are necessary

s x ux = A.s
u = W.x
Thanks to Matt Hutchison for providing this great example!
Math Behind the Method

Time (s)Sig
nal ch
ange (
%)
Threshold = temporal correlation between each voxel and the associated component
Magnitude = Strength of relationship
1 7threshold
Applying ICA to fMRI data
Thanks to Matt Hutchison for providing this great example!


Components
• each component has a spatial and temporal profile
Huettel, Song & McCarthy, 2008

Uses of ICA
• see if ICA finds components that match your hypotheses– but then why not just use hypothesis-driven approach?
• use ICA to remove noise components• use ICA for exploratory analyses
– may be especially useful for situations where pattern is uncertain
• hallucinations, seizures
• use ICA to analyze resting state data – stay tuned till connectivity lecture for more info
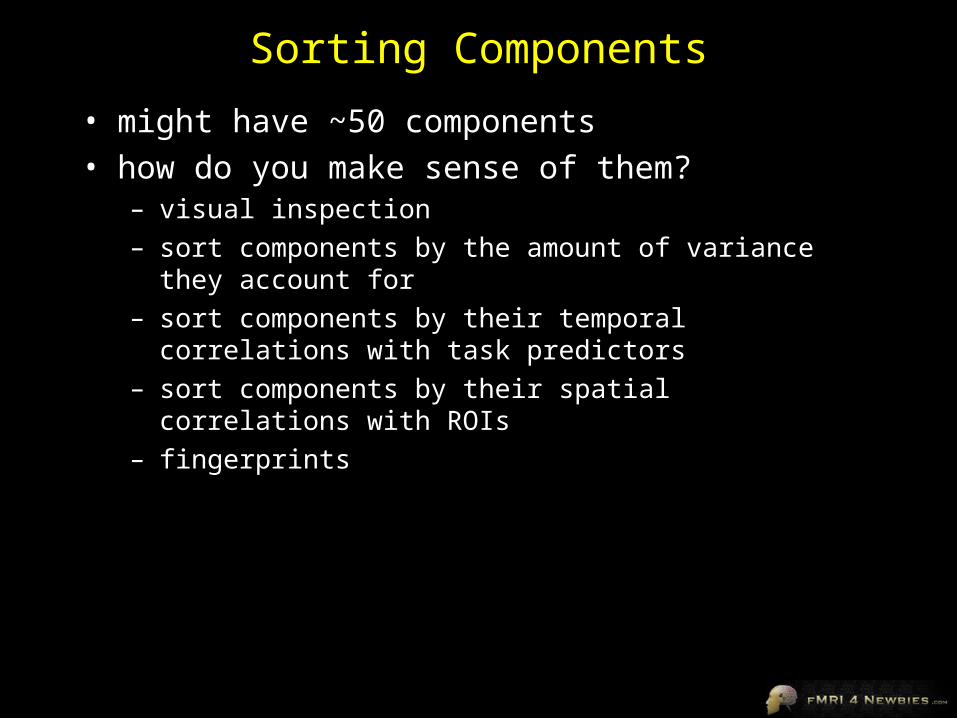
Sorting Components
• might have ~50 components• how do you make sense of them?
– visual inspection– sort components by the amount of variance they account for– sort components by their temporal correlations with task
predictors– sort components by their spatial correlations with ROIs– fingerprints

Brain Voyager Fingerprints
real activation should have power in medium temporal frequencies
real activation should be clustered
real activation should show temporal autocorrelation
A good BV fingerprint looks
like a slightly tilted Mercedes icon
• fingerprint = multidimensional polar plot characterization of the properties of an ICA component
DeMartino et al., 2007, NeuroImage

Expert Classification
susceptibilityartifacts
“activation” motionartifacts
vessels spatiallydistributed
noise
temporalhigh freq
noise
DeMartino et al., 2007, NeuroImage

Fingerprint Recognition• train algorithm to
characterize fingerprints on one data set; test algorithm on another data set
DeMartino et al., 2007, NeuroImage

Intersubject Correlations• Hasson et al. (2004, Science) showed subjects clips from a movie and found
voxels which showed significant time correlations between subjects

Reverse Correlation
• They went back to the movie clips to find the common feature that may have been driving the intersubject consistency
Hasson et al., 2004, Science

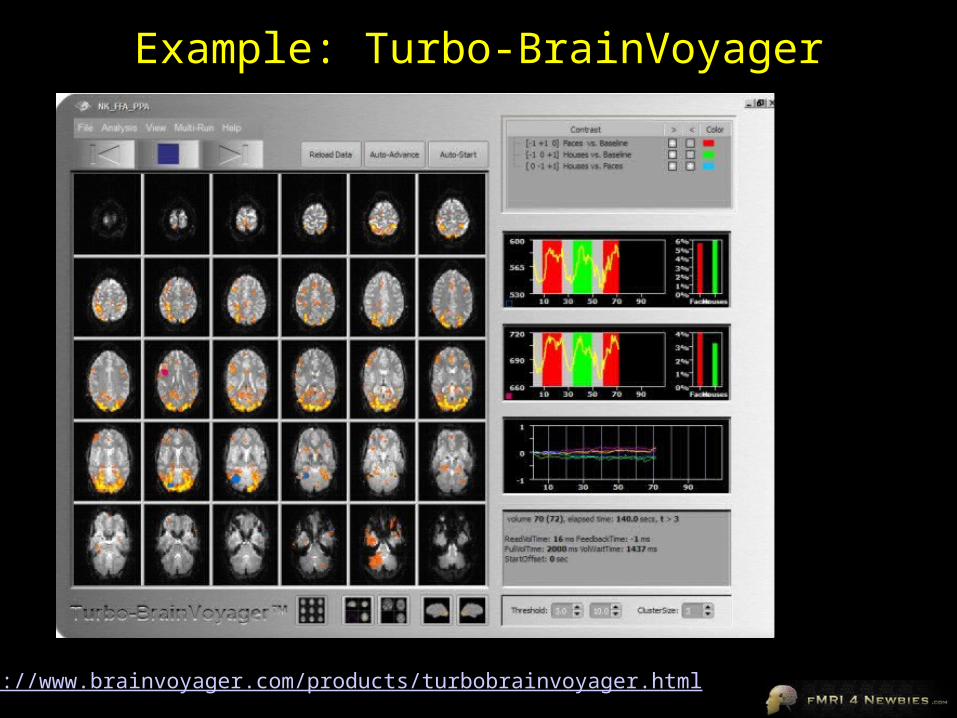
Example: Turbo-BrainVoyager
http://www.brainvoyager.com/products/turbobrainvoyager.html
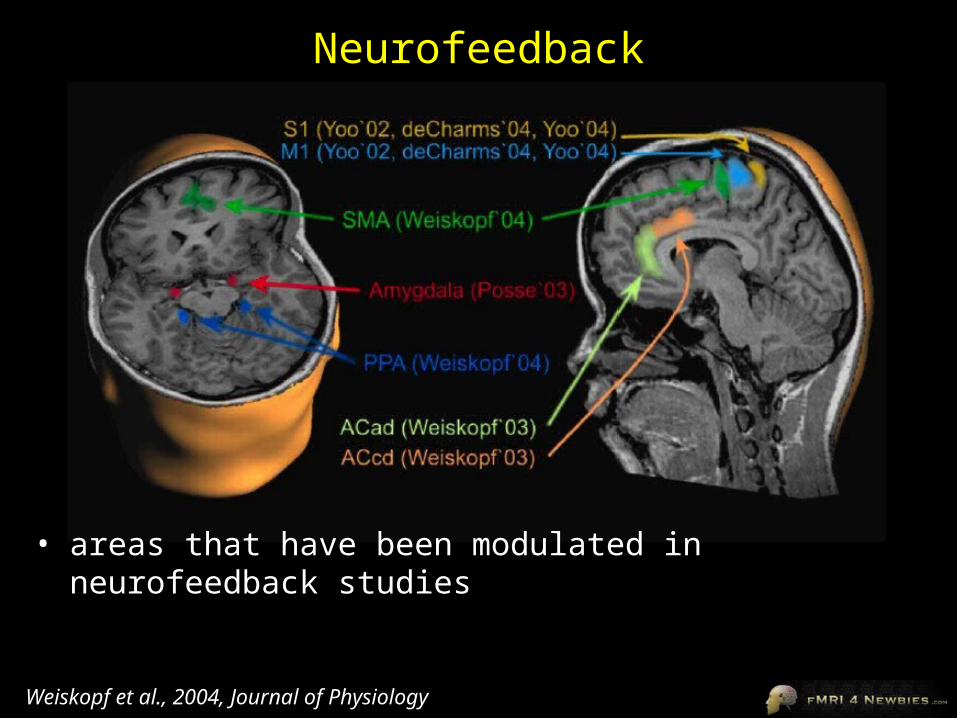
Neurofeedback
• areas that have been modulated in neurofeedback studies
Weiskopf et al., 2004, Journal of Physiology

Uses of Real-Time fMRI
• detect artifacts immediately and give subjects feedback• training for brain-computer interfaces• reduce symptoms
– e.g., pain perception
• neurocognitive training• ensuring functional localizers worked• studying social interactions


Monkey fMRI
• compare physiology to neuroimaging (e.g., Logothetis et al., 2001)• enables interspecies comparisons
– missing link between monkey neurophysiology and human neuroimaging
– species differs but technique constant

Monkey fMRI
• can tell neurophysiologists where to stick electrodes
2006 Science
Limitations of Monkey fMRI
• concerns about anesthesia • awake monkeys move• monkeys require extensive training• concerns about interspecies contamination• “art of the barely possible” squared?