advance session equity management can oklahoma cooperatives afford to pay dividends on invested...
TRANSCRIPT
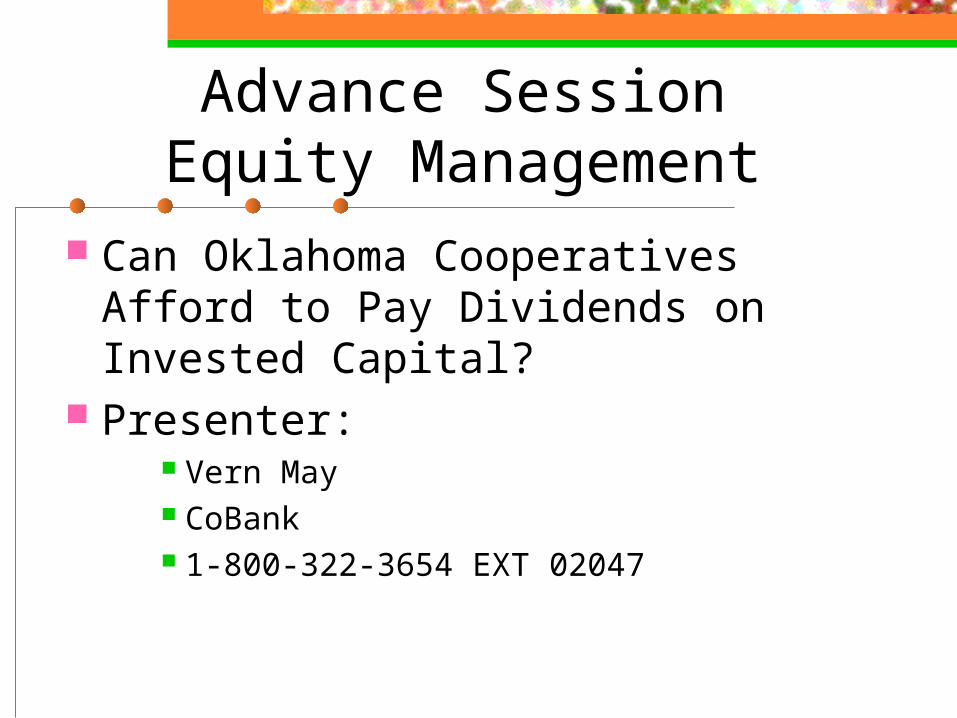
Advance SessionEquity Management
Can Oklahoma Cooperatives Afford to Pay Dividends on Invested Capital?
Presenter: Vern May CoBank 1-800-322-3654 EXT 02047
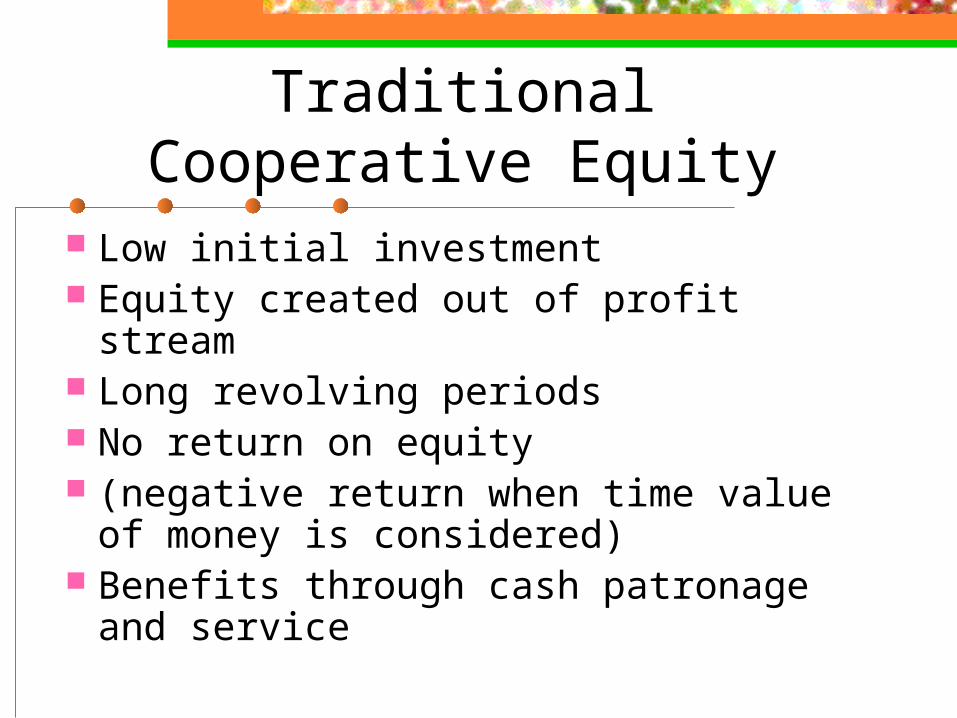
Traditional Cooperative Equity
Low initial investment Equity created out of profit stream Long revolving periods No return on equity (negative return when time value
of money is considered) Benefits through cash patronage
and service
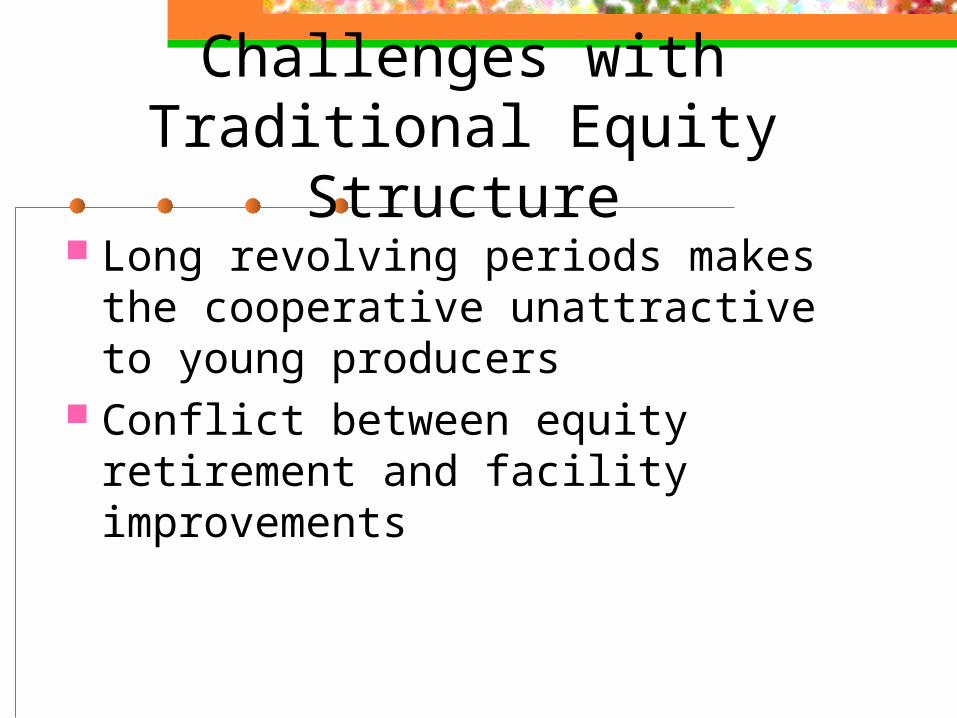
Challenges with Traditional Equity
Structure Long revolving periods makes the
cooperative unattractive to young producers
Conflict between equity retirement and facility improvements
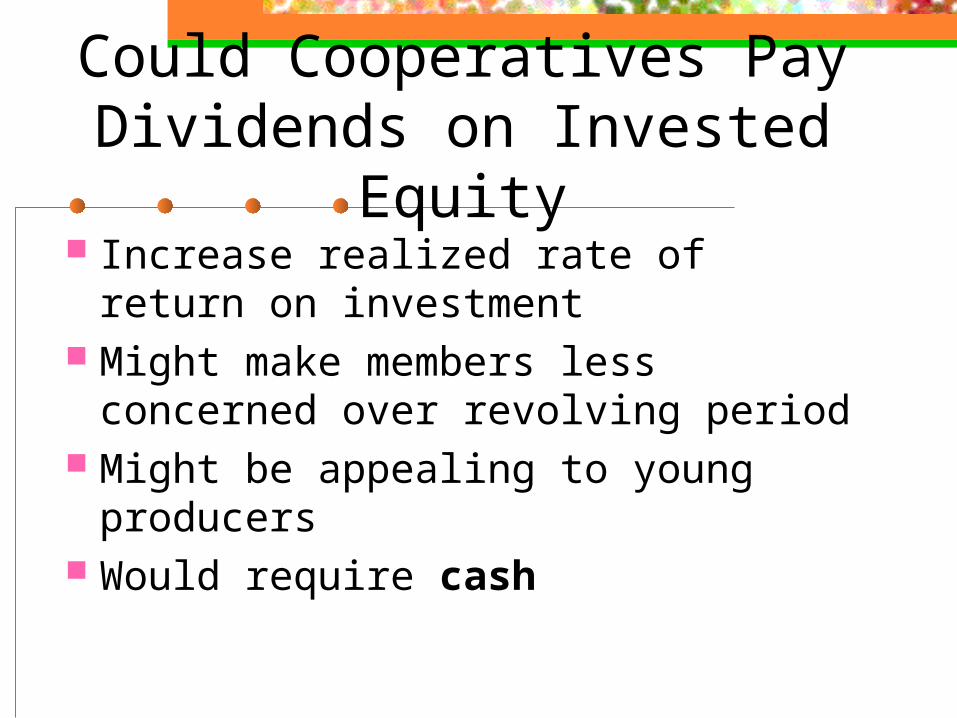
Could Cooperatives Pay Dividends on Invested
Equity Increase realized rate of return on
investment Might make members less
concerned over revolving period Might be appealing to young
producers Would require cash
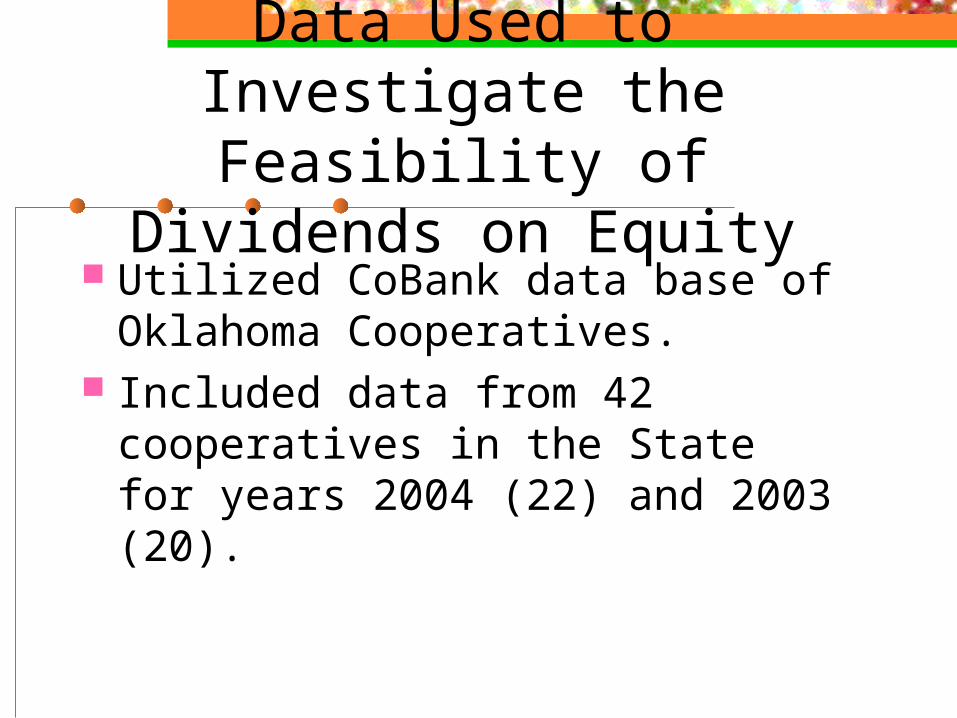
Data Used to Investigate the Feasibility of
Dividends on Equity Utilized CoBank data base of
Oklahoma Cooperatives. Included data from 42
cooperatives in the State for years 2004 (22) and 2003 (20).
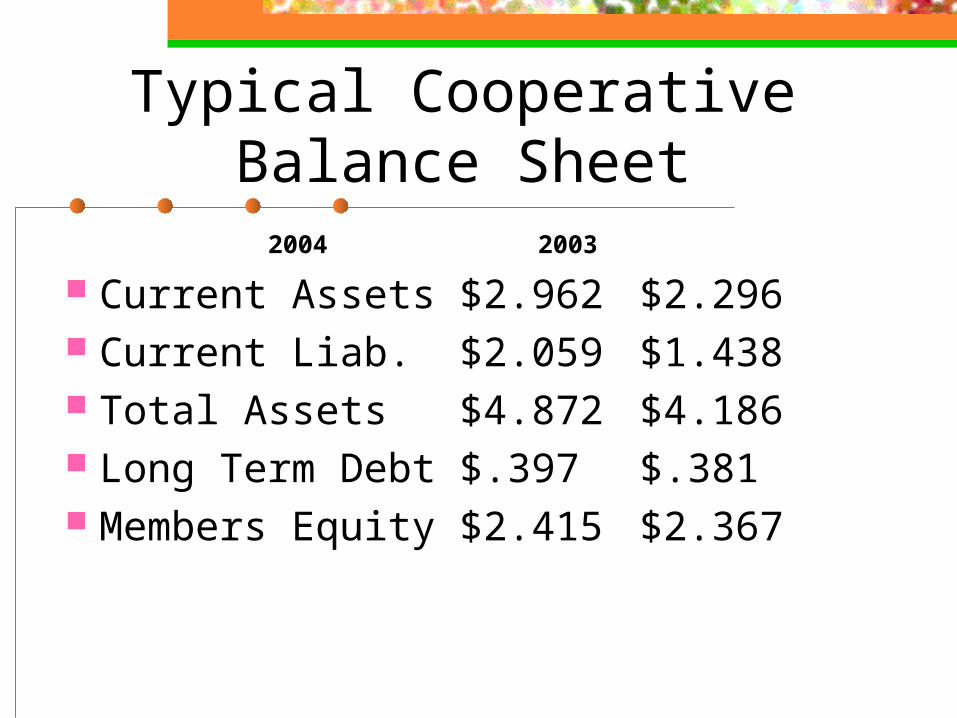
Typical CooperativeBalance Sheet
20042003
Current Assets $2.962 $2.296 Current Liab. $2.059 $1.438 Total Assets $4.872 $4.186 Long Term Debt $.397 $.381 Members Equity $2.415 $2.367
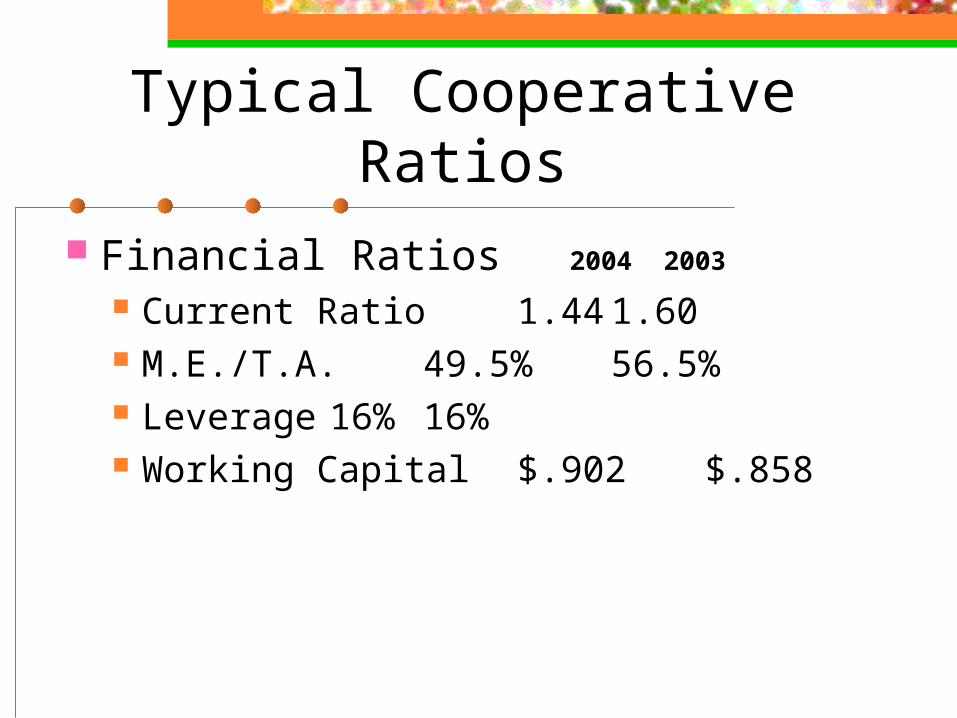
Typical Cooperative Ratios
Financial Ratios 2004 2003
Current Ratio 1.44 1.60 M.E./T.A. 49.5% 56.5% Leverage 16% 16% Working Capital $.902
$.858
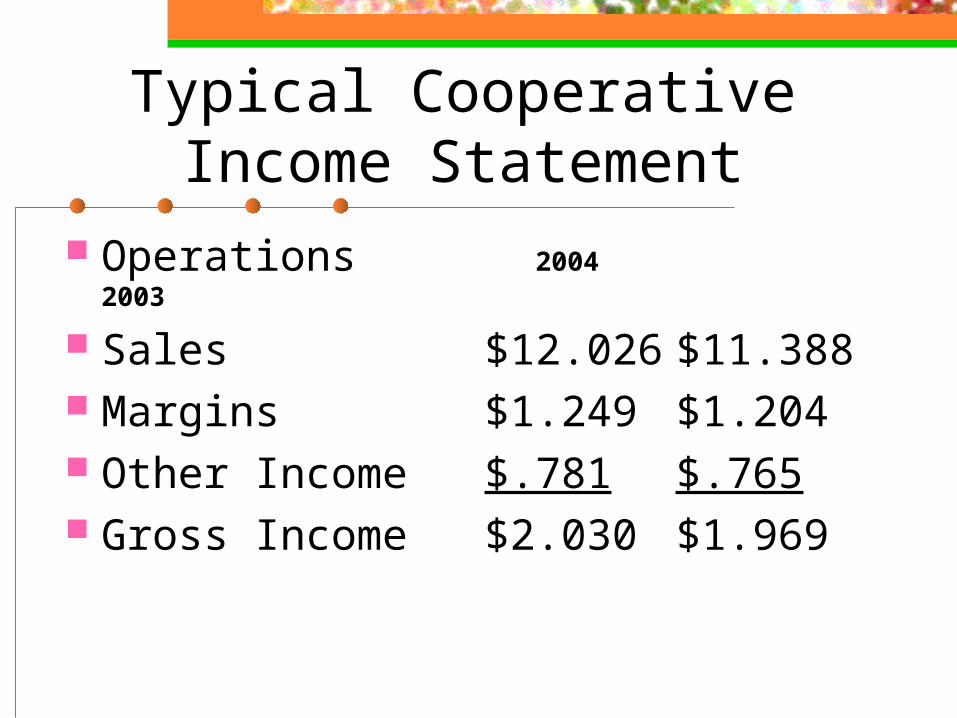
Typical Cooperative Income Statement
Operations 2004 2003
Sales $12.026 $11.388 Margins $1.249 $1.204 Other Income $.781 $.765 Gross Income $2.030 $1.969
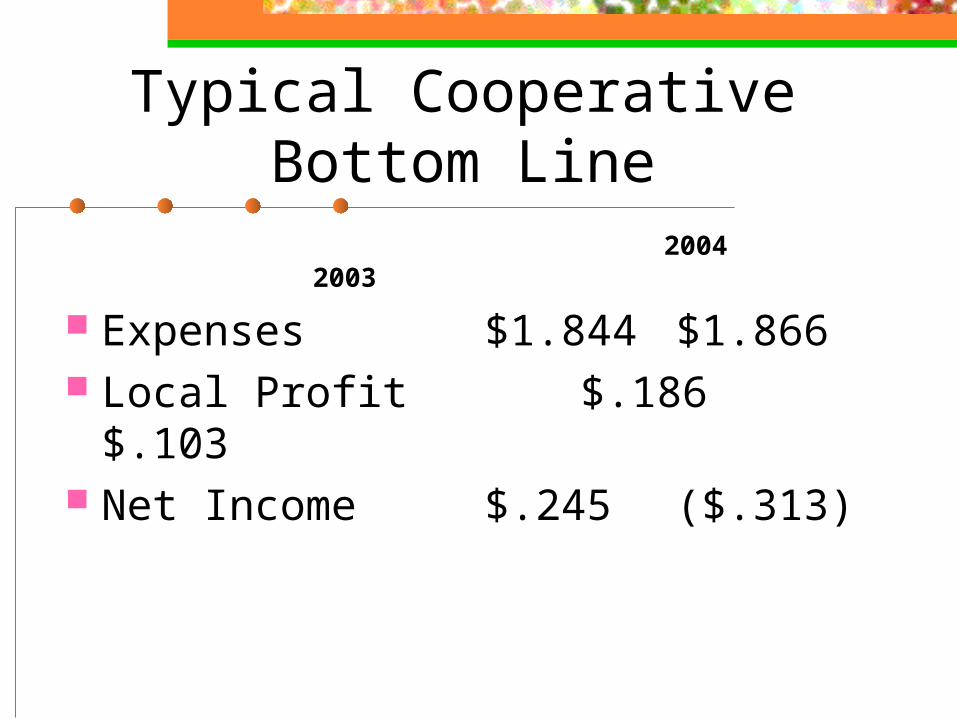
Typical Cooperative Bottom Line
2004 2003
Expenses $1.844 $1.866 Local Profit $.186 $.103 Net Income $.245 ($.313)
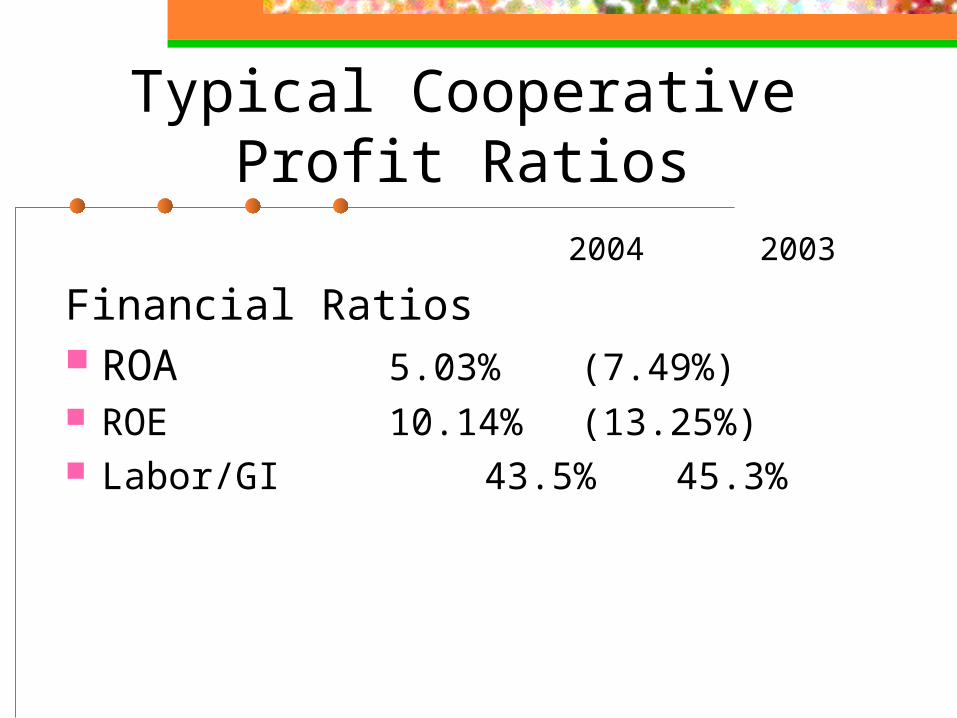
Typical Cooperative Profit Ratios
2004 2003
Financial Ratios ROA 5.03% (7.49%) ROE 10.14% (13.25%) Labor/GI 43.5% 45.3%
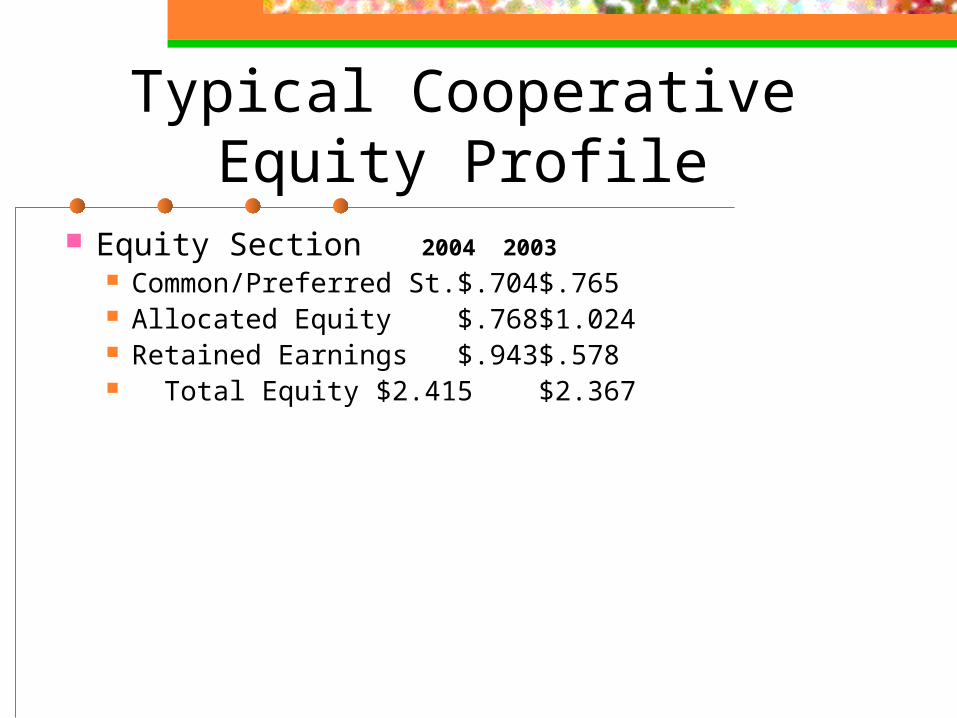
Typical Cooperative Equity Profile
Equity Section 2004 2003 Common/Preferred St. $.704 $.765 Allocated Equity $.768 $1.024 Retained Earnings $.943$.578 Total Equity $2.415 $2.367
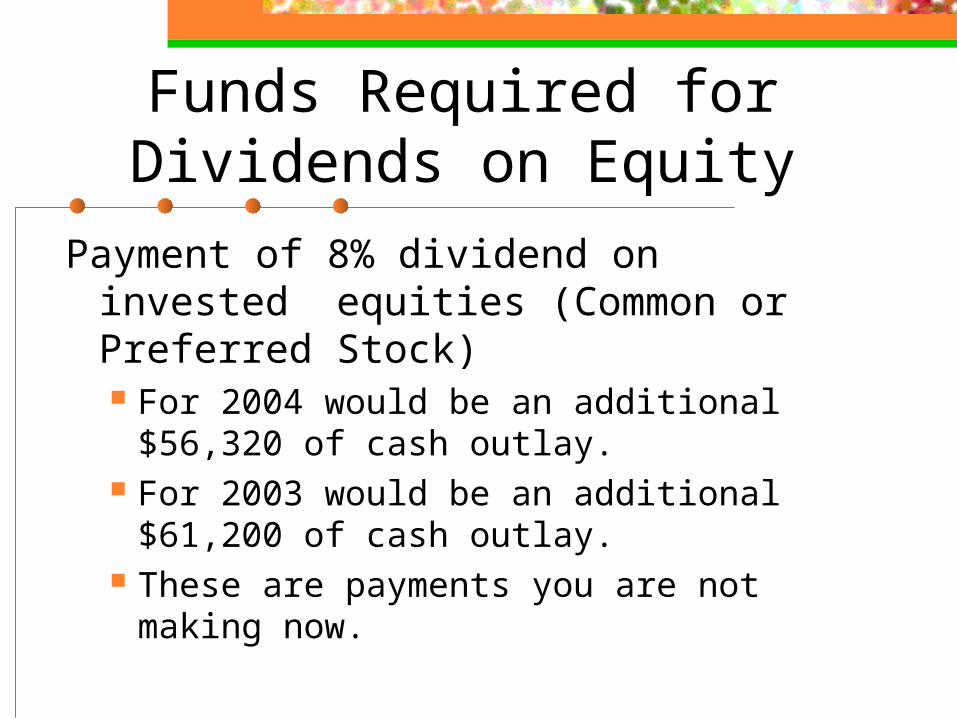
Funds Required for Dividends on Equity
Payment of 8% dividend on invested equities (Common or Preferred Stock) For 2004 would be an additional
$56,320 of cash outlay. For 2003 would be an additional
$61,200 of cash outlay. These are payments you are not
making now.
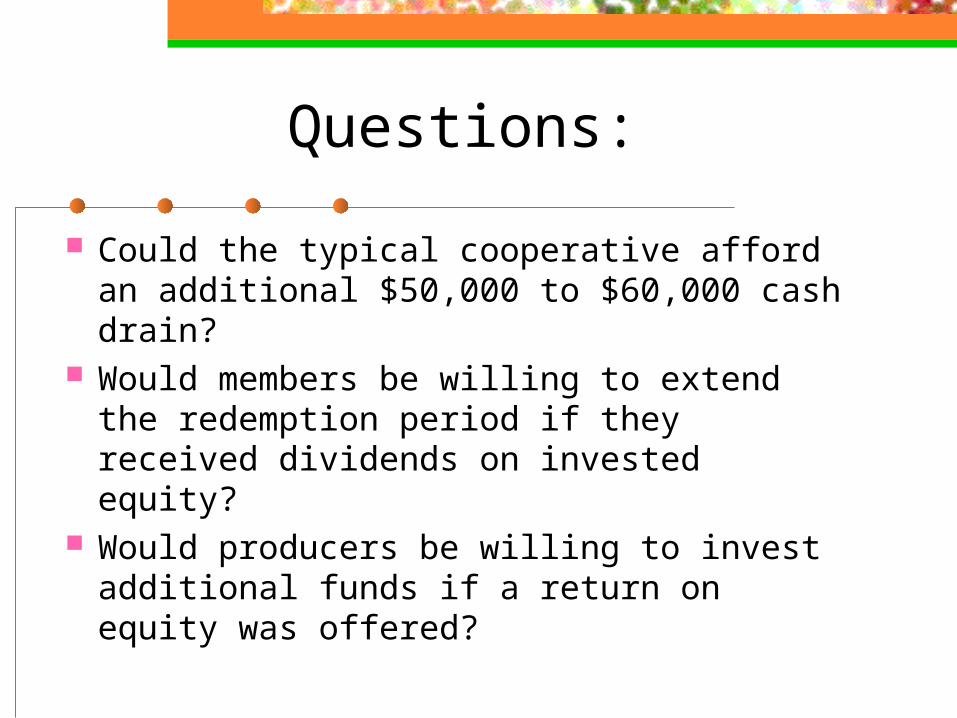
Questions:
Could the typical cooperative afford an additional $50,000 to $60,000 cash drain?
Would members be willing to extend the redemption period if they received dividends on invested equity?
Would producers be willing to invest additional funds if a return on equity was offered?
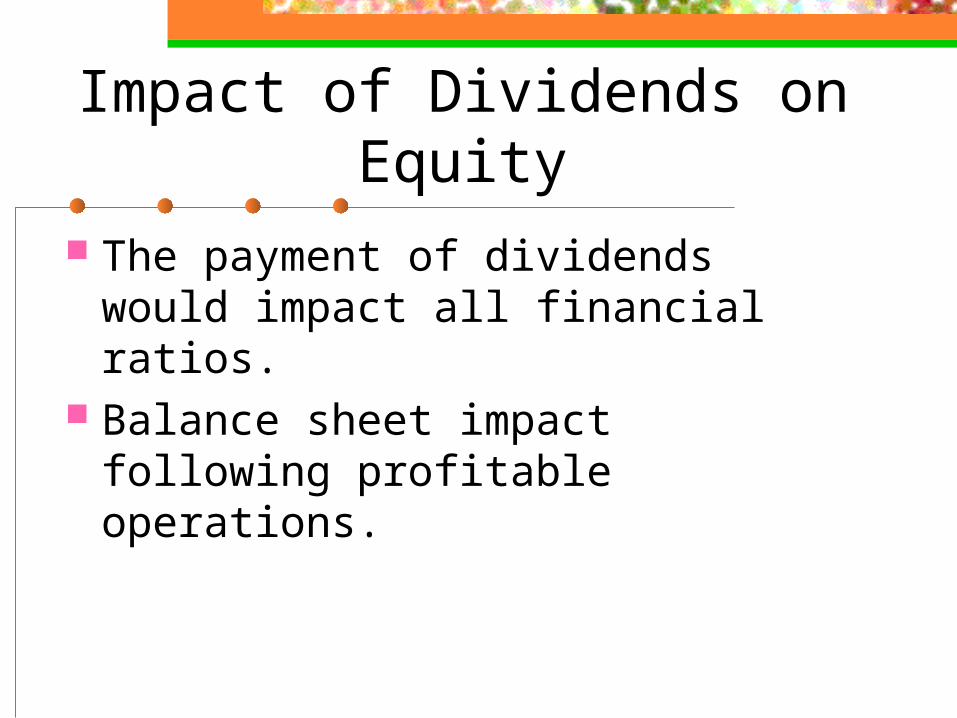
Impact of Dividends on Equity
The payment of dividends would impact all financial ratios.
Balance sheet impact following profitable operations.
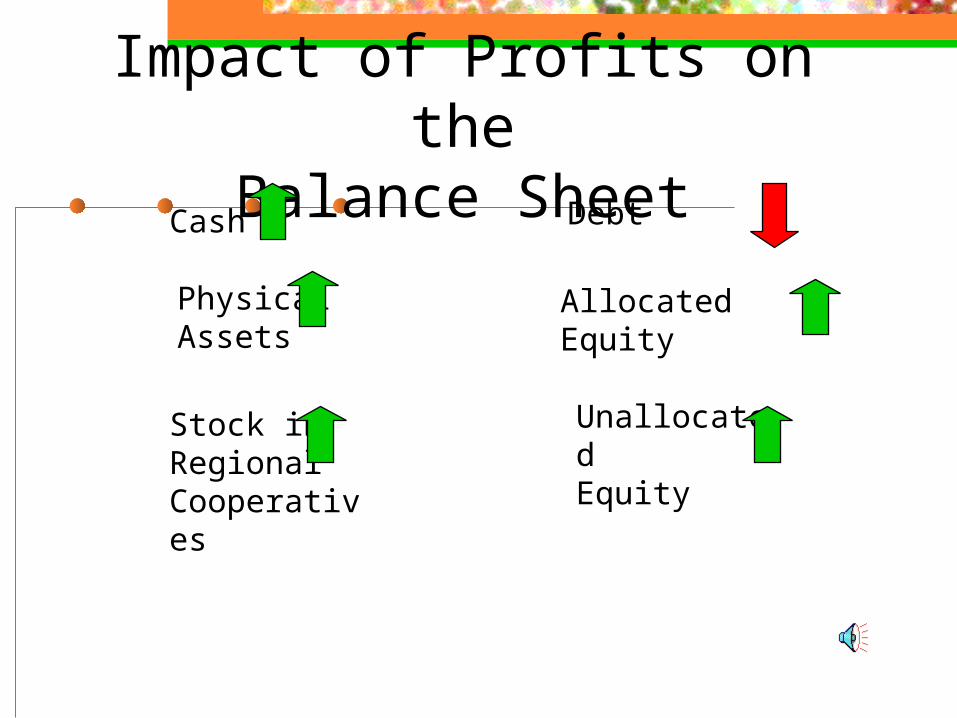
Impact of Profits on theBalance Sheet
Physical Assets
Stock in RegionalCooperatives
Debt
Allocated Equity
Unallocated Equity
Cash

Understanding Equity
Allocated equity is stock or book credits that will be redeemed at a future date
Unallocated equity is permanent capital that provides a “cushion”
Warehouse bond prohibits elevators from carrying negative unallocated equity
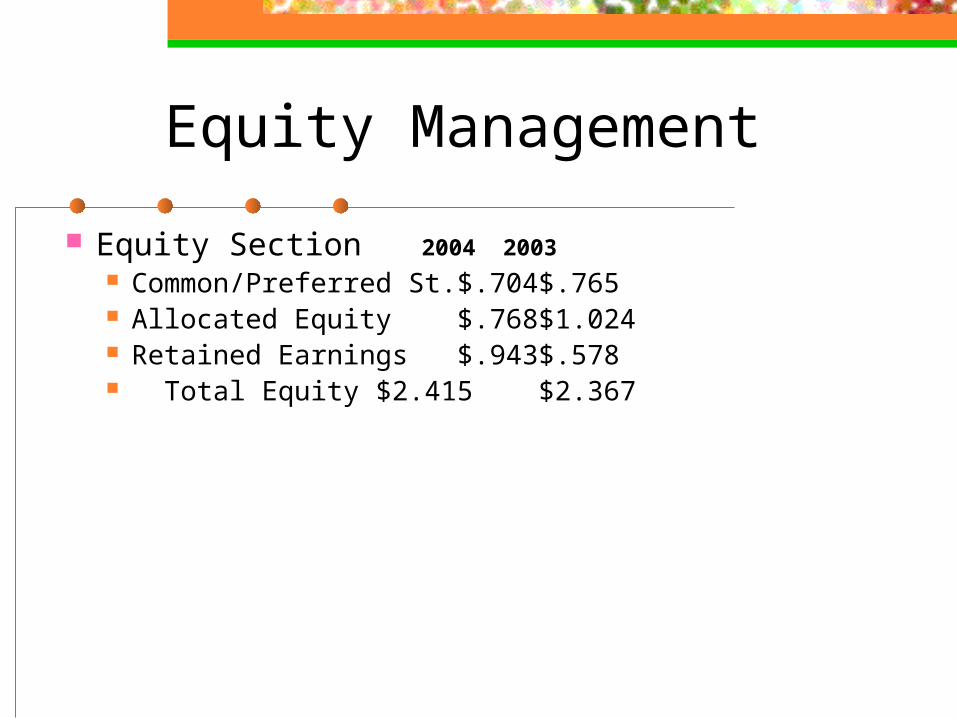
Equity Management
Equity Section 2004 2003 Common/Preferred St. $.704 $.765 Allocated Equity $.768 $1.024 Retained Earnings $.943$.578 Total Equity $2.415 $2.367
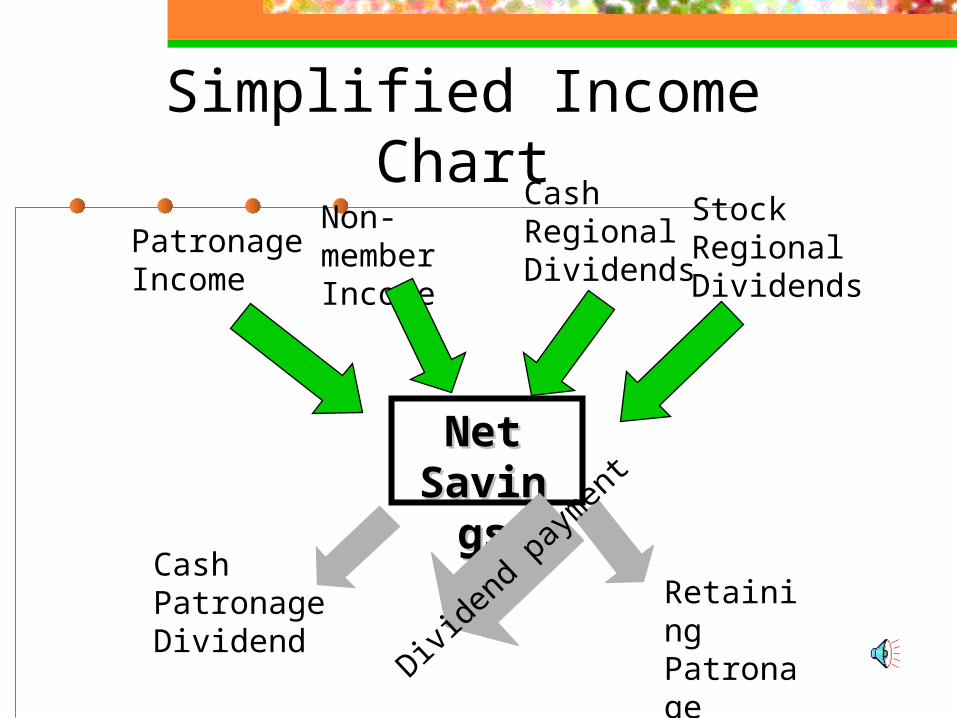
Simplified Income Chart
PatronageIncome
Non-memberIncome
Net Net SavingsSavings
CashPatronageDividend
RetainingPatronage Dividend
CashRegionalDividends
StockRegionalDividends
Divide
nd pa
ymen
t
Equity Management
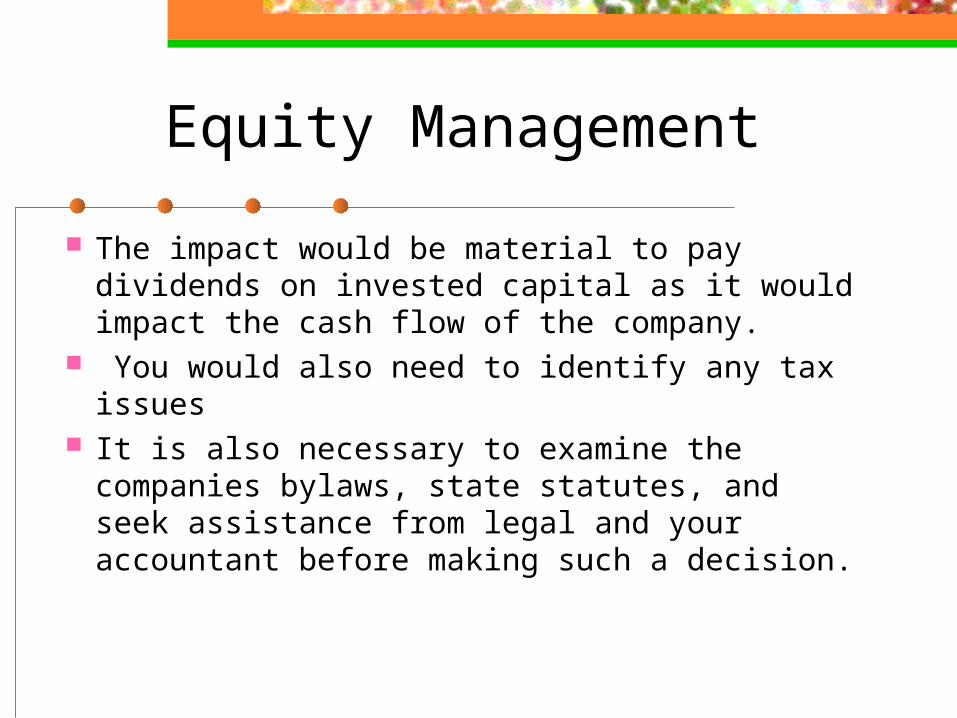
The impact would be material to pay dividends on invested capital as it would impact the cash flow of the company.
You would also need to identify any tax issues
It is also necessary to examine the companies bylaws, state statutes, and seek assistance from legal and your accountant before making such a decision.
Equity Management
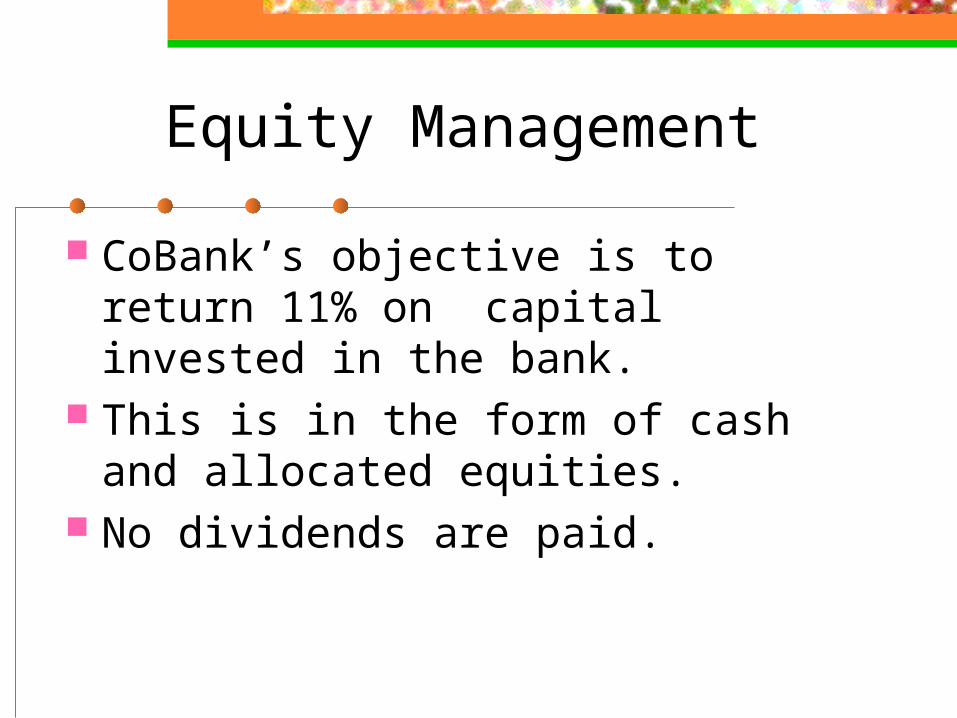
CoBank’s objective is to return 11% on capital invested in the bank.
This is in the form of cash and allocated equities.
No dividends are paid.
Equity Management
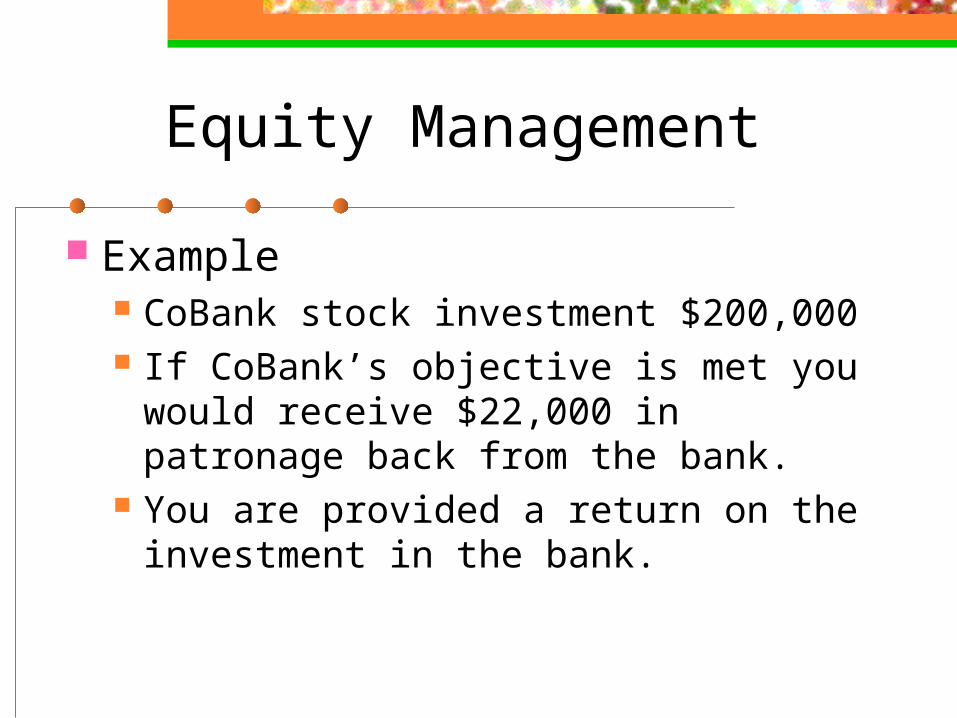
Example CoBank stock investment $200,000 If CoBank’s objective is met you
would receive $22,000 in patronage back from the bank.
You are provided a return on the investment in the bank.
Equity Management
This provides a return to our customers and is not something you would obtain if funding with other financial institutions. Similar to your business.
Our returns can be identified as a reduction in the interest paid which last year reduced your stated rate 84 BP.
We operate under a Base Capital Program. This requires current users to capitalize the
bank.
Equity Management
The customer is provided market rates on interest and also obtain a return on their invested capital with out paying a dividend.
Can your cooperative identify the type of return on the invested capital of the producer?
Is the members needs satisfied? Is the investment he has in the cooperative
retuning him an acceptable return?
Equity Management
Summary Can you quantify for your customer base the
type of returns he is getting on his investment rather then adding a dividend payout.
A dividend payout will add an additional cash outlay that based on the numbers would impact cash flow.
Utilize cash to begin a retirement program that can show a return to your member owners similar to what a dividend return would.