advance publication by j-stage journal of biomechanical
TRANSCRIPT

© The Japan Society of Mechanical Engineers
Advance Publication by J-STAGE
Journal of Biomechanical Science and
Engineering
DOI:10.1299/jbse.21-00093
Received date : 11 March, 2021
Accepted date : 15 June, 2021
J-STAGE Advance Publication date : 24 June, 2021

© The Japan Society of Mechanical Engineers
Using range of motion to examine the effects of deep brain stimulation on gait function of Parkinson’s disease patients
with freezing of gait: a proof-of-concept study
Abstract The purpose of this study was to develop quantitative parameters using range of motion (ROM) of shanks, thighs and knees to evaluate the effect of deep brain stimulation (DBS) on gait performance and freezing of gait (FOG) of patients with advanced Parkinson’s disease (PD). Three patients with FOG due to Parkinson’s disease advanced who has received DBS were recruited. The recruited subjects were instructed to walk on a 100-meter path in three conditions: 60 Hz DBS (60 Hz), 130 Hz DBS (130 Hz) and no DBS (Off). Five inertial measurement unit sensors were attached to subjects’ sacrum, bilateral shanks and thighs respectively. Quantified parameters included (1) spatial parameters: shanks, thighs and knees ROM (2) temporal parameters: stride time, stance time duration and double support time percentage (3) FOG severity: the percentage of FOG duration during path walking. Three subjects’ ROM of right shank significantly increased in 60 Hz,130 Hz and Off order. Compared to 130 Hz, right shank ROM of subjects S1, S2 and S3 significantly increased 13.2%, 99.6% and 6.1% in 60 Hz, respectively. In temporal parameters results, only double support time percentage was significantly different between 60 Hz and 130 Hz in all three subjects. When compared to 130 Hz, the double support time percentage of S1 and S2 significantly decreased 6.3% and 18.4% in 60 Hz, and that of S3 significantly increased 4.4%. ROM of right shank and FOG severity were highly correlated (R2 = 0.71). Shank ROM could represent subjects’ gait performance under different stimulation conditions. Shank ROM could be treated as a reference for clinicians to evaluate gait performance and severity of FOG immediately when DBS frequency is adjusted. This study demonstrated the potential of using objective parameters to optimize the DBS through assessing the gait performance changes in the clinic.
Keywords: Deep brain stimulation, Freezing of gait, Range of motion
1. Introduction
Parkinson’s disease (PD) is one of the most prevalent neurodegenerative disorders occurring in about one percent of
population over the age of 60 worldwide (Hausdorff, 2009). Levodopa is the most effective drug for the treatment of PD. However, the long-term use of this dopamine precursor is complicated by levodopa-induced side-effect, such as dyskinesias (Calabresi, Di Filippo, Ghiglieri, Tambasco and Picconi, 2010). In the recent years, the exaggerated neuronal activity in subthalamic nucleus (STN) of PD has been revealed (Rodriguez-Oroz et al., 2005). Limousin et al. explored the effect of subthalamic nucleus deep brain stimulation (STN-DBS), and found the Unified Parkinson’s Disease Rating Scale (UPDRS) part III scores, related to motor functions, significantly decreased 60% after one year of STN-DBS (Limousin et al., 1998; Volkmann et al., 2004).
Ching NIEN*, Kai-Hsiang CHEN**, Yi-Ning WU***, Shueh-Lin CHUANG*
*Department of Mechanical Engineering, National Chiao Tung University, Hsinchu 30010, Taiwan **Department of Neurology, National Taiwan University Hospital, Hsinchu Branch, Hsinchu 30059, Taiwan
***Department of Physical Therapy and Kinesiology, University of Massachusetts Lowell, Lowell 018514, MA, USA ****Institute of Biomedical Engineering, National Chiao Tung University, Hsinchu 30010, Taiwan
*****Graduate Degree Program of Robotics, National Chiao Tung University, Hsinchu 30010, Taiwan ******Department of Mechanical Engineering, National Yang Ming Chiao Tung University, Hsinchu 30010, Taiwan
and Bing-Shiang YANG*,****,*****,******
E-mail: [email protected]

© The Japan Society of Mechanical Engineers
The stimulation frequencies have been historically divided into high frequency stimulation (HFS, >100 Hz) and low frequency stimulation (LFS, <100 Hz). HFS, typically 130 Hz, is the most commonly used, as it has shown to be effective in improving cardinal parkinsonian symptoms including tremor, bradykinesia and rigidity (di Biase and Fasano, 2016; Moro et al., 2002). Unfortunately, the long-term effect on axial signs, including gait disturbance and poor balance control, deteriorated and freezing of gait (FOG) often appeared in those advanced PD patients (Jiang et al., 2015; Rodriguez-Oroz et al., 2005). Lower stimulation frequency (10-25 Hz) in pedunculopontine nucleus (PPN), which plays an important role in the initiation and maintenance of locomotion, produced an immediate improvement in gait disorders in PD (Mazzone et al., 2005; Stefani et al., 2007). Therefore, Moreau et al. studied the effects of relatively low (60 Hz) and high (130 Hz) deep brain stimulation (DBS) on FOG in patients with PD patients and found at 60 Hz DBS, the number and duration of FOG in stand-walk-sit test (SWSt) significantly decreased compared to that at 130 Hz DBS (Moreau et al., 2008). Several researchers further studied the effects of low frequency (60-80 Hz) DBS on the various gait parameters (Phibbs, Arbogast and Davis, 2014; Ricchi et al., 2012; Sidiropoulos et al., 2013; Xie, Kang and Warnke, 2012; Xie et al., 2015; Zibetti et al., 2016). However, in the current viewpoint published by di Biase et al. reported that the methods adopted, results found, and selection criteria of subjects used were quite variable in the available literature leading to inconclusive guidance for efficient and effective DBS intervention currently (di Biase and Fasano, 2016).
Despite the controversial results of HFS and LFS, most of the studies evaluated the gait function using clinical assessment, such as UPDRS-III, SWSt and FOG questionnaire (FOG-Q) (Ricchi et al., 2012; Sidiropoulos et al., 2013; Xie et al., 2012; Xie et al., 2015). Those clinical measures inherit some limitations. UPDRS may not be the most appropriate scale to assess gait due to its lack of sensitivity (Sidiropoulos et al., 2013). Being clinically observed, patients usually pay more attentions to their gait that causes FOG rarely occuring during SWSt. It is thought that a more complex walking task could represent the severity of FOG better (Ricchi et al., 2012). FOG-Q has been widely used to evaluate FOG severity in clinics (Moreau et al., 2008). As patients usually were asked to estimate the frequency and duration of FOG during 2-3 weeks of activities of daily living (ADL), the information cannot be used for short-interval measures that are necessary for determining acute therapeutic effects (Ziegler, Schroeteler, Ceballos-Baumann and Fietzek, 2010).
Few studies used quantitative gait parameters to evaluate the effects of high and low frequency DBS on the gait function. Phibbs et al. and Vallabhajosula et al. used stride time, swing and stance phase duration, swing and stance phase duration percentage, double support duration percentage, stride length and walking speed to evaluate the effects of the DBS and they concluded that all parameters were not significantly different between HFS and LFS. However, Phibbs et al. did not adjust the stimulation amplitude in two DBS that confounded the results due to incomparable total electrical energy delivered in two conditions (Phibbs et al., 2014). Vallabhajosula et al. thought that the subjects did not develop FOG symptom (Vallabhajosula et al., 2015), so no difference was observed. Therefore, it is still uncertain whether gait parameters could be more sensitive to detect the changes. Nonetheless, temporal parameters were often elaborated in the current literature and less so in spatial parameters. Only stride length and walking speed have been selected for evaluation (Azevedo Coste et al., 2014).
It is known that lower limb range of motion (ROM) were restricted in patients with PD that led to joint rigidity symptom (Morris, Iansek, McGinley, Matyas and Huxham, 2005; Salarian et al., 2004). As the wearable technology advances quickly, using wearable sensors to measure ROM might provide a quantitative and quick way to evaluate DBS effects and FOG severity. Therefore, the purposes of this study were (1) to evaluate the effects of high and low frequency DBS using lower shanks, thighs and knee joints ROM, and (2) to observe whether the quantitative gait parameters correlate with the FOG severity.
2. Methods 2.1 Subjects
Three patients diagnosed with PD who developed FOG were recruited in this study. Table 1 shows the characteristics of the recruited subjects. All subjects displayed distinguished FOG under 130-Hz DBS on and off-medication state. Since this was a pilot study, we did not set additional exclusion criteria. All subjects gave their informed consent to participate in this study before any research procedures. The study protocol was approved by the Institutional Review Board of the National Taiwan University Hospital, Hsinchu Branch.

© The Japan Society of Mechanical Engineers
Table 1. Characteristics of subjects Age (years) Biological sex Years since
diagnosed (years) Duration since STN-DBS initiation (years)
S1 63 male 10 0.4 S2 70 female 9 0.5 S3 59 male 20 9
2.2 Study protocol
Each subject waited for 12 hours after they stopped taking the dopamine precursor before participating in the experiment. Each subject was fitted with sensors before performing the experimental tasks. Five inertial measurement unit (IMU) sensors (Xsens, Netherlands) were attached to subjects’ sacrum, bilateral shanks and thighs Fig.1. Each subject was asked to walk at their self-selected speed through a designed route that was approximately 100 meters in length (Fig.2) under three conditions: 60 Hz STN-DBS (60 Hz), mark130 Hz STN-DBS (130 Hz) and DBS switched off (Off). To avoid any potential carry-over effect from prior DBS condition, a one-hour break was implemented between two DBS conditions. The IMU data were collected through Xsens at the sampling rate of 100 Hz and stored in the local computer for offline analysis. In addition to the IMU data, during each condition, each subject was also evaluated by the same neurologist using gait item under the ADL segment of UPDRS (Sidiropoulos et al., 2013). Subjects were also instructed to perform 10-m SWSt twice while being timed.
The stimulus profiles of 60 Hz and 130 Hz were designed so that both conditions delivered the same level of energy to the subjects. The pulse width was kept constant (60 µs) (Koss, Alterman, Tagliati and Shils, 2005) when we adjusted the stimulation voltage according to the total electrical energy delivered (TEED) formula: 𝑇𝐸𝐸𝐷𝑝𝑒𝑟𝑠𝑒𝑐𝑜𝑛𝑑 =(𝑣𝑜𝑙𝑡𝑎𝑔𝑒7 × 𝑓𝑟𝑒𝑞𝑢𝑒𝑛𝑐𝑦 × 𝑝𝑢𝑙𝑠𝑒𝑤𝑖𝑑𝑡ℎ) 𝑖𝑚𝑝𝑒𝑑𝑎𝑛𝑐𝑒⁄ (Koss et al., 2005).
Fig.1 IMU sensors placement (Fig.2) Approximate path taken by the subjects
2.3 Data analysis 2.3.1 Severity of FOG
The severity of FOG was defined as the ratio of FOG occurred duration to the time required to complete the 100-m course, Eq. (1). The FOG was identified when the power spectrum energy exceeds the freezing threshold, which is defined as the mean plus one standard deviation of freezing index (FI) of 30-second of quiet standing (Moore, MacDougall and Ondo, 2008). The FI was derived through the time-frequency analysis. The power spectrum of continuous 6-second window of sagittal plane shank angular velocity were divided into the locomotor band (0–3 Hz) and the freezing band (3-8 Hz). The FI is the ratio of the summed freezing band power to the summed locomotor band total power (Delval et al., 2010).

© The Japan Society of Mechanical Engineers
SeverityofFOG =FOGoccurtime
100mcoursecompletiontime (1)
2.3.2 Temporal parameters of gait
After removing gait cycles containing festination and FOG determined in 2.3.1, twelve continuous gait cycles of straight-line walking (in the middle of course) were selected for deriving temporal and spatial parameters of gait. To determine the gait cycle, we used shank angular velocity. The swing phase of a gait cycle was characterized by a positive shank angular velocity reaching its highest values around mid-swing. Prior to swing phase, a negative angular velocity peak could be observed which was associated with terminal contact (TC). The first negative peak following the positive shank angular velocity around mid-swing was associated with initial contact (IC) (Salarian et al., 2004). Each complete gait cycle consisted of five events: IC of right foot (ICY), TC of left foot (TC[), IC of left foot (IC[) and TC of right foot (TCY) followed by the next ICY, that was also the start of the next gait cycle. Based on these time events, temporal parameters of kth gait cycle using right leg as reference could be calculated as follows:
Gait cycle duration (GCT):
𝐺𝐶𝑇(𝑘) = 𝐼𝐶`(𝑘 + 1) − 𝐼𝐶`(𝑘) (2)
Stance phase duration (ST):
𝑆𝑇(𝑘) =𝑇𝐶`(𝑘) − 𝐼𝐶`(𝑘)
𝐺𝐶𝑇(𝑘) × 100% (3)
Double support time percentage (DS):
𝐷𝑆(𝑘) =𝑇𝐶e(𝑘) − 𝐼𝐶`(𝑘) + 𝑇𝐶`(𝑘) − 𝐼𝐶e(𝑘)
𝐺𝐶𝑇(𝑘) × 100% (4)
2.3.3 Range of motion calculation
To find the instantaneous angle of each segment (shanks and thighs), the angular velocity of that segment was integrated over each gait cycle. Therefore, having discrete values of wg for each sample, sampling rate of 𝑓and instantaneous angle of θig for each segment would be
𝜃ig = 𝜃i(gkl) +(𝑤g +𝑤gkl)
2𝑓 (5)
Shank and thigh rotation angles were obtained from Eq. (5) . The range of motion of the segments (ROMsn) would be
𝑅𝑂𝑀𝑠g = 𝑀𝐴𝑋(𝜃𝑠g) −𝑀𝐼𝑁(𝜃𝑠g) (6)
2.3.4 IMU data validation using Motion Capture System (Mocap)
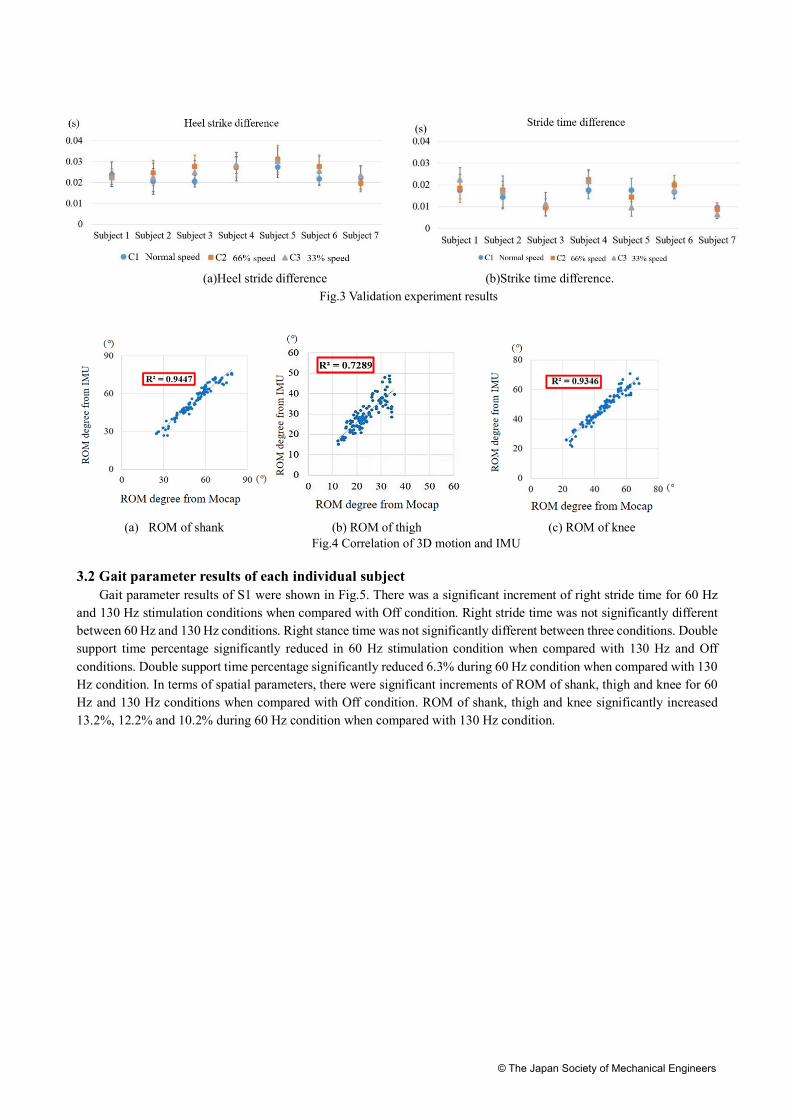
We used a 3D motion capture system (BTS Bioengineering, Garbagnate Milaness, Italy) to validate using IMU data for gait parameters on seven healthy subjects. Subjects were asked to walk naturally with different speeds (C1: normal/preferred speed, C2: 66% of normal speed, and C3: 33% of normal speed) when IMU and 3D motion data were recorded simultaneously. To examine the accuracy of shank angular velocity derived from IMU data in the sagittal plane, we defined the heel strike points and stride time of both systems, IMU and motion capture system, as HSIMU, HSMocap,

© The Japan Society of Mechanical Engineers
Stride timeIMU and Stride timeMocap respectively. We defined the heel strike point error as Heel strike difference, and stride time error as Stride time difference. The two temporal parameter errors were calculated by Eq. (7) and Eq. (8). If the heel strike difference was positive, the heel strike point of 3D motion capture system was faster than that from the IMU sensors, and if the stride time difference value was positive, it means that the 3D motion capture system of stride time was longer than that calculated from the IMU sensors.
𝐻𝑒𝑒𝑙𝑠𝑡𝑟𝑖𝑘𝑒𝑑𝑖𝑓𝑓𝑒𝑟𝑒𝑛𝑐𝑒 = 𝐻𝑆uvwxy − 𝐻𝑆zu{ (7)
S𝑡𝑟𝑖𝑑𝑒𝑡𝑖𝑚𝑒𝑑𝑖𝑓𝑓𝑒𝑟𝑒𝑛𝑐𝑒 = 𝑆𝑡𝑟𝑖𝑑𝑒𝑡𝑖𝑚𝑒uvwxy − 𝑆𝑡𝑖𝑟𝑑𝑒𝑡𝑖𝑚𝑒zu{ (8)
Owing to the different walking speed each subject adopted, to validate gait spatial parameters (ROMs of the thigh, shank and knee) derived from the IMU sensors, we used regression analysis to calculate the relationship between gait spatial parameters derived from the IMU and those derived from motion capture system. We used regression analysis to correct the error of ROM. Root-mean-square error (RMSE) was used to calculate the average angle error value in a time point. The rotation angle calculated by the motion capture system was denoted as θMocap and the rotation angle calculated by the IMU sensors was θIMU, and then the RMSE calculation methods was as follows:
𝜃uvwxy= |𝑎l⋮𝑎g~ , 𝜃zu{= �
𝑏l⋮𝑏g� (9)
𝑅𝑀𝑆𝐸�𝜃uvwxy, 𝜃zu{� = �∑ (𝑎� − 𝑏�)7g��l
𝑛 (10)
2.4 Statistical analysis Paired t test was used to examine the differences of all variables, including temporal, spatial gait parameters and
clinical scores, among three conditions within each subject. Statistical analyses were performed in SPSS (Version 21) with the adjusted level of significance set at p<0.016. The liner regression analysis was used to examine the correlation between each parameters and FOG severity. R2 > 0.7 was considered highly correlated, and 0.4 < R2 <0.7 was considered moderately correlated. To compare the difference between and correlation of the variables derived from IMU data and motion capture data, one-way ANOVA and linear regression coefficient (R2) were used respectively.
. 3. Results 3.1 Validation results
We calculated 3D motion and IMU’s heel strike difference, stride time difference and ROMs of the thigh, shank and knee by one-way ANOVA. The results showed that among three speeds there were no difference observed in heel strike (p=0.23) and stride time (p=0.69), as shown in Fig.3. Heel strike difference was within 40 ms and stride time difference was within 30 ms. The correlation coefficient R2 of ROMs of the thigh, shank and knee were 0.73, 0.94 and 0.93, respectively. R2 > 0.7 indicated that spatial parameters derived from 3D motion and IMU were highly correlated, as shown in Fig.4.
© The Japan Society of Mechanical Engineers
(a)Heel stride difference (b)Strike time difference. Fig.3 Validation experiment results
(a) ROM of shank (b) ROM of thigh (c) ROM of knee Fig.4 Correlation of 3D motion and IMU
3.2 Gait parameter results of each individual subject
Gait parameter results of S1 were shown in Fig.5. There was a significant increment of right stride time for 60 Hz and 130 Hz stimulation conditions when compared with Off condition. Right stride time was not significantly different between 60 Hz and 130 Hz conditions. Right stance time was not significantly different between three conditions. Double support time percentage significantly reduced in 60 Hz stimulation condition when compared with 130 Hz and Off conditions. Double support time percentage significantly reduced 6.3% during 60 Hz condition when compared with 130 Hz condition. In terms of spatial parameters, there were significant increments of ROM of shank, thigh and knee for 60 Hz and 130 Hz conditions when compared with Off condition. ROM of shank, thigh and knee significantly increased 13.2%, 12.2% and 10.2% during 60 Hz condition when compared with 130 Hz condition.

© The Japan Society of Mechanical Engineers
Fig.5 Gait parameters results of S1
Gait parameters results of S2 were shown in Fig.6. Right stride time, right stance time and double support time
percentage significantly reduced during 60 Hz and 130 Hz conditions when compared to Off condition. Right stride time, right stance time and double support time percentage significantly reduced 18.8%, 29.8% and 18.4% during 60 Hz condition when compared with 130 Hz condition. In terms of spatial parameters, ROM of shank, thigh and knee significantly increased during 60 Hz and 130 Hz conditions when compared with Off condition. ROM of shank, thigh and knee significantly increased 99.6%, 38.1% and 41.9% during 60 Hz condition when compared with 130 Hz condition.
Fig.6 Gait parameters results of S2
*= P < 0.016
*= P< 0.016

© The Japan Society of Mechanical Engineers
Gait parameters results of S3 were shown in Fig.7. Right stride time and right stance time were significantly increased
during 130 Hz condition when compared to 60 Hz and Off conditions. Double support time percentage significantly increased 4.4% during 60 Hz condition when compared with 130 Hz condition. In terms of spatial parameters, ROM of shank and knee significantly increased during 60 Hz and 130 Hz conditions when compared with Off condition. ROM of shank and knee significantly increased 6.1% and 10.5% during 60 Hz condition when compared with 130 Hz condition.
Fig.7 Gait parameters results of S3
3.3 Correlation between temporal parameters of gait, ROM and FOG
In terms of the regression analysis results, there was a low correlation between right stride time and FOG severity in path walking (R2 = 0.04). Right stance time and FOG severity in path walking were also modestly correlated (R2 = 0.15). There was a moderate correlation between double support time percentage and FOG severity in path walking (R2 = 0.47). There was a high correlation between right shank ROM and FOG severity in path walking (R2 = 0.71). Right knee ROM and FOG severity in path walking were moderately correlated (R2 = 0.62). Right thigh ROM and FOG severity in path walking also were moderately correlated (R2 = 0.56).
3.4 Clinical outcome measures of each individual subject
Table 2 summarizes the clinical outcome measure results. S2’s and S3’s UPDRS gait subscores during 60 Hz condition were equal to those in 130 Hz condition. In terms of SWSt results, only S1’s and S2’s SWSt completion time significantly reduced 42.9% and 42.4% respectively during 60 Hz condition when compared to 130 Hz condition.
*= P < 0.016

© The Japan Society of Mechanical Engineers
Table 2 Clinical assessment results of individual subjects
Condition UPDRS gait (/4 points) S1 S2 S3
60 Hz 2/4 2/4 1/4 130 Hz 1/4 2/4 1/4
Off 3/4 3/4 2/4 SWSt completion time (s)
S1 S2 S3 60 Hz 36.05 ± 1.27* 54.29 ± 5.81* 21.56 ± 0.97
130 Hz 63.19 ± 13.54$ 94.31 ± 8.44$ 25.27 ± 7.58 Off 322.00 ± 38.69# 208.11 ± 64.84# 28.88 ± 0.97
UPDRS, Unified Parkinson’s Disease Rating Scales; SWSt, stand-walk-sit test. *: p < 0.016 compared to 130 Hz condition. $: p < 0.016 compared to Off condition. #: p < 0.016 compared to 60 Hz condition. 4. Discussion
Among three temporal parameters, only double support time percentage of three subjects were significantly different between 60 Hz and 130 Hz conditions. However, subjects showed different trends of change. When compared to 130 Hz condition, the double support time percentage of S1 and S2 significantly decreased 6.3% and 18.4% in 60 Hz condition, and that of S3 significantly increased 4.4%. The regression analysis results showed that double support time percentage was moderately correlated to FOG severity during path walking (R2= 0.47). In terms of spatial parameters, three subjects’ ROM of shank significantly increased 13.2%, 99.6% and 6.1% during 60 Hz condition when compared to 130 Hz condition. The regression analysis results showed that ROM of shank was highly correlated to FOG severity during path walking (R2 = 0.71).
Previous studies showed that the stride time, double support time percentage and shank ROM of healthy adults were 1091 ± 91 ms, 33.6 ± 4.8% and 76.0 ± 5.9° (Hausdorff, Cudkowicz, Firtion, Wei and Goldberger, 1998; Salarian et al., 2004). In aspect of S1, the stride time in 60 Hz, 130 Hz and Off conditions were 766.6 ± 69.9, 790.0 ± 65.2 and 683.3 ± 58.36 ms respectively, which indicated S1 could not complete one stride sufficiently. After switched on the stimulation, stride time significantly increased when compared to Off condition and approached to previous study control group. In comparison of high and low frequency conditions, ROM of shank significantly increased 13.2% during 60 Hz when compared to 130 Hz condition, although stride time was not significantly different between high and low frequency stimulation conditions. It meant that S1 could increase ROM of shank under same duration in 60 Hz condition.
Regarding to S2, right stride time and double support time percentage during Off condition were significantly higher than the performance of previous study control group. It meant that S2 needed longer duration to complete one stride and spent more proportion of double support time percentage than healthy adults reported in the previous study. After switched on the stimulation, right stride time, right stance time and double support time percentage significantly decreased and approached to the performance of previous study control group. Also, S2’s ROM of shank, thigh and knee were significantly lower than previous study control group under Off condition, and it increased in 130 Hz and 60 Hz stimulation conditions. Overall, S2 took less duration and less proportion of double support time percentage to complete gait cycle with largest ROM of shank, thigh and knee under 60 Hz stimulation condition.
As for S3, although right stride time and right stance time significantly increased during 130 Hz condition when compared to 60 Hz and Off conditions, they were similar to those reported for the control group in a previous study(Hausdorff et al., 1998; Salarian et al., 2004). Double support time percentage during Off condition was significantly lower than the values reported for the control group in previous study and it significantly increased after switching on the stimulation. Compared to 130 Hz and Off conditions, double support time percentage during 60 Hz condition was the closest to the values of the healthy controls (Hausdorff et al., 1998; Salarian et al., 2004). S3’s ROM of shank and knee during Off condition were lower than the values of control group in the previous study, and increased after switching on the stimulation under 60 Hz and 130 Hz conditions. Overall, S3 took similar duration and the largest ROM of shank and knee to complete gait cycle under 60 Hz condition when compared to 130 Hz and Off conditions.
The results of regression analysis indicated that ROM of shank and FOG severity were highly correlated. Previous study demonstrated that the number of FOG episodes significantly increased under walking with 50% stride length

© The Japan Society of Mechanical Engineers
condition (Chee, Murphy, Danoudis, Georgiou-Karistianis and Iansek, 2009). This finding might be one of the reasons that spatial parameters (ROM of shank in our study) were highly correlated to FOG severity and ROM of shank could be a potential indictor of FOG severity for clinicians. Our study also demonstrated that when the temporal parameter might show different trends of change, the spatial parameters provided more consistent results.
In conclusion, this study successfully detected the differences of effects caused by low and high frequency stimulation using shank ROM. Moreover, the ROM of shank was highly correlated with FOG severity. Our results have demonstrated the potential of using objective parameters for clinicians to evaluate gait performance between different stimulation conditions, and evaluate FOG severity immediately after the parameters of DBS were adjusted.
Acknowledgment
Fund partially supported by Collaborative Fund between National Chiao Tung University and National Taiwan University Hospital Hsinchu Branch (105W970), Taiwan Ministry of Science and Technology grants (MOST 105-2628-E-009-003-MY3; MOST 109-2221-E-009-010-MY3), and the Higher Education Sprout Project of the National Chiao Tung University and Ministry of Education (MOE), Taiwan.
References
Azevedo Coste, C., Sijobert, B., Pissard-Gibollet, R., Pasquier, M., Espiau, B. and Geny, C., Detection of Freezing of Gait in Parkinson Disease: Preliminary Results, Sensors, Vol. 14, No.4 (2014), pp.6819-6827.
Calabresi, P., Di Filippo, M., Ghiglieri, V., Tambasco, N. and Picconi, B., Levodopa-Induced Dyskinesias in Patients with Parkinson's Disease: Filling the Bench-to-Bedside Gap, The Lancet Neurology, Vol. 9, No.11 (2010), pp.1106-1117.
Chee, R., Murphy, A., Danoudis, M., Georgiou-Karistianis, N. and Iansek, R., Gait Freezing in Parkinson's Disease and the Stride Length Sequence Effect Interaction, Brain, Vol. 132, No.8 (2009), pp.2151-2160.
Delval, A., Snijders, A. H., Weerdesteyn, V., Duysens, J. E., Defebvre, L., Giladi, N. and Bloem, B. R., Objective Detection of Subtle Freezing of Gait Episodes in Parkinson's Disease, Movement Disorders, Vol. 25, No.11 (2010), pp.1684-1693.
di Biase, L. and Fasano, A., Low-Frequency Deep Brain Stimulation for Parkinson's Disease: Great Expectation or False Hope? , Movement Disorders, Vol. 31, No.7 (2016), pp.962-967.
Hausdorff, J. M., Gait Dynamics in Parkinson’s Disease: Common and Distinct Behavior among Stride Length, Gait Variability, and Fractal-Like Scaling, Chaos: An Interdisciplinary Journal of Nonlinear Science, Vol. 19, No.2 (2009), pp.026113.
Hausdorff, J. M., Cudkowicz, M. E., Firtion, R., Wei, J. Y. and Goldberger, A. L., Gait Variability and Basal Ganglia Disorders: Stride-to-Stride Variations of Gait Cycle Timing in Parkinson's Disease and Huntington's Disease, Movement disorders, Vol. 13, No.3 (1998), pp.428-437.
Jiang, J.-L., Chen, S.-Y., Hsieh, T.-C., Lee, C.-W., Lin, S.-H. and Tsai, S.-T., Different Effectiveness of Subthalamic Deep Brain Stimulation in Parkinson's Disease: A Comparative Cohort Study at 1 Year and 5 Years, Journal of the Formosan Medical Association, Vol. 114, No.9 (2015), pp.835-841.
Koss, A. M., Alterman, R. L., Tagliati, M. and Shils, J. L., Calculating Total Electrical Energy Delivered by Deep Brain Stimulation Systems, Annals of Neurology, Vol. 58, No.1 (2005), pp.168.
Limousin, P., Krack, P., Pollak, P., Benazzouz, A., Ardouin, C., Hoffmann, D. and Benabid, A.-L., Electrical Stimulation of the Subthalamic Nucleus in Advanced Parkinson's Disease, New England Journal of Medicine, Vol. 339, No.16 (1998), pp.1105-1111.
Mazzone, P., Lozano, A., Stanzione, P., Galati, S., Scarnati, E., Peppe, A. and Stefani, A., Implantation of Human Pedunculopontine Nucleus: A Safe and Clinically Relevant Target in Parkinson's Disease, Neuroreport, Vol. 16, No.17 (2005), pp.1877-1881.
Moore, S. T., MacDougall, H. G. and Ondo, W. G., Ambulatory Monitoring of Freezing of Gait in Parkinson's Disease, Journal of Neuroscience Methods, Vol. 167, No.2 (2008), pp.340-348, DOI:10.1016/j.jneumeth.2007.08.023
Moreau, C., Defebvre, L., Destee, A., Bleuse, S., Clement, F., Blatt, J. and Devos, D., Stn-Dbs Frequency Effects on Freezing of Gait in Advanced Parkinson Disease, Neurology, Vol. 71, No.2 (2008), pp.80-84.
Moro, E., Esselink, R., Xie, J., Hommel, M., Benabid, A. and Pollak, P., The Impact on Parkinson’s Disease of Electrical
© The Japan Society of Mechanical Engineers
Parameter Settings in Stn Stimulation, Neurology, Vol. 59, No.5 (2002), pp.706-713. Morris, M., Iansek, R., McGinley, J., Matyas, T. and Huxham, F., Three-Dimensional Gait Biomechanics in Parkinson's
Disease: Evidence for a Centrally Mediated Amplitude Regulation Disorder, Movement disorders, Vol. 20, No.1 (2005), pp.40-50.
Phibbs, F. T., Arbogast, P. G. and Davis, T. L., 60-Hz Frequency Effect on Gait in Parkinson's Disease with Subthalamic Nucleus Deep Brain Stimulation, Neuromodulation: Technology at the Neural Interface, Vol. 17, No.8 (2014), pp.717-720.
Ricchi, V., Zibetti, M., Angrisano, S., Merola, A., Arduino, N., Artusi, C. A. and Lanotte, M., Transient Effects of 80 Hz Stimulation on Gait in Stn Dbs Treated Pd Patients: A 15 Months Follow-up Study, Brain stimulation, Vol. 5, No.3 (2012), pp.388-392.
Rodriguez-Oroz, M., Obeso, J., Lang, A., Houeto, J.-L., Pollak, P., Rehncrona, S. and Hariz, M., Bilateral Deep Brain Stimulation in Parkinson's Disease: A Multicentre Study with 4 Years Follow-Up, Brain, Vol. 128, No.10 (2005), pp.2240-2249.
Salarian, A., Russmann, H., Vingerhoets, F. J., Dehollain, C., Blanc, Y., Burkhard, P. R. and Aminian, K., Gait Assessment in Parkinson's Disease: Toward an Ambulatory System for Long-Term Monitoring, IEEE Transactions on Biomedical Engineering, Vol. 51, No.8 (2004), pp.1434-1443.
Sidiropoulos, C., Walsh, R., Meaney, C., Poon, Y., Fallis, M. and Moro, E., Low-Frequency Subthalamic Nucleus Deep Brain Stimulation for Axial Symptoms in Advanced Parkinson’s Disease, Journal of Neurology, Vol. 260, No.9 (2013), pp.2306-2311.
Stefani, A., Lozano, A. M., Peppe, A., Stanzione, P., Galati, S., Tropepi, D. and Mazzone, P., Bilateral Deep Brain Stimulation of the Pedunculopontine and Subthalamic Nuclei in Severe Parkinson's Disease, Brain, Vol. 130, No.6 (2007), pp.1596-1607.
Vallabhajosula, S., Haq, I. U., Hwynn, N., Oyama, G., Okun, M., Tillman, M. D. and Hass, C. J., Low-Frequency Versus High-Frequency Subthalamic Nucleus Deep Brain Stimulation on Postural Control and Gait in Parkinson's Disease: A Quantitative Study, Brain stimulation, Vol. 8, No.1 (2015), pp.64-75.
Volkmann, J., Allert, N., Voges, J., Sturm, V., Schnitzler, A. and Freund, H. J., Long-Term Results of Bilateral Pallidal Stimulation in Parkinson's Disease, Annals of Neurology, Vol. 55, No.6 (2004), pp.871-875.
Xie, T., Kang, U. J. and Warnke, P., Effect of Stimulation Frequency on Immediate Freezing of Gait in Newly Activated Stn Dbs in Parkinson's Disease, Journal of Neurology, Neurosurgery & Psychiatry, Vol. 83, No.10 (2012), pp.1015-1017.
Xie, T., Vigil, J., MacCracken, E., Gasparaitis, A., Young, J., Kang, W. and Kang, U. J., Low-Frequency Stimulation of Stn-Dbs Reduces Aspiration and Freezing of Gait in Patients with Pd, Neurology, Vol. 84, No.4 (2015), pp.415-420.
Zibetti, M., Moro, E., Krishna, V., Sammartino, F., Picillo, M., Munhoz, R. P. and Fasano, A., Low-Frequency Subthalamic Stimulation in Parkinson's Disease: Long-Term Outcome and Predictors, Brain stimulation, Vol. 9, No.5 (2016), pp.774-779.
Ziegler, K., Schroeteler, F., Ceballos-Baumann, A. O. and Fietzek, U. M., A New Rating Instrument to Assess Festination and Freezing Gait in Parkinsonian Patients, Movement disorders, Vol. 25, No.8 (2010), pp.1012-1018.