advance pricing agreement (apa) programme of india ... news...page 5 of 28 authority opening up the...
TRANSCRIPT

Advance Pricing
Agreement (APA)
Programme of India
-
Annual Report
(2016-17)
Central Board of Direct Taxes
April 2017


INDEX
Sl. No. Content Page
1. Foreword by Chairman. CBDT i
2. From the Desk of Member (L&C), CBDT ii
3. Introduction 1
4. Data and Qualitative Analyses 4
5. Conclusion 28

Page 1 of 28
ANNUAL REPORT ON INDIA’S ADVANCE PRICING AGREEMENT (APA)
PROGRAMME – 2016-17
INTRODUCTION Advance Pricing Agreement (APA) programmes are operational in a
number of countries since long. Many more countries are in the process of
establishing such programmes. The primary goal of such programmes is to
provide certainty to taxpayers in respect of the transfer price of the cross-
border transactions undertaken by such taxpayers with their group entities.
Rapid growth in international trade through an increasing number of Multi
National Enterprises (MNEs) has given rise to numerous tax disputes on the
issue of transfer pricing. An APA is a mechanism to resolve transfer pricing
disputes in advance, i.e., before the cross-border related party transaction
actually takes place. The transfer price of goods and services transacted
between group entities is decided in advance by the tax authorities and the
taxpayers, so as to prevent any dispute arising from such transfer pricing.
The Advance Pricing Agreement (APA) programme in India was
launched in 2012 vide the Finance Act, 2012 through the insertion of Sections
92CC and 92CD in the Income-tax Act, 1961. These statutory provisions,
effective from 1st July, 2012, lent the legal backing to the CBDT to enter into
Advance Pricing Agreements (APAs) with taxpayers for a maximum period of
5 years in respect of international transactions between Associated
Enterprises (AEs) to determine the Arm’s Length Price (ALP) or to specify the
manner in which the ALP is to be determined. It was stipulated that the
detailed scheme of the APA would be separately notified by the CBDT.
Vide notification no. 36/2012 [F. No. 133/5/2012-SO(TPL)]/SO 2005 (E),
dated 30th August, 2012, the APA Scheme [Rules 10F to 10T] was inserted in
the Income-tax Rules to operationalize the APA programme. Thus, the Indian
APA programme, which commenced from 1st July, 2012, actually became
functional and operational from 30th August, 2012 with the notification of the
rules. The rules lay down the detailed procedures for filing of pre-filing
consultation application; pre-filing consultation; payments of fees; filing of
APA application; processing of APA application; withdrawal of APA
application; terms and conditions of APA; filing of Annual Compliance
Report; Compliance Audit; revision, cancellation and renewal of APA; etc.
To provide clarity to taxpayers on a number of issues concerning the
APA programme, the CBDT issued a booklet containing guidance on the APA
programme and answers to Frequently Asked Questions (FAQs) as part of its
Taxpayers’ Information series.

Page 2 of 28
Roll-back of APAs was announced by the Government on 10th July,
2014. The necessary legislative changes in this regard were carried out
through the Finance (No. 2) Act, 2014. The Income-tax Rules for implementing
the Roll-back provisions were notified on 14th March, 2015 and the existing
APA Scheme got amended accordingly. The Rollback provisions are
applicable for a maximum of four years prior to the first year of the APA
period. Thus, a taxpayer would be able to have certainty in matters of
transfer pricing for a maximum period of 9 years by applying for an APA with
Rollback provisions. Circular No. 10 of 2015 was issued by the CBDT on 10th
June, 2015 to provide clarity on Rollback issues in the form of answers to FAQs.
Under our APA programme, APAs can be multilateral or bilateral
(involving CBDT and the tax authorities of one or more countries) or unilateral
(involving the CBDT only). Over the last 5 years, more than 800 applications
have been filed in India. Majority of these applications (about 85%) are for
unilateral APAs between the Indian taxpayer and the CBDT. Till 31st March,
2017, 152 agreements have been entered into (141 unilateral and 11
bilateral).
The APA applications are processed and analysed by dedicated APA
teams working under the overall supervision of Pr. CCIT (International Taxation
& Transfer Pricing). Each APA team is headed by a Commissioner of Income-
tax and the team also comprises Addl./Joint Commissioners of Income-tax
and Deputy/Asst. Commissioners of Income-tax. Presently, there are two APA
teams and the APA offices are located at Delhi, Mumbai and Bengaluru.
In respect of unilateral APAs, the position papers developed by the
APA teams are approved by the Pr. CCIT (International Taxation & Transfer
Pricing) and sent to the Central Board of Direct Taxes [CBDT] for approval. In
the CBDT, officers working in the Foreign Tax & Tax Research (FT & TR-I and II)
Divisions of the CBDT examine and process the position papers. Joint
Secretary, FT & TR-I and FT & TR-II further process the position papers and send
it for final approval of the designated Member of the CBDT. The Member
approves the final negotiating position to be adopted by the APA teams.
Once the negotiation is complete, a draft Agreement is sent to the CBDT for
approval before the Agreement is entered into between the Board and the
taxpayer. On behalf of the Board, the Agreements are entered into by either
Joint Secretary, FT & TR-I or Joint Secretary, FT & TR-II.
In respect of bilateral APAs, once the position papers are sent to the FT
& TR-I & II Divisions by the Pr. CCIT (International Taxation & Transfer Pricing),
the Competent Authority of India (either Joint Secretary, FT & TR-I or Joint
Secretary, FT & TR-II depending on the country with which the bilateral APA is
to be negotiated under the Tax Treaty) has to initiate discussions with his/her

Page 3 of 28
counterpart in the other country. The officers in the FT & TR-I & II Divisions of
the CBDT working with the Competent Authority examine the position papers
and prepare the position of the Indian Competent Authority. The same is
shared with the Competent Authority of the other country. Once positions
have been exchanged, the Competent Authorities of both the concerned
countries discuss and negotiate the terms and conditions of the APA. If they
reach an understanding, then a Mutual Agreement, containing the terms
and conditions of the APA, is entered into by the Competent Authorities of
both countries. Thereafter, each country has to enter into an Agreement with
its own taxpayer. On the Indian side, a draft Agreement is prepared in
consultation with the Indian taxpayer and the same is submitted for the
approval of the designated Member in the CBDT. After approval, the APA is
entered into by either Joint Secretary, FT & TR-I or Joint Secretary, FT & TR-II
(the concerned Competent Authority of India) with the taxpayer on behalf of
the CBDT.
This Annual Report is an initiative of the CBDT to bring into the public
domain various statistical and qualitative aspects of India’s APA programme,
with a view to encouraging discussion and debate amongst taxpayers,
policy makers, media, economists, etc. on the strengths and weaknesses of
the programme. This is the first such Annual Report by CBDT on one of its
programmes and that lends uniqueness to the report. The first Annual Report
on the APA programme could not have been published for a year better
than 2016-17, a year in which the CBDT managed to enter into 88 APAs. This is
a phenomenal achievement by the CBDT and its officers working in the
Foreign Tax & Tax Research Division and in the APA teams at the field level
[comprising the Principal CCIT (IT & TP), APA Commissioners, Additional/Joint
Commissioners and Deputy/Assistant Commissioners]. The CBDT
acknowledges the cooperation and efforts of the applicants and their
consultants in making the APA programme a success.
This Annual Report is also unique because it actually condenses the first
five years of the programme (1st July, 2012 to 31st March, 2017) into one
report. This was necessary to lend proper perspective to the programme and
also to cover all the years in one document. It would be the CBDT’s
endeavour to come out with regular Annual Reports every year henceforth.

Page 4 of 28
DATA AND QUALITATIVE ANALYSES
A. GENERAL ANALYSIS
A.1. Number of Applications Filed
The table and the graph below depict the number of applications that have
been filed so far.
Table A.1
Financial Year (F.Y) UAPA BAPA Total
2012-13 117 29 146
2013-14 206 26 232
2014-15 192 14 206
2015-16 113 19 132
2016-17 78 21 99
Total 706 109 815
Graph A.1
The figures clearly show an overwhelming preference for unilateral APA
applications. The primary reason for this is obvious. As the US Competent
Authority was not admitting bilateral APA applications into its APA
programme, Indian subsidiaries of US-based companies (who are present in
large numbers in India) were forced to seek certainty on their international
transactions through unilateral APAs. However, with the US Competent
117
206 192
113
78
29 26 14 19 21
0
50
100
150
200
250
2012-13 2013-14 2014-15 2015-16 2016-17
No
. o
f A
pp
lica
tio
ns
file
d
Financial Year
Number of Applications Filed
Unilateral
APA
Biilateral
APA

Page 5 of 28
Authority opening up the bilateral APA programme between the two
countries from February, 2016, there has been an increase in the number of
bilateral applications and also in the number of conversions of applications
from unilateral to bilateral.
A.2. Status of Applications Filed
The table and the graph below depict the status of applications [as on 31st
March, 2017] that have been filed so far.
Table A.2
F.Y (A)
No. of
Applications
Filed
(B)
No. of
Agreements
Signed out
of (A)
(C)
No. of
Applications
disposed off out
of (A) due to
other reasons
(D)
No. of
Applications
Under
Processing out
of (A)
2012-13 146 68 12 66
2013-14 232 66 5 161
2014-15 206 15 1 190
2015-16 132 3 1 128
2016-17 99 0 0 99
Total 815 152 19 644
Graph A.2
146
232
206
132
99
68 66
15 3 0
11 5 1 1 0
67
161
190
128
99
0
50
100
150
200
250
2012-13 2013-14 2014-15 2015-16 2016-17
Financial Year
Status of APA Applications Filed
No. of
Applications
Filed
No. of
Agreements
Signed
No. of
Applications
disposed of due
to other reasons
No. of
Applications
Under
Processing

Page 6 of 28
The statistics on nature of applications filed – unilateral or bilateral – is pretty
dynamic because applicants come up with frequent requests for conversion
from unilateral to bilateral. Requests for conversion of bilateral applications to
unilateral have been rare and so far only one bilateral application filed in
2013-14 has been converted into a unilateral application.
Over the last few years and as on 31st March, 2017, 19 unilateral applications
filed in different years have been converted to bilateral applications. During
the same period, one bilateral application has been converted to a
unilateral application. As a result, there has been a net increase of 18
bilateral applications over the original number of applications filed.
The reasons for disposal of applications, other than by signing, include
withdrawal of applications by the applicants and merger of multiple
applicants with each other resulting in signing of fewer Agreements than the
number of applications filed.
A.3 Agreements Signed: Year-wise
The table and the graph below depict the number of Agreements that have
been entered into so far, year-wise.
Table A.3
F.Y Agreements Signed
2013-14 5
2014-15 4
2015-16 55
2016-17 88
Total 152
Graph A.3
5 4
55
88
0
20
40
60
80
100
2013-14 2014-15 2015-16 2016-17
No
. o
f A
gre
em
en
ts S
ign
ed
Financial Year
Agreements Signed - Year-wise

Page 7 of 28
It can be clearly seen that, as the APA programme has attained maturity, the
number of Agreements signed has gone up significantly. In 2016-17, 88 APAs
were concluded, which is probably the highest number of APAs entered into
by any jurisdiction world-wide in the same period.
It makes for an interesting comparison that while India has concluded 152
APAs in 4 years, China has entered into 113 APAs in the ten years between
2005 and 2014.
An interesting and important data relates to the number of years for which
tax certainty on transfer pricing matters has been achieved by this
programme. Through the 152 APAs entered into so far, CBDT has managed to
provide cumulative tax certainty of 1010 years to these 152 taxpayers. These
1010 years include 277 years covered under the Rollback period of the
concluded APAs. 78 Agreements – out of the 152 entered into so far - have
Rollback provisions.
In the 152 Agreements entered into till date, 6 have been entered into with
non-resident taxpayers while the remaining are with resident Indian
taxpayers.
B. UNILATERAL APAs
B.1 Applications Filed (Original and Post-Conversion)
As mentioned earlier, unilateral applications have been favoured more by
the taxpayers. As also mentioned earlier, this trend is slowly undergoing a
change with the operationalisation of the India-USA bilateral APA
programme. As can be seen in the table below, 706 unilateral applications
were originally filed. It needs to be clarified that where an application has
requests for both unilateral and bilateral APAs, the application is counted as
a bilateral application.
Table B.1
F.Y Applications (Original) Applications (Post-Conversion)
2012-13 117 110
2013-14 206 204
2014-15 192 183
2015-16 113 113
2016-17 78 78
Total 706 688

Page 8 of 28
Graph B.1
As mentioned earlier in the report, there has been a net increase of 18 in the
number of bilateral applications due to conversions from unilateral to
bilateral. Correspondingly, the number of unilateral applications filed
originally has also come down by the same number.
B.2 Status of Unilateral Applications Filed
The table and the graph below depict the status of unilateral applications [as
on 31st March, 2017] that have been filed so far.
Table B.2
F.Y (A)
No. of
Applications Filed
(Post-Conversion)
(B)
No. of
Agreements
Signed out
of (A)
(C)
No. of
Applications
Disposed off
out of (A) due
to other
reasons
(D)
No. of
Applications
under
Processing
out of (A)
2012-13 110 58 5 47
2013-14 204 65 5 134
2014-15 183 15 1 167
2015-16 113 3 1 109
2016-17 78 0 0 78
Total 688 141 12 535
117
206 192
113
78
110
204
183
113
78
0
50
100
150
200
250
2012-13 2013-14 2014-15 2015-16 2016-17
No
. o
f A
pp
lic
atio
ns
Financial Year
Unilateral APA Applications
Applications
(Original)
Applications
(After
Conversions)

Page 9 of 28
Graph B.2
B.3 Agreements Signed: Year-wise
The table and the graph below show the number of unilateral APAs entered
into in the last 4 years. The increase in the number of Agreements signed in
2016-17 is very significant.
Table B.3
F.Y Agreements Signed
2013-14 5
2014-15 3
2015-16 53
2016-17 80
Total 141
110
204
183
113
78
58 65
15 3 0 5 5 1 1 0
47
134
167
109
78
0
50
100
150
200
250
2012-13 2013-14 2014-15 2015-16 2016-17
Ap
plic
atio
ns
Financial Year
Status of UAPA Applications No. of
Applications
Filed
No. of
Agreements
Signed
No. of
Applications
disposed of due
to other reasons
No. of
Applications
under Processing
Page 10 of 28
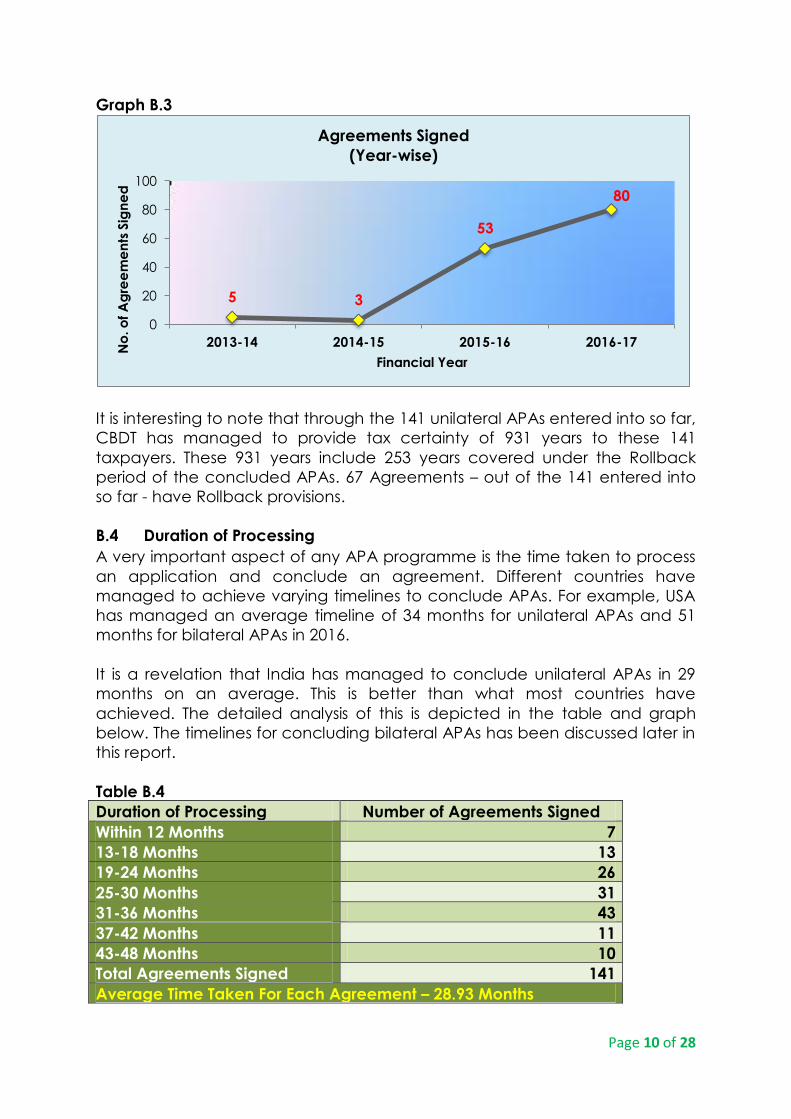
Graph B.3
It is interesting to note that through the 141 unilateral APAs entered into so far,
CBDT has managed to provide tax certainty of 931 years to these 141
taxpayers. These 931 years include 253 years covered under the Rollback
period of the concluded APAs. 67 Agreements – out of the 141 entered into
so far - have Rollback provisions.
B.4 Duration of Processing
A very important aspect of any APA programme is the time taken to process
an application and conclude an agreement. Different countries have
managed to achieve varying timelines to conclude APAs. For example, USA
has managed an average timeline of 34 months for unilateral APAs and 51
months for bilateral APAs in 2016.
It is a revelation that India has managed to conclude unilateral APAs in 29
months on an average. This is better than what most countries have
achieved. The detailed analysis of this is depicted in the table and graph
below. The timelines for concluding bilateral APAs has been discussed later in
this report.
Table B.4
Duration of Processing Number of Agreements Signed
Within 12 Months 7
13-18 Months 13
19-24 Months 26
25-30 Months 31
31-36 Months 43
37-42 Months 11
43-48 Months 10
Total Agreements Signed 141
Average Time Taken For Each Agreement – 28.93 Months
5 3
53
80
0
20
40
60
80
100
2013-14 2014-15 2015-16 2016-17
No
. o
f A
gre
em
en
ts S
ign
ed
Financial Year
Agreements Signed
(Year-wise)

Page 11 of 28
Graph B.4
As can be seen from the above data, India has been very proactive in
concluding unilateral APAs. In fact, more than 80% of the APAs entered into
have been concluded within 3 years of the filing of applications and more
than 30% have been entered into within 2 years.
B.5 Distribution of Agreements Signed – Economic Activity-wise
The table and graph below capture the data regarding the economic
activity or the pre-dominant economic activity in each of the unilateral APAs
entered into.
Table B.5
Sl. No. Economic Activity No. of Agreements Signed
1 Service 102
2 Manufacturing 34
3 Trading 1
4 Diversified 4
Total 141
0
5
10
15
20
25
30
35
40
45
Within 12
Months
13-18
Months
19-24
Months
25-30
Months
31-36
Months
37-42
Months
43-48
Months
7
13
26
31
43
11 10
No
. o
f A
gre
em
en
ts S
ign
ed
Duration
Duration of Processing

Page 12 of 28
Graph B.5
It is very clear from the above data that the service sector of the Indian
economy has been overwhelmingly covered in the unilateral APAs. This is
probably on expected lines because the service sector is the largest
contributor to India’s Gross Domestic Product and is also at the forefront of
India’s international trade, which in turn, raises a number of issues around the
transfer pricing of such transactions.
B.6 Distribution of Agreements Signed – Industry-wise
The table and graph below provide information regarding the various
industries covered in each of the unilateral APAs entered into. It can be
clearly seen that almost 50% (70 out of 141) of the total unilateral Agreements
entered into are with the Information Technology and Banking/Finance
industries. This is consistent with the trend seen in our previous analysis of the
economic activity covered in the unilateral APAs.
It is also a positive sign that the APAs are not only about a few industries. As
can be seen, there are 20 different types of industries that have availed the
Indian APA programme.
Diversified
3%
Manufacturing
24%
Service
72%
Trading
1%
Distribution of Agreements
(Economic Activity-wise)

Page 13 of 28
Table B.6
Sl. No. Industry No. of Agreements
Signed
1 Information Technology 41
2 Banking & Finance 29
3 Industrial/Commercial Goods Manufacture 16
4 Pharmaceutical 10
5 Consumer Goods Manufacture 6
6 Oil & Gas 6
7 Engineering Services 5
8 Telecommunication 5
9 Foods & Beverages 3
10 Power & Energy 3
11 Shipping 3
12 Automobile 2
13 Healthcare 2
14 Infrastructure & Real Estate 2
15 Media & Communication 2
16 Textile 2
17 Chemical 1
18 Forestry 1
19 Tourism & Hospitality 1
20 Trading & Logistics 1
Total 141

Page 14 of 28
Graph B.6
B.7 Nature of Transactions Covered
The table and graph below provide information about the nature of
international transactions covered in the unilateral APAs entered into. It can
be seen that there are as many as 29 types of international transactions that
have been covered in the unilateral APAs. A total of 292 international
transactions have been covered under these 141 APAs entered into so far.
Provision of Software Development (SWD) Services and provision of IT
enabled Services (ITeS) feature predominantly in the APAs entered into. This is
on expected lines because a majority of the APA applications have included
such transactions to be covered under the Agreements.
Information
Technology
29%
Banking & Finance
21%
Industrial/Commercial
Goods Manufacture
11%
Pharmaceutical
7%
Oil & Gas
4%
Consumer Goods
Manufacture
4%
Engineering Services
4%
Telecommunication
4%
Others
3%
Shipping
2%
Power & Energy
2%
Foods & Beverages
2%
Media &
Communication
1% Healthcare
1%
Textile
1%
Automobile
1% Infrastructure & Real
Estate
1%
Distribution of Agreements
Industry-wise

Page 15 of 28
Table No. B.7
Sl. No. Nature of Transactions No. of
Transactions
1 Provision of SWD Services 45
2 Provision of IT enabled Services 40
3 Intra-group Payments 33
4 Sale of Goods 30
5 Purchase of Goods 22
6 Provision of Investment Advisory Services 17
7 Interest Payment 13
8 Provision of Business Support Services 12
9 Provision of Marketing Support Services 9
10 Provision of Engineering Design Services 9
11 Provision of Technical Services 9
12 Other Payments 6
13 Provision of R&D Services 5
14 Distribution/Trading of Goods 4
15 Interest Receipts 4
16 Other Receipts 4
17 Provision of Corporate Guarantee 4
18 Royalty Payments 4
19 Provision of KPO Services 3
20 Provision of Management Services 3
21 Provision of Other Services 3
22 Royalty Receipts 3
23 Forward Contracts 2
24 Intra-group Receipts 2
25 Provision of Engineering Services 2
26 Commission Payments 1
27 Commission Receipts 1
28 Payment of Corporate Guarantee Fees 1
29 Transfer of Shares 1
Total 292

Page 16 of 28
Graph B.7
1
1
1
1
2
2
2
3
3
3
3
4
4
4
4
4
5
6
9
9
9
12
13
17
22
30
33
40
45
0 5 10 15 20 25 30 35 40 45 50
Commission Receipts
Payment of Corporate Guarantee Fees
Transfer of Shares
Commission Payments
Provision of Engineering Services
Forward Contracts
Intra-group Receipts
Royalty Receipts
Provision of KPO Services
Provision of Other Services
Provision of Management Services
Other Receipts
Distribution/Trading of Goods
Interest Receipts
Royalty Payments
Provision of Corporate Guarantee
Provision of R&D Services
Other Payments
Provision of Engineering Design Services
Provision of Technical Services
Provision of Marketing Support Services
Provision of Business Support Services
Interest Payments
Provision of Investment Advisory Services
Purchase of Goods
Sale of Goods
Intra-group Payments
Provision of IT enabled Services
Provision of SWD Services
No. of Transactions
Nature of Covered Transactions

Page 17 of 28
B.8 Transfer Pricing Methods Used
Taxpayers request tax authorities for an APA so that they can achieve
certainty about the transfer pricing method and/or the Arm’s Length Price
(ALP) to be used to benchmark their international transactions. It is interesting
to see which transfer pricing methods have been used more frequently in the
unilateral APAs concluded so far. The table and graph below throw light on
that.
Table B.8
Sl. No. Transfer Pricing Method No. of Transactions
1 TNM Method 213
2 Other Method 43
3 CUP Method 25
4 Cost Plus Method 4
5 Internal TNM Method 2
6 Residual Profit Split Method 2
7 Resale Price Method 2
8 Profit Split Method 1
Total 292
Graph B.8
0
50
100
150
200
250
TNM
Method Other
Method CUP
Method Cost Plus
Method Resale
Price
Method
Residual
Profit
Split
Method
Internal
TNM
Method
Profit
Split
Method
213
43
25
4 2
2 2
1
No
. o
f Tr
an
sac
tio
ns
Transfer Pricing Methods Adopted

Page 18 of 28
B.9 Location of Associated Enterprises (AEs)
The 141 APAs entered into so far have left their footprints on 118 countries
where the AEs of the Indian applicant company are located. This is as
widespread as one could possibly imagine and also reflects the truly global
reach of Multi National Enterprises (MNEs).
The table below lists all the 118 countries and shows the number of APAs in
which AEs located in these countries have been covered. Not surprisingly,
USA tops the list and finds its entities in 93 APAs.
Table B.9
Sl.
No.
Countries No. of
Agreements
1 USA 93
2 UK 55
3 Singapore 44
4 China 33
5 The Netherlands 29
6 Japan 28
7 Australia 27
8 Hong Kong 27
9 Canada 26
10 Germany 25
11 Malaysia 22
12 France 21
13 UAE 18
14 Indonesia 17
15 Denmark 15
16 Belgium 14
17 Brazil 14
18 Poland 14
19 Switzerland 14
20 Ireland 13
21 Italy 13
22 Philippines 13
23 Spain 13
24 India 12
25 Norway 12
26 Thailand 12
27 Finland 11
28 Korea 11
29 Mauritius 11
30 Sweden 11
31 Czech Republic 10
32 Mexico 10
33 South Africa 10
34 Vietnam 10
35 Portugal 9
36 Russia 9
37 Taiwan 9
38 Luxembourg 8
39 Sri Lanka 8
40 Austria 7
41 Greece 7
42 Turkey 7
Sl.
No.
Countries No. of
Agreements
43 Argentina 6
44 Chile 6
45 Egypt 6
46 Hungary 6
47 Peru 6
48 Ukraine 6
49 Bangladesh 5
50 Bermuda 5
51 Nigeria 5
52 Romania 5
53 Saudi Arabia 5
54 Croatia 4
55 Estonia 4
56 Israel 4
57 Kazakhstan 4
58 Latvia 4
59 Lithuania 4
60 Malta 4
61 Morocco 4
62 Pakistan 4
63 Slovakia 4
64 Algeria 3
65 Bahamas 3
66 Columbia 3
67 Costa Rica 3
68 Ghana 3
69 Jersey Channel
Islands
3
70 Kenya 3
71 New Zealand 3
72 Venezuela 3
73 Bahrain 2
74 Barbados 2
75 British Virgin Islands 2
76 Bulgaria 2
77 Colombia 2
78 Ecuador 2
79 Iceland 2
80 Isle of Man 2
81 Ivory Coast 2
82 Lebanon 2
83 Panama 2
84 Paraguay 2

Page 19 of 28
Sl.
No.
Countries No. of
Agreements
85 Qatar 2
86 Scotland 2
87 Senegal 2
88 Serbia 2
89 Trinidad and
Tobago
2
90 Tunisia 2
91 Uganda 2
92 Uruguay 2
93 Angola 1
94 Belarus 1
95 Brunei 1
96 Cameroon 1
97 Cayman Islands 1
98 Congo 1
99 Cyprus 1
100 Ethiopia 1
101 Gabon 1
Sl.
No.
Countries No. of
Agreements
102 Guatemala 1
103 Honduras 1
104 Jamaica 1
105 Kuwait 1
106 Madagascar 1
107 Malawi 1
108 Mozambique 1
109 North Africa 1
110 Oman 1
111 Puerto Rico 1
112 Scandinavia 1
113 Seychelles 1
114 Sierra Leone 1
115 Slovenia 1
116 Tanzania 1
117 Uzbekistan 1
118 Zambia 1

Page 20 of 28
C. BILATERAL APAs
C.1 Applications Filed (Original and Post-Conversion)
The number of original and post-conversion bilateral APA applications filed is
given in the table and graph below.
Table C.1
F.Y Applications (Original) Applications (Post-Conversion)
2012-13 29 36
2013-14 26 28
2014-15 14 23
2015-16 19 19
2016-17 21 21
Total 109 127
Graph C.1
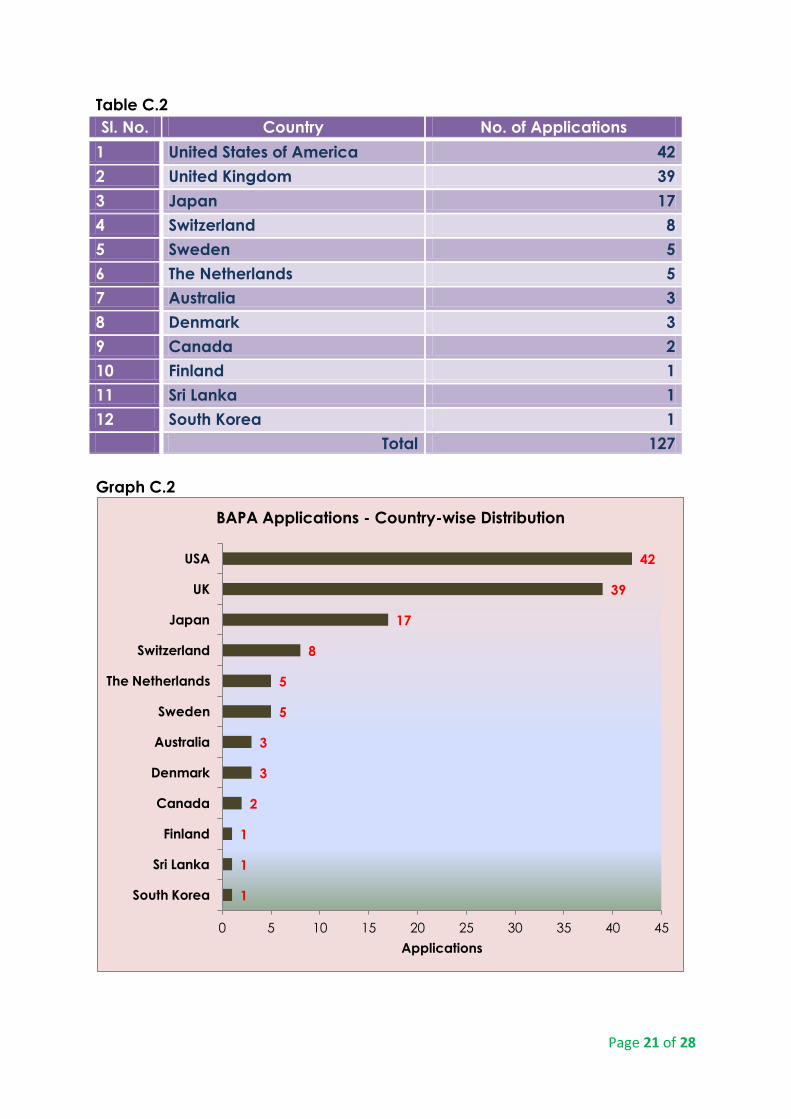
C.2 Applications – Country-wise Distribution
The table and graph below provide the distribution of bilateral APA
applications according to the country with which the APA terms and
conditions are to be negotiated and finalised. In the initial years of the APA
programme, United Kingdom (UK) and Japan were leading the list because
there was no bilateral APA programme available with the United States of
America (USA). However, once the USA opened its bilateral APA programme
with India in February, 2016, the applications for India-USA bilateral APAs
have increased.
29
26
14
19 21
36
28
23
19 21
0
5
10
15
20
25
30
35
40
2012-13 2013-14 2014-15 2015-16 2016-17
No
. o
f A
pp
lica
tio
ns
Financial Year
Bilateral APA Applications
Applications
(Original)
Applications
(After
Conversions)
Page 21 of 28
Table C.2
Sl. No. Country No. of Applications
1 United States of America 42
2 United Kingdom 39
3 Japan 17
4 Switzerland 8
5 Sweden 5
6 The Netherlands 5
7 Australia 3
8 Denmark 3
9 Canada 2
10 Finland 1
11 Sri Lanka 1
12 South Korea 1
Total 127
Graph C.2
1
1
1
2
3
3
5
5
8
17
39
42
0 5 10 15 20 25 30 35 40 45
South Korea
Sri Lanka
Finland
Canada
Denmark
Australia
Sweden
The Netherlands
Switzerland
Japan
UK
USA
Applications
BAPA Applications - Country-wise Distribution

Page 22 of 28
C.3 Status of Applications Filed (Post-Conversion)
The table and graph below show the status of the bilateral APA applications
[as on 31st March, 2017] filed so far.
Table C.3
F.Y (A)
No. of
Applications
Filed
(B)
No. of
Agreements
Signed out of
(A)
(C)
No. of
Applications
Disposed off out
of (A) due to
other reasons
(D)
No. of
Applications
under
Processing
out of (A)
2012-13 36 10 7 19
2013-14 28 1 0 27
2014-15 23 0 0 23
2015-16 19 0 0 19
2016-17 21 0 0 21
Total 127 11 7 109
Graph C.3
It is interesting to note that through the 11 bilateral APAs entered into so far,
CBDT has managed to provide tax certainty of 82 years to these 11
taxpayers. These 82 years include 27 years covered under the Rollback
period of the concluded APAs.
36
28
23
19
21
10
1 0 0 0
7
0 0 0 0
19
27
23
19
21
0
5
10
15
20
25
30
35
40
2012-13 2013-14 2014-15 2015-16 2016-17
Ap
plic
atio
ns
Financial Year
Status of BAPA Applications
(Post-Conversion)
No. of
Applications Filed
No. of Agreements
Signed
No. of
Applications
disposed of due to
other reasons
No. of of
Applications
under Processing
Page 23 of 28
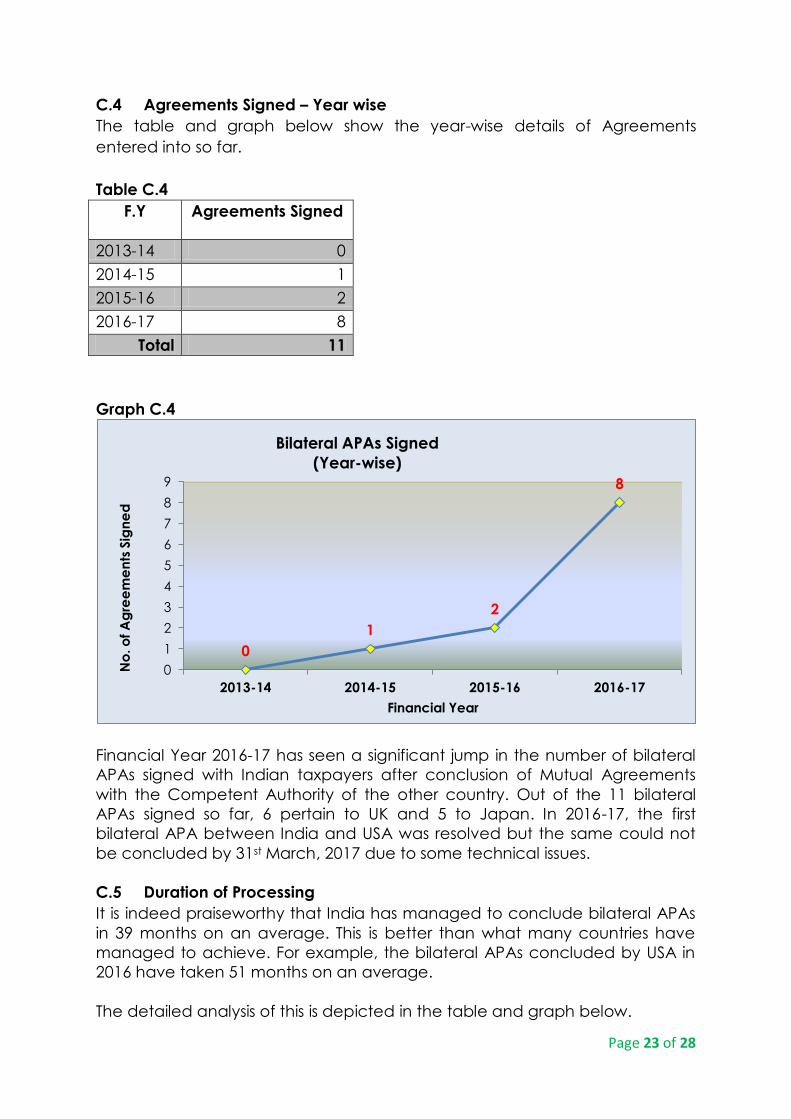
C.4 Agreements Signed – Year wise
The table and graph below show the year-wise details of Agreements
entered into so far.
Table C.4
F.Y Agreements Signed
2013-14 0
2014-15 1
2015-16 2
2016-17 8
Total 11
Graph C.4
Financial Year 2016-17 has seen a significant jump in the number of bilateral
APAs signed with Indian taxpayers after conclusion of Mutual Agreements
with the Competent Authority of the other country. Out of the 11 bilateral
APAs signed so far, 6 pertain to UK and 5 to Japan. In 2016-17, the first
bilateral APA between India and USA was resolved but the same could not
be concluded by 31st March, 2017 due to some technical issues.
C.5 Duration of Processing
It is indeed praiseworthy that India has managed to conclude bilateral APAs
in 39 months on an average. This is better than what many countries have
managed to achieve. For example, the bilateral APAs concluded by USA in
2016 have taken 51 months on an average.
The detailed analysis of this is depicted in the table and graph below.
0
1
2
8
0
1
2
3
4
5
6
7
8
9
2013-14 2014-15 2015-16 2016-17
No
. o
f A
gre
em
en
ts S
ign
ed
Financial Year
Bilateral APAs Signed
(Year-wise)

Page 24 of 28
Table C.5
Duration of Processing Number of Agreements Signed
Within 12 Months 0
13-24 Months 1
25-36 Months 3
37-48 Months 7
Total Agreements Signed 11
Average Time Taken For Each Agreement – 39.09 Months
Graph C.5
C.6 Distribution of Agreements – Economic Activity-wise
The table and graph below capture the data regarding the economic
activity or the pre-dominant economic activity in each of the bilateral APAs
entered into.
Table C.6
Sl. No. Economic Activity No. of Agreements Signed
1 Trading 5
2 Manufacturing 2
3 Service 4
Total 11
0
2
4
6
8
1-12
Months 13-24
Months 25-36
Months 37-48
Months
0 1 3
7
No
.of A
gre
em
en
ts S
ign
ed
Duration
Duration of Processing of BAPA Applications

Page 25 of 28
Graph C.6
Unlike in unilateral APAs, where the service sector of the Indian economy has
been overwhelmingly covered, in bilateral APAs it is the trading activity that
has found marginally more coverage than the service sector.
C.7 Distribution of Agreements – Industry-wise
Table C.7
Sl. No. Industry No. of Taxpayers
1 General Trading 5
2 Automobile 2
3 Telecommunication 4
Total 11
Graph C.7
Manufacturing
2
Service
4
Trading
5
Distribution of Agreements
(Economic Activity-wise)
0
2
4
6
Automobile
Telecommunication Trading
2
4
5
Distribution of Agreements
(Industry-wise)

Page 26 of 28
The table and the graph above reveal that only three broad industry
categories have so far been covered under bilateral APAs. This is primarily
due to the small number of bilateral APAs concluded till 31st March, 2017.
C.8 Nature of Covered Transactions
Table C.8
Sl. No. Nature of the Transaction No. of Transactions
1 Availing of Intra-Group Services 7
2 Purchase and Sale of Goods 5
3 Provision of Marketing/Sales Support
Services
5
4 Receipt of Commission Fee 2
5 Payment of Royalty Fee 2
6 Provision of IT enabled Services 1
Total 22
Graph C.8
It is interesting to note from the above table and graph that – unlike unilateral
APAs entered into till 31st March, 2017 – provision of software development
services does not figure at all as a covered transaction in the bilateral APAs
concluded by the CBDT. Availing of intra-group services by the Indian
applicants has been the most covered international transaction in the
bilateral APAs.
1
2
2
5
5
7
0 1 2 3 4 5 6 7 8
Provision of IT enabled Services
Receipt of Commission Fee
Payment of Royalty Fee
Provision of Marketing/Sales Support Services
Purchase and Sale of Goods
Availing of Intra-Group Services
No. of Transactions
Nature of Covered Transactions

Page 27 of 28
C.9 Transfer Pricing Methods Adopted
As can be seen from the data below, TNMM is the most preferred transfer
pricing method to be adopted in the bilateral APAs entered into till 31st
March, 2017. This is similar to the trend in unilateral APAs.
Table C.9
Sl. No. Transfer Pricing Method No. of Transactions
1 TNM Method 20
2 CUP Method 2
Total 22
Graph C.9
0
5
10
15
20
CUP Method
TNM Method
2
20
No
. o
f Tr
an
sac
tio
ns
Methodology
Transfer Pricing Methods Adopted

Page 28 of 28
CONCLUSION The Indian APA programme has matured over the past five years and
the number of agreements getting signed is testimony to that. Complex
transfer pricing issues, which were prone to long drawn litigation, are being
increasingly resolved through APAs. The resolutions have been to the
satisfaction of both taxpayers and the Government. While taxpayers have
managed to get certainty over transfer pricing issues for five or nine years
(depending upon whether rollback provisions are applicable to an
agreement), the Government has been able to divert resources away from
the audit and litigation processes to more productive work. More importantly,
APAs are also ensuring that the Government gets assured revenues from big
taxpayers on the basis of the terms and conditions embedded in the
Agreements. For example, in the case of a global IT behemoth, the Indian
entity declared more than Rs. 5,000 Crore as additional income after entering
into an APA with the CBDT recently. This translates to a tax payment of more
than Rs. 1,500 Crore without getting into any litigation or there being any
dispute.
The Indian APA programme is poised to move ahead quicker than it has
done so far. The Government is aware of the benefits of the programme and
how it is helping in creating a conducive environment for global corporate
giants to do business in India. In view of this, the Government is committed to
strengthen the programme by providing it with adequate human and
physical resources. All this augurs well for both the taxpayers and the tax
administration.