adult health morbidity
TRANSCRIPT

8/3/2019 Adult Health Morbidity
http://slidepdf.com/reader/full/adult-health-morbidity 1/17
Gender Disparities in Adult Health: An Examination of Three Measures of Morbidity*
BRIDGET K. GORMAN Rice University
JEN’NAN GHAZAL READ
University of California, Irvine
Journal of Health and Social Behavior 2006, Vol 47 (June): 95–110
Recent examinations of gender differences in physical health suggest that women’s disadvantage may be smaller than previously assumed, varying byhealth status measure and age. Using data from the 1997–2001 National Health
Interview Surveys, we examine gender-by-age differences in life-threatening
medical conditions, functional limitations, and self-rated health and considerwhether potential mediating mechanisms (e.g., socioeconomic status, behav-
ioral factors) operate uniformly across health measures. The results show that
the gender gap is smallest for life-threatening medical conditions and that mendo increasingly worse with age. For self-rated health, men are more likely to
report excellent health at younger ages, but with increasing age this gap clos-es. Only for functional limitations do we find a consistent pattern of female dis-advantage: Women report more functional limitations than men, and the gap
increases with age. The ability of explanatory mechanisms to account for these patterns varies by the health measure examined.
It is an accepted fact that women live longer than men. In 2001, life expectancy at birth inthe United States was 5.5 years longer for
women than for men—79.8 years versus 74.3years, respectively (Arias 2004). The relation-ship between gender and morbidity is morecomplex, with women experiencing poorer health than men on a variety of outcomes(Rieker and Bird 2000; Verbrugge 1985).Recent examinations of this paradox suggestthat gender differences in health may be small-er than previously assumed, varying by health
status measure and age (Arber and Cooper 1999, 2000; Hunt 2002; Macintyre, Hunt, and
Sweeting 1996). Nevertheless, the picture o
near-constant female excess in morbidity pe
sists in the general literature, in part becaus
few studies examine gender differences acros
health measures by age.
Accordingly, this paper extends prio
research to examine gender differences i
physical health across three measures of healt
status at different ages of adulthood. Usin
data from the 1997 through 2001 waves of th
National Health Interview Survey, we provid
a systematic assessment of gender differencein life-threatening medical conditions, func
ti l li it ti d lf t d h lth i i
8/3/2019 Adult Health Morbidity
http://slidepdf.com/reader/full/adult-health-morbidity 2/17
GENDER AND THE MORBIDITYPARADOX
Women report worse health than mendespite the fact that they live longer (Verbrugge 1985), a phenomenon known asthe “morbidity paradox.” Some portion of thefemale disadvantage in health status is driven by the fact that the female population in theUnited States is older than the male popula-tion, and research has shown that the longer life span of women is a direct cause of their poorer health at older ages (Crimmins, Kim,and Hagedorn 2002; Crimmins, Hayward, and Saito 1996). However, gender differences in
health reflect more than variations in the agestructure of the male and female populations.Medical sociologists have long argued that biomedical research, which focuses on physio-logical differences between men and women,ignores the manner in which gender as a socialconstruct affects the physical health of menand women. Mounting evidence indicates thatgendered inequities in health are just one con-sequence of a stratification system that differ-entially allots opportunities to men and womenin a way that affects their quality of life(Denton, Prus, and Walters 2004; Ross and Bird 1994). Men and women occupy differentsocial-structural locations that mediate their exposure to risks that are harmful to health,their participation in health-damaging behav-iors, and their access to goods and resourcesthat promote well-being (Bird and Rieker
1999).Socioeconomic status (SES) is a key mech-anism through which these goods and resources are distributed (Denton and Walters1999; Ross and Bird 1994). In general, personsof lower SES report worse health, in part because they are exposed to more hardship and stress and have limited access to resources thatcan be used to prevent and cure disease (Rossand Bird 1994; Walters, McDonough, and
Strohschein 2002). Women are more likelythan men to work part time, participate in
considered, gender disparities in health ar
often substantially reduced (e.g., Bird an
Fremont 1991).
Differential participation in health-damag
ing behaviors is also important. The healt
risks incurred by smoking (U.S. Department oHealth and Human Services 2000) and bein
overweight or obese (Calle et al. 1999) are we
documented, while exercise (Tanasescu et a
2002) and moderate drinking (Ellison 2002
are positively associated with health. Men ar
more likely to smoke than women, althoug
this difference is essentially nonexistent at th
youngest ages (Barbeau, Krieger, an
Soobader 2004; Wallace et al. 2003). Men alsdrink more, and more often, than wome
(Johnson et al. 1998; York, Welte, and Hirsc
2003), and they are more likely to be over
weight (Galuska et al. 1996; Verbrugge 1989
However, men are healthier in terms of exer
cise, as they more frequently engage in phys
cal activities such as walking and strenuou
exercise (Ross and Bird 1994; Trost et a
2002).Psychosocial factors are additional mecha
nisms by which gendered social condition
disadvantage women’s health. Women ar
more likely than men to experience stressfu
life events and chronic stressors in everyda
life (which are linked to SES) that in tur
increase their likelihood of depression
Depression is directly linked with poore
health through decreased immune functioninand heightened blood pressure; depression
indirectly linked to poorer health throug
increased participation in unhealthy behavior
such as excessive drinking, lack of exercise
and smoking (for a review see Ross and Bir
1994); and research has demonstrated tha
women have higher rates of depressive diso
ders than men (Mirowsky and Ross 1992
Rieker and Bird 2000).Finally, it is important to consider othe
comorbid conditions as men and women diffe
96 JOURNAL OF HEALTH AND SOCIAL BEHAVIO
— — . — -

8/3/2019 Adult Health Morbidity
http://slidepdf.com/reader/full/adult-health-morbidity 3/17
GENDER DISPARITIES BY HEALTHMEASURE AND AGE
Recent critiques of the morbidity paradoxinvolve two assessments (Allandale and Hunt
2000; Hunt 2002). The first criticism is that past studies focus on explaining the paradoxwithout empirically establishing gender differ-ences in a range of health outcomes.Examinations across health measures suggestthat gender differences in morbidity may bemore modest than previously assumed (Lahelma and Rahkonen 1997; Macintyre etal. 1996). Further, much work has been limited to bivariate associations between gender and
health and has failed to explore whether poten-tial explanatory mechanisms (e.g., socioeco-nomic status) vary by health status measure(e.g., Clark, Stump, and Wolinsky 1997;Wingard et al. 1989). As a result, there areimportant gaps not only in our understandingof the uniformity of gender disparities but alsoin our understanding of the relative importanceof mediating influences across health status
measures.The second criticism addresses the lack of
attention given to age. As noted by Arber and Cooper (2000): “Age and gender differences inhealth are likely to reflect the socially con-structed nature of gender roles and expecta-tions regarding chronological age. We maytherefore expect the nature of inequalities inhealth for men and women to vary for differentage groups” (p. 123). It is surprising that age isoften glossed over, because we have known for some time that age is central to our under-standing of gender differences in health(Verbrugge 1985, 1986).
Life-Threatening Medical Conditions
The number of chronic health conditions
that men and women experience increases withage, but men and women differ substantially inth t f bl th d l (G l ik t
tions that plague them begin to emerge iforce.
Earlier work attributed the higher rate olife-threatening medical conditions amonmen to differences in health behaviors, whicinclude more smoking and alcohol consumption (Verbrugge 1985). Since then, others havdocumented gender differences in a variety ochronic medical conditions, including canceheart disease, and hypertension (Crimmins eal. 2002; Macintyre et al. 1996; Wingard et a1989), although none of these explored the rolthat gender disparities in health behaviors (oin any other explanatory factor) played iexplaining the gender disparity.
Functional Limitations
Disability is another important componenof health. Regardless of measuremenresearch has been quite consistent in documenting the higher rate of disability amonwomen (Lubitz et al. 2003; Merrill et al. 1997 Newman and Branch 2001). In this article w
examine gender differences in the number oreported functional limitations. Studies havclearly shown an elevated rate of functionalimitations among older women (Marks 1996Merrill et al. 1997), and even among the elderly the size of the gender gap rises with age Newman and Brach (2001) report that the gender gap in functional limitations rises with agclimbing to a 15-point differential among pe
sons ages 85 and older, where 65.6 percent owomen report at least one functional limitation, compared to 50.0 percent of men. Studiethat include younger adults also demonstratan elevated rate of functional limitationamong women (Wingard et al. 1989Verbrugge 1985).
Past studies, though informative, have faileto investigate why physical functioning variefor men and women at different ages. On
plausible explanation that has not receivrecent empirical scrutiny is that women’s high
GENDER DISPARITIES IN ADULT HEALTH 9
— — . — -

8/3/2019 Adult Health Morbidity
http://slidepdf.com/reader/full/adult-health-morbidity 4/17
ing of functional problems by men and womenhas also been suggested, but research hasshown that self-reports of functional limita-tions are accurate for both men and women(Merrill et al. 1997).
Self-Rated Health
Self-rated health differs from the previousmeasures in that self-perceptions of overallhealth are more broad and inclusive than spe-cific measures of health or impairment (Idler and Benyamini 1997). While nonspecific withregard to the actual ailment, global self-assess-
ments capture something about an individual’shealth status that extends beyond more objec-tive measures of health (e.g., the presence of alife-threatening health condition, such as heartdisease).
Verbrugge (1985) documented better self-rated health among men, with the size of theadvantage smaller among persons ages 65 and older. More recently, Ross and Bird (1994)found that younger women report significantlyworse health than men in the United States, butthat the gap closes with age, and Marks (1996)showed that women at age 53 had better self-reported health than men the same age. Datafrom Britain reveal a similar pattern.Macintyre et al. (1996) found significant dif-ferences in self-rated health only among 18-year-olds, with no differences among older agecohorts, and Arber and Cooper (1999) found
almost no difference in self-rated healthamong persons ages 60 and older. In explain-ing these patterns, Bird and colleagues have pointed to the importance of SES in shapingdifferences in men’s and women’s self-rated health (Bird and Fremont 1991; Ross and Bird 1994). Specifically, controlling for women’sdisadvantaged employment status and wagesresults in men reporting significantly worsehealth than women, and adjustment for the
greater time women spend doing housework and helping others further explains why
Hypothesis 1: The odds of experiencing a lifethreatening medical condition will increaswith age for both men and women, but at faster pace for men.
Hypothesis 2: Women will report a greate
number of functional limitations than meat every age, and the size of this gap wiincrease with age.
Hypothesis 3: Women will report worse selrated health than men in early adulthood but the gap will shrink with age.
Further, prior studies suggest that socioeconomic status will be more useful than othe
mechanisms for explaining the above pattern particularly for gender differences in self-ratehealth.
DATA AND METHODS
Data
Data for this study are drawn from the 199
through 2001 waves of the National HealtInterview Survey (NHIS), an annual multipu pose health survey conducted by the NationaCenter for Health Statistics and the Centers foDisease Control and Prevention and administered by the U.S. Census Bureau. NHIS uses multistage, stratified, cluster design, and includes an oversample of black and Hispani populations. When weighted, the data a
nationally representative of the noninstitutionalized civilian population in the United StateFor each family in the NHIS, one sampl
adult was randomly selected and included ithe sample adult core. These respondents arqueried on a detailed set of questions regardinhealth status, health care services, and behavior. We merged the 1997–2001 waves of thsample adult files, yielding a sample o151,736 respondents who had nonmissin
information on included covariates (excludindependent measures).
98 JOURNAL OF HEALTH AND SOCIAL BEHAVIO
— — . — -
8/3/2019 Adult Health Morbidity
http://slidepdf.com/reader/full/adult-health-morbidity 5/17
asked a series of yes/no questions aboutwhether they had ever been told by a doctor or other health professional that they had hyper-tension, heart disease (coronary heart disease,angina pectoris, or any other heart condition or disease), stroke, emphysema, diabetes, or can-cer (excluding skin cancer). Based on respons-es to these questions, we created a summed index of the number of life-threatening med-ical conditions the respondent has had, settingthe maximum at three (range: 0, 1, 2, or 3+conditions). Second, we examine one measureof physical disability: functional limitation.Respondents were asked about the amount of difficultly they experienced performing 12 dif-
ferent tasks (walking a quarter of a mile, walk-ing up 10 steps without resting, standing for two hours, sitting for two hours, stooping/ bending/kneeling, reaching up over their head,using fingers to grasp or handle small objects,carrying 10 pounds, pushing or pulling largeobjects such as a living room chair, going outshopping and to other events, participating insocial activities, and relaxing at home for leisure). We combine responses to these itemsand examine the number of reported limita-tions, setting the maximum at 10 (range: 0 to10+; Cronbach’s alpha = .93). Third, we exam-ine self-rated health, which asked respondentsto rate their health in general on a five-pointscale (1 = poor, 2 = fair, 3 = good, 4 = verygood, and 5 = excellent).
Independent Measures
Our primary predictor variables are gender (1 = female, 0 = male), age at interview (range:18 years to 85+), and the interaction betweengender and age. In the regression models, wesequentially introduce different sets of controlmeasures in a model-building sequencedesigned to examine whether any observed gender-by-age difference in health can be
attributed to measures associated with gender stratification in the United States. First, we
States because more recent immigrant arrivaare typically healthier than longer-duratioimmigrants and native-born persons (Cho anHummer 2001). We also include a continuoumeasure of family size and a categorical measure of marital status at interview (marriedcohabiting, widowed, divorced/separated, annever married), as men benefit more from mariage than women (Lillard and Waite 1995).
We assess the impact of socioeconomic status with four different measures. We include continuous measure of the highest level oschool completed (range: 0 [never attendeschool] to 21 [doctoral degree]). Second, wadd a measure of the family’s income-to-pove
ty ratio, which represents each respondentfamily income as a proportion of the incomlevel that the U.S. federal government has seas the poverty line. Due to the high level ononresponse (20%), missing values are set tthe mean value, and a dummy measure representing missing cases is included as a controThird, we include a dummy measure owhether the respondent was working last wee(1 = employed, 0 = unemployed). Fourth, wconstructed a dummy measure of whether threspondent reported any financial barriers tmedical care during the last year (1 = yes, 0 no). This measure was created from three questions that asked whether, during the last 1months, the respondent had delayed medicacare, did not receive medical care, or did noreceive prescribed medications because he oshe could not afford it (Cronbach’s alpha
.73).Lifestyle and behavior characteristics arcaptured with four measures. We includsmoking status as a categorical measure, contrasting those who have never smoked (1; reerence) with current (2) and former (3) cigarette smokers. Our measure of drinking com bines information about whether the respodents currently drink, and, if so, how mucalcohol they consume per occasion: 1 = life
time abstainers (reference), and 2 = formedrinkers. Current drinkers are grouped b
GENDER DISPARITIES IN ADULT HEALTH 9
— — . — -
8/3/2019 Adult Health Morbidity
http://slidepdf.com/reader/full/adult-health-morbidity 6/17
dent felt sad, hopeless, restless, nervous,worthless, and that everything was an effort(Cronbach’s alpha = .86). Responses ranged from 1 (none of the time) to 5 (all of the time).
In analyses not shown, weighted means and percentages for each independent predictor were calculated for the full sample and by gen-der. The average age of women in our sampleis 1.5 years older than that for men (45.5 yearsvs. 44.0 years); this difference is expected,given the longer life expectancy of women. Interms of socioeconomic and demographiccharacteristics, women are disadvantaged rela-tive to men in several respects. Women reportmore poverty, and a higher proportion of
women experienced financial barriers to med-ical care in the last year. More women are wid-owed, divorced or separated, and fewer womenthan men are currently married (56.4% vs.61.8%, respectively).
In their favor, women tend to report less behavior that can be damaging to health. While59.5 percent of women have never smoked acigarette, only 47.0 percent of men have never smoked. Women report only slightly higher rates of moderate drinking (1–2 drinks per occasion) than men, and they report muchlower rates of binge drinking (3.0% for womenvs. 10.9% for men). Although women report alower BMI, they engage in muscle-strengthen-ing exercise less often than men.
Analysis
Due to the complex sampling strategyemployed to collect the NHIS data, models areestimated using the Huber/White estimator of variance in Stata. Rather than assuming thatobservations are independent, Stata correctsfor the intracluster correlation that occurs because of the complex sample design, pro-ducing standard errors that are more accurateand reducing the chance of Type I errors.
Weights are also used in all analyses due tooversampling of blacks and Hispanics.
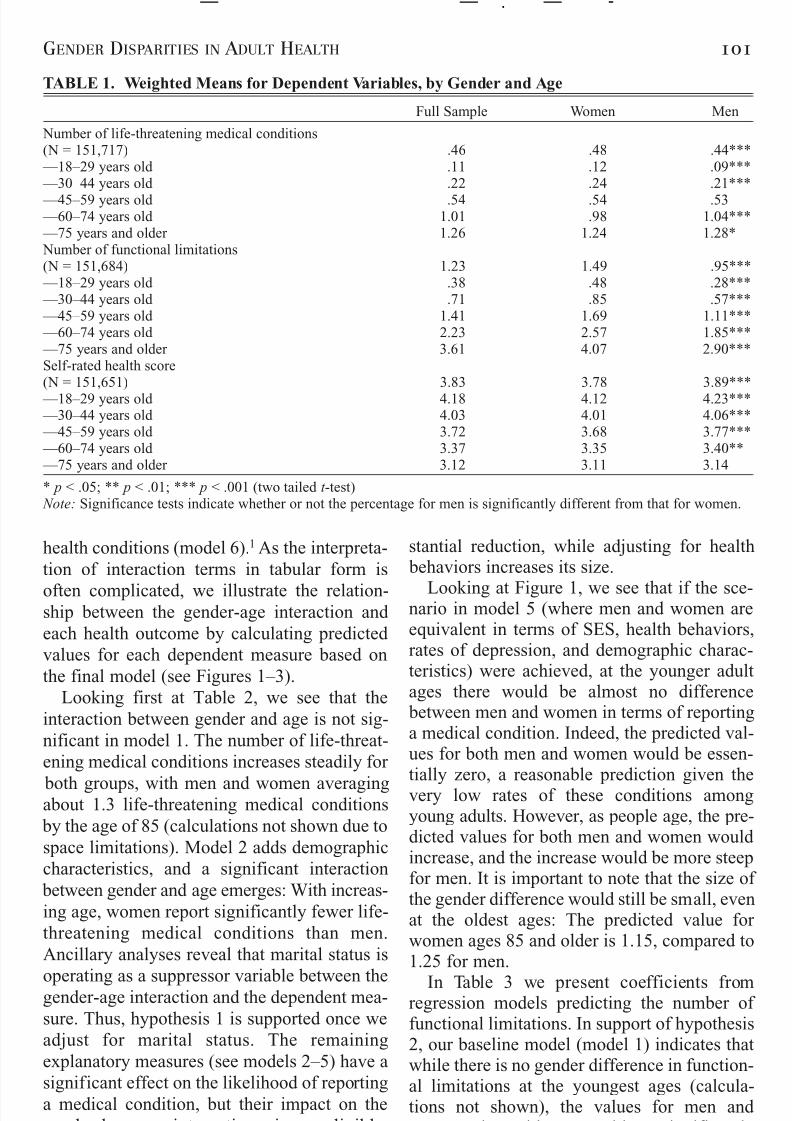
nificantly disadvantaged relative to men foeach health measure. Women report a signifcantly higher number of life-threatening medical conditions, though the size of this difference is rather small (.48 among women com pared to .44 for men). The gender gap is muclarger for functional limitations, with womereporting 57 percent more limitations thamen (1.49 vs. .95, respectively). Women alsreport significantly worse health, but the diference, while significant, is small: The meavalue is 3.78 for women and 3.89 for men.
If we examine these rates by gender and agcategory, a different picture emerges. For lifethreatening medical conditions, women’s dis
advantage exists only among the younger aggroups; among persons ages 45 to 59, men anwomen do not differ significantly in their num ber of medical conditions, and among personages 60 and older, men report significantlmore medical conditions than womenHowever, as seen for the overall scores, thsize of the difference between men and womeis modest. For functional limitations, thfemale disadvantage holds across all aggroups and increases in severity with ageAmong persons ages 75 and older, womereport an average of 4.07 functional limitations, compared to 2.90 among men. The patern for self-rated health differs from the paterns for the other two health measures. Herewomen report significantly worse healt between the ages of 18 and 74; at ages 75 anabove, men and women do not differ signif
cantly in their self-rated health status. Againthe sizes of these differences are small.
Multivariate Models of Physical Health
We present a series of ordinary least squareregression models predicting the number olife-threatening medical conditions and thnumber of functional limitations in Tables
and 3, and we present ordered logit mode predicting self-rated health status in Table
100 JOURNAL OF HEALTH AND SOCIAL BEHAVIO
— — . — -
8/3/2019 Adult Health Morbidity
http://slidepdf.com/reader/full/adult-health-morbidity 7/17
TABLE 1. Weighted Means for Dependent Variables, by Gender and Age
Full Sample Women Men
Number of life-threatening medical conditions(N = 151,717) .46 .48 .44** — 18–29 years old .11 .12 .09** — 30–44 years old .22 .24 .21**
— 45–59 years old .54 .54 .53 — 60–74 years old 1.01 .98 1.04** — 75 years and older 1.26 1.24 1.28* Number of functional limitations(N = 151,684) 1.23 1.49 .95** — 18–29 years old .38 .48 .28** — 30–44 years old .71 .85 .57** — 45–59 years old 1.41 1.69 1.11** — 60–74 years old 2.23 2.57 1.85** — 75 years and older 3.61 4.07 2.90**Self-rated health score(N = 151,651) 3.83 3.78 3.89** — 18–29 years old 4.18 4.12 4.23** — 30–44 years old 4.03 4.01 4.06** — 45–59 years old 3.72 3.68 3.77** — 60–74 years old 3.37 3.35 3.40** — 75 years and older 3.12 3.11 3.14
* p < .05; ** p < .01; *** p < .001 (two tailed t -test) Note: Significance tests indicate whether or not the percentage for men is significantly different from that for women
GENDER DISPARITIES IN ADULT HEALTH 10
— — . — -
health conditions (model 6).1 As the interpreta-tion of interaction terms in tabular form is
often complicated, we illustrate the relation-ship between the gender-age interaction and each health outcome by calculating predicted values for each dependent measure based onthe final model (see Figures 1–3).
Looking first at Table 2, we see that theinteraction between gender and age is not sig-nificant in model 1. The number of life-threat-ening medical conditions increases steadily for
both groups, with men and women averagingabout 1.3 life-threatening medical conditions by the age of 85 (calculations not shown due tospace limitations). Model 2 adds demographiccharacteristics, and a significant interaction between gender and age emerges: With increas-ing age, women report significantly fewer life-threatening medical conditions than men.Ancillary analyses reveal that marital status is
operating as a suppressor variable between thegender-age interaction and the dependent mea-sure Thus hypothesis 1 is supported once we
stantial reduction, while adjusting for healt behaviors increases its size.
Looking at Figure 1, we see that if the scenario in model 5 (where men and women arequivalent in terms of SES, health behaviorrates of depression, and demographic characteristics) were achieved, at the younger aduages there would be almost no differenc between men and women in terms of reportina medical condition. Indeed, the predicted vaues for both men and women would be essentially zero, a reasonable prediction given thvery low rates of these conditions amonyoung adults. However, as people age, the predicted values for both men and women woulincrease, and the increase would be more steefor men. It is important to note that the size othe gender difference would still be small, eveat the oldest ages: The predicted value fowomen ages 85 and older is 1.15, compared t1.25 for men.
In Table 3 we present coefficients fromregression models predicting the number of ti l li it ti I t f h th

8/3/2019 Adult Health Morbidity
http://slidepdf.com/reader/full/adult-health-morbidity 8/17
TABLE 2. Unstandardized Coefficients from OLS Regression Models: Number of Life-Threatenin
Medical Conditions
Model 1 Model 2 Model 3 Model 4 Model
Female .075 .109* .066* .079* .066*Age .022* .023* .020* .018* .019*Female age –.001 –.002* –.002* –.002** –.002**Race and ethnicity — Non-Latino white (reference) . — . — . — . — — Non-Latino black .122* .092 .053 .061 — Mexican .040 –.030 –.052 –.043 — Puerto Rican .128* .072** .039 .028 — Cuban –.013 –.034 –.035 –.031 — Chinese –.052 –.022* .020 .013 — Filipino .079 .131* .135** .129* — Other .038 .012 .007 .006Duration of residence in U.S. — Native-born (reference) . — . — . — . —
— Less than 5 years –.071* –.121* –.071* –.059 — 5–9 years –.108 –.136 –.093 –.080 — 10 years –.113* –.130* –.094* –.084 — 15 years or more –.122 –.121 –.091 –.090Marital status — Married (reference) . — . — . — . — — Cohabiting .066* .023* .042* .036* — Divorced/separated .045* .010 .014 –.003 — Widowed .126 .049 .075 .067 — Never married .083 .021 .044 .039Family size –.000 –.008*** –.011** –.011**Highest school grade completed –.012* –.007* –.006*
Family income-to-poverty ratio –.007* –.001 –.004 — Missing –.049* –.043* –.031*Employed –.189** –.190** –.169**Any $$ barriers to medical care .159* .136* .081*Smoking status — Never smoked (reference) . — . — — Current smoker .021 .005 — Former smoker .090 .086Drinking status — Lifetime abstainer (reference) . — . — — Former drinker, none last year .089* .072* — Current, 1–2 drinks per occasion –.049 –.055
— Current, 3–4 drinks per occasion –.046 –.056 — Current, 5+ drinks per occasion –.017 –.034Muscle-strengthening exercise –.007 –.006Body Mass Index .020* .019*Depressive mood .144**R 2 .23 .24 .27 .29 .31
* p < .05; ** p < .01; *** p < .001 (two tailed t -test) Notes: N = 151,717. OLS = ordinary least squares. All models control for year of survey.
102 JOURNAL OF HEALTH AND SOCIAL BEHAVIO
— — . — -
psychosocial factors in explaining observed differences. None of the measures reduces thei t ti b t d d t
remedy the disproportionately high number ofunctional limitations reported among olde
diff th t t l it

8/3/2019 Adult Health Morbidity
http://slidepdf.com/reader/full/adult-health-morbidity 9/17
age (supporting hypothesis 3). Women aremore likely than men to report “good” or “verygood” health at younger ages, but the gap
diminishes with age. Finally, there are no gen-der differences in “poor” or “fair” health at anyage. Looking across the models, we see thatthe interaction term is strengthened by adjust-ing for demographic characteristics and healthconditions, and that SES and depressionappear to account for a substantial portion of the self-rated health gap between women and men.
We graph the gender-by-age interaction
from model 6 in Figure 3. Since we ran aordered logit model for self-rated health, wcan calculate predicted probabilities for eac
of the five categories of self-rated health. Fo presentation, we only graph the probabilitifor “poor,” “good,” and “excellent” healt(“fair” and “very good” track closely wit“poor” and “excellent,” respectively). Figure shows that if men and women had similar profiles, men would be slightly more likely treport “excellent” health in the early aduyears, but the decline in health among men
greater than for women; with increasing ag
GENDER DISPARITIES IN ADULT HEALTH 10
— — . — -
FIGURE 1. Predicted Values: Life-Threatening Medical Conditions
Note: Based on Model 5, Table 2.
FIGURE 2. Predicted Values: Functional Limitations
8/3/2019 Adult Health Morbidity
http://slidepdf.com/reader/full/adult-health-morbidity 10/17
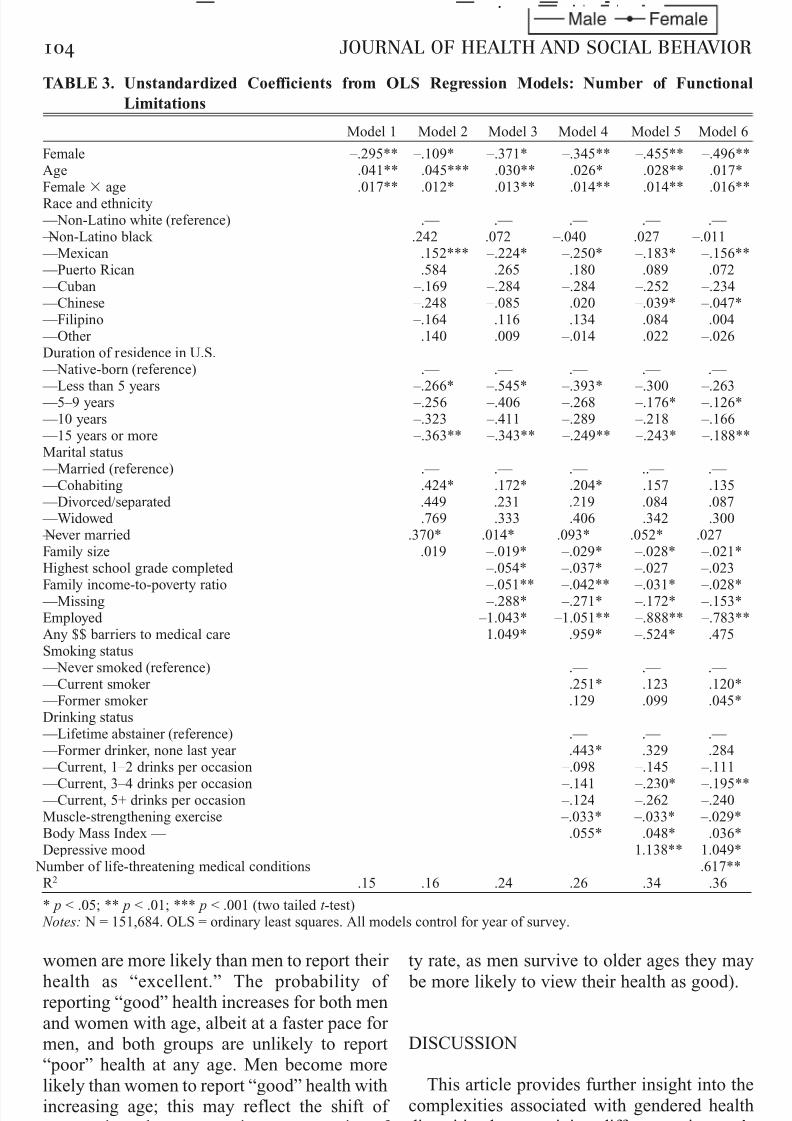
TABLE 3. Unstandardized Coefficients from OLS Regression Models: Number of Function
Limitations
Model 1 Model 2 Model 3 Model 4 Model 5 Model
Female –.295** –.109* –.371* –.345** –.455** –.496*Age .041** .045*** .030** .026* .028** .017*Female age .017** .012* .013** .014** .014** .016*Race and ethnicity — Non-Latino white (reference) . — . — . — . — . — — Non-Latino black .242 .072 –.040 .027 –.011 — Mexican .152*** –.224* –.250* –.183* –.156* — Puerto Rican .584 .265 .180 .089 .072 — Cuban –.169 –.284 –.284 –.252 –.234 — Chinese –.248 –.085 .020 –.039* –.047* — Filipino –.164 .116 .134 .084 .004 — Other .140 –.009 –.014 –.022 –.026Duration of residence in U.S. — Native-born (reference) . — . — . — . — . —
— Less than 5 years –.266* –.545* –.393* –.300 –.263 — 5–9 years –.256 –.406 –.268 –.176* –.126* — 10 years –.323 –.411 –.289 –.218 –.166 — 15 years or more –.363** –.343** –.249** –.243* –.188*Marital status — Married (reference) . — . — . — .. — . — — Cohabiting .424* .172* .204* .157 .135 — Divorced/separated .449 .231 .219 .084 .087 — Widowed .769 .333 .406 .342 .300 — Never married .370* .014* .093* .052* .027Family size .019 –.019* –.029* –.028* –.021*Highest school grade completed –.054* –.037* –.027 –.023
Family income-to-poverty ratio –.051** –.042** –.031* –.028* — Missing –.288* –.271* –.172* –.153*Employed –1.043* –1.051** –.888** –.783*Any $$ barriers to medical care 1.049* .959* –.524* .475Smoking status — Never smoked (reference) . — . — . — — Current smoker .251* .123 .120* — Former smoker .129 .099 .045*Drinking status — Lifetime abstainer (reference) . — . — . — — Former drinker, none last year .443* .329 .284 — Current, 1–2 drinks per occasion –.098 –.145 –.111
— Current, 3–4 drinks per occasion –.141 –.230* –.195* — Current, 5+ drinks per occasion –.124 –.262 –.240Muscle-strengthening exercise –.033* –.033* –.029*Body Mass Index — .055* .048* .036*Depressive mood 1.138** 1.049* Number of life-threatening medical conditions .617**R 2 .15 .16 .24 .26 .34 .36
* p < .05; ** p < .01; *** p < .001 (two tailed t -test) Notes: N = 151,684. OLS = ordinary least squares. All models control for year of survey.
104 JOURNAL OF HEALTH AND SOCIAL BEHAVIO
— — . — -
women are more likely than men to report their
health as “excellent.” The probability of reporting “good” health increases for both men
d ith lb it t f t f
ty rate, as men survive to older ages they ma
be more likely to view their health as good).

8/3/2019 Adult Health Morbidity
http://slidepdf.com/reader/full/adult-health-morbidity 11/17
TABLE 4. Coefficients from Ordered Logit Regression Models: Self-Rated Health
Model 1 Model 2 Model 3 Model 4 Model 5 Model
Female —— –.247*** –.311*** –.205*** –.237*** –.167*** –.239**Age –.034*** –.040*** –.033*** –.031*** –.034*** –.017**Female age .002*** .004*** .004*** .004*** .004*** .006**Race and ethnicity
— Non-Latino white (reference) . — . — . — . — . — — Non-Latino black –.535*** –.370*** –.292*** –.345*** –.323*** — Mexican –.563*** –.067** –.077*** –.121*** –.193** — Puerto Rican –.673*** –.377*** –.306*** –.262*** –.246** — Cuban –.302*** –.180*** –.171*** –.194*** –.302** — Chinese –.157*** –.441*** –.560*** –.538*** –.559** — Filipino –.018* –.364*** –.422*** –.393*** –.332** — Other –.328*** –.211*** –.224*** –.223*** –.237**Duration of residence in U.S. — Native-born (reference) . — . — . — . — . — — Less than 5 years .067** .342*** .210*** .158*** .065** — 5–9 years .064 .278*** .153*** .101*** .030** — 10–14 years .024 .210* .089 .045 –.047 — 15 years or more .106*** .166*** .064* .058* –.050Marital status — Married (reference) . — . — . — . — . — — Cohabiting –.420*** –.173*** –.169*** –.139*** –.089** — Divorced/separated –.400*** –.154*** –.122*** –.038* –.024 — Widowed –.211*** .232*** .163*** .211*** .347** — Never married –.315*** –.011 –.097** –.067 –.033Family size –.020** .029*** .040*** .042*** .032**Highest school grade completed .105*** .080*** .076*** .072**Family income-to-poverty ratio .064*** .053*** .046*** .040** — Missing .040*** .029*** –.032*** –.010**Employed .464*** .504*** .426*** .167**Any $$ barriers to medical care –.954*** –.861*** –.610*** –.491**Smoking status — Never smoked (reference) . — . — . — — Current smoker –.515*** –.446*** –.434** — Former smoker –.177*** –.163*** –.097**Drinking status — Lifetime abstainer (reference) . — . — . — — Former drinker, none last year –.230*** –.163*** –.056** — Current, 1–2 drinks per occasion .210*** .250*** .211** — Current, 3–4 drinks per occasion .164*** .234*** .173**
— Current, 5+ drinks per occasion .042 .138** .085**Muscle-strengthening exercise .132*** .137*** .132**Body Mass Index –.056*** –.053*** –.032**Depressive mood –.745*** –.449**Health conditions — # of functional limitations –.252** — # of life-threatening medical conditions –.598**Pseudo R 2 .04 .04 .09 .10 .12 .17
* p < .05; ** p < .01; *** p < .001 (two tailed t -test) Notes: N = 151,651. All models control for year of survey.
GENDER DISPARITIES IN ADULT HEALTH 10
— — . — -
that led us to examine gender-by-age differ-
ences in life-threatening medical conditions,
functional limitations, and self-rated health.
First, we find that the degree of disadvan
tage women experience is not uniform, and th
size of the disadvantage varies by age an

8/3/2019 Adult Health Morbidity
http://slidepdf.com/reader/full/adult-health-morbidity 12/17
the expected pattern emerged: life-threateningmedical conditions increase with age, but at afaster pace for men. Ancillary analyses (not presented here) show that the gender-age inter-action holds only for persons who are married or divorced/separated. It is not clear why thisrelationship holds only for these persons, butquestions pertaining to life-threatening med-ical conditions necessitate some interactionwith the health care system (i.e., all questionsstart with “have you ever been told by a doctor or other health care professional .|.|.”). Becauseone of the reasons why men benefit from mar-riage is through their increased contact withthe health care system (presumably becausetheir wives encourage them to see a doctor more frequently than men who are not mar-ried), the suppressor effect for marriage mayindicate that men who are married or
divorced/separated are significantly more like-ly to report a life-threatening medical condi-ti b th i t t ith th h lth
tion with the medical system than their formestatus as a married person.
Only for functional limitations do we seconsistent female excess in morbidity throughout adulthood, and the disparity is striking. Ahypothesized, the size of the gender gaincreases steadily with age, and the gender-byage relationship is fairly insensitive to adjusment for background characteristics. In othewords, even if men and women were equivalent with regard to these characteristicwomen would still report a significantly higher number of functional limitations, and thsize of their disadvantage would continue tgrow with age. Thus, as other researchers havdone, we find that disability is a burden thaweighs more heavily upon women than upomen in the United States.
For self-rated health, our models reveal tha
if men and women were more similar, womewould be more likely to report “excellent” an“ d” h lth th f t f d l
106 JOURNAL OF HEALTH AND SOCIAL BEHAVIO
— — . — -
FIGURE 3. Predicted Probabilities: Self-Rated Health
Note: Based on Model 6, Table 4.
8/3/2019 Adult Health Morbidity
http://slidepdf.com/reader/full/adult-health-morbidity 13/17
how they feel on a daily basis (e.g., depression,other health conditions). These findings mirror those of other studies (Bird and Fremont 1991;Ross and Bird 1994) and suggest that improv-ing women’s social position would help themimprove how they assess their overall health.The lack of an observed gender difference inreporting “poor” health may reflect the veryserious nature of self-identifying as such,wherein both men and women choose this cat-egory only if their health status is quite bad.
Supplementary analyses also revealed someinteresting age patterns in the importance of socioeconomic status for physical health.While SES was a significant predictor of self-
rated health at every age, different patternsemerged for our two other measures of health.For functional limitations, SES was not signif-icant at the younger ages but emerged as a sig-nificant predictor as age increased. Given thestrong relationship between age and disability,this finding is logical. For life-threateningmedical conditions, we found a curvilinear relationship wherein SES was not significantat the youngest and oldest ages but was astrong predictor for most of the adult lifecourse (between the ages of 30 and 74). Thislikely reflects the general absence of life-threatening medical conditions in early life and the inability of SES to mediate life-threateningmedical conditions in later life. In other words,the pathways linking SES to life-threateningmedical conditions (e.g., prevention, access tocare) are least salient during these years.
Our study also highlights the important roleof depression in shaping the gender gap inmorbidity, as depression is a salient predictor of each health measure and accounts for a sub-stantial portion of the gender gap in functionallimitations and self-rated health.2 Prior research has established that women are moredepressed than men (Rieker and Bird 2000), but more research on the role of depression inshaping the physical health status of men and
women is needed. However, it is likely that therelationship between depression and physical
long way toward improving the morbidity profile of women, vis-à-vis men.
This paper is not without limitations. Firsour inability to account for gender differencein functional limitations and life-threatenin
medical conditions may reflect the rather limited set of explanatory measures contained ithe National Health Interview Survey. Whilwe include depression, we are unable to assesthe role of other psychosocial measures (e.gstress, sense of control, and social support), aunfortunate omission given that prior work hademonstrated that men and women differ ithese characteristics. For example, Ross anMirowsky (2002) document a gender gap i
personal control, with the sense of personcontrol declining more rapidly with age fowomen than for men.
Second, the findings for age may refleccohort differences and thus may not fully represent the manner in which morbidity riskchange as men and women age over timeBecause the NHIS is a cross-sectional surveythe respondents represent a cross-section o
different birth cohorts, including persons bor between 1978–1983 among the 18-year-oldand persons born in 1912–1916 (and earlieramong persons ages 85 and above. The perioof history in which these cohorts have livevaries substantially. Accordingly, not only hathe gendered nature of the health environmenchanged over time,3 but the structure ameaning of social roles and health behaviorknown to influence gender disparities ihealth—e.g., the nature and meaning of workmarriage and family formation, smokin behavior—have also changed dramaticaacross these birth cohorts (Cherlin 1992Oppenheimer 1994; Wallace et al. 2003). Taddress these limitations, we need longitudinastudies that contain information on multiplmeasures of health and on behaviors and chaacteristics known to influence gender dispar
ties in the United States.Third, mortality selection may be influenc
i th l ti hi b t d
GENDER DISPARITIES IN ADULT HEALTH 10
— — . — -

8/3/2019 Adult Health Morbidity
http://slidepdf.com/reader/full/adult-health-morbidity 14/17
article, as morbidity rates among men would be higher.
Overall, these results have important impli-cations for researchers and policy makers.First, they suggest that research on gender dif-ferences in health should continue to examinemultiple health outcomes across adulthood, asthe size of the difference in men’s and women’shealth varies considerably by age and healthstatus measure. We find that gender differ-ences in health are often small, and we, alongwith other researchers (Macintyre et al. 1996),question how meaningful these rather smalldifferences in men’s and women’s health are toa person’s day-to-day well being.
Second, and of overwhelming relevance for public policy and health care researchers, is theneed to understand and respond to women’sgreater burden of functional limitations atevery age of adulthood, particularly in middleand late life. Functional limitation is a criticalhealth outcome that affects daily life, and our findings not only support prior studies thatdocument higher levels of disability amongwomen (e.g., Lubitz et al. 2003), but also showthat the size of excess disability increases withage.
Finally, public policy must continue toaddress the causes and consequences of women’s disadvantaged social position relativeto men. The significance of socioeconomicstatus in our models highlights the health gainsfor women that would accompany improve-ment in their socioeconomic standing. While
the benefits for functional limitations and life-threatening medical conditions are not as greatas for self-rated health, these findings suggestthat, at the minimum, improvements in thesocioeconomic status of women would likelyresult in a dramatic upswing in how they feelabout their general health status.
NOTES
1. Model 6 is only included in Tables 3 and 4
gap in life expectancy at birth in 1930 (58.years for males and 61.6 years for femalesBy 2000 the gender gap was 5.4 years, anthe life expectancy at birth had risen signiicantly for both groups, to 74.3 years fomales and 79.7 years for females (Aria2004).
REFERENCES
Allandale, Ellen and Kate Hunt. 2000. “GendInequalities in Health: Research at the Crosroads.” Pp. 1–33 in Gender Inequalities i
Health, edited by Ellen Allendale and Kate HunBuckingham, UK: Open University Press.
Arber, Sara and Helen Cooper. 1999. “Gender Diferences in Health in Later Life: The New Paradox?” Social Science and Medicine 48:61–76.
———. 2000. “Gender and Inequalities in Healacross the Lifecourse.” Pp. 123–49 in Gende
Inequalit ies in Health, edited by Ellen Allendaand Kate Hunt. Buckingham, UK: Open Univesity Press.
Arias, Elizabeth. 2004. “United States Life Table2001.” National Vital Statistics Reports 52(14
Hyattsville, MD: National Center for Health Statistics.Barbeau, Elizabeth M., Nancy Krieger, and Mah
Jabeen Soobader. 2004. “Working Class MatterSocioeconomic Disadvantage, Race/EthnicityGender, and Smoking in NHIS 2000.” America
Journal of Public Health 94(2):269–78.Bianchi, Suzanne M. and Daphne Spain. 199
“Women, Work, and Family in America.” Population Bulletin 51(3). Washington, DC: Popultion Reference Bureau.
Bird, Chloe E. and Allen M. Fremont. 1991. “Gender, Time Use, and Health.” Journal of Healand Social Behavior 32:114–29.
Bird, Chloe E. and Patricia P. Rieker. 1999. “GendeMatters: An Integrated Model for UnderstandinMen’s and Women’s Health.” Social Science an
Medicine 48:745–55.Calle, Eugenia E., Michael J. Thun, Jennifer M
Petrelli, Carmen Rodriguez, and Clark W. Heath1999. “Body-Mass Index and Mortality in Prospective Cohort of U.S. Adults.” The Ne
England Journal of Medicine 341(151097–1105.
Ch li A d 1992
108 JOURNAL OF HEALTH AND SOCIAL BEHAVIO
— — . — -

8/3/2019 Adult Health Morbidity
http://slidepdf.com/reader/full/adult-health-morbidity 15/17
Replication of Five Dimensions of FunctionalLimitation and Disability.” Journal of Aging and
Health 9(1):28–42.Cooper, Helen. 2002. “Investigating Socio-Eco-
nomic Explanations for Gender and EthnicInequalities in Health.” Social Science and Med-
icine 54:693–706.Crimmins, Eileen M., Mark D. Hayward, and
Yasuhiko Saito. 1996. “Differentials in ActiveLife Expectancy in the Older Population in theUnited States.” Journal of Gerontology: Social Sciences 51B(3):S111–S120.
Crimmins, Eileen M., Jung Ki Kim, and AaronHagedorn. 2002. “Life with and without Dis-ease: Women Experience More of Both.” Jour-nal of Women & Aging 14(1/2):47–59.
Denton, Margaret, Steven Prus, and Vivienne Wal-
ters. 2004. “Gender Differences in Health: ACanadian Study of the Psychosocial, Structuraland Behavioural Determinants of Health.” Social Science and Medicine 58:2585–2600.
Denton, Margaret and Vivienne Walters. 1999.“Gender Differences in Structural and Behav-ioral Determinants of Health: An Analysis of theSocial Production of Health.” Social Science and
Medicine 48:1221–35.Dunlop, Dorothy D., John S. Lyons, Larry M. Man-
heim, Jing Song, and Rowland W. Chang. 2004.“Arthritis and Heart Disease as Risk Factors for Major Depression.” Medical Care 42(6):502–11.
Ellison, R. Curtis. 2002. “Balancing the Risks and Benefits of Moderate Drinking.” Annals of the
New York Academy of Sciences 957:1–6.Ettinger, W. H. Jr., L. P. Fried, T. Harris, L. Sheman-
ski, R. Schulz, and J. Robbins. 1994. “Self-Reported Causes of Physical Disability in Older People: The Cardiovascular Health Study.” Jour-nal of the American Geriatrics Society 42(10):
1035–44.Galuska, Deborah A., Mary Serdula, Elsie Pamuk,
Paul Z. Siegel, and Tim Byers. 1996. “Trends inOverweight among U.S. Adults from 1987 to1993: A Multistate Telephone Survey.” American
Journal of Public Health 86(12):1729–35.Guralnik, Jack M., Andrea Z. LaCroix, Donald F.
Everett, and Mary Grace Kovar. 1989. “Aging inthe Eighties: The Prevalence of Comorbidity and its Association with Disability.” Advance Data
from Vital and Health Statistics 170. Hyattsville,
MD: National Center for Health Statistics.Hunt, Kate. 2002. “A Generation Apart? Gender-
l d i d l h i i
nic Groups: A Hyperparametric Approach Journal of Studies on Alcohol 59(5):568–81.
Lahelma, E. and O. Rahkonen. 1997. “HealtInequalities in Modern Societies and BeyondSocial Science and Medicine 44:721–910.
Lillard, Lee A. and Linda J. Waite. 1995. “ ‘T
Death Do Us Part: Marital Disruption and Motality.” American Journal of Sociology 101131–56.
Lubitz, James, Liming Cai, Ellen Kramarow, anHarold Lentzner. 2003. “Health, Life Expectancy, and Health Care Spending among the Eldely.” The New England Journal of Medicin349(11):1048–55.
Macintyre, Sally, Kate Hunt, and Helen Sweetin1996. “Gender Differences in Health: ArThings Really as Simple as They Seem?” SociScience and Medicine 42:617–24.
Marks, Nadine F. 1996. “Socioeconomic StatuGender, and Health at Midlife: Evidence fromthe Wisconsin Longitudinal Study.” Research the Sociology of Health Care 13A:135–52.
Merrill, Susan S., Teresa E. Seeman, Stanislav Kasl, and Lisa F. Berkman. 1997. “Gender Diferences in the Comparison of Self-ReporteDisability and Performance Measures.” Journaof Gerontology: Medical Sciences 52A(1
M19–M26.Mirowsky, John and Catherine E. Ross. 1992. “Ag
and Depression.” Journal of Health and Soci Behavior 33:187–205.
Nelson, David E., Betsy L. Thompson, Shayne DBland, and Richard Rubinson. 1999. “Trends Perceived Cost as a Barrier to Medical Car1991–1996.” American Journal of Public Heal89(9):1410–13.
Newman, Anne B. and Jennifer S. Brach. 200
“Gender Gap in Longevity and Disability iOlder Persons.” Epidemiologic Reviews 23(2343–50.
Oppenheimer, Valerie Kincade. 1994. “WomenRising Employment and the Future of the Famly in Industrial Societies.” Population and Deveopment Review 20(2):293–342.
Read, Jen’nan Ghazal and Bridget K. Gorman2006. “Gender Inequalities in U.S. Adult HealthThe Interplay of Race and Ethnicity.” Social Scence and Medicine 62(5):1045–65.
Rieker, Patricia and Chloe Bird. 2000. “SociologicExplanations of Gender Differences in Ment
d Ph i l H lth ” P 98 113 i H db
GENDER DISPARITIES IN ADULT HEALTH 10
— — . — -

8/3/2019 Adult Health Morbidity
http://slidepdf.com/reader/full/adult-health-morbidity 16/17
Bridget K. Gorman is an Assistant Professor of Sociology at Rice University. Her research focuses oracial, ethnic, and gender disparities in physical health status. Her recent research examines racial and ethnic disparities in childhood asthma and access to health care services, racial and ethnic disparities in selrated health in adolescence, and how the interplay between race and gender affects health status in adulhood.
Jen’nan Ghazal Read is an Assistant Professor of Sociology and a faculty affiliate with the Center foHealth Policy Research at the University of California, Irvine. Her research interests are in gender, ethnicity, and religion, and much of her work focuses on the effects of these factors on immigrant adaptation. Herecent research examines the effects of racial context on black immigrant health, the impact of acculturation on Arab American health, and the role of race and ethnicity in shaping gendered health disparities.
110 JOURNAL OF HEALTH AND SOCIAL BEHAVIO
— — . — -
Control.” Social Psychology Quarterly65:125–45.
Tanasescu, Mihaela, Michael F. Leitzmann, Eric B.Rimm, Walter C. Willett, Meir J. Stampfer, and Frank B. Hu. 2002. “Exercise Type and Intensityin Relation to Coronary Heart Disease in Men.”
Journal of the American Medical Association288(6):1994–2000.
Trost, Stewart G., Neville Owen, Adrien E. Bau-man, James F. Sallis, and Wendy Brown. 2002.“Correlates of Adults’ Participation in PhysicalActivity: Review and Update.” Medicine & Sci-ence in Sports & Exercise 34(12):1996–2001.
U.S. Department of Health and Human Services.2000. Reducing Tobacco Use: A Report of theSurgeon General . Atlanta, GA: U.S. Departmentof Health and Human Services, Centers for Dis-
ease Control and Prevention, National Center for Chronic Disease Prevention and Health Promo-tion, Office on Smoking and Health.
Verbrugge, Lois. 1985. “Gender and Health: AnUpdate on Hypotheses and Evidence.” Journal of Health and Social Behavior 26:156–82.
———. 1986. “From Sneezes to Adieux: Stages of Health for American Men and Women.” Social Science and Medicine 22(11):1195–1212.
———. 1989. “The Twain Meet: Empirical Expla-
nations of Sex Differences in Health and Mortaity.” Journal of Health and Social Behavi30:282–304.
Wallace, John M. Jr., Jerald G. Bachman, Patrick MO’Malley, John E. Schulenberg, Shauna MCoooper, and Lloyd D. Johnston. 2003. “Gende
and Ethnic Differences in Smoking, Drinkinand Illicit Drug Use among American 8th, 10thand 12th Grade Students, 1976–2000.” Addictio98(2):225–34.
Walters, Vivienne, Peggy McDonough, and LisStrohschein. 2002. “The Influence of WorkHousehold Structure, and Social, Personal anMaterial Resources on Gender Differences iHealth: An Analysis of the 1994 Canadia
National Population Health Survey.” Social Scence and Medicine 54:677–92.
Wingard, Deborah L., Barbara A. Cohn, George AKaplan, Piera M. Cirillo, and Richard D. Cohen1989. “Sex Differentials in Morbidity and Motality Risks Examined by Age and Cause in thSame Cohort.” American Journal of Epidemioogy 130(3):601–10.
York, James L., John Welte, and Judith Hirsch2003. “Gender Comparison of Alcohol Exposuron Drinking Occasions.” Journal of Studies o
Alcohol 64(6):790–801.

8/3/2019 Adult Health Morbidity
http://slidepdf.com/reader/full/adult-health-morbidity 17/17