adsorption of cu(ii) and cd(ii) from aqueous solution by ... · citation: el–moselhy km,...
TRANSCRIPT

Citation: El–Moselhy KM, Abdel-Azzem M, Amer A, et al. Adsorption of Cu(II) and Cd(II) from Aqueous Solution by Using Rice Husk
Adsorbent. Phys Chem Ind J. 2017;12(2):109.
© 2017 Trade Science Inc.
1
Adsorption of Cu(II) and Cd(II) from Aqueous Solution by Using Rice Husk
Adsorbent
Khalid M. El–Moselhy1, Magdi Abdel Azzem
2, Adel Amer
1 and Ahmed E. Al–Prol
1*
1National Institute of Oceanography and Fisheries, Suez Branch, 182 Suez, Egypt
2Chemistry Department, Faculty of Science, El- Menoufia University, Egypt
*Corresponding author: Ahmed E. Al–Prol, National Institute of Oceanography and Fisheries, Suez Branch, 182 Suez,
Egypt, E-mail: [email protected]
Received: March 14, 2017; Accepted: May 16, 2017; Published: May 24, 2017
1. Introduction
The presence of toxic heavy metal ions in waste water is a major concern because their toxicity to many aquatic organisms.
Heavy metal contamination exists in aqueous wastes of many industries, as metal plating, chloralkali, mining operations,
radiator manufacturing, smelting, alloy industries and storage batteries industries, etc. [1]. For removal of metalloids and
heavy metals, many conventional techniques such as carbon adsorption, membrane filtration, chemical precipitation ion
exchange and co-precipitation have been studied. But they are not suitable for high concentration of metals and also not cost
effective [2]. In recent years, the need for safe and economical techniques for removal of heavy metals from wastewaters has
necessitated research interest towards the production of low cost alternatives [3]. Whatever, adsorption has been universally
accepted because one of the most effective pollutant removal process, with low cost, ease in handling, low consumption of
chemicals, and scope for treatment of value added components by regeneration of adsorbents and desorption [4]. Rice husk is
agricultural waste arising in rice producing countries, particularly in Egypt. Dry rice husk contains 70% to 85% of organic
matter (cellulose, lignin, sugars, etc.) and the remnant consists of silica, which is existing in the cellular membrane [5].
Abstract
In this study, rice husk was used as a low cost adsorbent to remove copper and cadmium ions from wastewater by batch method.
The effects of pH, initial adsorbent concentration, contact time, initial metal ion concentration and temperature were studied.
The experimental data were agreement with the pseudo-second-order kinetic model; and analyzed by Langmuir and Freundlich
isotherm models to investigate the adsorption of copper and cadmium ions on rice husk. The adsorption mechanisms of metal
ions onto the rice husk were examined using: Scanning electron microscopy (SEM) and Fourier-transform infrared spectroscopy
(FT-IR). As a conclusion, rice husk could be one of the low cost and effective adsorbent to be used in large amount operation of
water treatment.
Keywords: Rice husk; Heavy metals; Adsorption; Kinetics; Isotherm
www.tsijournals.com | May-2017
2
In modern years, attention has been focused on the exploitation of unmodified rice husk as an adsorbent for the removal of
some pollutants [6]. Accordingly, the objective of this study was to valuation the possibility of rice husk as alternative low-
cost adsorbents for decontamination of heavy metal ions from aqueous solutions. The adsorption studies were achieved as a
function of solution pH values, adsorbent dosage, contact time, initial copper (II) and cadmium (II) concentrations and
temperature. The equilibrium data were described by the Langmuir and Freundlich isotherm models in addition to determine
adsorption kinetics. FTIR and SEM analyses were performed to clarify the adsorption mechanism.
2. Materials and Methods
2.1. Adsorbent preparation
Fresh rice husk was obtained from a local rice mill and the collected rice husk were washed with additional tap water and
eventually with distilled water in order to remove dust and particulate substances from the surface, and dried in an oven at
70°C for 24 h. It grinding to powder by using a mixer and sieved to a uniform particle sizes to obtain even intra–particular
diffusion of the metal ion.
2.2. Adsorbate
Stock solutions of Cd (NO3)2 and CuSO4 at concentration 1000 mg/L were prepared in deionized water. The desirable
concentrations were prepared through the adequate dilution of stock solution with distilled water. The primary pH was
adjusted by concentrated NaOH or HCl. Initial metal concentrations were measured using a flame atomic absorption
spectroscopy (Perkin Elmer A Analyst 100).
2.3. Procedures
2.3.1. Effect of pH value: This part of the experiment was performed to verify the effect of pH effect, the parameters of
temperature, solution volume, adsorbent amount, initial metal ion concentration, and shaking time were fixed at 30ºC 10 mL,
0.2 g, 10 mg/L, and 120 min, respectively. pH was tested for Cd (II) at pH 2, 3, 4, 5, 6, 7 and 8, While, for Cu(II) was at pH
3, 4, 5, 6, 7 and 8 and agitation speed was maintained at 130 rpm.
2.3.2. Effect of adsorbent amount: Different weights of adsorbent rice husk (0.1 g, 0.2 g, 0.3 g, 0.4 g and 0.5 g) were
mingled and shaked with 10 mL of solution at 10 mg/L of Cu(II) and Cd (II) with 30ºC and pH 6 for 120 min to study the
effect of biomass weight on sorption process.
2.3.3. Effect of contact time: The effect of time was investigated by agitating 0.2 g of adsorbent at pH 6, 30ºC in 10 mL, 10
mg/L of Cd(II) and Cu(II) solution over time periods of 10 min, 15 min, 30 min, 45 min, 60 min and 120 min at constant
agitation speed of 130 rpm.
2.3.4. Effect of initial heavy metal concentration: Different Cu(II) and Cd(II) concentrations of 10 mg/L, 20 mg/L, 30
mg/L, 40 mg/L, 50 mg/L, 60 mg/L, 70 mg/L and 80 mg/L were examined at fixed parameters, 0.2 g of adsorbent with pH 6
added into 10 mL of solutions for 120 min in order to assess initial metal concentration.
www.tsijournals.com | May-2017
3
2.3.5. Effect of temperature: Adsorption process achieved at various values of temperature (25°C, 30°C, 35°C, 40°C, 45°C
and 50°C), at pH 6, 0.2 g adsorbent weight and 10 mL in volume of 10 mg/L for Cd(II) and Cu(II) at 120 min.
2.3.6. Isotherm studies: To assess, equilibrium process of different Cu(II) and Cd(II) varying from 10 mg/L to 70 mg/L
were investigated at fixed parameters, pH 6 with 0.2 g of adsorbent, 30°C and 150 rpm for 6 h.
2.4. Calculation of copper and cadmium uptake
The removal uptake and adsorption capacity given by Yoonaiwong et al. [7] and analyzed as following Eq.1 and Eq. 2.
0 0 % 100 / 1eMetal removal C C C
The capacity of adsorption (mg/g) for heavy metal ions can be analyzed based on the mass balance according as;
0 ) 2( / e eq C C V m
Where (C0) is the primary concentration of metal ions in the solution (mg/L), Ce is the equilibrium concentration of heavy
metal ions in the solution (mg/L), (V) is the volume of solution (in liters) and (m) is the mass of adsorbent applied in grams.
2.5. Fourier Transform Infrared (FTIR) analysis of rice husk
FT-IR analysis was done to predict the functional groups on the walls of the adsorbent responsible for the adsorption process.
FTIR spectra were showed for adsorbent solid samples before and after adsorption process for Cu(II). The spectra were
recorded in Tensor - 27. Bruker transformed Infrared (FTIR). A sample of the adsorbent with the range 400 cm-1
to 4000 cm-
1.
2.6. Scanning electron microscopy (SEM)
Scanning electron microscope (Model S 3400N, Hitachi, Japan) analysis was carried out for the dry rice husk particles and
different sections in the samples were examined (before and after of Cu(II) adsorption) for determining the surface
morphology.
3. Results and Discussion
3.1. Effect of pH
pH value has large effect in adsorption studies, because it influences the activity of functional groups in the adsorbents.
Results of the effect of pH on adsorption of copper and cadmium ions are presented in FIG. 1. It was found that the total
amount of adsorption of Cu(II) and Cd(II) onto rice husk increases with an increase of pH from 3 to 6 and reached a higher
value at pH 6. At low pH (2- 3), more H3O+ ions will be available to compete with copper ions for the adsorption sites of the
adsorbent, most of the functional groups are protonated [8]. As pH changes, surface charge also changes, and the sorption of
charged species is affected (attract ion between the positively charged metal ion and the negatively charged rice husk
surface). The solution pH was retained in the pH range of 2 – 6 due to the precipitation of metal ion was happened
simultaneously at pH values higher than 6 [9].

www.tsijournals.com | May-2017
4
FIG. 1. Effect of pH values on Cu(II) and Cd(II) ions sorption.
3.2. Effect of adsorbent amount
Mass of adsorbents is one of the significant factors in adsorption processes due to it determines the uptake of an adsorbent
FIG. 2, displays that the adsorption of metals increases gradually with an increase in the amount of rice husk because the
greater availability of metal binding sites of the surface area at higher amount of the adsorbent [10]. Adsorption decreases at
higher concentrations of adsorbent (0.5 g), because at high adsorbent amounts cause cell agglomeration and a consequent
reduction in intercellular distance between dense layer of cells, leading to the ‘shield’ of binding sites from metal ions [11]. A
relationship could also be given between a adsorbent amount and metal removal due to the availability of metal ion may be
limited with increased interference, electrostatic interactions between binding sites, and reduced mixing at higher adsorbent
dose.
FIG. 2. Effect of adsorbent amounts on percentage uptake of Cu(II) and Cd(II) ions sorption.
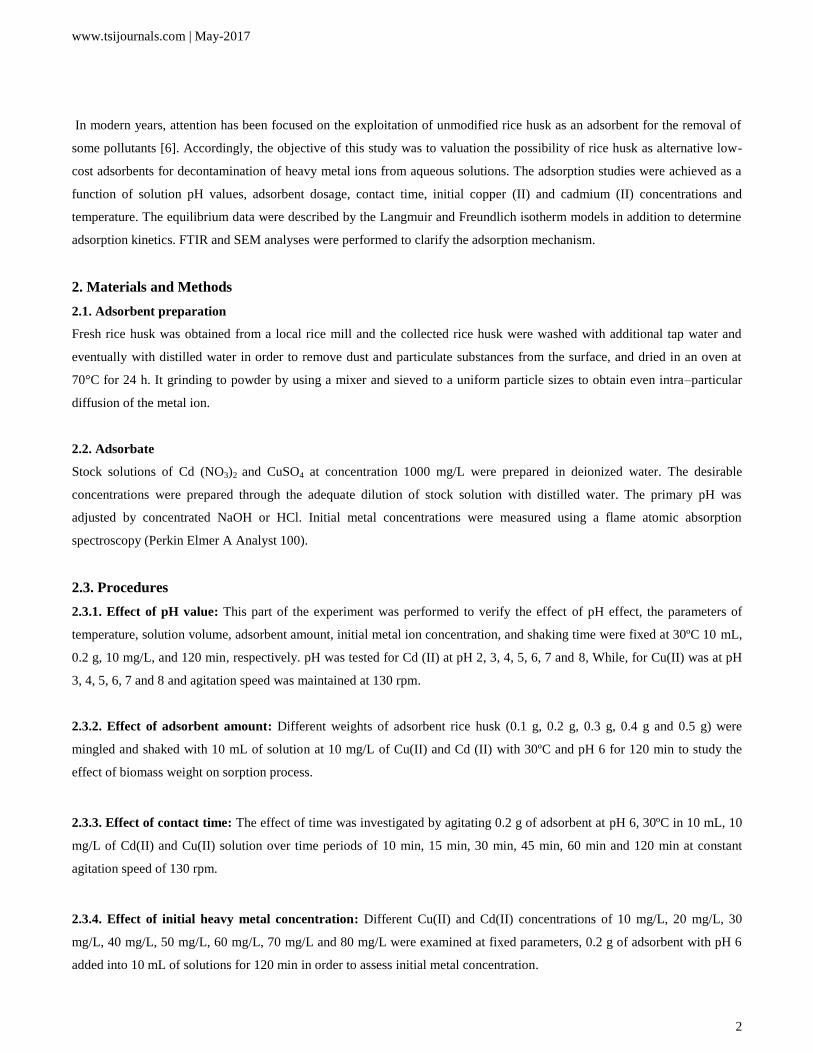
3.3. Effect of contact time
The effect of sorption time on sorption efficiency has been showed in FIG. 3. The plot reveals that the percent of Cu(II) and
Cd(II) removal were about 33.84% of Cu(II) and 30% of Cd(II) within the first 10 min this is probably owing to a larger
surface area of the rice husk being available at the beginning for the adsorption of heavy metal ions. The increasing contact
time increased the copper and cadmium adsorption and it remained constant after equilibrium was reached in 120 min, as the
binding sites became exhausted, the uptake rate slowed due to competition for decreasing availability of actives sites by
metal ions.
0102030405060708090
100
0 1 2 3 4 5 6 7 8M
etal
rem
oval
(%)
pH
Cu(II) Cd(II)
www.tsijournals.com | May-2017
5
FIG. 3. Effect of contact time on percentage uptake of upper and cadmium ions sorption.
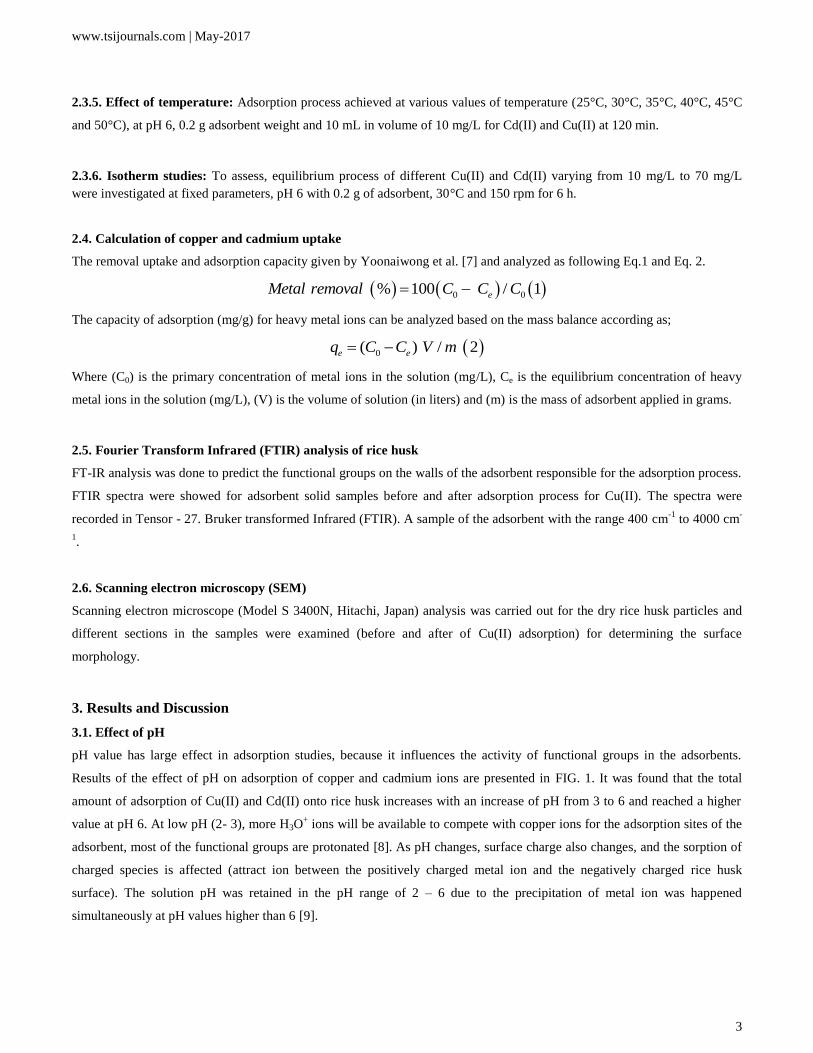
3.4. Effect of initial concentration
The effect of initial copper and cadmium ions concentration on adsorption was examined and is shown in FIG. 4. It is
obvious from this figure that the percentage removal of Cu(II) and Cd (II) ions reduced with the increase in initial
concentration of Cu(II) and Cd(II) ions. The percentage removal minimizes from 97.48 to 81.33% for Cu(II) ions; while, in
Cd(II) ions 97.58 to 80.02% at the same condition.
FIG. 4. Effect of initial metal ion concentration on percentage uptake of copper and cadmium ions sorption.
A significant dose of metal ions adsorbed at high initial metal concentration can be related to two factors, namely high
probability of collision amongst metal ions with the adsorbent surface and high rate of metal ions diffusion onto adsorbents
surface [12]. As discussed by Wang et al. [13], high initial metal concentration accelerates the driving force and decrease the
mass transfer resistance of copper and cadmium ions between the aqueous phase and the solid phase.
3.5. Effect of temperature
FIG. 5, showed the change of percentage removal with temperature of solution. It can be concluded that the higher
percentage removal of metals has been obtained at 30°C and reduced with the rise in temperature from 30°C to 50°C. With
raise in temperature above 20°C to 30°C, this is mainly due to the decreased surface activity, and increasing temperature is
0102030405060708090
100
0 20 40 60 80 100 120 140 160 180Met
al
rem
oval
(%)
Contact time (min)
Cd(II) Cu(II)
70
75
80
85
90
95
100
0 10 20 30 40 50 60 70
Met
al
rem
oval
(%)
Concentration (mg/L)
Cd(II) Cu(II)

www.tsijournals.com | May-2017
6
known to increase the diffusion rate of adsorbate molecules within pores and will also, modify the equilibrium capacity of the
adsorbent for a particular adsorbate [14].
FIG. 5. Effect of temperature on percentage uptake of copper and cadmium ions sorption.
3.6. Adsorption isotherm models
The study of adsorption isotherms is fundamental in supplying the essential information desired for the design of the sorption
process. In this investigation Langmuir and Freundlich isotherm models were used to analyze the equilibrium data.
3.6.1. Langmuir isotherm model: Langmuir adsorption isotherm [15] applied to equilibrium adsorption assuming a
monolayer adsorption onto the surface of the adsorbent with a finite number of identical sites. The isotherm is presented by
the following equation:
/ ( 3) 1e max e eq q bC bC
where qe (mg/g) is the observed adsorption uptake at equilibrium, qmax (mg/g) is the maximum adsorption uptake
corresponding to the saturation capacity (representing total binding sites of biomass), Ce (mg/L) is the equilibrium
concentration and b (L/mg) is a coefficient related to the affinity between the sorbent and sorbate (b is the energy of
adsorption). The linear relationship can be obtained by plotting (1/qe) vs. (1/Ce):
1/ 1/ /) 4( 1e max e maxq bq C q
In which b and qmax are determined from slope and intercept, respectively. The different adsorbents can be compared by it’s
respectively qmax values which are calculated from fitting the Langmuir isotherm model to actual experimental data. The
essential features of the Langmuir isotherm probably expressed in terms of equilibrium parameter RL, which is a
dimensionless steady referred to as separation factor or equilibrium parameter [16].
( 1/ 1 5)L eR bC
Where: Ce is the initial concentration b is the fixed related to the energy of adsorption (Langmuir Constant). RL value shows
the adsorption nature to be either unfavorable if RL>1), linear if RL =1, favorable if 0< RL<1 and irreversible if RL=0. From
the data calculated in TABLE 1, the RL is more than 0 but less than 1 indicating that Langmuir isotherm is favorable. The
displayed results demonstrate that the Langmuir isotherm models able to fit the sorption of Cu(II) and Cd(II) by rice husk
with the linear regression coefficient "R2" of 0.95 and 0.98, respectively. And the maximum monolayer coverage capacity
70
75
80
85
90
95
100
10 15 20 25 30 35 40 45 50
Met
al
rmo
va
l (%
)
Temperature (°C)
Cd(II) Cu(II)
www.tsijournals.com | May-2017
7
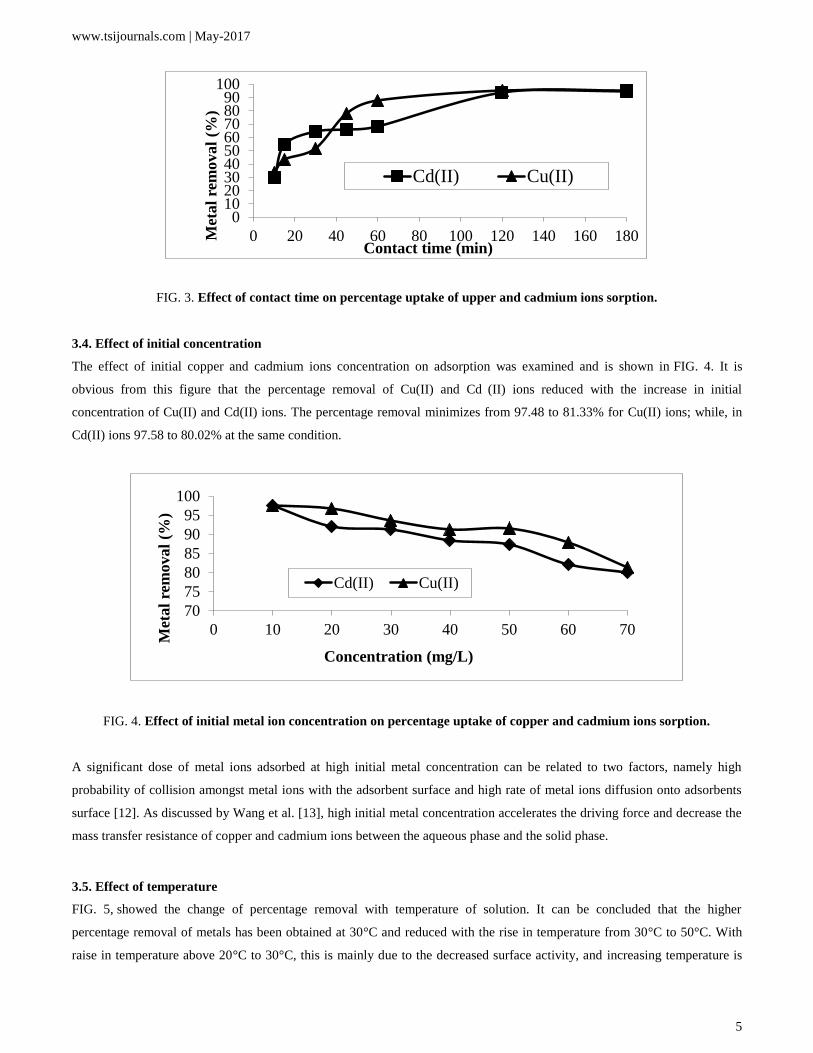
(qmax) from Langmuir Isotherm model was determined to be 133.34 mg/g for Cu(II) ions while, for Cd(II) ions 41.15 mg/g.
The Langmuir constant (b) which is related to the heat of adsorption was found to be 0.07 and 2.56 for uptake of Cu(II) ions
and Cd(II) ions, respectively as shown in FIG. 6, and TABLE 1, RL (the separation factor) is 0.81 and 0.28 for Cu(II) and
Cd(II) ions respectively, indicating that the equilibrium sorption was favorable.
FIG. 6. Langmuir isotherms plot for the sorption of Cu(II) and Cd(II).
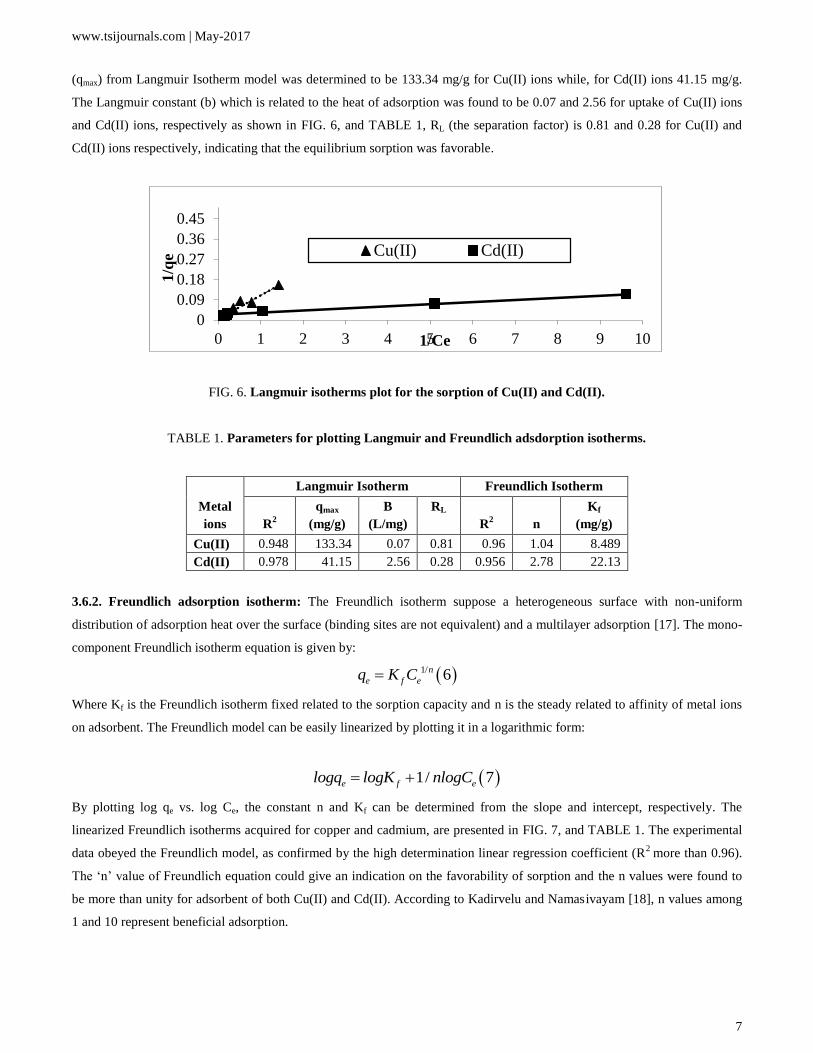
TABLE 1. Parameters for plotting Langmuir and Freundlich adsdorption isotherms.
Metal
ions
Langmuir Isotherm Freundlich Isotherm
R2
qmax
(mg/g)
B
(L/mg)
RL
R2 n
Kf
(mg/g)
Cu(II) 0.948 133.34 0.07 0.81 0.96 1.04 8.489
Cd(II) 0.978 41.15 2.56 0.28 0.956 2.78 22.13
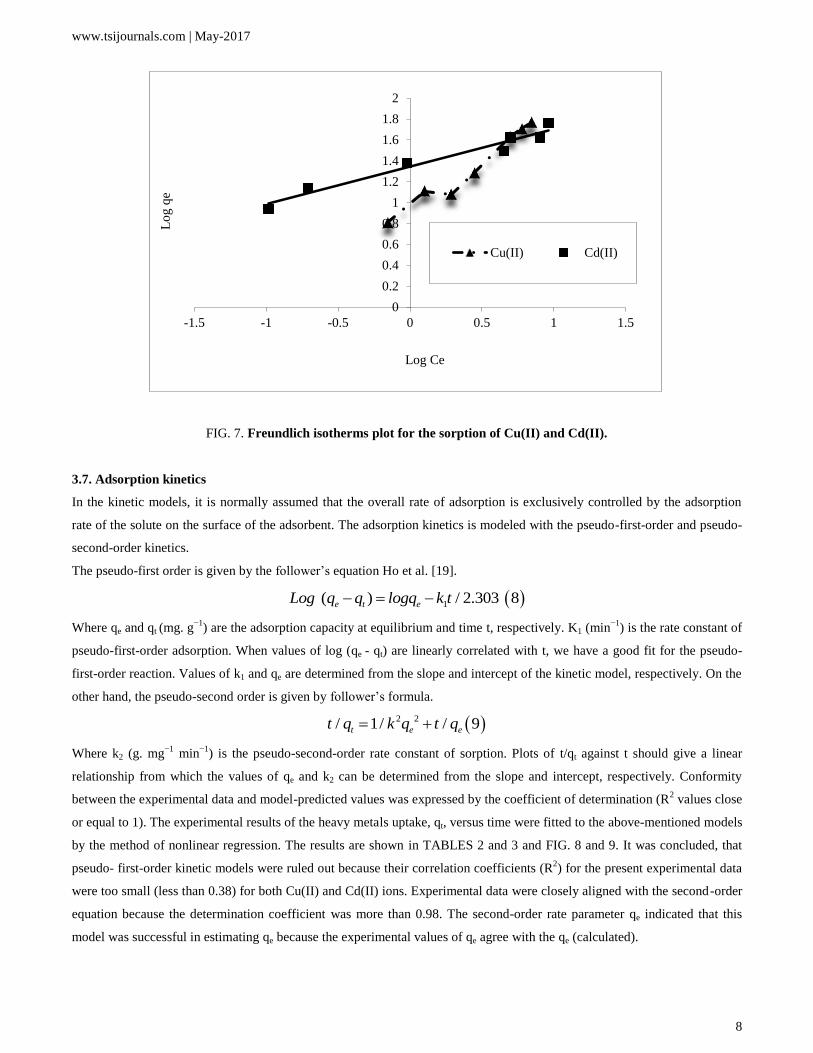
3.6.2. Freundlich adsorption isotherm: The Freundlich isotherm suppose a heterogeneous surface with non-uniform
distribution of adsorption heat over the surface (binding sites are not equivalent) and a multilayer adsorption [17]. The mono-
component Freundlich isotherm equation is given by:
1/ 6n
e f eq K C
Where Kf is the Freundlich isotherm fixed related to the sorption capacity and n is the steady related to affinity of metal ions
on adsorbent. The Freundlich model can be easily linearized by plotting it in a logarithmic form:
1/ 7e f elogq logK nlogC
By plotting log qe vs. log Ce, the constant n and Kf can be determined from the slope and intercept, respectively. The
linearized Freundlich isotherms acquired for copper and cadmium, are presented in FIG. 7, and TABLE 1. The experimental
data obeyed the Freundlich model, as confirmed by the high determination linear regression coefficient (R2
more than 0.96).
The ‘n’ value of Freundlich equation could give an indication on the favorability of sorption and the n values were found to
be more than unity for adsorbent of both Cu(II) and Cd(II). According to Kadirvelu and Namasivayam [18], n values among
1 and 10 represent beneficial adsorption.
0
0.09
0.18
0.27
0.36
0.45
0 1 2 3 4 5 6 7 8 9 10
1/q
e
1/Ce
Cu(II) Cd(II)
www.tsijournals.com | May-2017
8
FIG. 7. Freundlich isotherms plot for the sorption of Cu(II) and Cd(II).
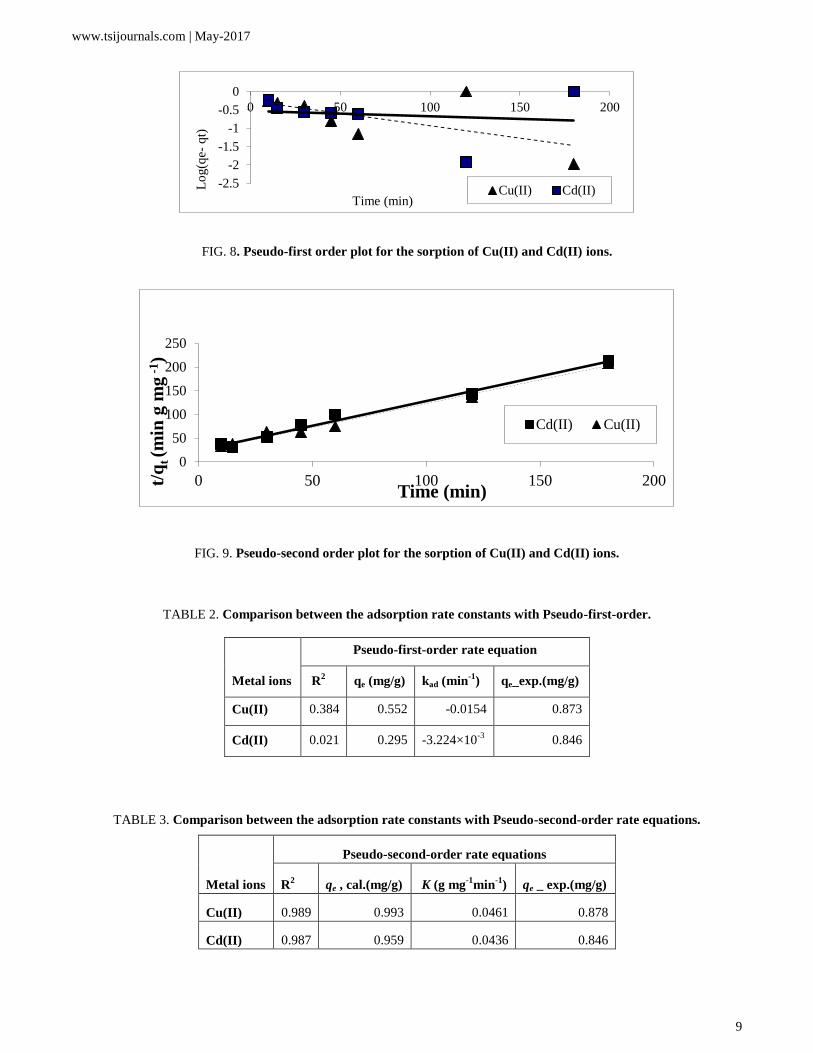
3.7. Adsorption kinetics
In the kinetic models, it is normally assumed that the overall rate of adsorption is exclusively controlled by the adsorption
rate of the solute on the surface of the adsorbent. The adsorption kinetics is modeled with the pseudo-first-order and pseudo-
second-order kinetics.
The pseudo-first order is given by the follower’s equation Ho et al. [19].
1 / 2.303 8( )e t eLog q q logq k t
Where qe and qt (mg. g−1
) are the adsorption capacity at equilibrium and time t, respectively. K1 (min−1
) is the rate constant of
pseudo-first-order adsorption. When values of log (qe - qt) are linearly correlated with t, we have a good fit for the pseudo-
first-order reaction. Values of k1 and qe are determined from the slope and intercept of the kinetic model, respectively. On the
other hand, the pseudo-second order is given by follower’s formula.
2 2/ 1/ / 9t e et q k q t q
Where k2 (g. mg−1
min−1
) is the pseudo-second-order rate constant of sorption. Plots of t/qt against t should give a linear
relationship from which the values of qe and k2 can be determined from the slope and intercept, respectively. Conformity
between the experimental data and model-predicted values was expressed by the coefficient of determination (R2 values close
or equal to 1). The experimental results of the heavy metals uptake, qt, versus time were fitted to the above-mentioned models
by the method of nonlinear regression. The results are shown in TABLES 2 and 3 and FIG. 8 and 9. It was concluded, that
pseudo- first-order kinetic models were ruled out because their correlation coefficients (R2) for the present experimental data
were too small (less than 0.38) for both Cu(II) and Cd(II) ions. Experimental data were closely aligned with the second-order
equation because the determination coefficient was more than 0.98. The second-order rate parameter qe indicated that this
model was successful in estimating qe because the experimental values of qe agree with the qe (calculated).
0
0.2
0.4
0.6
0.8
1
1.2
1.4
1.6
1.8
2
-1.5 -1 -0.5 0 0.5 1 1.5
Lo
g q
e
Log Ce
Cu(II) Cd(II)
www.tsijournals.com | May-2017
9
FIG. 8. Pseudo-first order plot for the sorption of Cu(II) and Cd(II) ions.
FIG. 9. Pseudo-second order plot for the sorption of Cu(II) and Cd(II) ions.
TABLE 2. Comparison between the adsorption rate constants with Pseudo-first-order.
Metal ions
Pseudo-first-order rate equation
R2 qe (mg/g) kad (min
-1) qe_exp.(mg/g)
Cu(II) 0.384 0.552 -0.0154 0.873
Cd(II) 0.021 0.295 -3.224×10⁻³
0.846
TABLE 3. Comparison between the adsorption rate constants with Pseudo-second-order rate equations.
Metal ions
Pseudo-second-order rate equations
R2 qe , cal.(mg/g) K (g mg
-1min
-1) qe _ exp.(mg/g)
Cu(II) 0.989 0.993 0.0461 0.878
Cd(II) 0.987 0.959 0.0436 0.846
-2.5
-2
-1.5
-1
-0.5
0
0 50 100 150 200
Lo
g(q
e- q
t)
Time (min) Cu(II) Cd(II)
0
50
100
150
200
250
0 50 100 150 200t/q
t (m
in g
mg
-1)
Time (min)
Cd(II) Cu(II)

www.tsijournals.com | May-2017
10
3.8. FTIR Spectrum
FTIR analysis was investigated in order to identify the different functional groups present in rice husk FIG.10 and 11, which
were responsible for adsorption process. By comparing the FTIR spectra of rice husk before and after adsorption, there were
remarkable shifts in some bands TABLE 4. These bands are the function groups of rice husk participate in Cu(II) adsorption.
FIG. 10. IR spectrum before adsorption of Copper ions.
FIG. 11. IR spectrum after adsorption of Copper ions.

www.tsijournals.com | May-2017
11
TABLE 4. FTIR spectral characteristics of rice husk before and after adsorption of Cu(II).
FT-IR Peak Assignment groups Unloaded (cm-1
) Loaded (cm-1
) Difference (cm-1
) Reference
1 –OH group –NH stretching 3416.22 3415.42 0.8 20 & 21
2
Symmetric stretching of aliphatic
chains (-CH) 2925.79 2926.7 0.91 22
3 C–H stretch 2133.13 2365.74 232.61
4 C=O bonds 1712.94 ……
23
5
C=C stretching; N–H stretching;
Symmetric C=O 1651.01-1511.68 1651.66 0.65 7 & 24
15 Aromatic compound 788.13-467.57 764.15-472.17 23.98; 4.6
3.9. Scanning electron microscopy (SEM)
The morphology of rice husk surface was analyzed by scanning electron microscopy before and after metals loading FIG. 12a
and 12b. The cells before exposure were fine, well-shaped and had certain dimensions. After exposure to metals the SEM
analysis is clearly indicated the presence of lot of irregular surface, swollen, highly porous structure of the RH sample studied
and their surface becomes meanders after exposure to metals ions solution. This may be because changes in surface
morphology are usually related to disruption of the cross-linking between the metal ions and negatively charged chemical
groups, as carboxyl groups, in the cell wall [20-25], and evidence the increase surface adsorption of metals.
FIG. 12. SEM micrograph (12000) of rice husk cell wall (a-left) before and (b- right) after copper ions adsorption.
4. Conclusion
The adsorption of Cu(II) and Cd(II) ions by rice husk were investigated and found to be dependent on the pH solution, initial
concentration, contact time and temperature. The maximum removal of Cu(II) and Cd(II) ions were attained at pH 6 at 30°C,
using heavy metals concentration of 10 mg/L. The adsorption isotherm data could be well fitted by both Langmuir equation
and Freundlich equation. The adsorption kinetic was described well by the pseudo-second-order model. Data of the IR
www.tsijournals.com | May-2017
12
spectrum confirmed the presence of some functional groups in the biomass of rice husk. The relatively low cost and high
capabilities of the rice husk make it potentially attractive adsorbent for the elimination of copper and cadmium from
wastewater.
REFERENCES
1. Kadirvelu K, Thamaraiselvi K, Namasivayam C. Removal of heavy metals from industrial wastewaters by
adsorption onto activated carbon prepared from an agricultural solid waste. Bioresource technology. 2001;76(1):63-
5.
2. Demirbas A. Heavy metal adsorption onto agro-based waste materials: A review. Journal of hazardous materials.
2008;157(2):220-9.
3. Ahmad Khan N, Ibrahim S, Subramaniam P. Elimation of heavy metals from wastewater using agricultural wastes
as adsorbents. Malaysian Journal of Science. 2004;23(1):43-51.
4. Abdel-Ghani NT, Hefny M, El-Chaghaby GA. Removal of lead from aqueous solution using low cost abundantly
available adsorbents. International Journal of Environmental Science & Technology. 2007;4(1):67-73.
5. Vempati RK, Musthyala SC, Mollah MY, et al. Surface analyses of pyrolysed rice husk using scanning force
microscopy. Fuel. 1995;74(11):1722-5.
6. Wong KK, Lee CK, Low KS, et al. Removal of Cu and Pb by tartaric acid modified rice husk from aqueous
solutions. Chemosphere. 2003;50(1):23-8.
7. Yoonaiwong W, Kaewsarn P, Reanprayoon P. Biosorption of lead and cadmium ions by non-living aquatic
macrophyte, Utricularia aurea. Sustainable Environment Research. 2011;21(6):369-374.
8. Al-Jariri JS, Khalili F. Adsorption of Zn (II), Pb (II), Cr (III) and Mn (II) from water by Jordanian bentonite.
Desalination and Water Treatment. 2010;21(1-3):308-22.
9. Reddy DH, Seshaiah K, Reddy AV, et al. Optimization of Cd (II), Cu (II) and Ni (II) biosorption by chemically
modified Moringa oleifera leaves powder. Carbohydrate Polymers. 2012;88(3):1077-86.
10. Mall ID, Srivastava VC, Agarwal NK. Removal of orange-G and methyl violet dyes by adsorption onto bagasse fly
ash—kinetic study and equilibrium isotherm analyses. Dyes and pigments. 2006;69(3):210-23.
11. Pons MP, Fuste MC. Uranium uptake by immobilized cells of Pseudomonas strain EPS 5028. Applied Microbiology
and Biotechnology. 1993;39(4):661-5.
12. Putra WP, Kamari A, Yusoff SN, et al. Biosorption of Cu (II), Pb (II) and Zn (II) ions from aqueous solutions using
selected waste materials: Adsorption and characterization studies. Journal of Encapsulation and Adsorption
Sciences. 2014;2014:25-35.
13. Wang L, Chen Z, Yang J, et al. Pb (II) biosorption by compound bioflocculant: performance and mechanism.
Desalination and Water Treatment. 2015;53(2):421-9.
14. Al-Qodah Z. Biosorption of heavy metal ions from aqueous solutions by activated sludge. Desalination. 2006;196(1-
3):164-76.
15. Langmuir I. The adsorption of gases on plane surfaces of glass, mica and platinum. Journal of the American
Chemical society. 1918;40(9):1361-403.
16. Weber TW, Chakravorti RK. Pore and solid diffusion models for fixed‐bed adsorbers. AIChE Journal.
1974;20(2):228-38.

www.tsijournals.com | May-2017
13
17. Freundlich HM. Over the adsorption in solution. J Phys Chem. 1906;57(385):e470.
18. Kadirvelu K, Namasivayam C. Agriculture by-products as metal adsorbents: Sorption of lead (II) from aqueous
solutions onto coir–pith carbon. Environ Technol. 2000;21:1091–97.
19. Ho YS, Ng JC, McKay G. Kinetics of pollutant sorption by biosorbents: A review. Separation and purification
methods. 2000;29(2):189-232.
20. Iqbal M, Saeed A, Zafar SI. FTIR spectrophotometry, kinetics and adsorption isotherms modeling, ion exchange,
and EDX analysis for understanding the mechanism of Cd 2+ and Pb 2+ removal by mango peel waste. Journal of
Hazardous Materials. 2009;164(1):161-71.
21. Sheng PX, Ting YP, Chen JP, et al. Sorption of lead, copper, cadmium, zinc, and nickel by marine algal biomass:
characterization of biosorptive capacity and investigation of mechanisms. Journal of Colloid and Interface Science.
2004;275(1):131-41.
22. Feng N, Guo X, Liang S. Adsorption study of copper (II) by chemically modified orange peel. J Hazard Mater.
2009;164(2):1286-92.
23. Li FT, Yang H, Zhao Y, et al. Novel modified pectin for heavy metal adsorption. Chinese Chemical Letters.
2007;18(3):325-8.
24. Florido A, Valderrama C, Arévalo JA, et al. Application of two sites non-equilibrium sorption model for the
removal of Cu (II) onto grape stalk wastes in a fixed-bed column. Chemical Engineering Journal. 2010;156(2):298-
304.
25. Romera E, González F, Ballester A, et al. Comparative study of biosorption of heavy metals using different types of
algae. Bioresource Technology. 2007;98(17):3344-53.