ad’s initiatives for transport and trade facilitation in … · 2016-07-27 · ad’s initiatives...
TRANSCRIPT

ADB’s Initiatives for Transport and Trade Facilitation in South Asia and Beyond
Kavita Iyengar India Resident Mission
Asian Development Bank July 2016
Disclaimer: In preparing any country program or strategy, financing any project, or by making any designation of, or reference to, a particular
territory or geographic area in this document, the Asian Development Bank does not intend to make any judgments as to the legal or other
status of any territory or area.

The Drivers for Creating Opportunities
The Challenges


4
Share of Major Regions in World GDP
Baseline 2009 Year 2014 Asian
Century Scenario 2050
RoW, 5.4%
Asia, 34%
EU, 28%
US, 33%

South Asia: the Least Integrated Region in the World
Intra-regional Trade Share (%)
Source: ADB ARIC Trade and Integration database (www.aric.adb.org); raw data from IMF DOTS
100 hours for trucks to cross between Petrapole & Benapole 200 signatures in Nepal to trade goods with India
5
37.5
0.1
7.4
2.7
29.20
45.5
7.1 4.8 5.3
35.50
0
5
10
15
20
25
30
35
40
45
50
ASEAN+3 Central Asia Oceania South Asia East Asia
1990
2014
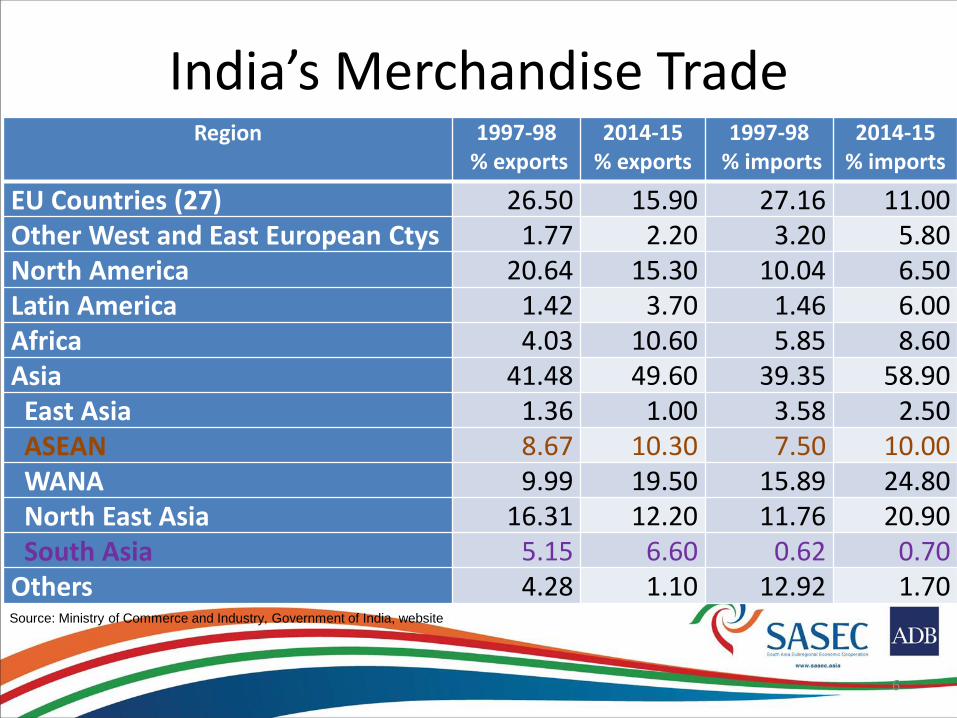
India’s Merchandise Trade
6
Region 1997-98 % exports
2014-15 % exports
1997-98 % imports
2014-15 % imports
EU Countries (27) 26.50 15.90 27.16 11.00 Other West and East European Ctys 1.77 2.20 3.20 5.80 North America 20.64 15.30 10.04 6.50 Latin America 1.42 3.70 1.46 6.00 Africa 4.03 10.60 5.85 8.60 Asia 41.48 49.60 39.35 58.90 East Asia 1.36 1.00 3.58 2.50 ASEAN 8.67 10.30 7.50 10.00 WANA 9.99 19.50 15.89 24.80 North East Asia 16.31 12.20 11.76 20.90 South Asia 5.15 6.60 0.62 0.70 Others 4.28 1.10 12.92 1.70 Source: Ministry of Commerce and Industry, Government of India, website

Transport • Road transport is the dominant mode (65–70% of
movement) but substantial missing links across national boundaries
• Post 1947, border management led to closure of historical land routes
• IWT transit was restored in 1972
• Transit through Pakistan from India to Afghanistan remains suspended
• Incompatible transport technology platforms emerged impairing interoperability, esp rail

8
Asian Highway

9
Trans-Asia Railway

Trade Facilitation Indicators
10
Source: Ease of doing business, World Bank 2015.
0
50
100
150
200
250
300
350
0 20 40 60 80 100 120
Tim
e t
o im
po
rt:
Bo
rder
co
mp
lia
nc
e (
ho
urs
)
Time to export: Border compliance (hours)
OECD
Bangladesh
South Asia
Nepal Thailand
China
Singapore
India

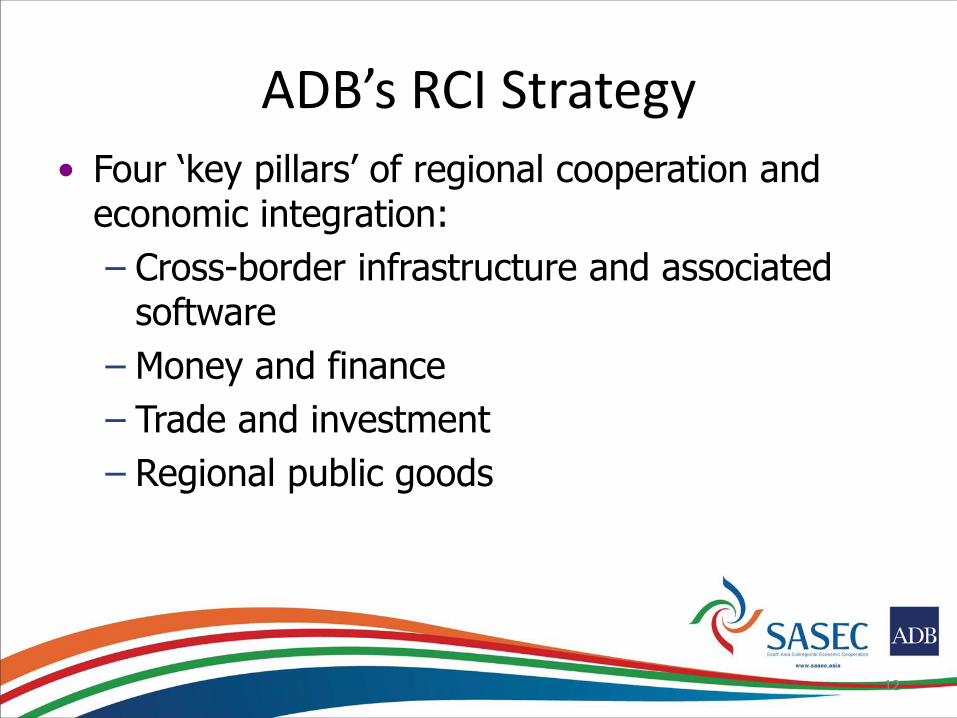
ADB’s RCI Strategy
• Four ‘key pillars’ of regional cooperation and economic integration:
– Cross-border infrastructure and associated software
– Money and finance
– Trade and investment
– Regional public goods
12

The Garland of an Integrated Asia
13
ASEAN Association of Southeast Asian Nations BIMP-EAGA Brunei Darussalam-Indonesia-Malaysia-Philippines East ASEAN Growth Area BIMSTEC Bay of Bengal Initiative for Multisectoral Technical and Economic Cooperation CAREC Central Asia Regional Economic Cooperation GMS Greater Mekong Subregion IMT-GT Indonesia Malaysia Thailand Growth Triangle PIF Pacific Islands Forum SAARC South Asian Association for Regional Cooperation Disclaimer: In preparing any country program or strategy, financing any project, or by making any designation of, or reference to, a particular
territory or geographic area in this document, the Asian Development Bank does not intend to make any judgments as to the legal or other
status of any territory or area.
SASEC

RCI in Practice in South Asia
Nepal
Sri Lanka
Afghanistan
Bangladesh
India
Bhutan
Pakistan
Maldives
Thailand
Myanmar
BIMSTEC (1997)
SASEC (2001)
SAARC
(1985)
14

BIMSTEC
15
India
12% GDP
SE & E Asia
12% GDP
PRC
18.4% GDP
BIMSTEC FTA Potential: $43B-$59B trade creation

• Roads
• Telecommunications
• Power Transmission Line
Infrastructure Development in
GMS (1992)
• Roads
• Telecommunications
• Power Transmission Line
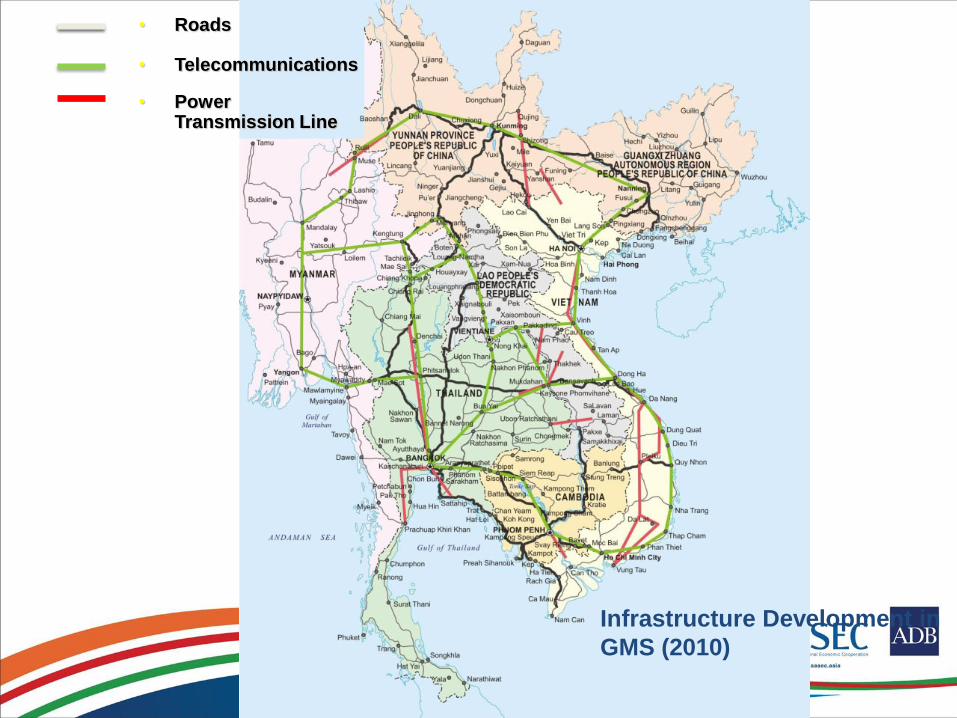
Infrastructure Development in
GMS (2010)
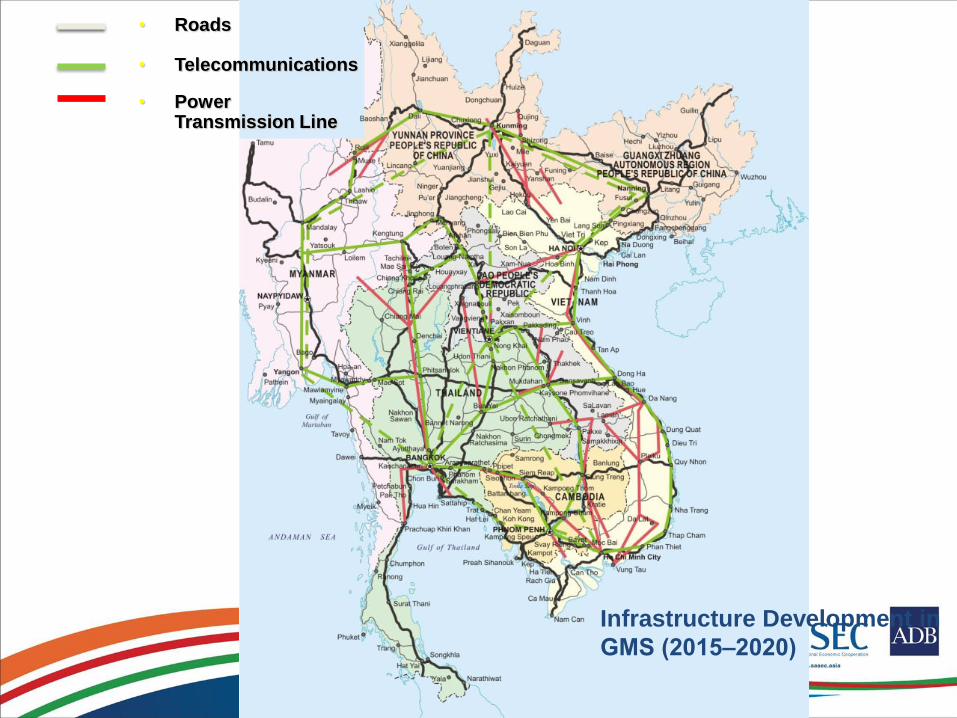
• Roads
• Telecommunications
• Power Transmission Line
Infrastructure Development in
GMS (2015‒2020)

• Institution-light; projects-heavy
• 37 investment projects –US$ 6.7 billion since 2001
• 69 TA projects – US$ 64.5 million since 2001
• Focus on transport, trade facilitation, energy
• Additional areas supported: tourism, ICT
• Ensures private sector participation in SASEC activities
• Supports SAARC and BIMSTEC

SASEC Transport Corridors
• SAARC Corridors 4, 8
• Bangladesh- Dhaka NW Corridor, Banglabandha-Mongla/ Chittagong
• Bhutan- Nanglam-Dewathang, Pasakha Access Rd./ Puentsholing Mini-Dry Port
• India- Panitanki-Fulbari/ Jaigaon-Changrabandha, LCS
• Nepal- Strategic Roads Improvement SASEC-Myanmar Corridor
•Bangladesh- Sylhet-Sheola/ Gundum-Chatta •India- Imphal-Moreh (with Myanmar)/ Silchar-Karimganj (with Bangladesh) •Other SASEC Transport Projects (Bridge, Rail, Port)

SASEC Trade Facilitation
21 Source: UNESCAP
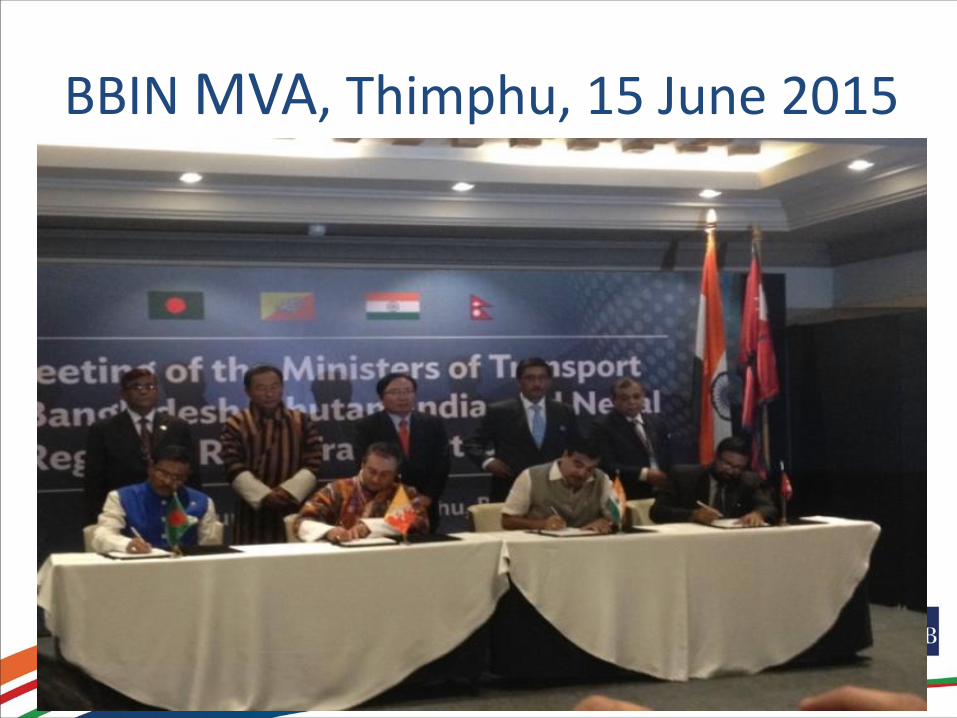
BBIN MVA, Thimphu, 15 June 2015
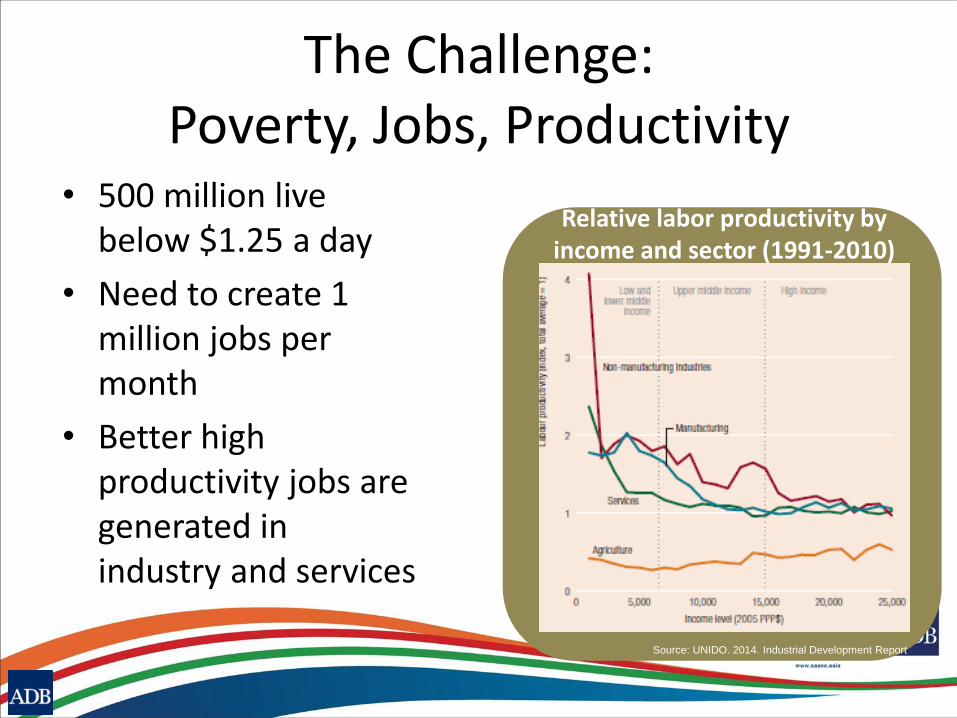
The Challenge: Poverty, Jobs, Productivity
• 500 million live below $1.25 a day
• Need to create 1 million jobs per month
• Better high productivity jobs are generated in industry and services
Relative labor productivity by income and sector (1991-2010)
Source: UNIDO. 2014. Industrial Development Report

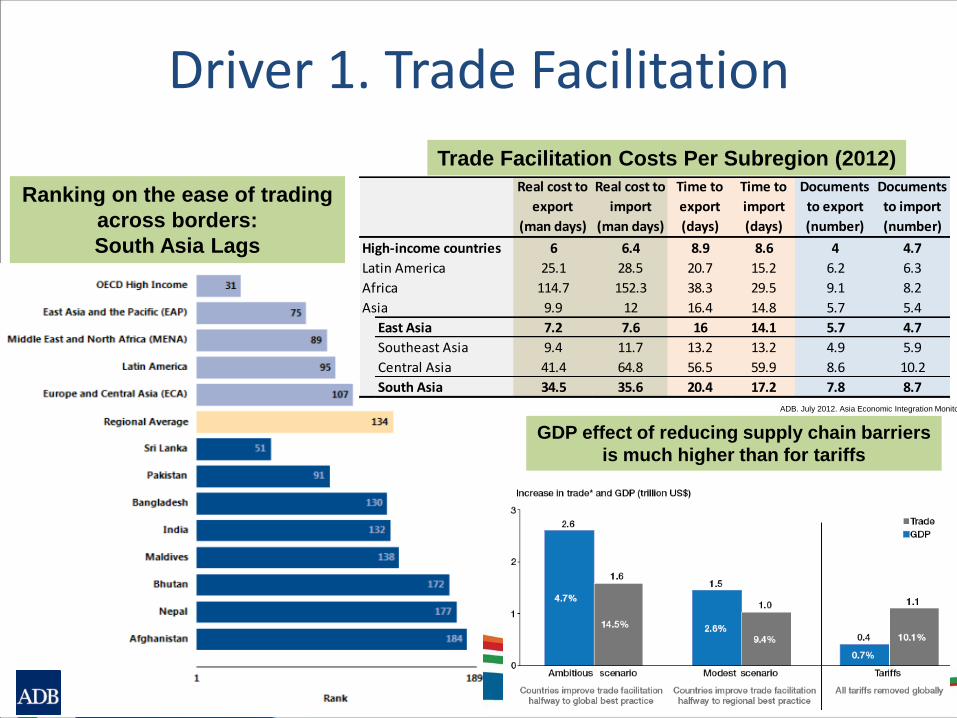
Driver 1. Trade Facilitation
Ranking on the ease of trading
across borders:
South Asia Lags
ADB. July 2012. Asia Economic Integration Monitor
Trade Facilitation Costs Per Subregion (2012)
Real cost to
export
(man days)
Real cost to
import
(man days)
Time to
export
(days)
Time to
import
(days)
Documents
to export
(number)
Documents
to import
(number)
High-income countries 6 6.4 8.9 8.6 4 4.7
Latin America 25.1 28.5 20.7 15.2 6.2 6.3
Africa 114.7 152.3 38.3 29.5 9.1 8.2
Asia 9.9 12 16.4 14.8 5.7 5.4
East Asia 7.2 7.6 16 14.1 5.7 4.7
Southeast Asia 9.4 11.7 13.2 13.2 4.9 5.9
Central Asia 41.4 64.8 56.5 59.9 8.6 10.2
South Asia 34.5 35.6 20.4 17.2 7.8 8.7
GDP effect of reducing supply chain barriers
is much higher than for tariffs
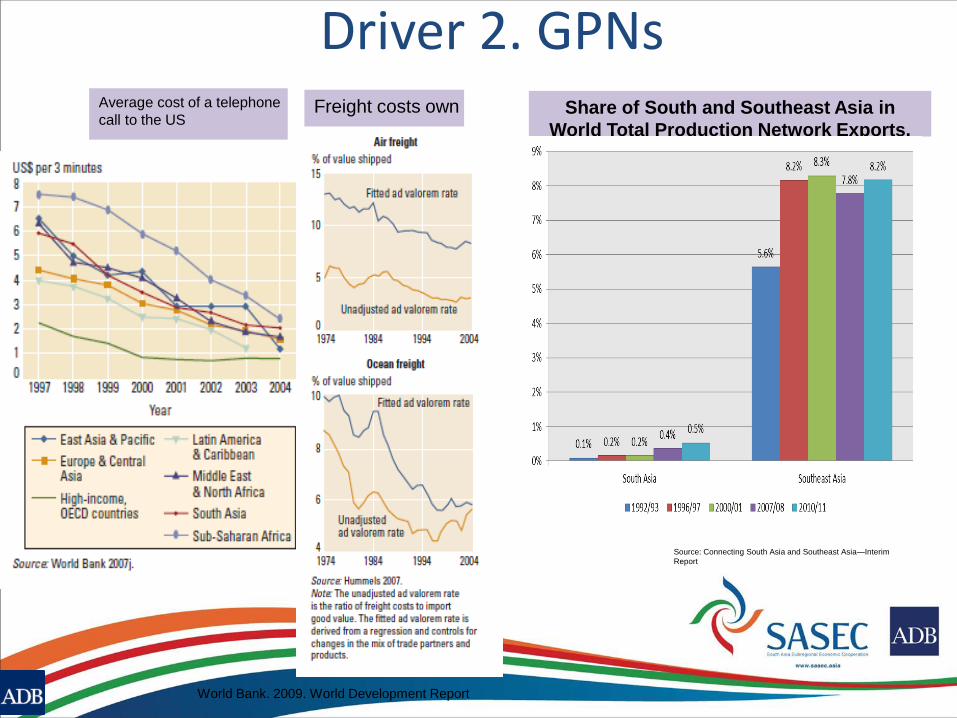
Driver 2. GPNs Share of South and Southeast Asia in
World Total Production Network Exports,
1992–2011
Source: Connecting South Asia and Southeast Asia—Interim
Report
World Bank. 2009. World Development Report
Average cost of a telephone
call to the US Freight costs own
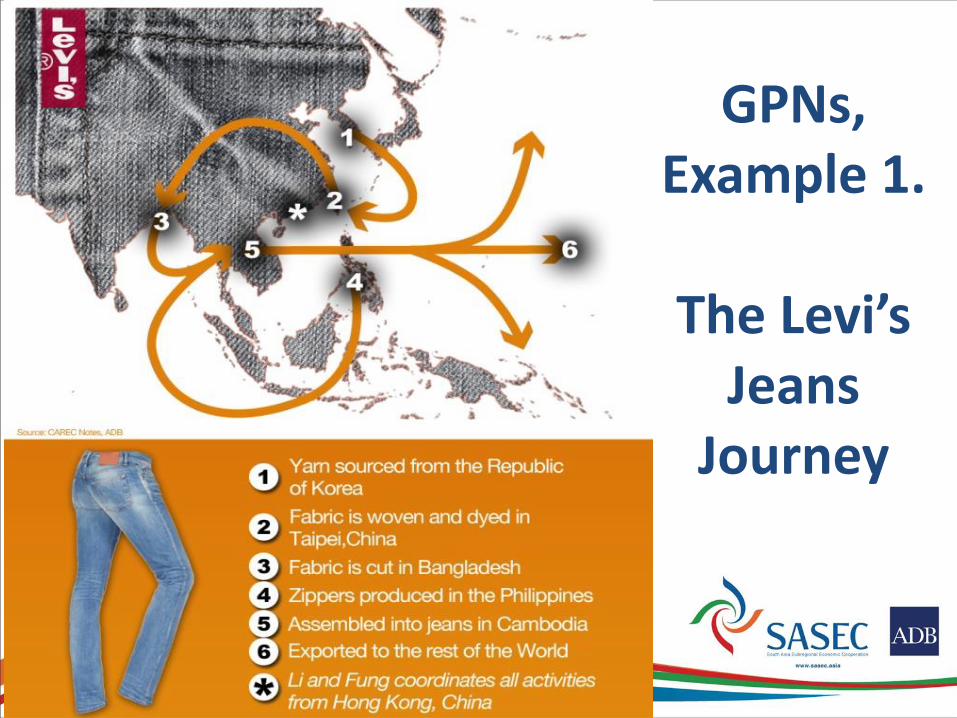
GPNs, Example 1.
The Levi’s
Jeans Journey

GPNs, Example 2
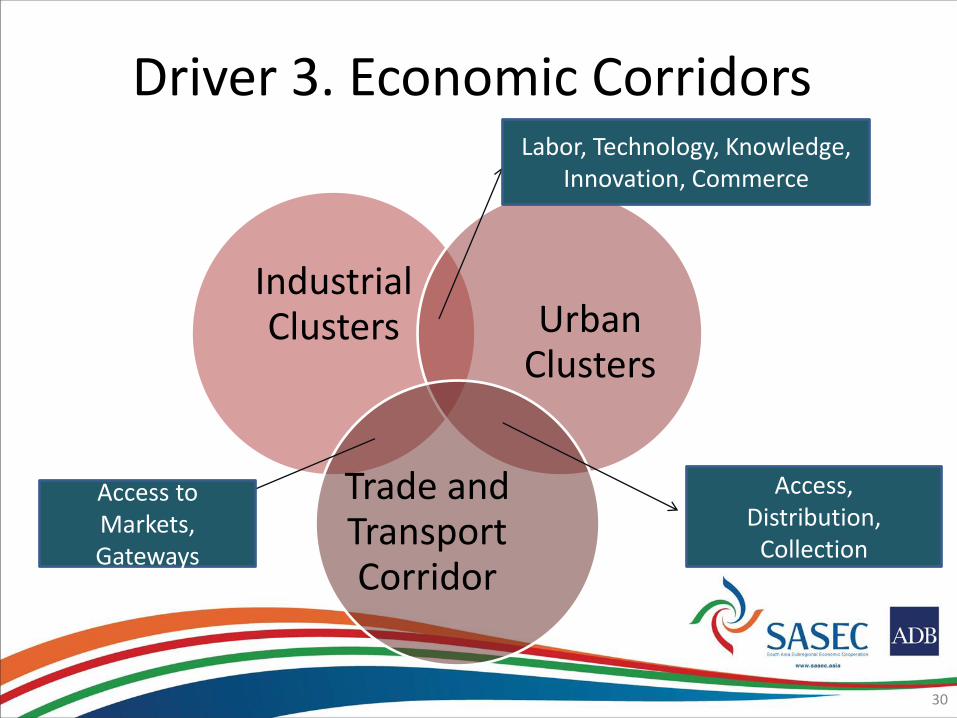
Driver 3. Economic Corridors
Industrial Clusters Urban
Clusters
Trade and Transport Corridor
30
Access,
Distribution, Collection
Labor, Technology, Knowledge, Innovation, Commerce
Access to Markets, Gateways
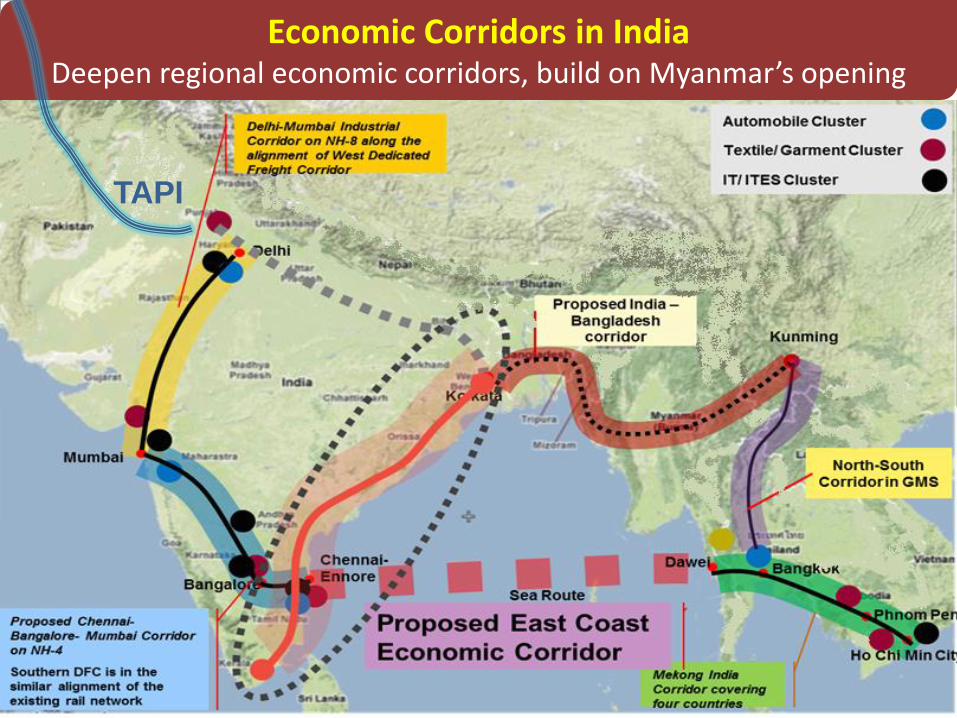
Economic Corridors in India Deepen regional economic corridors, build on Myanmar’s opening
TAPI