adoption and implementation of balanced scorecard … · adoption and implementation of balanced...
TRANSCRIPT

ADOPTION AND IMPLEMENTATION OFBALANCED SCORECARD IN MALAYSIA
Tze San OngFaculty of Economics and Management
University Putra Malaysia, Malaysia
Boon Heng TehFaculty of Management
Multimedia University Malaysia, Malaysia
Chee Kwong LauSharon Lee Shyan Wong
Faculty of Business and Accountancy Inti International University College, Malaysia
Abstract
This paper reports the results of an empirical study on the adoption and implementationof Balanced Scorecard in Malaysia. More specifically, it investigates the sequentialdependency among the four balances Scorecard (BSC) perspectives, namely learning andgrowth, internal business process, customer value and financial performance. The findingsindicate that organizations responded positively to BSC measures and believed the cause-and-effect relationship of BSC will lead to improved business efficiency and profitability.
Keywords: balanced scorecard, cause-and-effect, Malaysia
IntroductionThe transformation of the commercial environment from industrial to informationage is triggered by the globalization and liberalization of markets. Companiesaround the world strive to cope with the rapid changes in the business dynamics.In recognition of the increasingly sophisticated management control practices,several performance measurement frameworks have been introduced, widelydebated and are evolved to fill the gap between operational budgeting and strategicplanning. The multidimensional performances metrics have replaced the moretraditional financial oriented metrics with non-financial measures with the aims ofa more effective focus on the new managerial imperatives (Atkinson, 2006).
21
Asia-Pacific Management Accounting Journal, Volume 5 Issue 1, 21-40, 2010
ISSN 1675-3194© 2010 Asia-Pacific Management Accounting Association, Accounting Research Institute & Facultyof Accountancy and UPENA, Universiti Teknologi MARA, Malaysia.
Chap 2.pmd 10/29/2010, 9:42 AM21

Asia-Pacific Management Accounting Journal, Volume 5 Issue 1, 21-40, 2010
22
The Balanced Scorecard (BSC) is introduced as a superior combination of financialand non-financial measures of performance (Kaplan and Norton, 1996). The useof BSC has gained increasing popularity and attention among industry practitionersand researchers over the years. Nevertheless, it has received strong criticism forits novelty and efficiency as the dominant framework in performance management(Marr and Schiuma, 2003; Smith, 2005). BSC bases its success on the groundsthat all four perspectives (learning and growth, internal process, customer valueand financial success) are linked to each other in a cause-and-effect relationship(Aidemark, 2001). In fact, the cause-and-effect logic has been described as the‘essence’ of the BSC approach.
There is a wide range of management accounting literature that focuses on the fitbetween strategy, management control system and Balanced Scorecard. Despitethe popularity of BSC model being researched in different contexts over theyears, many companies which adopted the BSC model have prioritized the effortsin formulating and implementing strategies of pursuing the goals of maximizingprofits, but rather paying attention to the interrelationships of the four perspectivesin BSC model. When companies’ ultimate aim is to achieve financial successwhich is at the top of the hierarchy of the objectives, they often overlooked theconnections that provide opportunity for them to realize how an action classifiedin one perspective will influence, through chain effects, other dimensions ultimatelyleading to improved financial results (Atkinson, 2006).
Even though developing the causal model of the strategy is the central focus inBSC, Speckbacher et al (2003) found that about half of the German and Austriancompanies did not have a causal model of their strategies. Davis and Albright(2004) found that 75 percent of the American companies did not develop a causalmodel of their strategy. Malmi’s (2001) reported Finnish managers who wereresponsible for BSC initiatives were only able to give vague descriptions of thecause-effect relationship. Speckbacher et al. (2003) argued that this problemarises because there is no specific methodology offered by BSC to assist managersin developing a causal model of their strategy. As such, some organizations ignorethis process. Additionally, Norreklit (2003) pointed out that emphasis on developinga cause-effect model of a strategy assumed that there was a stable structurewithin the system.
It has also been noted that in spite of the emphasis on the use of non-financialperspectives, many BSC programmes end up being overweighed with financialmeasures (Ittner and Larcker, 2003; Lttner et al., 2003). This situation arisesbecause of the complexity in developing and measuring non-financial measures.As the information system of most companies is readily capturing the financialdata, however, it is not the case for non-financial measures. The difficulty in
Chap 2.pmd 10/29/2010, 9:42 AM22
Adoption and Implementation of Balanced Scorecard in Malaysia
23
developing non-financial measures is also partly due to the problem of causalambiguity (Szulanski, 1996).
By understanding of the issues in BSC implementation above, the primary aim ofthis research is to develop a deeper conceptual understanding of BSC byinvestigating whether the theoretically grounded interrelationships among the non-financial and financial performance dimensions are valid in a real business settingamong Malaysian companies. In order to achieve this aim, it is recognized that aresearch question and a number of objectives need to be addressed using aperception study as follows:
Research Question
How are the BSC perspectives (namely financial, customer, internal businessprocess and learning and growth) linked together on a cause-and effectrelationship?
Research Objectives1. To identify whether the emphasis on learning and growth will contribute to
effective internal business production process.2. To examine whether the improved performance in internal business production
process will meet the desired customers’ expectations and satisfactions.3. To study whether the stress on the importance of customers’ satisfactions
will eventually lead to the better financial performance of companies.
Overview of Balanced ScorecardThe Balanced Scorecard (BSC) philosophy has spread rapidly throughout theworldwide business community (Shneiderman, 1999). Over the decades, hundredsof organizations have implemented the BSC concept in one-way or another. TheBalanced Scorecard, although deficient in empirical testing of its benefits(Bourguignon et al., 2004,) is arguably the dominant framework in performancemanagement (Marr and Schiuma, 2003; Smith, 2005). It has been offered by itsinventors, Kaplan and Norton (1996) as the cornerstone of a new strategicmanagement control system which positively links an organization’s long-termstrategic intentions with its short-term operational actions.
Despite its global success, the BSC approach has received criticism for the lackof evidence concerning the reliability of the basic hypotheses of BSC. Norreklit(2003) questioned BSC’s hypotheses by arguing that Kaplan and Norton (1996)do not provide a sufficient description of the assumed causal relationships.
Chap 2.pmd 10/29/2010, 9:42 AM23
Asia-Pacific Management Accounting Journal, Volume 5 Issue 1, 21-40, 2010
24
Furthermore, another issue is that even though the definition of cause-and-effectrelationship is the basis of BSC success, many organizations seem to use BSC asan aggregation of independent performance measures (Aidemark, 2001).Speckbacher et al. (2003) found that only half of the companies using BSC thatwere surveyed, were actually able to formulate cause-and-effect relationshipamong the different objectives and measures. In addition, a study conducted inFinnish companies showed that most companies appear to have scorecards inwhich the resulting measures and perspectives are fairly independent, lacking theclaimed reciprocal interconnections (Malmi, 2001).
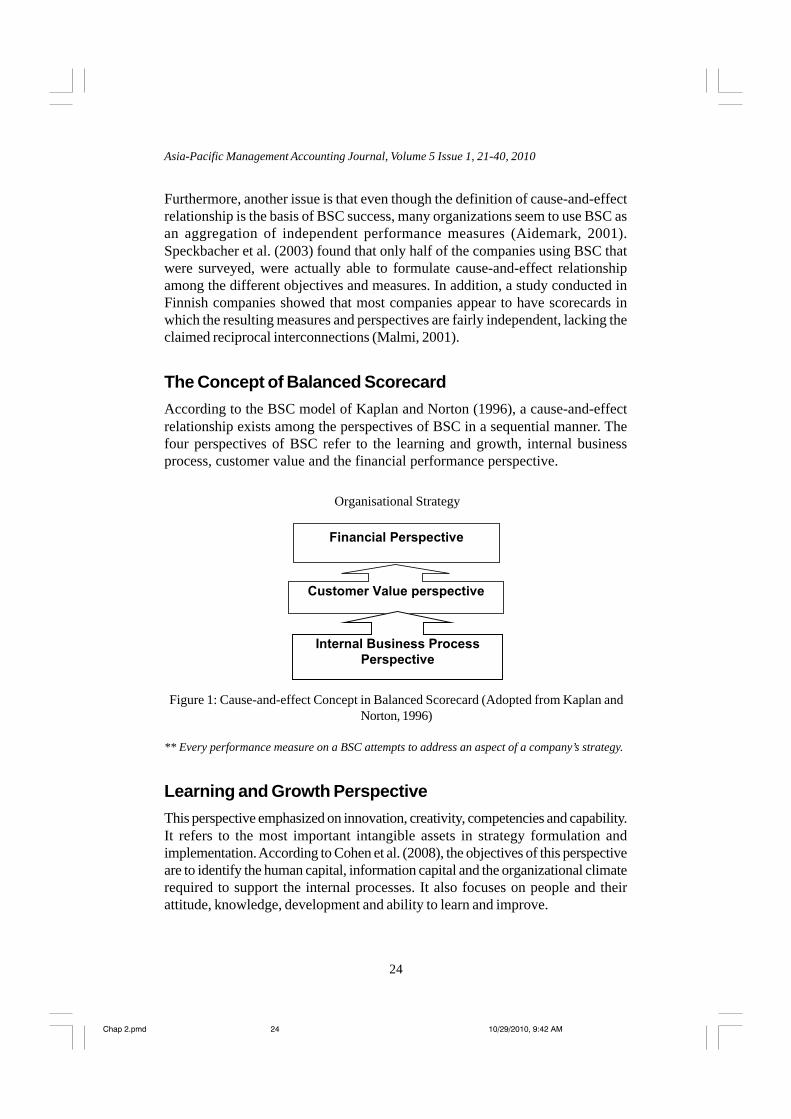
The Concept of Balanced ScorecardAccording to the BSC model of Kaplan and Norton (1996), a cause-and-effectrelationship exists among the perspectives of BSC in a sequential manner. Thefour perspectives of BSC refer to the learning and growth, internal businessprocess, customer value and the financial performance perspective.
Organisational Strategy
Figure 1: Cause-and-effect Concept in Balanced Scorecard (Adopted from Kaplan andNorton, 1996)
** Every performance measure on a BSC attempts to address an aspect of a company’s strategy.
Learning and Growth PerspectiveThis perspective emphasized on innovation, creativity, competencies and capability.It refers to the most important intangible assets in strategy formulation andimplementation. According to Cohen et al. (2008), the objectives of this perspectiveare to identify the human capital, information capital and the organizational climaterequired to support the internal processes. It also focuses on people and theirattitude, knowledge, development and ability to learn and improve.
Chap 2.pmd 10/29/2010, 9:42 AM24
Adoption and Implementation of Balanced Scorecard in Malaysia
25
By emphasizing on activities that develop human capital, organizational learningand growth capability, Ulrich and Lake (1990) argued that the true source ofcompetitive advantage is found in exploiting the capabilities of superior employeeswho can generate successful ideas for improving processes and the valuesdelivered to customers. Johnson et al. (2005) insists that organizations will bestserve customers by investing in employee capabilities through activities such asinvestments in employees through selective hiring and training, investments ininformation systems to support decision-making, employee motivation andempowerment. Furthermore, these activities are hypothesized to increaseemployee job satisfaction, which in turn affects employee retention andproductivity.
Heskett et al (1994) found that employee satisfaction derives from high qualitysupport services provided by the firm, for instance, human capital development.Employee training has been empirically linked with a number of other BSCmeasures. Studies have documented a positive association between skilldevelopment training and employee retention (Whitaker, 1999; Wah, 1998; Lynchand Black, 1998). Training has also been linked to innovation, processimprovements and customer service quality (Lewis and Gabrielsen, 1998; Johnson,1996). Brown, Gaitian and Hicks (1995) observed that developing technicalcompetency was vital in producing innovations and tended to be more profitablethan those firms that did not invest in strategic information systems.
In summary, the empirical evidence supports significant relations of learning andgrowth activities in contribution to the internal business process improvement.Nevertheless, the immensity of empirical evidence in support of significant linksdoes not explicitly test the BSC. These literatures appear to be sufficient evidenceto rely on learning and growth as a foundation for the BSC and as a starting pointfor the causal chain.
Internal Business Process PerspectiveThis perspective identifies the critical processes, skills, competencies andtechnologies that will deliver a value proposition to customers, current and futureorganizational success (Atkinson, 2006). Gartrell (1990) reported that investmenton Research and Development (R&D) is a critical factor in contributing to superioreconomic performance. On the other hand, Aboody and Lev (1998) observedthat capitalization on R&D is significantly positive associated with firm futureearnings. Bhagat and Welch (1995) found a significant positive relation two-yearlagged stock return and current R&D expenditures.
Chap 2.pmd 10/29/2010, 9:42 AM25

Asia-Pacific Management Accounting Journal, Volume 5 Issue 1, 21-40, 2010
26
The majority of the process improvement studies attempted to associate qualitymanagement and firm performance. However, Ittner and Larcker (1997) opinedthat operation measures vary by industry and are not universally related to firmperformance. Two case studies conducted by Gebgert et al (1996) and Krupnickiet al (1997) discovered that firms applying activity-based costing and managementsuccessfully monitor cost effectiveness and profitability of customers. Anotherfinding from Jacobson and Aaker (1987) indicates that product quality is positivelyassociated with higher market share.
According to Rust, Zahorik and Keiningham (1995), the level of service qualityaffects customer satisfaction, acquisition and retention. There is a positiverelationship between customer service and customer retention documented byFriedman (1992), Zahorik and Keiningham (1995) and Ennew and Binks (1996).These studies presented empirical evidence of a positive relation between post-sales service quality and market share.
Overall, the review of the literatures above supports the notion that organizationallearning and growth activities drive to improve internal business processes andappear to be directly related in contributing to greater customer value. Nonetheless,it is worth to highlight that as the findings are from small-scale and limited scopecase studies, it does signify the causal relations of productive employees willincrease the level of innovativeness, customer service and process improvement.
Customer Value PerspectiveThis perspective defines the value proposition used to generate sales and loyaltyfrom targeted customers (Kaplan and Norton, 1996). It requires managers toidentify the potential customers in the targeted segments and consequently choosethe value parameters to deliver to the customers. The wide spectrum of marketingliteratures have provided evidences that perceived customer value determinesthe level of customer satisfaction, which leads to customer acquisition, retentionand ultimately customer profitability and market share (Malina, 2001).
Improving the level of innovativeness, product improvements and after-sales servicemay lead to improved customer satisfaction levels. Krishnan et al (1999) andRust et al (1995) found that the level of service quality determine overall customersatisfaction in service industry.
Satisfied customers may be more likely to continue purchasing from the firm andspread the word-of-mouth to attract new customers. Perceptions of valueperceived are hypothesized to drive customer satisfaction, which has beenexpressed as two related outcomes: customer acquisition and customer retention.
Chap 2.pmd 10/29/2010, 9:42 AM26

Adoption and Implementation of Balanced Scorecard in Malaysia
27
Several studies have found a significantly, positive relation between customersatisfaction and customer acquisition and retention (Anderson and Sullivan, 1993;Bolton and Lemon, 1999) while others have found no significant relation (Mittaland Tsiros, 1999). Some studies have found a significant, positive relation at certainlevels of customer satisfaction. The contradictory findings suggest that satisfiedcustomers may not be easily retained as they are exposed to large variety choicesof products and services which are equally competitive before making anypurchases. The switch in preferences may occur when new products or servicesare introduced to the market.
Many studies have demonstrated a positive relation between customer satisfactionand firm performance. It is reported that the firm performance in relation withprofitability (Banker, Potter and Srinivasan, 2000), revenues (Rucci, Kirn andQuinn, 1998), return on investments (Anderson, Fornell and Lehmann, 1994) andstock returns (Ittner and Larcker, 1998) have shown evidence of a positive relationwith customer satisfaction.
In summary, most marketing research supports the sequential effect of improvedbusiness activities that will lead to improve customer value. Though the empiricalliterature supports the links between customer satisfaction, acquisition andretention, it presents a challenge for firms to devise strategies in securing customerconfidence in their products and services under an intense competitive environment.
Financial Performance PerspectiveThis perspective describes the tangible outcomes of the corporate strategy intraditional financial terms such as profitability, return on capital employed, residualincome, economic value added, sales growth, market share etc (Atkinson, 2006).In other words, the financial objectives are retained as company goals but theyrepresent the long-term aims of the organizations. Financial measures areconsidered the ‘lagging’ indicators in the sense that they are the results of otherformer actions mostly of qualitative nature (Cohen et al., 2008).
Empirical evidence on performance measures used in practice is sparse,particularly for the UK. However, the evidence shows that the most commonmeasures of performance used are the rate of return on investment (ROI) andresidual income (RI) (Fitzgerald, 2007).
Extensive research in the marketing, corporate strategy and managementaccounting literatures have studied the relation between market share and firmperformance. Buzzel et al. (1975) found a strong and positive relation betweenmarket share and profitability. Hergert (1984) documented an average, positiverelation between market share and profitability.
Chap 2.pmd 10/29/2010, 9:42 AM27

Asia-Pacific Management Accounting Journal, Volume 5 Issue 1, 21-40, 2010
28
On the other hand, Markell et al. (1988) concluded that the link between marketshare and profitability is an occasional phenomenon rather than a universal law.Minor (1989) found that the strength of the relationship varies with market sharelevel. Fraering and Minor (1994) documented a weak negative relation suggestingthat the link is so tenuous that firms should be vigilant about formulating strategyof increasing market share.
In summary, there are minimal empirical support on the interrelationships betweencustomer value and firm financial performance. These documented literaturesare no doubt extensive yet inconclusive with both positive and negative findings.The discrepancy of the findings could probably due to the fact that values offinancial ratios per se for a given firm are highly influenced by the characteristicsof the industry which the firm operates within, its life-cycle phase, size, level ofcompetitive pressures and the influence of economic environment.
Research DesignThis research was undertaken by using an explanatory research methodology inexamining the interrelationships of the BSC parameters. A questionnaire surveywas used to collect the primary data from the target respondents. The questionnairecontains three sections with nine statements using a Five-Degree Likert scale ineach section. The first section deals with the respondents level of agreementwith regards to the causal relations of learning and growth and internal businessprocess. In the second section, respondents are asked to rate the degree of theiragreement pertaining to the causal relations of internal business process andcustomer values. The third section prompts to seek the extent of agreement fromrespondents pertinent to the cause-and-effect relationship of customer valuesand financial performance.
Pilot TestThe draft questionnaire was pretested by two senior lecturers and three PhDstudents to clarify the meaning of each question. The revised questionnaire isused in the main survey.
Population and SampleThe population of this research comprises of a group of respondents, mainlyChief Financial Officers, Finance Director, General Manager or equivalent positions,as they are well aware of the performance of the companies. Adoption of BSC isnot a prerequisite for these targeted companies. For those firms that do not adoptBSC either wholly or partially, the use of key performance indicators (KPIs)
Chap 2.pmd 10/29/2010, 9:42 AM28

Adoption and Implementation of Balanced Scorecard in Malaysia
29
usually contain some items of BSC measures. The sample size surveyed included100 companies across the industries of manufacturing, service, trading and retailin Malaysia. 500 questionnaires were sent to the respondents and it tookapproximately two months for the distribution and collection of the questionnaires.Out of the 500 questionnaires sent, 120 were returned which is equivalent to 20%of the response rate. Out of the 120 questionnaires returned, 11 were foundincomplete and 9 were found with errors. 100 completed questionnaires wereused for data analysis.
Non-Response TestFollow-up contact with a random sample of non-response organizations provideddescriptive statistics of respondent profiles that when T-test is performed to testthe non-response bias, the result revealed that no significant differences exist.
Operationalization of Research VariablesEach causal relations of the research framework is operationalised by using multi-items and each questionnaire item is measured by a five point Likert scale, rangingfrom 1 (Strongly agree) to 5 (Strongly disagree), see Table 1.
Table 1: Descriptive Statistics (before factor analysis)
Items Mean StandardDeviation
New technology speed up innovation 2.21 0.868New technology improve internal process 2.06 0.763New technology improve customer service 2.11 0.886Speedy in innovation, produce innovative products 2.10 0.847Innovative products meet customer demand 2.01 0.732Innovative products improve customer service 2.20 0.752Employees training improves innovation adoptions 2.07 0.832Employee trainings improve employee productivity 2.12 0.820Human capital development improve customer service 2.04 0.790Technology innovation improve products quality 2.02 0.853Technology innovation affects sales margin 2.07 0.796Innovative products retains customers 2.06 0.851Process improvement increases product quality 2.07 0.868Process improvement increases sales margin 2.18 0.999Internal process improvement retains customers 2.15 0.903Improvement in customer services increases product quality 2.05 0.833
(Continued)
Chap 2.pmd 10/29/2010, 9:42 AM29
Asia-Pacific Management Accounting Journal, Volume 5 Issue 1, 21-40, 2010
30
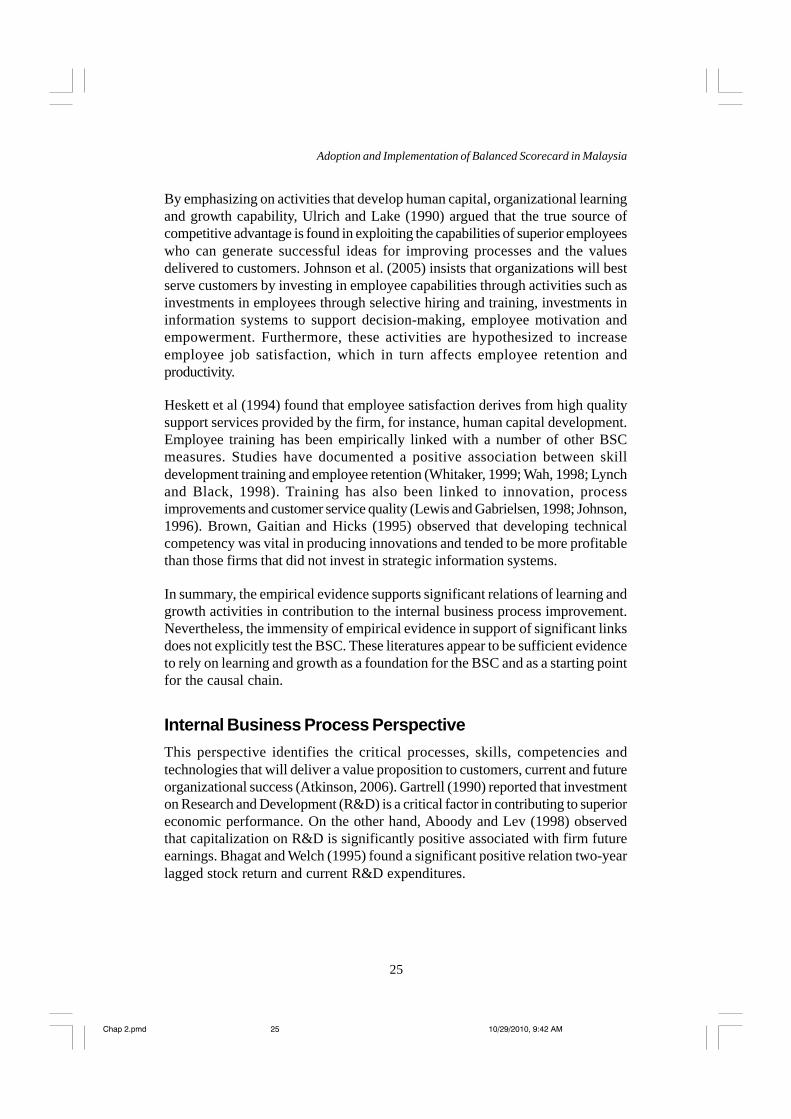
Profile of the RespondentsThe data distribution for gender reveals that the number of male respondents isslightly more than female respondents. The distribution, in terms of percentage,between male and female respondents is represented by 52% and 48%respectively. For the age of the respondents, the majority of the respondents areyouths (below 40 years of age) as they accounted for 23% of the total respondents.This group of respondents also included the young executives who possessadequate years of experiences at managerial levels in the organizations. In termsof educational qualification, 38% of the total respondents in this study possessedat least a bachelor’s degree. The respondents with master degree, doctoratedegree and professional qualification are represented by 17%, 8% and 11%respectively.
Results and Findings
Factor Analysis
In order to group the 27 items in the questionnaire into meaningful classes, factoranalysis was performed using principal component analysis. Only item with factorloading of 0.50 and above were considered significant in interpreting the factors,thus those items with factor loadings less than 0.50 were removed because theydid not correlate with any factorial groups produced. Out of the 27 items, 4 factorsthat have eigenvalues greater than 1 are extracted. All the Cronbach alphacoefficients exceeded the lower limit of acceptability, which is usually consideredto be 0.70 (refer Table 2).
Table 1: (continue)
Items Mean StandardDeviation
Improvement in customer services increases product quality 2.05 0.833Quality of customer affects sales margin 2.07 0.844Pre and post purchase services influences customer retention 1.93 0.742Product quality influences rate of return on Assets 2.09 0.954Better quality results in greater market share 2.01 0.847Better quality improves profit margin 2.25 2.081Sales margin influences return on assets 2.10 0.847Sales margin influences market share 2.14 0.865High sales margins increases profit margins 2.17 0.853Customer retention influences return on assets 2.03 0.969High customer retention increases market share 2.13 0..861High customer retention increases profit margin 2.13 0.939
Chap 2.pmd 10/29/2010, 9:42 AM30

Adoption and Implementation of Balanced Scorecard in Malaysia
31
Referring to Table 2 above, factor 1 is labeled as Causation 1 which shows causeand effect relationship between customer value and financial performance, factor2 is labeled as Causation 2 which shows cause and effect relationship betweencustomer value and internal business process, factor 3 is labeled as Causation 3which shows cause and effect relationship between internal business processwith learning and growth; factor 4 is labeled as Causation 4 which shows causeand effect relationship between overall performance.
Causation 1 indicates that customer values are one of the contributors to thefinancial performance of the company. Generally, the financial perspective appearsto be the main indicators emphasizing maximizing shareholders’ wealth andsatisfactions, few key goals and measures are usually used namely return onassets, sales growth, gross and net profit margin, market share, residual income,revenue growth, market position etc (Atkinson, 2006). It implies that financialperformance is subject to a broader set of measurements and not merely lookingfrom the customer value perspective.
Table 2: Summary Results of Factor Analysis of Cause and Effect Relationships
Factor Items Factor Eigenvalue Percentage CronbachLoadings of Variance Alpha
Explained
1 Customer retention influences return on assets 0.810 5.32 18.63 0.8753High customer retention increases market share 0.776High customer retention increases profit margin 0.750Better quality results in greater market share 0.640Better quality improves profit margin 0.562
2 Process improvement increases product quality 0.786 2.32 16.23 0.9260Internal process improvement retains customers 0.730Improvement in customer services increases 0.654product qualityPre and post purchase services influences 0.563customer retention
3 New technology speed up innovation 0.875 1.76 14.45 0.8655New technology improve internal process 0.840Employees training improves innovation 0.712adoptionsEmployee trainings improve employee 0.513productivity
4 Product quality influences rate of return on Assets 0.738 1.23 12.56 0.8430Better quality results in greater market share 0.644Better quality improves profit margin 0.508
Notes: Extraction Method: Principal Component Analysis. Rotation Method: Varimax with KaiserNormalization.
Chap 2.pmd 10/29/2010, 9:42 AM31

Asia-Pacific Management Accounting Journal, Volume 5 Issue 1, 21-40, 2010
32
Causation 2 reveals the cause and effect relationship between the perspectivesof internal business process contributing to an effect on customer value. This is inline with the study by Gartrell (1990) where the constant improvements andupgrading of internal business processes is a critical factor in contributing tosuperior economic performance of the company.
The finding also concurs with the argument put forward by Cohen, Thiraios andKandilorou (2008) that within a prosperous internal business and productionenvironment, that is categorized by effective handling of customer orders, goodrelations with suppliers and distribution channels as well as quick response toinnovation adaptation is very likely that the end product of the company willsatisfy customer needs and prospects. The actions of pursuing internal operationsexcellence and efficiency such as involvement in research and developmentactivities and quality management, will positively lead to delivering high levels ofservice, product quality, value for money and brand loyalty towards the productsand services offered by the company.
In this study, Causation 3, i.e. the cause and effect relationship reinforced theimportance of investment in learning and growth dimension, such as investmentsin new technologies and development of innovative products and services willfoster internal communication, shared values and common organizationalobjectives. This finding also reflects the fact that the improved performance inlearning and growth perspective will result in a significant positive increase in theameliorated performance of the internal business and production processperspective.
In comparison with the results of Othman (2006) in his study of BSC causalmodel development among the Malaysian companies, 52.9 percent of thecompanies that responded developed a causal model in their strategy formulationand implementation. In his finding, it is also reported that the presence of a causalmodel of the organization strategy may lead organizations to develop performancemeasures with unseen strategic issues of encountering a lack of enthusiasm amongthe employees in developing an action plan.
In general, the results of the Factor Analysis are highly consistent with the BSCliterature in relation to the measures that are commonly encountered in the BSCperspectives. However, it is also essential to highlight that the factors identifieddo not exclusively cover all BSC parameters as a whole. The statements developedin the questionnaire were adopted from various sources of the literature andhence may deliberately be constrained to mainly for those of a generic nature forthe causal relations analysis.
Chap 2.pmd 10/29/2010, 9:42 AM32

Adoption and Implementation of Balanced Scorecard in Malaysia
33
ConclusionAs a concluding remark, the overall findings verify that most of the BSCperspectives are correlated with each other at a statistically significant level in asequential manner. The evidence found generally supports the theoreticalfoundations of BSC that there is a sequential dependency among the four BSCperspectives. The findings are in tandem with a wide range of the academicliterature review earlier and provide ample additional evidence to the literature ofstrategic management control of interests to both academicians and industrialmanagers.
In addition, the findings have shown that the respondents who participated in thesurvey have at least responded positively to BSC measures. More significantly,they believe that the cause-and-effect relationship of BSC will lead them toimproved business efficiency and profitability. The positive perception of therespondent reflects that they react favorably to the BSC as appropriate benchmarksfor performance appraisal and useful for implementing changes as well as guidingfor improvements in corporations. Therefore, conclusion can be drawn that thoseBSC believers and adopters are generally more performance driven and resultsoriented in nature.
The findings also revealed that the comprehensive framework of BSC provides abroader view of how an organization will convert its initiatives and resources,including intangible assets such as corporate culture and employees’ skills andknowledge into tangible and predictable outcomes when the cause-and-effectlinks take place. The results of this study have also proven that the template ofBSC articulated by Kaplan and Norton (1996) provides a common language anda generally accepted structure which can be used by managers for describing thecorporate strategies. Therefore, it can be concluded that without a BalancedScorecard, organizations will not be able to achieve internal consistency of visionand action in their attempts to implement changes and introduce new strategiesand processes. The Balanced Scorecard provides a framework for managers inmanaging the implementation of strategy. It also, on the other hand, allows thecorporate strategies to evolve in response to changes in the company’s operatingenvironment.
Despite the fact that the findings reported to be consistent with the academicliterature, nonetheless, the relatively recent adoption of BSC among Malaysiancompanies limits the number of responses within the network of the researchers.Therefore, the finding of this study should be considered as indicative of theexperience of the respondents only.
Chap 2.pmd 10/29/2010, 9:42 AM33

Asia-Pacific Management Accounting Journal, Volume 5 Issue 1, 21-40, 2010
34
ReferencesAboody, D. and Lev, B. (1998). ‘The value relevance intangibles: The case ofsoftware capitalization’, Journal of Accounting Research, 161-191.
Ahituv, N. and Giladi, R. (1993). ‘Business success and information technology:are they really related.’ Proceedings of the 7th Annual Conference ofManagement Information System, Israel.
Aidemark, L.G. (2001). ‘The meaning of balanced scorecard in the health careorganization’. Financial Accountability & Management, 17, 1: 23-40.
Anderson, E.C. Fornell and Lehmann, D. (1994). ‘Customer satisfaction, marketshare and profitability: Findings from Sweden’, Journal of Marketing, 58: 53-66.
Anderson, E.W. and Sullivan, M.W. (1993). ‘The antecedents and consequencesof customer satisfaction for firms’, Marketing Science, 12: 125-143.
Ary, D. Jacobs, L.C. and Razavieh, A. (1996). Introduction to research ineducation, Orlando, Florida: Harcourt Brace College Publishers.
Atkins, P.M., Marshall, B.S. and Javalgi, R.G. (1996). ‘Happy employees lead toloyal patients’, Journal of Health Care Marketing, 16: 14-23.
Atkinson, H. (2006). ‘Performance measurement in the international hospitalityindustry’. Accounting and Financial Management: Developments in theInternational Hospitality Industry, Butterworth-Heinemann: Oxford.
Bagozzi, R.P. (1994). ‘Measurement in Marketing Research: Basic Principles ofQuestionnaire Design, Principles of Marketing Research, Blackwell, Oxford.
Banker, R.D., Chang, H. and Pizzini, M.J. (2000). “The balanced scorecard:judgmental effects of performance measures linked to strategy”, The AccountingReview, 79: 1-23.
Banker, R.D., Potter, G. and Srinivasan, D. (2000). ‘An empirical investigationof an incentive plan based on nonfinancial performance measures’, WorkingPaper, University of Texas at Dallas, Dallas, TX.
Bhagat, S. and Welch, L. (1995). ‘Corporate research and developmentinvestments: international comparisons’. Journal of Accounting and Economics,19, 2: 443-470.
Chap 2.pmd 10/29/2010, 9:42 AM34

Adoption and Implementation of Balanced Scorecard in Malaysia
35
Bolton, R.N. and Lemon, K.N. (1999). ‘A dynamic model of customers’ usage ofservices: Usage as an antecedent and consequence of satisfaction’, Journal ofMarketing Research, 36, 2: 171-186.
Borg, W.R. and Gall, M.D. (1989). Educational Research: An Introduction, 5th
ed, New York: Longman Inc.
Borucki, C.C. and Burke, M.J. (1999). ‘An examination of service-relatedantecedents to retail store performance’, Journal of Organizational Behavior,20, 6: 943-962.
Bourguignon, A., Malleret, V. and Nørreklit, H. (2004). “The American balancedscorecard versus the French tableau de Bord: the ideological dimension”,Management Accounting Research, 15: 107-34.
Brown, R.M. and Gatain A.W. and Hicks, Jr., J.O. (1995). ‘Strategic informationsystems and financial performance’, Journal of Management InformationSystems, 11, 4: 215-248.
Butler, A., Letza, S.R. and Neale, B. (1997). ‘Linking the Balanced Scorecard toStrategy’, Long Range Planning, 30, 2: 242-256.
Buzzel, R.D. and Gale, B.T. (1987). ‘The PIMS Principles: Linking Strategyto Performance’, New York, Free Press.
Cohen, S., Thiraios, D. and Kandilorou, M. (2008). ‘Performance ParametersInterrelations from a Balanced Scorecard Perspective: An Analysis of GreekCompanies’, Managerial Auditing Journal, 23, 5: 485-503.
Davis, S. and Albright, T. (2004). An Investigation of the Effect of BalancedScorecard Implementation on Financial Performance, Management AccountingResearch, 15, 2: 135-53.
De Wit, B. and Meyer, R. (2004). Strategy, Process, Content, Context AnInternational Perspective, 3rd Edi, Thomson Learning, High Holborn House,London.
Ennew, C.T. and Binks, M.R. (1996). ‘The impact of service quality and servicecharacteristics on customer retention: Small businesses and their banks in theUK’, British Journal of Management, 7, 3: 219-230.
Chap 2.pmd 10/29/2010, 9:42 AM35

Asia-Pacific Management Accounting Journal, Volume 5 Issue 1, 21-40, 2010
36
Evans, J.R. (2004). An Exploratory Study of Performance Measurement Systemsand Relationships with Performance Results, Journal of OperationsManagement, 22: 219-232.
Fitzgerald, C. and Erdmann, T. (1992). ‘Actiononline’, American AutomotiveIndustry Action Group, 45-56.
Fitzgerald, L. (2007). Performance measurement in service businesses.Management Accounting, 12: 34-36.
Fraering, J.M. and Minor, M.S. (1994). ‘The industry specific basis of the marketshare- profitability relationship’, Journal of Consumer Marketing, 11: 27-37.
Friedman, N. (1992). ‘Follow-up or foul-up: service after the sale,’ Agency SalesMagazine, 21-22.
Gale, B.T. (1994). ‘Managing Customer Value: Creating Quality and Servicethat Customers can See’, New York, Free Press.
Gartrell, K.D. (1990). ‘Innovation, industry specialization and shareholder wealth’California Management Review, 32, 3: 87-101.
Gebgert, P., Goldenberg C.B. and Peters, D. (1996). ‘Managing customers throughcost-to-serve’, CMA Magazine, 70, 7: 22-23
Ghosal, S. and Mintzberg, H. (1994). ‘Diversification and Diversifact’, CaliforniaManagement Review, 37, 1: 8-27.
Groebner, D.F., Shannon, P.W., Fry, P.C. and Smith, K.D. (2008). BusinessStatistics, 7th edi, Pearson Educational, Prentice Hall.
Guilford and Fruchter, (1973). Fundamental Statistics in Psychology andEducation, 5th edi, New York, McGraw-Hill.
Hair, J.F.,Tatham, R.L. and Anderson, R.E. (2003). Multivariate Data Analysis,5th edi, New York, McGraw-Hill.
Hergert, M. (1984). ‘Market share and profitability: is bigger really better?’Business Economics Review, 19: 45-48.
Heskett, J.L., Jones, T.O., Loveman, G.W., Sasser, Jr. W.E. and Schlesinger,L.A. (1994). ‘Putting the service-profit chain to work’, Harvard Business Review,164-174.
Chap 2.pmd 10/29/2010, 9:42 AM36

Adoption and Implementation of Balanced Scorecard in Malaysia
37
Ittner, C. and Larcker, D.F. (1996). ‘The performance effects of processmanagement techniques’, Management Science, 43, 4: 523-534.
Ittner, C. and Larcker, D.F. (1997). ‘Measuring the impact of quality initiatives onfirm financial performance’ Management of Organizational Quality, 43, 4: 523-534.
Ittner, C. and Larcker, D.F. (1998). ‘Are non-financial measures leading indicatorsof financial performance’, An analysis of customer satisfaction. Journal ofAccounting Research, 36: 1-35.
Ittner, C. and Larcker, D.F. (2003). ‘Coming up short on non financial performancemeasurement’, Harvard Business Review, 88-95.
Jaconson, R. and Aaker, D.A. (1987). ‘The strategic role of product quality’,Journal of Marketing, 51: 31-44.
Johnson, G., Scholes, K. and Whittington, R. (2005). Exploring CorporateStrategy, 7th ed. Pearson Education Limited, Harlow.
Johnson, J.W. (1996). ‘Linking employee perceptions of service climate to customersatisfaction’ Personnel Psychology, 49, 4: 831-851
Kaplan, R.S. and Norton, D.P. (1996). Translating strategy into action, the balancedscorecard, Harvard Business School Press, Boston: MA.
Kennerley, M., Neely, A., Adams, C. (2003). ‘Survival of the fittest: measuringperformance in a changing business environment’, Measuring BusinessExcellence, 7, 4: 37-43.
Krejcie, R.V. and Morgan, D.W. (1970). Determining Sample Size for ResearchActivities, Educational and Psychological Measurement, 30: 607-610.
Krishnan, M.S., Ramaswamy, V., Meyer, M.C. and Damien, P. (1999). ‘Customersatisfaction for financial services: The role of products, services and informationtechnology’, Management Science, 45, 9: 1194-1209.
Krupnicki, M. and Tyson, T. (1997). ‘Using ABC to determine the cost of servicingCustomers’, Management Accounting, 79, 6: 40-46.
Lewis, B.R. and Gabrielsen, G.D.S. (1998). ‘Intra-organizational aspects of servicequality management: The employees perspective’ Service Industry Journal, 18,2: 64-89.
Chap 2.pmd 10/29/2010, 9:42 AM37

Asia-Pacific Management Accounting Journal, Volume 5 Issue 1, 21-40, 2010
38
Lynch, L.M. and Black, S.E. (1998). ‘Determinants of employer-related training’,Industrial and Labor Relations Review, 45-49.
Malina, M.A. (2001). ‘Management Control and the Balanced Scorecard: AnEmpirical Test of Causal Relations’, Leadership and Organization DevelopmentJournal, 12: 20-55
Malina, M. and Selto, F.H. (2001). ‘Communicating and controlling strategy: anempirical study of the effectiveness of the balanced scorecard’, Journal ofManagement Accounting Research, 13: 47-90.
Malmi, T. (2001). ‘Balanced scorecards in Finnish companies: a research not’.Management Accounting Research, 12: 207-220.
Markell, S.J., Nely, S.E. and Strickland, T.H. (1988). ‘Explaining profitability:Dispelling the market share fog’, Journal of Business Research, 16: 189-196.
Marr, B. and Schiuma, G. (2003). ‘Business performance – past, present andfuture’. Management Decision, 41, 8: 680-687.
McKenzie, F.C. and Shilling, M.D. (1998). ‘Avoiding performance measurementtraps: Ensuring effective incentive designs and implementation’, Compensationand Benefits Review, 30, 4: 57-65.
McQueen, R.A. and Knussen, C. (1999). Research Methods in Psychology: APractical Introduction, Willshire: Prentice Hall Europe.
Minor, M. (1989). ‘The market share effect: a review and reconsideration’,American Marketing Research Journal, 1-10.
Mittal, B. and Tsiros, W.M. (1999). ‘The role of personalization in serviceencounters’, Journal of Retailing, 72, 1: 95-109.
Neely, A., Silk, S. and Johnson, G. (1994). The Performance MeasurementRevolution: Why Now and What Next? International Journal of Operations& Production Management, 19, 2: 205-208
Norreklit, H. (2003). ‘The balanced scorecard: what is the score? A theoreticalanalysis of the balanced scorecard accounting’. Organizations and Society,591-619.
Ostroff, C. (1992). ‘The relationship between satisfactions, attitudes andperformance: An organizational level analysis’, Journal of Applied Psychology,77: 964-974.
Chap 2.pmd 10/29/2010, 9:42 AM38

Adoption and Implementation of Balanced Scorecard in Malaysia
39
Othman, R. (2006). ‘Balanced Scorecard and causal model development:preliminary findings’. Management Decision, 44, 5: 690-702.
Othman, R. (2007). ‘Effects and Effectiveness of the Balanced Scorecard:Malaysian Evidence’, Malaysian Management Review, 55-72.
Pandey, I.M. (2005). Balanced Scorecard: Myth and Reality, Vikalpa, 30, 1: 134-142.
Richheld, F.F. and Sasser, Jr., W.E. (1990). ‘Zero defections: quality comes toservices’, Harvard Business Review, 105-111.
Rucci, A.J., Kirn, S.P. and Quinn, R.T. (1998). ‘The employee-customer profitchain at Sears’, Harvard Business Review, 76, 1: 82-97.
Rust, R.T., Zahorik, A.J. and Keiningham, T.L. (1995). Return on Quality: MakingService Financially Accountable, Journal of Marketing, 59: 58-70.
Saunders, M., Lewis, P. and Thornhill, A. (2007). Research Methods for BusinessStudents, Prentice Hall.
Schneiderman, A.M. (1999). ‘Why balanced scorecard fails’, Journal of StrategicPerformance Management, 6-11.
Smith, M. (2005). ‘The balanced scorecard’, Financial Management, 27-28.
Speckbacher, G., Bischof, J. and Pfeiffer, T. (2003). ‘A descriptive analysis of theimplementation of balanced scorecard implementation in German-speakingcountries’. Management Accounting Research, 361-387.
Szulanski, G. (1996). ‘Exploring internal stickiness: impediments to the transfer ofbest practice within the firm’. Strategic Management Journal, 27-43.
Ulrich, S. and Lake, M. (1990). ‘Performance management at Nordic Companies’,European Management Journal, 18, 1: 113-127.
Wah, L. (1998). ‘An ounce of prevention’, Management Review, 87, 9: 9.
Whitaker, A. (1999). ‘What causes IT workers to leave’, Management Review,88, 9: 8.
Chap 2.pmd 10/29/2010, 9:42 AM39

Asia-Pacific Management Accounting Journal, Volume 5 Issue 1, 21-40, 2010
40
Appendix
Questions Link with Literature
BSC Perspective Related Question Literatures Published
Learning and Growth Investments in New technologies Kaplan and Norton (1996)
Innovative Products and Services Evans (2004), Kaplan and Atkinso
Human Capital Development Malina, 2001
Internal Business Process Speed of adopting Innovations Pandey (2005), Evans (2004) andKaplan and Norton (1996)
Process Improvement Gerbert et al (1996)
Customer Service Friedman (1992)
Customer Value Perceived level of quality Evans (2004)
Sales Margin Lipe and Salterio (2002) andLibby et al (2004)
Customer Retention Ittner and Larcker (1998)
Financial Performance Return on Assets Evans (2004) and Ittner et al (2003)
Market Share Evans (2004), Banker et al (2004),Kaplan and Atkinson (1998)
Profit Margin Reichheld & Sasser (1990)
Chap 2.pmd 10/29/2010, 9:42 AM40

Copyright of Asia-Pacific Management Accounting Journal is the property of Universiti Teknologi Mara
Represented by Accounting Research Institute and its content may not be copied or emailed to multiple sites or
posted to a listserv without the copyright holder's express written permission. However, users may print,
download, or email articles for individual use.