adoption and diffusion of improved technologies and
TRANSCRIPT

IFPRI Discussion Paper 01781
December 2018
Adoption and Diffusion of Improved Technologies and Production Practices in Agriculture
Insights from a Donor-led Intervention in Nepal
Anjani Kumar
Hiroyuki Takeshima
Naveen Adhikari
Ganesh Thapa
P. K. Joshi
Madhab Karkee
South Asia Regional Office

INTERNATIONAL FOOD POLICY RESEARCH INSTITUTE
The International Food Policy Research Institute (IFPRI), established in 1975, provides research-based policy solutions to sustainably reduce poverty and end hunger and malnutrition. IFPRI’s strategic research aims to foster a climate-resilient and sustainable food supply; promote healthy diets and nutrition for all; build inclusive and efficient markets, trade systems, and food industries; transform agricultural and rural economies; and strengthen institutions and governance. Gender is integrated in all the Institute’s work. Partnerships, communications, capacity strengthening, and data and knowledge management are essential components to translate IFPRI’s research from action to impact. The Institute’s regional and country programs play a critical role in responding to demand for food policy research and in delivering holistic support for country-led development. IFPRI collaborates with partners around the world.
AUTHORS
Anjani Kumar ([email protected]) is a research fellow in the South Asia Office of the International Food Policy Research Institute (IFPRI), New Delhi, India.
Hiroyuki Takeshima ([email protected]) is a research fellow in the Development Strategy and Governance Division of the International Food Policy Research Institute (IFPRI), Washington DC.
Naveen Adhikari ([email protected]) is an assistant professor in the Central Department of Economics, Tribhuvan University, Kathmandu, Nepal.
Ganesh Thapa ([email protected]) is a research collaborator and economist in the Country Office, Kathmandu Nepal, of the World Bank.
P. K. Joshi ([email protected]) is director of the South Asia Office of IFPRI, New Delhi, India.
Madhab Karkee ([email protected]) is former senior consultant for the International Food Policy Research Institute (IFPRI), in Kathmandu, Nepal.
Notices 1 IFPRI Discussion Papers contain preliminary material and research results and are circulated in order to stimulate discussion and critical comment. They have not been subject to a formal external review via IFPRI’s Publications Review Committee. Any opinions stated herein are those of the author(s) and are not necessarily representative of or endorsed by IFPRI. 2 The boundaries and names shown and the designations used on the map(s) herein do not imply official endorsement or acceptance by the International Food Policy Research Institute (IFPRI) or its partners and contributors. 3 Copyright remains with the authors. The authors are free to proceed, without further IFPRI permission, to publish this paper, or any revised version of it, in outlets such as journals, books, and other publications.

iii
Contents
Abstract ........................................................................................................................................... v
Acknowledgements ........................................................................................................................ vi
Acronyms ...................................................................................................................................... vii
1. Introduction ............................................................................................................................. 1
2. Data and Methodology ............................................................................................................ 3
3. Adoption of Improved Agricultural Farming Practices and Technologies in Nepal: Status, Extent and Determinants ......................................................................................................... 7
4. Conclusions and Policy Implications .................................................................................... 31
References ..................................................................................................................................... 34
iv
Tables
Table 2.1: Definitions and sample averages of variables ............................................................... 6
Table 3.1: Poisson regression estimates for the factors influencing technology adoption intensity....................................................................................................................................................... 13
Table 3.2: Regression results from linear regression models for factors influencing the adoption of specific technologies / practices ............................................................................................... 17
Table 3.3: Factors affecting the probability of receiving information about improved technologies from each source (only showing statistically significant coefficients) .................... 24
Table 3.4: Factors affecting the probability of receiving information about improved technologies from each source (only showing statistically significant coefficients) .................... 25
Table 3.5: Average impact of KISAN project participation on crop production costs and farm revenue (1 = 100% increase)......................................................................................................... 29
Table 3.6: Impact of KISAN Project on crop productivity and production costs of major crops (1 = 100% increase) .......................................................................................................................... 30
Figures
Figure 2.1: Locations of interviewed households in Nepal ............................................................ 4
Figure 3.1: Number of improved agricultural technologies used by KISAN-beneficiary and nonbeneficiary households (percent) .............................................................................................. 7
Figure 3.2: Percentage of KISAN-beneficiary and nonbeneficiary households adopting improved technologies .....................................................................................................................................9
Figure 3.3: Percentage of KISAN-beneficiary and -nonbeneficiary households adopting improved practices ........................................................................................................................ 10
Figure 3.4: Frequency of technology adoption by KISAN-beneficiary and -nonbeneficiary households, by number of technologies ........................................................................................ 12
v
Abstract
Adoptions of improved technologies and production practices are important drivers of agricultural development in low-income countries like Nepal. There are still knowledge gaps concerning what determines the adoption of different types of technologies and practices, how information about them is diffused, and what general impacts the interventions promoting them are having. In this paper we partly close the gap, using data collected for evaluations of the Knowledge-Based Integrated Sustainable Agriculture in Nepal (KISAN) project led by USAID. We find that factors important to increasing the adoption of improved technologies and practices include improved access to markets, the role of the private sector in selling improved seeds and disseminating information, membership in progressive farmers’ groups and cooperative societies, participation in agricultural training and farm visits, the provision of subsidies for seeds, and access to credit. Different factors are also found to affect the sources that farmers use for gathering information before adoption. The effects of KISAN projects vary significantly across the different crops grown, based on the evaluation models that address self-selection of both project participation and crop choices. Keywords: Adoptions, Diffusions, Improved agricultural technologies and practices, Poisson regression, Bivariate probit inverse-probability-weighting, Nepal

vi
Acknowledgements
This work was undertaken as a part of the United States Agency for International Development (USAID)–funded Policy Reform Initiative Project in Nepal. We thank USAID for the funding support. We also acknowledge the support extended by RIDA and IIDS in completion of this activity. The study team immensely benefited from interactions with a number of stakeholders that include policymakers, planners, scientists, farmers, and representatives of civil societies. We gratefully acknowledge their suggestions and feedback. The critical comments and suggestions by reviewers to improve the report are duly acknowledged. We record our sincere thanks and appreciation to officials of the Government of Nepal for their constructive comments and inputs during consultation meetings.

vii
Acronyms
CBS Central Bureau of Statistics
DAP Diammonium phosphate
FTF Feed the Future
IIDS Institute for Integrated Development Studies
IPM Integrated Pest Management
IPW Inverse Probability Weighting
JICA Japan International Cooperation Agency
KISAN Knowledge-Based Integrated Sustainable Agriculture in Nepal
OLS Ordinary Least Squares
RIDA Research Inputs and Development Action
SUR Seemingly Unrelated Regression
USAID United States Agency for International Development
VDCs Village Development Committees

1
1. Introduction
Increasing agricultural productivity through the adoption and diffusion of improved
agricultural technologies and practices has been considered as one of the viable means for
achieving economic growth and agricultural transformation (Evenson and Gollin, 2003; Gollin,
2010) in developing countries like Nepal. Nepalese agriculture is characterized by subsistence
farming, the dominance of marginal and small farms, problematic access, low adoption of
modern technologies, poor availability of inputs, lack of irrigation facilities, and limited
investment in research and development (CBS, 2011). Due to the increasing outmigration of
productive youths, there is also a shortage of labor in the agricultural sector. At the same time,
farm mechanization rates remain low—less than 10 percent of agricultural households use
modern machines for cultivation and post-harvest activities (CBS, 2011). All of this has resulted
in low yields and low rates of agricultural commercialization. It is estimated that about 43
percent of agricultural entities are commercialized, leaving a majority of households (57 percent)
still practicing subsistence farming (JICA, 2010).
The proportion of Nepali farm households using improved crop varieties is only about 33
percent (CBS, 2011). The annual application of DAP and urea, for instance, has been about 47
kilograms per hectare (kg/ha) and 63 kg/ha, respectively (Takeshima et al., 2016)—well below
their average rates of application in the South Asia region. Consequently, promoting and
facilitating the use of improved technologies and practices can be key strategies for increasing
agricultural productivity and making agriculture a viable and sustainable source of livelihood in
Nepal. Although studies have been conducted to assess the factors influencing the adoption in
Nepal of improved varieties of rice (Ghimire et al., 2015) and maize (Ransom et al., 2003;
2
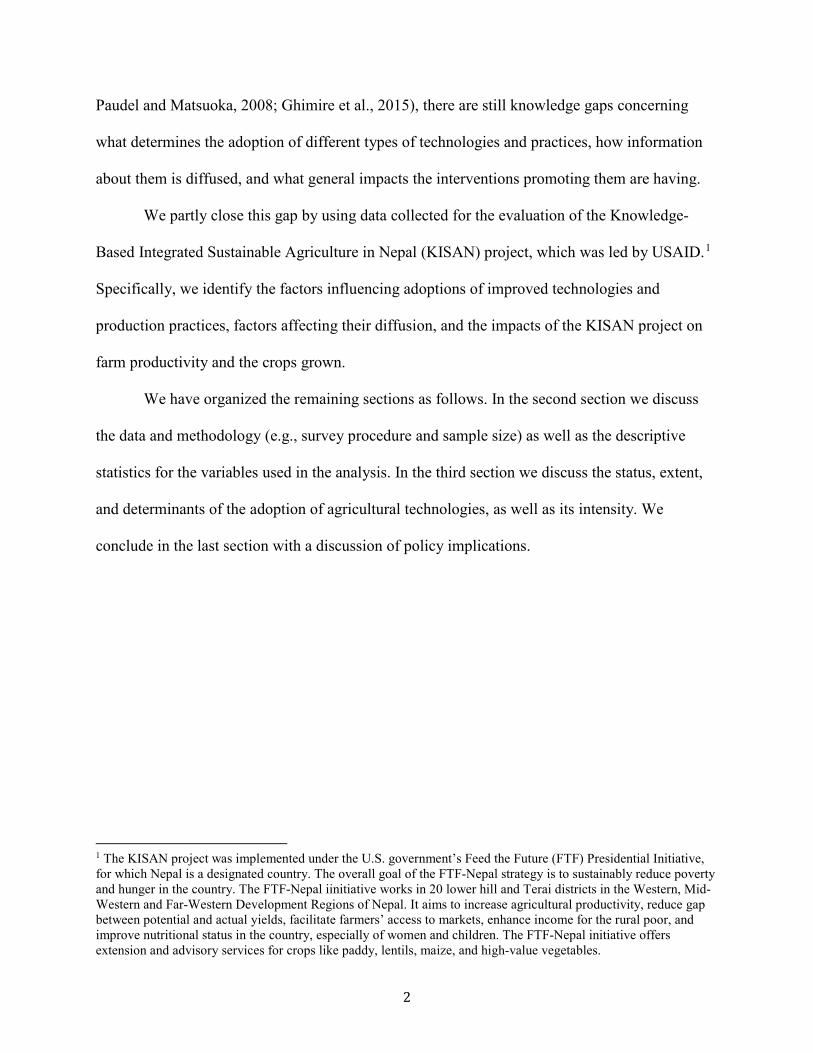
Paudel and Matsuoka, 2008; Ghimire et al., 2015), there are still knowledge gaps concerning
what determines the adoption of different types of technologies and practices, how information
about them is diffused, and what general impacts the interventions promoting them are having.
We partly close this gap by using data collected for the evaluation of the Knowledge-
Based Integrated Sustainable Agriculture in Nepal (KISAN) project, which was led by USAID.1
Specifically, we identify the factors influencing adoptions of improved technologies and
production practices, factors affecting their diffusion, and the impacts of the KISAN project on
farm productivity and the crops grown.
We have organized the remaining sections as follows. In the second section we discuss
the data and methodology (e.g., survey procedure and sample size) as well as the descriptive
statistics for the variables used in the analysis. In the third section we discuss the status, extent,
and determinants of the adoption of agricultural technologies, as well as its intensity. We
conclude in the last section with a discussion of policy implications.
1 The KISAN project was implemented under the U.S. government’s Feed the Future (FTF) Presidential Initiative, for which Nepal is a designated country. The overall goal of the FTF-Nepal strategy is to sustainably reduce poverty and hunger in the country. The FTF-Nepal iinitiative works in 20 lower hill and Terai districts in the Western, Mid-Western and Far-Western Development Regions of Nepal. It aims to increase agricultural productivity, reduce gap between potential and actual yields, facilitate farmers’ access to markets, enhance income for the rural poor, and improve nutritional status in the country, especially of women and children. The FTF-Nepal initiative offers extension and advisory services for crops like paddy, lentils, maize, and high-value vegetables.
3
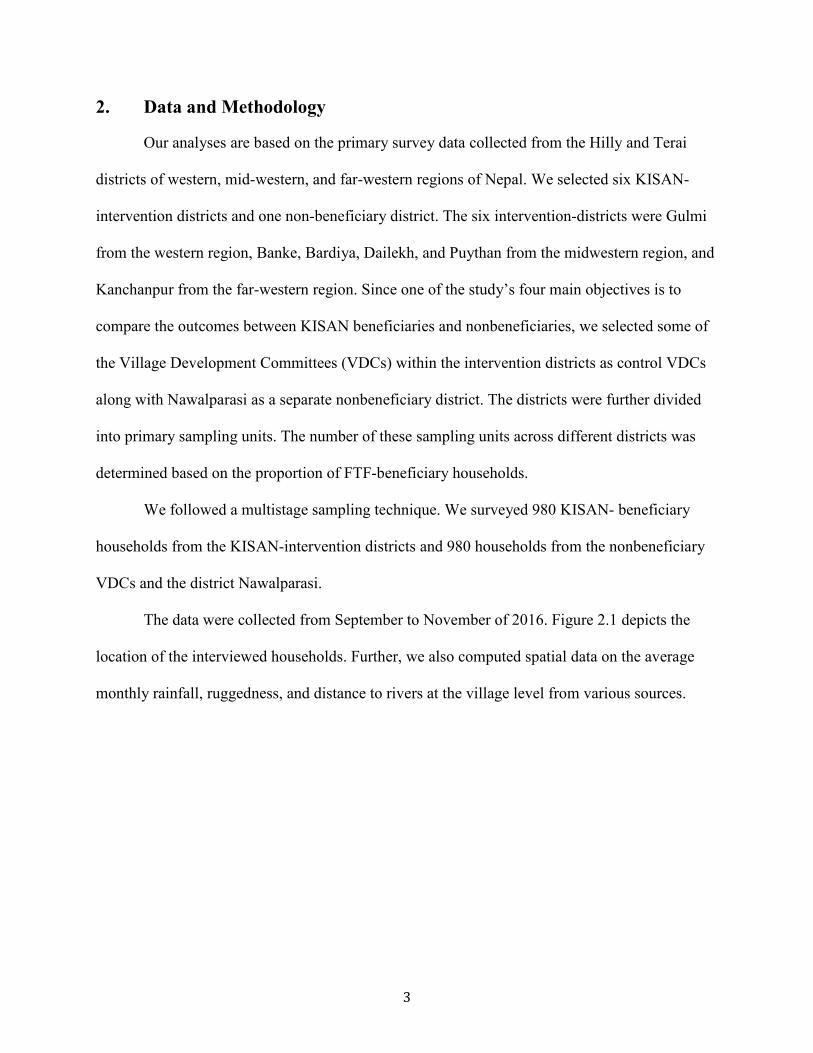
2. Data and Methodology
Our analyses are based on the primary survey data collected from the Hilly and Terai
districts of western, mid-western, and far-western regions of Nepal. We selected six KISAN-
intervention districts and one non-beneficiary district. The six intervention-districts were Gulmi
from the western region, Banke, Bardiya, Dailekh, and Puythan from the midwestern region, and
Kanchanpur from the far-western region. Since one of the study’s four main objectives is to
compare the outcomes between KISAN beneficiaries and nonbeneficiaries, we selected some of
the Village Development Committees (VDCs) within the intervention districts as control VDCs
along with Nawalparasi as a separate nonbeneficiary district. The districts were further divided
into primary sampling units. The number of these sampling units across different districts was
determined based on the proportion of FTF-beneficiary households.
We followed a multistage sampling technique. We surveyed 980 KISAN- beneficiary
households from the KISAN-intervention districts and 980 households from the nonbeneficiary
VDCs and the district Nawalparasi.
The data were collected from September to November of 2016. Figure 2.1 depicts the
location of the interviewed households. Further, we also computed spatial data on the average
monthly rainfall, ruggedness, and distance to rivers at the village level from various sources.

4
Figure 2.1: Locations of interviewed households in Nepal
Source: Compiled by the authors.
The variables selected include various agro-ecological and socioeconomic factors that
have been found to be important drivers of improved production technologies and practices
elsewhere. Several studies reveal a number of factors that influence adoption and diffusion,
related to the characteristics of households, farms, institutions, and the environment. The earlier
sets of policies were targeted to influence households through a series of intervening variables
like agricultural trainings, field demonstrations, and delivery of agricultural extension services
(Polson and Spencer, 1991; Ransom et al., 2003; Paudel and Matsuoka, 2008; Asfaw et al., 2012;
Mariano et al., 2012; Ghimire et al., 2015). Since the household is the ultimate adaptor of a farm
technology, household characteristics like experience in farming (Foster and Rosenzweig, 1995),
household size (Marenya and Barrett, 2007; Noltze et al., 2012) and educational level of spouse
(Teklewold et al., 2013) were found to be important determinants of technology adoption. Key
farm characteristics include farm size (Ghimire and Huang, 2015), availability of inputs, and soil

5
quality of the plot (Mason and Smale, 2013). Institutional factors, such as association with a
farmers group (Ghimire and Huang, 2015), also help determine technology adoption, as do agro-
ecological characteristics of farm location (Mason and Smale, 2013). Importantly, access to input
and output markets (Ghimire and Huang, 2015; Langyintuo and Mungoma, 2008; Feleke and
Zegeye, 2006), availability of resources and credits (Feder et al., 1985; Teklewold et al. 2012),
and access to seed (Langyintuo and Mungoma, 2008; Ghimire et al., 2015) also influence
technology adoption. Lastly, social networking has been found important in increasing adoption
of improved technologies as well (Bandiera and Rasul, 2006; Conley and Udry, 2010; Foster and
Rosenzweig, 1995; Krishnan and Patnam, 2014).
Table 2.1 presents the definitions and descriptive statistics of the variables used in the
analysis. We have presented the mean value and standard deviation both for the full sample and
for the beneficiary and nonbeneficiary households. We have also tested whether these
characteristics significantly differ between the beneficiary and nonbeneficiary households. We
find statistically significant differences for various variables. Later sections therefore address
self-selection bias by employing suitable approaches.

6
Table 2.1: Definitions and sample averages of variables
Variables
Full sample (n = 1980)
KISAN-beneficiaries (n = 996)
Non-beneficiaries (n = 984)
Uses cultural practices (1/0) 0.44 0.57 0.31 *** Uses pest management technologies, (1/0) 0.13 0.14 0.12 * Uses disease management technologies (1/0) 0.06 0.06 0.05 Uses irrigation management technologies (1/0) 0.24 0.24 0.23 Uses climate-resilient technologies (1/0) 0.12 0.11 0.13 Age of household head 47.83 45.93 49.71 *** Headed by male (1/0) 0.84 0.85 0.83 Head has received formal schooling (1/0) 0.77 0.77 0.76 Head has completed primary schooling (1/0) 0.19 0.19 0.19 Head has completed intermediary degree or higher (1/0) 0.08 0.08 0.07 Number of years involved in farming 21.42 19.17 23.64 *** Dependency ratio (#<15 and >65 years/household size) 0.33 0.33 0.33 Household size 6.52 6.50 6.53 Dalit ethnic group (1/0) 0.08 0.07 0.09 Janajati ethnic group (1/0) 0.53 0.62 0.45 *** Upper castes (Brahmin, Chhetry) (1/0) 0.38 0.34 0.42 *** KISAN-beneficiary (1/0) 0.54 Grows paddy (1/0) 0.80 0.84 0.76 *** Grows maize (1/0) 0.51 0.44 0.58 *** Grows lentil (1/0) 0.28 0.35 0.21 *** Grows cauliflower (1/0) 0.21 0.30 0.12 *** Grows tomato (1/0) 0.11 0.15 0.07 *** Marginal farmers (land size < 0.16 ha) 0.22 0.20 0.24 * Small farmers (land size ≥ 0.16- < 0.33 ha) 0.25 0.27 0.23 ** Medium farmers (land size ≥ 0.33-1.0 ha) 0.39 0.38 0.39 Large farmers (land size > 1 ha) 0.14 0.15 0.14 log (value of livestock) 10.31 10.42 10.20 * log (value of land) -1.10 -1.09 -1.11 Applies micro-nutrients (1/0) 0.13 0.11 0.15 *** Applies chemical fertilizers (1/0) 0.69 0.65 0.74 *** Has access to irrigation facility (1/0) 0.63 0.68 0.59 *** Receives subsidy (1/0) 0.08 0.11 0.06 Takes loan (1/0) 0.47 0.46 0.49 Receives seed information from farmers (1/0) 0.80 0.81 0.79 Receives seed information from private sector (1/0) 0.19 0.19 0.20 Receives seed information from cooperatives (1/0) 0.15 0.20 0.09 *** Member of a cooperative (1/0) 0.75 0.88 0.62 *** Member of a farmers group (1/0) 0.16 0.19 0.14 *** Member of a self-help group (1/0) 0.02 0.03 0.02 Owns farm machinery (1/0) 0.10 0.10 0.09 Receives agricultural advice (1/0) 0.55 0.79 0.31 *** Receives agricultural training (1/0) 0.42 0.64 0.19 *** Distance to nearest marketing center 2.88 3.26 2.51 *** Euclidean distance from the river 0.01 0.01 0.01 Exposed to demonstration visit (1/0) 0.15 0.23 0.07 *** Terrain ruggedness index 174.37 167.44 181.21 Standard deviation in annual rainfall 190.36 188.47 192.23 ** Average annual rainfall (mm) 123.25 115.67 130.73 *** Terai (1/0) 0.68 0.66 0.71 *** Hill (1/0) 0.32 0.34 0.29 ***
Source: Authors. Note: Statistical significance at the *** p < 0.01, ** p < 0.05, and * p < 0.1 levels.

7
3. Adoption of Improved Agricultural Farming Practices and Technologies in Nepal: Status, Extent and Determinants
3.1. Status and Extent
The KISAN project has promoted 31 improved farm technologies in Nepal. These farming
practices are related to maximizing yields and minimizing post-harvest losses and risks, among
other things, and have been broadly classified under these nine headings: (a) crop genetics; (b)
cultural practices; (c) pest management; (d) disease management; (e) soil fertility management;
(f) water management; (g) climatic effect mitigation; (h) agricultural marketing; and (i) post-
harvest management. We inquired from the farmers about the extent of their adoption of these 31
different technologies. Figure 3.1 presents the number of technologies adopted by KISAN-
beneficiary and nonbeneficiary households. On average, the farming households had adopted
three technologies apiece. Only one-fourth of the households use at least five of these
technologies. Generally, a higher proportion of beneficiary households use a greater number of
technologies than non-beneficiary households.
Figure 3.1: Number of improved agricultural technologies used by KISAN-beneficiary and nonbeneficiary households (percent)
Source: Field survey, 2016.
91
72
53
3624
1611 6 3 2 1 10
102030405060708090
100
1 2 3 4 5 6 7 8 9 10 11 12 13 14 15 16
Beneficiary Non Beneficiary

8
Figure 3.2 presents the percentages of households that adopted each specific farm
technology. The adoption of improved seeds was the most popular technology, practiced by
about 70 percent of both KISAN-beneficiary and nonbeneficiary households. Other important
farm technologies adopted by beneficiary households included cultural practices (adopted by 56
percent), soil fertility management (37 percent), and irrigation management (24 percent). The
proportions of households adopting any of the remaining technologies were all less than 15
percent. Overall, the use of improved farm technologies was found to be higher among
beneficiary than nonbeneficiary farmers.
Within each farm technology, there may be several improved farm practices. Therefore,
the improved farm practices are considered as a subset of the improved farm technology. For
example, the soil fertility management technology includes soil solarization, crop mulching etc.

9
Figure 3.2: Percentage of KISAN-beneficiary and nonbeneficiary households adopting improved technologies
Source: Field Survey, 2016
Figure 3.3 summarizes the adoption status of improved farm practices. The farming
practices adopted by more than 10 percent of the beneficiary households included raised bed
lines (26 percent), improved nursery (26 percent), crop staking (20 percent), integrated pest
management practices (IPM) (14 percent), terrace and land improvement (14 percent), soil
solarization (13 percent), and crop mulching (13 percent). Generally, beneficiary households
adopt more improved farm practices than nonbeneficiary households.
4
5
6
6
7
11
14
24
37
56
71
0 10 20 30 40 50 60 70 80
Water Management
Marketing
Disease Management
Use of Machine
Post Harvest Management
Climate Resilliant Technolgoies
Pest Management
Irrigation Management
Soli Fertilty Management
Cultural Practices
Improved Seed
Beneficiary Non Beneficiary

10
Figure 3.3: Percentage of KISAN-beneficiary and -nonbeneficiary households adopting improved practices
Source: Field Survey, 2016.
3.2. Determinants of the Intensity of Technology Adoption
3.2.1 Empirical framework
We first identify the drivers of improved technology adoption. We apply a Poisson
regression model since the dependent variable is the number of technologies used by the farmers
(count data). The earlier studies also used a Poisson regression model to study the factors
influencing the adoption of the number of technologies (Ramirez and Shultz, 2000; Isgin et al.,
2008; Pamuk et al., 2014). The Poisson distribution for the number of technologies adopted (y =
1, 2, … ,31) is given by the density equation,
23
45
68
1313
1414
2026
26
0 5 10 15 20 25 30
Packing TechnologyDirect Seeding using Machine
Drip & SprinklesStorage
Use of Plastic HouseCanal Rehabilitation
Crop MulchingSoli Solarization
Terrece & Land ImprovementIPM
Crop StakingImprovedNurshary Practices
Raised Bed Line
Beneficiaries Non Beneficiaries

11
𝐏𝐏𝐏𝐏(𝐘𝐘 = 𝐲𝐲) = 𝐞𝐞−𝛍𝛍𝛍𝛍𝐲𝐲
𝐲𝐲!, 𝐲𝐲 = 𝟎𝟎,𝟏𝟏,𝟐𝟐… ,𝐍𝐍 (1)
where, µ is the average number of technologies adopted. The conditional mean function (µ) is
𝛍𝛍𝐢𝐢 = 𝐞𝐞𝐞𝐞𝐞𝐞 (𝐞𝐞𝐢𝐢′𝛃𝛃), 𝐢𝐢 = 𝟏𝟏,𝟐𝟐… ,𝐧𝐧 (2)
in which x is an exogenous variable, including the constant.
3.2.2 Empirical results
We plotted the frequency of the number of technologies adopted by both KISAN-
beneficiary and nonbeneficiary households. As illustrated in Figure 3.4, our response variable is
not overdispersed. In our Poisson regression model, deviance goodness-of-fit test statistics and
Pearson goodness-of-fit statistics are 2408.37 and 2305.63, respectively. We were not able to
reject the null hypothesis at any level of statistical significance at which the data were Poisson-
distributed.

12
Figure 3.4: Frequency of technology adoption by KISAN-beneficiary and -nonbeneficiary households, by number of technologies
Source: Authors.
Table 3.1 presents the estimated results of the Poisson model for both the full model and
crop-specific models. All the coefficients may be interpreted as semi-elasticities since the
equation (2) is in the form of log-linear model. The coefficient can be interpreted as the
percentage change in the dependent variable given the unit change in the independent variable.
We only interpreted coefficients that were statistically significant at least at the 10 percent level.

13
Table 3.1: Poisson regression estimates for the factors influencing technology adoption intensity
Source: Authors. Note: Statistical significance at the *** p < 0.01, ** p < 0.05, and * p < 0.1 levels.
Variables Full sample
Crop Paddy Maize Lentil Cauliflower Tomatoes
Age of household-head .0004 .0011 .0032 -.0007 .0017 .0018 Household is male-headed (1/0) .0068 .1006* -.0348 .1921** .0827 .0586 Farming experience of head (years) -.0016 -.0034* -.0061*** -.0008 -.0037 -.0000 Head is illiterate (1/0) -.0601 -.0723 -.1368** .0405 -.1197 .0397 Head has completed intermediate / higher degree (1/0)
.0186 .0305 .0160 .0331 -.0351 .1499
Dependent ratio -.1805** -.2353*** -.1950* -.2612* -.3637** -.3892** Household size .0060 .0104* .0138* .0033 .0134 .0012 Dalit caste (1/0) -.0081 -.0950 -.1755** .0249 -.1895 .1980 Janajati caste (1/0) -.1350*** -.2410*** -.2568*** -.1768*** -.2797*** -.3811*** ln (Livestock asset) .0114* .0129* .0056 .0110 .0002 -.0184 ln (Household landholding) (ha) .0587** .0591** .0667* .1059** .1268** .0851 Small farm (1/0) .0963 .1202* .1487* .2234* .1312 .2675 Medium farm (1/0) .0180 .0285 .1216 -.0603 .0676 .1956 Proportion of land area with low quality of soil
.1289*** .0719* .0110 .0776 .1203* -.0536
Has access to irrigation facility (1/0) .0223 .0135 -.0123 -.0656 -.0891 -.0713 Use chemical fertilizer (1/0) .1404*** .0953* .2372*** .0656 .1660** .1772* Use micronutrients (1/0) .2771*** .2572*** .3021*** -.0008 .1937** .0754 Distance to nearest market -.0567*** -.0624*** -.1030*** -.0696*** -.0550** -.0355 Cultivate maize (1/0) -.0814* Cultivate lentil (1/0) .0762** Cultivate cauliflower (1/0) .1716*** Cultivate tomato (1/0) .1934*** Seed subsidy (1/0) -.0627 -.0325 -.0981 -.0456 -.0852 -.3133** Received seed information from fellow farmer (1/0)
.0052 .1058** .1273** .0610 -.0122 .1381
Received seed information from the private sector (1/0)
.0742* .1266*** .1102* .0067 .2046*** .1300
Received seed information from the cooperative (1/0)
.1743*** .2247*** .1760*** .1553** .1512** .2010*
Took loan (1/0) -.0352 -.0691** -.0234 -.1293** -.0629 -.0753 Cooperative member (1/0) .0410 .0370 -.0694 .0683 .0023 .2178 Member of farmers organization (1/0) .1101** .1545*** .2881*** .1679** .2716*** -.0149 Member of self-help group (1/0) -.0196 .1416 -.1348 -.1206 -.2571 .2438 Owns farm machinery (1/0) -.0187 .0704 .0430 .0267 .0822 -.0630 Seeks advice (1/0) .2037*** .1280*** .2491*** .3619*** .1329 .2777** Participates in agricultural training (1/0) .3292*** .3064*** .3232*** .3604*** .2696*** .2913*** Participates in agricultural visit (1/0) .1210*** .0784 .1154* .0571 .1261* .1511 Terrain ruggedness .0001 -.0001 -.0002 .0000 -.0002 .0012*** Standard deviation in annual rainfall -.0108** -.0005 -.0045* -.0055 -.0052 .0012 Average rainfall .0048 .0043*** .0049*** .0038* .0048* -.0049 KISAN- beneficiary (1/0) .0610 .1303*** .1402** -.0217 .0197 -.2898** Terai Yes Yes Yes Yes Yes Yes Constant Yes Yes Yes Yes Yes Yes District fixed effects Yes Yes Yes Yes Yes Yes Regional fixed effects Yes Yes Yes Yes Yes Yes Observations (No.) 1,980 1,589 1,011 549 411 217 Pseudo R2 .13 .10 .14 .09 .11 .14 Wald chi2 1254.1 653.84 617.18 198.14 206.90 134.42

14
In the model, we included regional and district dummies to account for any regional and
district fixed effects.
Concerning social caste2 and wealth, we found the following. Janajati households adopt
about 14 percent fewer technologies than do upper-caste households (Chhetry and Brahmin).
Doubling the household’s landholding (increasing the size by 100 percent) is correlated with a 5
percent increase in the number of technologies adopted.
Low soil quality is found to be positively correlated with the adoption of a higher number
of technologies. This is because poor soils require more inputs, especially manures and
fertilizers. Households already using chemical fertilizers and micronutrients adopt 14 percent and
27 percent more improved technologies, respectively.
An increase in the household’s distance to market of one additional kilometer reduces the
adoption of technologies by about 6 percent. When compared with paddy-growing households,
maize-growing households adopt 8 percent fewer farm practices, whereas those cultivating lentil,
cauliflower, or tomatoes adopt 8 percent, 17 percent, and 19 percent more improved farm
practices, respectively.
Information and training clearly have an effect. Receiving seed information from fellow
farmers, the private sector, or cooperatives helps to increase adoption of technologies or
improved practices for most crops. Households belonging to farmers organizations also adopt
more technologies for all crops, except tomatoes. Participation in agricultural training and field
visits is associated with adoption of more improved farm practices for most crops.
Households receiving seed information from the private sector or from cooperatives
adopt 7 percent and 17 percent more technologies, respectively. Those that belong to farmers’
2 Broadly, the households can be categorised into three caste groups-Dalits, Janajati and Upper Castes.
15
organizations adopt 11 percent more improved farm practices. Households receiving agricultural
training adopt 32 percent more technologies than nonrecipients, while those participating in
agricultural visits adopt 12 percent more. In sum, agricultural trainings, demonstrations, and farm
visits appear to be effective modes for promoting improved technologies among farmers.
We also estimated crop-specific models to find out whether the results from the full
model vary across crops, and for all these models we accounted for the district, region, and agro-
ecological fixed effects.
Some variables that are insignificant in the full model are found to be significant for
certain crops. Among paddy and lentil growers, male-headed households tend to adopt more
technologies. For paddy and maize crops, longer farming experience is actually associated with
the adoption of fewer technologies. Among maize growers, those households with illiterate heads
adopt 14 percent fewer technologies, and Dalit households adopt 18 percent fewer technologies
than upper-caste households.
Larger family size is positively associated with adoption of more technologies across
both paddy and maize growers. Compared to large farms, small farms adopt 12 percent, 15
percent, and 22 percent more technologies in the cultivation of paddy, maize, and lentil,
respectively. The distance to market matters for all crops except tomatoes.
Greater rainfall is associated with adoption of more technologies, while households
exposed to greater rainfall fluctuations adopt fewer technologies.
For paddy and maize, KISAN-beneficiary households were found to adopt more
technologies. However, in the case of tomatoes, KISAN-beneficiary households were found to
adopt fewer technologies.

16
3.3. Determinants of Specific Technologies Adoption in Nepal
3.3.1 Empirical framework
We now identify the determinants of the adoptions of specific technologies and practices
from among the 31 technologies and practices promoted. Specifically, we focus on five
promising technologies related to cultural practices, pest management, disease management,
irrigation management, and climate resilient measures. We estimate these models using
Ordinary Least Square (OLS) approach. Our models can be expressed as follows:
Cl = a + βY + µ (3)
P = b + γY + ϑ (4)
D = c + θY + ε (5)
I = d + δY + ϵ (6)
C = e + αY + φ (7)
where, 𝑪𝑪𝑪𝑪, 𝑷𝑷, 𝑫𝑫, 𝑰𝑰 and 𝑪𝑪 are soil, pest management, disease management, irrigation
management, and climate resilient technologies, respectively. Similarly, 𝒂𝒂,𝒃𝒃, 𝒄𝒄,𝒅𝒅, and 𝒆𝒆 are the
vectors of the constant, and 𝒀𝒀 is the vector of the farm/household, institutional and
environmental characteristics expected to influence the choice of these technologies.
3.3.2. Empirical results
Table 3.2 presents the results. We interpret those coefficients that were statistically
significant at the 10 percent level.

17
Table 3.2: Regression results from OLS models for factors influencing the adoption of specific technologies / practices
Variables Cultural Practices
Pest management
Disease management
Irrigation management
Climate- resilient
technologies Age of household-head .0048** .0004 -.0007 .0011 .0002 Head is male (1/0) .0817 -.0079 .0092 -.0340 -.0396* Formal schooling of head (years) .0960* .0022 -.0466*** .0704** .0218 Farming experience of household-head (years)
-.0085*** -.0007 -.0007 -.0032** -.0002
Dependency ratio -.1779* .0346 -.0661*** -.0566 -.0145 Household size .0050 .0013 .0029* .0012 .0029 Marginal farm households (1/0) .0071 .0159 .6003*** -.0334 .0717 Small farm households (1/0) -.0220 .0023 .6156*** -.0857 .0284 Medium farm households (1/0) -.1283 -.0002 .5983*** -.0190 .0226 Dalit caste (1/0) -.0018 -.0670** -.0338* -.0971** -.0405 Janajati caste (1/0) -.2400*** -.0653*** -.0141 .0132 -.0658*** ln (Livestock assets) -.0008 .0016 .0018 .0062 .0032 ln (Land value) .0324 .0184 .0007 .0256 .0098 Proportion of area with low quality soil .0214 .0691*** -.0061 .0750*** .0215 Has access to irrigation facility (1/0) -.0481 -.0529*** -.0028 .0680** .0085 Distance to nearest market -.0581*** -.0123*** -.0095*** .0064 -.0067 Seed subsidy (1/0) -.0941 -.0503* -.0026 -.0148 .0346 Took loan (1/0) -.0267 -.0257* -.0062 .0383 -.0413*** Cooperative member (1/0) .0255 -.0204 -.0098 .0085 .0254 Member of farmers organization (1/0) .3830*** .0212 .0096 .1879*** .0223 Member of self-help group (1/0) .1232 .0127 .0455 -.0679 -.0641 Owns farm machinery (1/0) -.0291 -.0296 -.0212 -.0551 -.0219 Seeks advice (1/0) .1718*** .0171 .0398*** .0377 .0034 Participates in agricultural training (1/0) .3169*** .0911*** -.0078 .0682** .0506*** Participates in agricultural visit (1/0) .0377 -.0155 .0605*** .0815** .0509** Terrain ruggedness .0002* .0001*** -.0001*** .0000 -.0001* Standard deviation in annual rainfall -.0064*** .0012 -.0044*** -.0057*** -.0004 Average rainfall .0034** -.0010* .0031*** .0055*** .0018*** Cultivate paddy (1/0) .1888*** -.0023 -.0006 .1151*** .0352 Cultivate maize (1/0) -.0598 .0116 -.0098 -.0037 -.0306 Cultivate lentil (1/0) .0241 .0534*** .0052 .0090 .0006 Cultivate cauliflower (1/0) .3356*** .0401** .0357*** .0169 .0394** Cultivate tomato (1/0) .4921*** .1632*** -.0032 -.0232 .0768*** KISAN- beneficiary (1/0) .2359*** -.0241 .0069 -.0189 -.0367* Constant Yes Yes Yes Yes Yes Observations (No.) 1,979 1,979 1,979 1,979 1,979 R-squared .2343 .1055 .0865 .0936 .0576 Source: Authors. Note: The figures in parentheses are standard errors. Statistical significance at the *** p < 0.01, ** p < 0.05, and * p < 0.1 levels.
Concerning the characteristics of households, we find the following. Households headed
by older adults are more likely to adopt soil-related technologies than households with younger

18
heads, although this effect is insignificant for the other technologies. Female-headed households
are 4 percent more likely to adopt climate-resilience technologies than male-headed households.
Households headed by adults with formal schooling, as compared with households headed by
adults without it, are 10 percent more likely to adopt cultural practices, 7 percent more likely to
adopt irrigation management technologies, and 5 percent more likely to adopt disease
management technologies. The greater adoption of disease management technologies may be due
to the fact that educated households might be trying to avoid the use of chemicals and sprayers
due to their awareness of the potential adverse effects on human health as well as the
environment.
Concerning castes, Dalit and Janajati families are less likely to adopt the majority of
these technologies than households in the Brahmin, Cheetry, and other caste groups. Dependency
ratios are negatively associated with the adoption of cultural practices and disease management
technologies. Households with larger family sizes are more likely to adopt disease management
technologies.
Surprisingly, longer experience farming is correlated with lower rates of adoption of
some technologies, including cultural practices and irrigation management technologies. This
may be because these technologies have been introduced recently and older farmers are less
likely than younger ones to quickly adjust to or switch to using them.
Additional findings concerning farm size, location, and experience are as follows.
Marginal, small, and medium-size farms are more likely to adopt disease management
technologies than larger farms. Better proximity to the nearest market leads to greater adoption
of cultural practices, pest, and disease management technologies, underscoring the importance of
market access. Unsurprisingly, households with access to irrigation facility are more likely to
19
adopt irrigation management practices.
Households receiving seed subsidies are less likely to adopt pest management
technologies; this may be because these households purchase pest-resistant crop. Similarly,
households receiving loans are less likely to adopt pest management and climate resilient
technologies. The last finding may be explained by the fact that only a small number of farmers
took loans for agriculture-related purposes, but a larger number took loans to smooth out their
household consumption during food-deficit seasons.
Findings concerning training and information sharing are as follows. Households
belonging to farmers groups are more likely than other households to adopt cultural practices and
irrigation technologies. Those seeking agricultural advice are 17 percent more likely to adopt
cultural practices and 4 percent more likely to adopt disease management technologies than those
not seeking advice. Households receiving agricultural training are 32 percent, 9 percent, 7
percent, and 5 percent more likely to adopt cultural practices, pest management, irrigation
management, and climate resilient technologies, respectively, than households receiving no such
training. Similarly, households participating in farm visits are 6 percent, 8 percent, and 5 percent
more likely than nonparticipating households to adopt disease management, irrigation
management, and climate resilient technologies, respectively.
Concerning terrain and weather, we find the following. Greater terrain ruggedness is
positively associated with the adoption of cultural practices and pest management technologies,
but is negatively associated with the adoption of disease management and climate resilient
technologies. Households with a higher proportion of land with poor cultural practices are more
likely to adopt pest and irrigation management technologies than households with lesser amounts
of poor cultural practices. Greater rainfall uncertainty is negatively associated with the adoption

20
of cultural practices, disease, and irrigation management technologies, whereas greater rainfall
is positively associated with the adoption of the same (but not with pest management)
technologies.
Results also vary across crops. For paddy growers, we find 19 percent and 12 percent
higher probability of adopting cultural practices and climate resilient technologies, respectively.
However, for maize growers, none of the improved farm practices was found significant. Lentil
growers are about 5 percent more likely to adopt pest management technologies. Cauliflower-
growers are 34 percent, 4 percent, 4 percent, and 4 percent more likely to adopt cultural
practices, pest management, disease management and climate resilient technologies,
respectively. Similarly, tomato growers are 49 percent, 16 percent, and 8 percent more likely to
adopt cultural practices, pest management and climate resilient technologies, respectively. The
KISAN-beneficiary households are 24 percent more likely to adopt cultural practices, but 4
percent less likely to adopt climate resilient technologies.
3.4.Factors associated with the diffusion of improved varieties and production practices
Farmers adopting improved technologies and practices typically rely on certain
information sources before their adoption, either because they prefer one source over another or
simply because they lack access to other types of information. It is therefore quite important to
identify those information sources that might be more effective in inducing adoptions.
Because knowledge of improved varieties or practices is revealed most vividly when they
are adopted in practice, the diffusion processes can typically be assessed only by observing
farmers who have adopted them. In the following analysis, determinants of the key information
sources for each improved technology and improved production practice are estimated
considering all these aspects.
21
3.4.1 Estimation method
Our data include no variables on households’ awareness of each type of technology or
practice. Instead, the data report the primary sources of information from those who had actually
adopted the technologies or practices. The data also capture whether a household has sought
agricultural information in general from a formal source. We utilize these sets of variables for the
analysis.
To assess the relationship between important sources of information for specific
technologies / improved practices and the characteristics of the farmers, we applied the following
empirical model:
𝒔𝒔𝒊𝒊𝒊𝒊 = 𝒇𝒇(𝑿𝑿), (8)
where 𝒔𝒔𝒊𝒊𝒊𝒊 is the indicator of whether the household learned about technology or practice 𝒊𝒊 from
source 𝒊𝒊, and 𝑿𝑿 denotes the household’s characteristics. A multinomial logit method was used to
estimate equation (8).
An empirical challenge in estimating equation (8) is that the information source 𝒊𝒊 that
farmers rely on is only observed if the farmer adopts the relevant technology or practice 𝒊𝒊.
Estimating without taking into account such mechanisms would lead to biased estimates. One
way bias can be addressed is by applying sample selection models, in which we estimate how X
affects the probability of adoption of technology / improved practice 𝒊𝒊 by the household through
standard methods like Probit. We then incorporate the estimated probability into the estimation
of equation (8). In particular, we apply the inverse probability weighting (IPW) method
(Wooldridge 2007).
22
We focus on the technologies and practices that have been relatively widely adopted in
the study area; namely, improved seeds, cultural practices, soil fertility management, irrigation
management, pest management, and climate resilient practices3
3.4.2 Results
Tables 3.3 and 3.4 summarize the estimation results as to which household characteristics
affect the probability of relying on information from (i) informal sources (neighboring farmers,
family, friends); (ii) cooperatives / farmers’ organizations; (iii) public extension services; and
(iv) private extension services. By the design of the estimation methods, these results show how
each factor affects the probability of receiving information from the households (given their
characteristics) about improved technologies from each source, regardless of whether they
actually adopt such improved technologies or not. The figures have been shown as marginal
effects on the probability (with 1 = 100 percent) that a household relies on each source of
information.
The key patterns of diffusion we find are as follows.
With greater experience in farming, farmers tend to obtain information from informal
sources instead of through group members in farmers’ organizations.
Membership in a farmers’ organization generally raises the likelihood of receiving
information from a household belonging to that group, or from the public sector, concerning
information on various technologies including improved seeds and soil fertility improvement
practices. Meanwhile, membership in a farmers’ organization reduces the likelihood that such
information is obtained from informal sources. Additionally, receipt of formal credit is
3Here, we exclude “disease management” whose adoption relatively less common, and exhibited insufficient variations in diffusion patterns required for the analyses. We, however, add “cultural practices” for the analyses here, to gain richer insights into the difference in diffusion patterns across different technologies and production practices.

23
associated with a greater likelihood of receiving information through a farmers’ organization
rather than from informal sources.
The experience of being exposed to demonstrations or training in the past leads to a
greater likelihood of receiving information from the public sector.
Farmers living closer to a market tend to rely more on informal sources, while those
living farther away from a market tend to rely more on the members of farmers groups they are
associated with.
Information sources are sometimes associated with specific agro-ecological conditions,
and this may very across the types of improved technologies. For example, the public sector is a
significant source of information for improved soil fertility management practices in the areas
covered with Cambisols, Fluvisols / Greysols, or Phaeozems soils. However, in those areas the
public sector is not a particularly significant source of information for the improved seeds or
other cultural practices.
Ownership of telephones, which also indicates access to internet communications and
technology, significantly induces farmers to obtain information from formal sources, including
other members within farmers’ groups. In some cases it induces farmers to obtain information
from public sector sources, including extension service agents, as well as from private-sector
extension officers.

24
Table 3.3: Factors affecting the probability of receiving information about improved technologies from each source (only showing statistically significant coefficients)
Improved technologies / improved practices Sources of information on improved seeds
Sources of information on cultural practices
Sources of information on soil fertility management
a Informal Group Public sector
Private sector
Informal Group Public sector
Private sector
Informal Group Public sector
Private sector Factors
Share of adopters within the area .017* .008* Shares using cooperative / farmer organizations -.006*** .004*** -.038*** .013*** -.020*** Shares using public extension services -.003** -.038** .019*** Shares using private extension services -.004* .001* ln (total area owned) -.105*** -.031† Average distance to the plot -.058* ln (number of plots) .054* .055* .029* -.054** .028† Age of household-head .003*** -.001* .001* Gender of household-head -.120* -.052** .062** Education level of household-head .015† .005† .003** Farm experiences of household-head .003* -.005*** .001** .006** -.003** -.003*** Adult male members in household .028** -.019** .014† -.013** Adult female members in household .013*** .047*** -.016** -.012** ln (amount of remittances received) -.005† .004* .002* .001* .007** -.005** ln (total household assets) .018† -.008*** ln (total livestock assets) .003† .011** .007*** Whether receiving credit (1 = yes) -.051† .053** .045* 013*** ln (market distance) .074*** -.059** .040*** Received information from public sector .087** -.031† Whether exposed to demonstrations in the past -.100** .061* .070** .025* .018*** Whether exposed to trainings in the past -.192*** .143*** -.245* .198*** .111*** -.211*** .123** .098*** -.308*** ln (rainfall) Distance to the nearest river ln (terrain ruggedness) ln (distance to India) Owns a telephone -.250*** .161*** .065*** .057*** -.242*** .127*** .041* -.160*** .051* Soil is Cambisols .025* Soil is Fluvisols / Greysols .236** -.017* Soil is Phaeozems .079** .032* Membership in a farmers’ organization -.182*** .087*** .038** .030** .057** .017*** .047* .029† District dummies Yes Yes Yes Yes Yes Yes Yes Yes Yes Yes Yes Yes Caste dummies Yes Yes Yes Yes Yes Yes Yes Yes Yes Yes Yes Yes Sample size (No.) 1340 806 732 Source: Authors. Note: Information sources defined as follows: Informal = friend, farmer who is a neighbor, relative/ family outside the household; Group = cooperatives / farmers’ organizations; Public sector = public sector extension officer, agri-exhibitions, agri information center; Private sector = private sector extension officer. Statistical significance indicated as follows: *** = 1%; ** = 5%; * = 10%; † = 15%.

25
Table 3.4: Factors affecting the probability of receiving information about improved technologies from each source (only showing statistically significant coefficients)
Improved technologies / improved practices Sources of information on irrigation management
Sources of information on pest management
Sources of information on climate resilient practice
Informal Group Public sector
Private sector
Informal Group Public sector
Private sector
Informal Group Public sector
Private sector Factors
Share of adopters within the area .093*** -.144*** .003* .341** .000 .069*** Shares using cooperative / farmer organizations .014† .014*** -.029* .000 -.048*** Shares using public extension services -.168*** .031† .027*** -.027*** -.008* -.031** Shares using private extension services -.073* .061*** .014† .016† ln (total area owned) -.035* -.118* -.063† -.103** Average distance to the plot -.062* -.052** .039*** ln (number of plots) .146** -.063* .047** .087* .069† .044* Age of household-head .003*** -.002* .003* Gender of household-head -.219*** .046† Education level of household-head .009*** -.009* Farm experiences of household-head -.003*** .003*** .006** -.004** Adult male members in household -.017* .020*** Adult female members in household .044** .010* ln (amount of remittances received) .012** .004* -.005† ln (total household assets) -.053*** .019† .034** ln (total livestock assets) -.043*** .063*** .019* -.007** .030** Whether receiving credit (1 = yes) ln (market distance) -.091*** .083*** -.048* Received information from public sector -.112† .132* -.084** Whether exposed to demonstrations in the past .125*** .078** .045† -.055† Whether exposed to trainings in the past .086** -.452*** -.236** .122* .075† ln (rainfall) Distance to the nearest river ln (terrain ruggedness) ln (distance to India) Owns a telephone -.319*** .134*** soil is Cambisols -.139* .111† .174*** -.163** Soil is Fluvisols / Greysols -.318*** -.770*** Soil is Phaeozems -.301*** -.137** Membership in a farmers’ organization -.108* -.123*** -.175*** .155*** District dummies Yes Yes Yes Yes Yes Yes Yes Yes Yes Yes Yes Yes Caste dummies Yes Yes Yes Yes Yes Yes Yes Yes Yes Yes Yes Yes Sample (No.) 464 265 239
Source: Authors. Note: Information sources defined as follows: Informal = friend, farmer who is a neighbor, relative/ family outside the household; Group = cooperatives / farmers’ organizations; Public sector = public sector extension officer, agri-exhibitions, agri information center; Private sector = private sector extension officer. Statistical significance indicated as follows: *** = 1%; ** = 5%; * = 10%; † = 15%.

26
3.5. Impact Assessment of KISAN Project Participation
We now estimate the impacts of KISAN projects on various outcome indicators, using
the standard impact evaluation methods.
The farm-level economic impact assessment uses the following parameters. Crop
revenues are the aggregate revenues from the production of rice, maize, lentils, cauliflower, and
tomatoes. The crop production cost is the sum of the following five costs:
1. Materials costs, including costs of seeds, seedlings, chemical fertilizer (urea,
DAP, potash, other chemical fertilizer), micro-nutrients, manure, pesticides, and
other miscellaneous materials;
2. Labor costs, including the opportunity costs of family labor evaluated at the wage
rate, and the costs of labor used for plowing, other land preparation, sowing,
transplanting, irrigation, weeding, spraying, manure-spreading, harvesting,
threshing, and other operations;
3. Animal costs, including costs of animals used for plowing, threshing, and other
uses, evaluated at reported rental costs;
4. Costs of services done by machineries, that include the costs of machine-based
services for plowing, harvesting, threshing, pumping by diesel pumps and electric
pumps, and other machine-based service costs; and
5. Other costs, including expenditures on the collection, packaging, and
transportation of produce, costs paid for leased-in land, land revenue taxes, and
any other costs.
The impacts are estimated through treatment models similar to those used in the previous
sections but with some extensions to incorporate the complexities associated with various
economic indicators, such as incomes and their relations with cropping choices. In particular, we

27
use IPW methods and their extensions, which have been increasingly used in the literature for
estimating the treatment effects under a variety of conditions, including for the agricultural sector
in Nepal (Wooldridge 2007; Imbens and Wooldridge, 2009; Takeshima, 2017; Takeshima et al.,
2017).
First, we identify the factors 𝐳𝐳 associated with the binary indicator 𝐈𝐈 of whether a
household participates in the KISAN project (or a certain component of the project), that is,
𝑰𝑰 = 𝒇𝒇(𝒛𝒛), (9)
which is estimated by standard discrete dependent-variable models, like probit or multinomial
logit (if there are more than one type of project that the household can participate in). From this,
the probability that a household would participate in the particular project 𝒑𝒑 is estimated. We
calculate 𝑤𝑤 = 1/𝑝𝑝.
Then, for samples in each treatment status, we estimate the determinants of key outcome
indicators 𝒚𝒚,
𝑦𝑦 = 𝑔𝑔(𝑥𝑥) with weights 𝑤𝑤, (10)
in which x’s are the possible factors likely to affect the variations in 𝒚𝒚.
Then, the intercepts estimated in equation (10) are compared across different treatment
statuses. If 𝒙𝒙 contains only a constant, the estimator leads to the standard average treatment
effects. Otherwise, equation (10) is an IPW regression adjustment model, which further improves
the balancing properties of samples across treatment statuses (Imbens and Woolridge, 2009;
Austin, 2011).

28
3.5.1 Inverse Probability Weighted Model with Bivariate Probit
Evaluations of project impacts on economic outcomes such as revenues and costs by
crops must account for the potential endogeneity of crop choices. This is addressed by
combining a bivariate probit model with the IPW model. In bivariate probit models, we first
estimate the probability that the household grows rice, for example, in addition to whether the
household participates in the project or not. We then estimate 𝒑𝒑 for two cases: (i) the probability
that a household grows rice and participates in the project; and (ii) the probability that a
household grows rice but does not participate in the project. Using these modified probability
parameters, we may proceed with the IPW methods, as described above.
3.5.2 Results
Table 3.5 summarizes the average impact of participating in the KISAN project. The
figures shown are rates of increase in the key indicators due to participation in the project (a
growth rate of 1 indicates a 100 percent increase in, or doubling of, the indicators).
We find the following. Participation in the KISAN project generally has had a
significantly positive impact on crop revenues (in both aggregate and per- hectare terms), on the
order of about 20 percent. At the same time, participation in KISAN did not significantly
increase production costs. The project therefore is likely to have increased farmers’ net profit
from crop production. The effects are also observed consistently across both male-headed and
female-headed households.

29
Table 3.5: Average impact of KISAN project participation on crop production costs and farm revenue (1 = 100% increase)
Indicator All households Male-headed households
Female-headed households
Crop revenues .170*** .113*** .216† Crop production costs -.050 -.051 -.006 Crop revenues per hectare .236*** .181*** .317** Crop production costs per hectare .024 .019 .075
Source: Authors. Note: Statistical significance indicated as follows: *** = 1%; ** = 5%; * = 10%; † = 15%. Impacts of KISAN Project on Crop-specific Productivity
Table 3.6 summarizes the average impact of the KISAN project on various productivity
indicators for rice, maize, and lentils. These estimates control for the farmers’ endogenous
decisions on participating in KISAN project and their endogenous decisions on whether to grow
a certain crop or not.
The impacts on productivity differ across crops. While the KISAN project has
significantly influenced various productivity indicators for rice and maize crops, its effects on
lentils are generally ambiguous. The crop-specific interventions are therefore important in
achieving impacts on the productivity of a particular crop.
In addition, while the effects on rice and maize crops are generally positive, they occur
through potentially different mechanisms. For rice, the project raised the production value per
hectare, but this was largely enabled by the increase in the prices farmers received rather than
from yield increases. The increase in rice price might be due to the shift from low-value varieties
to the high-value varieties in greater demand by consumers. There has also been an efficiency
benefit, as is indicated by the reduced cost of rice production per hectare, suggesting that the new
rice varieties have enabled these farmers to achieve similar yields with significantly lower use of
inputs.

30
The effects on maize crops are primarily achieved through increased revenues per hectare
through combination of positive (although statistically insignificant) effects on both yield and
prices. Although reductions in production costs per hectare are also observed, this has been
estimated less precisely due to relatively larger variations in cost figures observed across maize
producers as compared with rice producers.
Table 3.6: Impact of KISAN Project on crop productivity and production costs of major crops (1 = 100% increase)
Outcome indicator Sample Crop Rice Maize Lentil Cauliflower Crop revenue per hectare
.120* .337** .198 -.017 Male-headed households .142*
Production cost per hectare
-.228*** -.255* .034 .624 Male-headed households -.238***
Price relative to other crops
.062** .076 -.183 .205*** Male-headed households .075*
Source: Authors. Note: The estimates were obtained through the Inverse Probability Weighting methods, combined with bivariate probit model. The statistical significance may be lower depending on the actual standard errors, whose calculations are complicated. Statistical significance indicated as follows: *** 1%, ** 5%, *10%, and †15%.

31
4. Conclusions and Policy Implications
Nepal has been designated as a participant in the U.S. government’s FTF Presidential
Initiative due to the country’s prevailing high poverty rate and chronic food insecurity. The FTF
initiative intervened in 20 lower Hill and Terai districts in the Western, Mid-Western and Far-
Western Development Regions of Nepal. The FTF initiative aims to increase agricultural
productivity, reduce the gap between potential and actual yields, facilitate farmers’ access to
markets, enhance income for the rural poor, and improve nutritional status in Nepal, especially
among women and children. To meet these goals, the KISAN project has been actively
implementing various programs in the FTF-beneficiary districts to promote improved and
modern technologies. In this paper we have empirically analyzed the adoption and diffusion of
agricultural technologies (improved varieties and farm practices) promoted under the project.
Using a Poisson model, we find that the intensity of technology adoption is positively
associated with land size, soil quality, use of chemical fertilizers, use of micro-nutrients,
livestock assets, sources of seed information (from private sector and cooperatives), membership
in farmers’ organizations, and participation in agricultural training and farm visits. Adoption of
improved technologies is negatively associated with greater dependency ratios in households,
longer distances from households to the nearest market, and increases in the standard deviation
of annual rainfall (weather risk).
Among five important technologies (cultural practices, pest management, disease
management, irrigation management, and climate-resilient technologies), the KISAN-beneficiary
households displayed an approximately 24 percent higher probability of adopting cultural
practices. We further find that different characteristics are significantly associated with the
adoption of different types of technologies.
32
Regarding cultural practices, higher probabilities of adoption are associated with
increases in the age and educational level of the household head, affiliation with farmers’
organization, participation in agricultural training, better access to markets, and households
seeking extension and advisory services.
Regarding pest management technologies, higher probabilities of adoption are associated
with better market access and the receipt of agricultural training. Lower probability of adoption
is associated with households belonging to lower social caste groups, such as Dalits and
Janajatis.
Regarding disease management technologies, the factors positively influencing adoption
are greater household size, closer market access, and more frequent seeking of agricultural
advice and agricultural visits.
Regarding irrigation management, adoption is positively associated with more formal
schooling of the household head, affiliation with farmers’ organizations, and participation in
agricultural training and farm visits.
Finally, regarding climate resilient technologies, adoption is positively associated with
households participating in agricultural training and farm visits and with female-headed
households.
The process of diffusion is found to be complex. While more years of farming experience
generally induce farmers to obtain more information from informal sources about improved
technologies and practices, greater exposure to demonstrations or training and membership in
farmers’ groups or cooperatives induce information gathering from more formal sources.
By promoting improved technologies and practices, the KISAN project generally
increased farm profits, primarily by raising revenues while keeping the production costs
unchanged. However, bivariate probit IPW models, which address self-selection not only in
33
project participation but also in crop choices, reveal that these effects vary considerably
according to the crops grown. This underscores the possibility that different production
technologies or practices matter for different crops.
Our findings provide important policy implications for promoting technology adoption
and diffusion in the western parts of Nepal. Improving market access has been found to be an
important pathway to promoting technology adoption and diffusion. Quick access to a market
reduces transportation and transaction costs, facilitates the purchase of inputs, reduces
production costs, increases farm profitability, and provides exposure to improved technologies.
Therefore, efforts to improve transportation infrastructure, expand road networks, and establish
market centers would translate into higher adoption rates of improved technologies.
The organization of agricultural training and farm visits has also been found to be
positively associated with the adoption of improved farm practices. There is no doubt that
farmers’ participation in such programs will help in their capacity building and motivate them to
replicate such technologies. However, for resource-poor farmers, it is very important to provide
subsidies, and link them to the input and output markets. Our study has found that the households
receiving seed subsidies and credit are likely to have higher adoption rates of some of the
modern technologies. Thus, it is imperative that in addition to providing a wide exposure to field
demonstrations, farm visits and agricultural training, farmers are supported with the required
input packages to increase their adoption rate of improved technologies.
In several regression models, we have also found that households belonging to the Dalit
and Janajati social castes had adopted a smaller number of technologies than upper caste
households (Brahmin and Chhetry). The constraints that limit the adoption of technologies by
these groups need to be further investigated.
34
References
Asfaw, S., Shiferaw, B., Simtowe, F., Lipper, L., 2012. Impact of modern agricultural
technologies on smallholder welfare: Evidence from Tanzania and Ethiopia. Food
Policy 37(3), 283–95.
Austin, P. C., 2011. An introduction to propensity score methods for reducing the effects of
confounding in observational studies. Multivariate Behavioral Research 46(3), 399–
424.
Bandiera, O., Rasul, I., 2006. Social networks and technology adoption in northern
Mozambique. Economic Journal 116(514), 869–902.
CBS (Central Bureau of Statistics). 2011. Nepal living standard survey. Kathmandu:
Government of Nepal.
Conley, T. G., Udry, C. R., 2010. Learning about a new technology: Pineapple in
Ghana. American Economic Review 100(1), 35–69.
Evenson, R. E., Gollin, D., 2003. Assessing the impact of the Green Revolution, 1960 to
2000. Science 300(5620): 758–62.
Feder, G., Just, R. E., Zilberman, D., 1985. Adoption of agricultural innovations in
developing countries: a survey. Economic Development and Cultural Change 33(2),
255–98.
Feleke, S., Zegeye, T., 2006. Adoption of improved maize varieties in southern Ethiopia:
factors and strategy options. Food Policy 31(5), 442–57.
Foster, A., Rosenzweig, M., 1995. Learning by doing and learning from others: Human
capital and technical change in agriculture. Journal of Political Economy 103(6),
1176–1209.
Ghimire, R., Huang, W., 2015. Household wealth and adoption of improved maize varieties
in Nepal: A double-hurdle approach. Food Security 7(6): 1321–35.
Ghimire, R., Huang, W., Shrestha, R. B., 2015. Factors affecting adoption of improved rice
varieties among rural farm households in central Nepal. Rice Science 22(1): 35–43.
Gollin, D., 2010. Agricultural productivity and economic growth. Handbook of Agricultural
Economics 4, 3825–66.

35
Imbens, G., Woolridge, J., 2009. Recent developments in the econometrics of program
evaluation. Journal of Economic Literature 47(1), 5–86.
Isgin, T., Bilgic, A., Forster, D., Batte, M., 2008. Using count data models to determine the
factors affecting farmers’ quantity decisions of precision farming technology
adoption. Computers and Electronics in Agriculture 62(2), 231–42.
JICA, 2010. Commercialization of Agriculture in Nepal. Available at:
https://www.jica.go.jp/nepal/english/office/others/c8h0vm000001jmat-
att/newsletter_64.pdf
Krishnan, P., Patnam, M., 2014. Neighbors and extension agents in Ethiopia: Who matters
more for technology adoption? American Journal of Agricultural Economics 96(1),
308–27.
Langyintuo, A. S., Mungoma, C., 2008. The effect of household wealth on the adoption of
improved maize varieties in Zambia. Food Policy 33(6), 550–59.
Marenya, P. P., Barrett, C. B., 2007. Household-level determinants of adoption of improved
natural resources management practices among smallholder farmers in western
Kenya. Food Policy 32(4), 515–36.
Mariano M. J., Villano, R., Fleming, E., 2012. Factors influencing farmers’ adoption of
modern rice technologies and good management practices in the
Philippines. Agricultural Systems 110, 41–53.
Mason, N. M., Smale, M., 2013. Impacts of subsidized hybrid seed on indicators of economic
well‐being among smallholder maize growers in Zambia. Agricultural
Economics 44(6), 659–70.
MoAD (Ministry of Agriculture Development). 2014. Agriculture Development Strategy.
Kathmandu: Government of Nepal.
MoF (Ministry of Finance). 2015. Economic Survey. Kathmandu: Government of Nepal.
Noltze M., Schwarze, S., Qaim, M., 2012. Understanding the adoption of system technologies
in smallholder agriculture: The system of rice intensification (SRI) in Timor
Leste. Agricultural Systems 108, 64–73.

36
Pamuk, H., Qaim, E., Adekunle, A., 2014. Do decentralized innovation systems promote
agricultural technology adoption? Experimental evidence from Africa. Food
Policy 44, 227–36.
Paudel, P., Matsuoka, A., 2008. Factors influencing adoption of improved maize varieties in
Nepal: A case study of Chitwan District. Australian Journal of Basic and Applied
Sciences 2(4), 823–34.
Polson, R. A., Spencer D. S., 1991. The technology adoption process in subsistence
agriculture: The case of cassava in southwestern Nigeria. Agricultural Systems 36(1),
65–78.
Ramirez O. A., Shultz, S. D., 2000. Poisson count models to explain the adoption of
agricultural and natural resource management technologies by small farmers in
Central American countries. Journal of Agricultural and Applied
Economics 32(01):21-33.
Ransom, J. K., Paudyal, K., Adhikari, K. 2003. “Adoption of improved maize varieties in the
hills of Nepal. Agricultural Economics 29(3), 299–305.
Takeshima, H., 2017. Custom-hired tractor services and returns to scale in smallholder
agriculture: A production function approach. Agricultural Economics 48(3), 363–72.
Takeshima, H., Adhikari, R. P., Kaphle, B. D., Shivakoti, S., Kumar, A., 2016. Determinants
of chemical fertilizer use in Nepal. IFPRI Discussion Paper 1507. Washington, DC:
International Food Policy Research Institute.
Takeshima, H., Adhikari, R., Shivakoti, S., Kaphle, B. D., Kumar, A., 2017. Heterogeneous
returns to chemical fertilizer at the intensive margins: Insights from Nepal. Food
Policy 69, 97–109.
Teklewold, H., Kassie, M., Shiferaw, B., 2013. Adoption of multiple sustainable agricultural
practices in rural Ethiopia. Journal of Agricultural Economics 64(3), 597–623.
Wooldridge, J., 2007. Inverse probability weighted estimation for general missing data
problems. Journal of Econometrics 141(2), 1281–301.

ALL IFPRI DISCUSSION PAPERS
All discussion papers are available here
They can be downloaded free of charge INTERNATIONAL FOOD POLICY RESEARCH INSTITUTE www.ifpri.org IFPRI HEADQUARTERS 1201 Eye Street, NW Washington, DC 20005 USA Tel.: +1-202-862-5600 Fax: +1-202-862-5606 Email: [email protected]
SOUTH ASIA REGION Block C, NASC Complex, DPS Marg Opposite Todapur, Pusa New Delhi 110012 India Phone: +91-11-66166565 Fax: +91-11-66781699 Email: [email protected]