adopted - may 9, 2016...table 3. existing land use, 2016 page 30 table 4. zoning, 2016 page 31 table...
TRANSCRIPT

City of Harrington Downtown Development District Plan
Adopted - May 9, 2016
The Hubof Delaware
City of Harrington Property OwnersOrganizations
MerchantsResidents
It’s good to be in the Hub...


Page | 3 Final Plan
Table of ContentsAcknowledgements Page 7
Chapter One - The Introduction Page 9Downtown Description Page 11Purpose & Need Page 11Downtown Planning Process Page 13Existing Documents, Activities & Organizations Page 18
Chapter Two - The Data Page 25Demographics & Housing Page 27Land Use & Zoning Page 30Natural & Cultural Resources Page 36Physical, Public Realm & Walkability Page 38Economic & Market Analysis Page 46
Chapter Three - The Vision Page 51
Chapter Four - The Goals, Objectives & Strategies Page 59
Chapter Five - The Implementation Page 77Key Priority Projects Page 79Implementation Page 80Political Will & Implementation Ability Page 83Downtown Coordination Page 85Downtown Branding Strategy Page 85Consistency Page 87
Chapter Six - The Incentives Page 89Existing Incentives Page 91Proposed Incentives Page 91Other Funding & Support Opportunities Page 92
Chapter Seven - The Evaluation Page 95
Chapter Eight - The Maps Page 99
Chapter Nine - Appendix Page 119Downtown Survey Page 121News Articles Page 161Letters of Support Page 167Public Hearing Notice & Public Comments Page 179Local Enabling Legislation Page 183Websites & Links of Interest Page 185
Downtown Development District Plan


Maps
Map 1. Downtown Boundary Page 101Map 2. Downtown Aerial Page 103Map 3. Existing Land Use Page 105Map 4. Zoning Page 107Map 5. Downtown Redevelopment Page 109Map 6. Priority Redevelopment Projects Page 111Map 7. Environmental Features Page 113Map 8. Transportation Page 115Map 9. Downtown Parking Page 117
Tables
Table 1. City Housing Values & Renter Costs Page 29Table 2. Industries Represented by City Residents Page 29Table 3. Existing Land Use, 2016 Page 30Table 4. Zoning, 2016 Page 31Table 5. Industries Represented by Downtown Residents Page 46Table 6. Downtown Resident Top Job Locations Page 47Table 7. Downtown Workers’ Top Origin Locations Page 47
Figures
Figure 1. Population Pyramids, 2010 Page 27Figure 2. Racial Breakdown, 2010 Page 28Figure 3. Bicycle Map Page 40Figure 4. DART Route 117 Page 41Figure 5. Downtown Resident Jobs by Distance & Direction, 2013 Page 47Figure 6. Downtown Workers’ Origins by Distance & Direction, 2013 Page 47Figure 7. Downtown Job Inflow/Outflow, 2013 Page 47Figure 8. SWOT Analysis Page 49
Page | 5 Final Plan
Downtown Development District Plan


Page | 7 Final Plan
Downtown Development District Plan
City CouncilAnthony R. Moyer, MayorDuane E. Bivans, Vice MayorCharles W. Porter, District 1Amy Minner, District 2Fonda Coleman, District 3Eric Marquis, District 4Kenneth W. Stubbs, District 5
Planning CommissionJames Coudriet, ChairmanJeff Rettig, Vice ChairmanElizabeth BrodeWilliam RogersStacey Sizmore
Harrington StaffTeresa Tieman, City ManagerKelly Blanchies, Clerk of CouncilRhiannon Bush, City ClerkDean Gary, AccountantBeverley Ireland, Administrative AssistantAdam Poplos, Code EnforcementJoyce Wix, Administrative AssistantMichael Davis, Clerk
Downtown Task ForceViva Poore, Harrington Historical SocietyJack Stewart, The Clutter BoxJeff Bowers, Bowers Group LLCJames Callaway, Trinity United Methodist ChurchChristine Hayward, Harrington Public LibraryCheryl Lahman, The Harrington Florist & CakeryAlan Matas, Connections Community Support ProgramsAndy Patel, Downtown Junction
City Planning ConsultantsDebbie Pfeil - Project Manager
Associate / Planning Manager
Lauren Good, AICP - Project LeadProject Planner
Acknowledgments
This Plan would not have been possible without the cooperative efforts of a number of dedicated citizens, stakeholders, City staff, and elected and appointed officials. The City of Harrington selected consultant KCI Technologies, Inc. (KCI) for this project, as the Project Manager has been the City Planning Consultant for over ten years and is intimately familiar with the community.
The Downtown Development District planning process officially began in March 2015 with the submission of a Neighborhood Building Blocks Fund Grant application. Since then, community members have contributed numerous hours toward the preparation of this Plan. City Planning Consultants and City staff facilitated four Task Force meetings, two open houses, one public presentation, and one public hearing before the City Council, in addition to facilitating an online downtown survey as well as several community outreach notifications.
Community input and public participation is the foundation of the Downtown Development District Plan. Without the ongoing participation and support, this Plan would not have been possible.
Funding for this Plan was provided by the Neighborhood Building Blocks Fund.
A special thanks is given to the Delaware Public Archives for the provision of numerous historical images of Downtown Harrington.


The Hubof Delaware
City of Harrington Property OwnersOrganizations
MerchantsResidents
It’s good to be in the Hub...
Chapter One.
Downtown Harrington -The Introduction
City of Harrington Downtown Development District Plan


Page | 11 Final Plan
Downtown Description
For the purposes of this Plan, Harrington’s Downtown Development District shall be referred to as the Downtown and identified as the area shown on Map 1. Downtown Boundary. The Downtown, comprised mostly of the traditional central business district (Commerce Street, Railroad Avenue, and Mechanic Street), encompasses some of the adjacent residential streets where homes have been converted to businesses and other non-residential uses (Fleming Street, Dorman Street, and Delaware Avenue) and also extends eastward along Clark Street to incorporate commercial properties that cross the north-south running railroad tracks. The City has a population of approximately 3,500 and so chose a boundary of approximately 33 acres and 108 parcels, representing an area most in need of revitalization in which to concentrate their initial efforts.
The City used relevant data to support the need for the creation of their Downtown Development District Plan (Downtown Plan). With Census and other local data, the City was able to provide evidence that the Downtown has low homeownership, vacant buildings and storefronts, and a number of structures with existing code violations.
The City was able to identify a variety of potential positive impacts, including economic development potential, increased homeownership, positive marketing and identity creation, formation of a downtown organization, and a greater feeling of Downtown ownership. By attracting a greater number of owner-occupied residences, the City hopes that there will be increased residential property maintenance and general activity within the Downtown. They also feel that Downtown redevelopment will increase community pride, in turn encouraging additional investment, and reinvigorating the City as a whole.
Purpose & Need
In 2014, the Downtown Development Districts Act was enacted by the Delaware General Assembly in order to:
• spur private capital investment in commercial business districts and other neighborhoods;
• stimulate job growth and improve the commercial vitality of such districts and neighborhoods;
• help build a stable community of long-term residents by improving housing opportunities; and
• assist local governments in strengthening neighborhoods while harnessing the attraction that vibrant downtowns hold for talented people, innovative small businesses, and residents from all walks of life.
In the first round of Downtown Development District (DDD) applications in 2014, three communities were awarded designation: Dover, Seaford, and Wilmington. Governor Markell announced the opening of a second round of DDD applications on March 16, 2016. Communities throughout the State would have the opportunity to apply to have their downtown areas designated as Districts and take advantage of the program.
Local governments wishing to take advantage of the program must identify a downtown district in their community and apply for designation through the Office of State Planning Coordination. Completed applications are considered by the Cabinet Committee on State Planning Issues, which makes recommendations to the Governor, who then designates Downtown Development Districts. Selection as a Downtown Development District entitles private construction projects within the identified District to receive grants to offset 20% of their capital construction costs.
Unlike similar incentives in other states that are often limited to commercial and industrial projects, Downtown Development District grants are available for a broad range of projects including residential, mixed-use, commercial, and industrial projects within the boundaries of a DDD. Grants are available to virtually anyone who makes qualified real estate improvements in a DDD. This includes for-profit builders and investors, nonprofit organizations, businesses, and even homeowners. For eligibility purposes, qualified real property investments are capital expenditures, incurred after DDD designation, necessary for rehabilitation, expansion, or new construction, sometimes referred to as “hard costs”. Examples include exterior, interior, structural, mechanical, or electrical improvements; excavations; grading and paving; landscaping or land improvements; and demolition. In addition to the DDD grant administered by the Delaware State Housing Authority, several State agencies are offering enhancement to existing programs for those
Downtown Development District PlanChapter 1. The Introduction

Page | 12 Final Plan
Downtown Development District PlanChapter 1. The Introduction
communities that achieve DDD designation including the Department of Agriculture; Department of Children, Youth and Their Families; Department of Health and Social Services; State Housing Authority; Department of Natural Resources and Environmental Control; Department of State; and the Sustainable Energy Utility. Many State agencies also have existing programs that will further DDD initiatives.
Harrington received a Neighborhood Building Blocks Fund Grant in 2015 to develop a Downtown Development District Plan, in order to apply for State designation under this program. This grant, funded by the JP Morgan Chase settlement agreement, awarded $40,000 to the City of Harrington to engage a planning consultant and prepare a District Plan (including stakeholder and public outreach process) and accompanying maps for submittal to the Office of State Planning Coordination for application for designation as a Downtown Development District. Harrington intends to submit their application for Downtown Development District designation in the June 1, 2016 designation application round.
The City of Harrington has long been an important commercial, agricultural, and entertainment hub in Delaware. In more recent history, the majority of the regional draws and attractions are located outside of the City’s core downtown. A major challenge for the City is to redevelop the Downtown with the right mix of uses, promote day and night economic activity as well as year-round activity, and compete with the abundant commercial and entertainment options outside of the Downtown. The Downtown still has a variety of small-scale businesses including retail, banks, and professional and general services, but currently has a number of vacant and underutilized properties.
Harrington is starting to see a redevelopment trend occur in the Downtown, which has experienced some infill and also several redevelopment projects that have made improvements such as exterior renovations and signage upgrades. In 2007, the City changed its development review process, making many processes subject to only administrative review, thereby expediting the project review and resulting in a process that was less expensive in terms of time and cost. This process has been very successful and encourages redevelopment through onsite guidance and building improvements. Unfortunately, most of the successful redevelopment projects that have
taken advantage of this new, expedited process have been located on DuPont Highway; however, some were located in the Downtown area, such as Spartan Station, Downtown Junction, and a local farmers’ market.
The City desires to continue stimulating development in the Downtown and build off of these recent successes. One major goal is to revitalize the Downtown, improve existing businesses, and attract new businesses. Toward this goal, the City supports additional infill development on vacant parcels for mixed uses, as well as the adaptive reuse of existing structures. While the majority of the empty structures are older and may not be up to current building code regulations, they still hold great development potential. Several of the buildings are large and the building footprint takes up the majority of the property. As such, some development requirements such as on-site parking may be difficult to meet.
The City also desires to create a more vibrant live-work-play community with a mix of residential, retail, service, and entertainment uses. Currently, the City wishes to attract additional retail and professional office type uses. The Downtown would benefit from more daily amenities such as groceries, nighttime restaurants, a movie or play theater, and housing options for all ages and income groups. Retail, entertainment, and lodging uses in the City could dovetail and benefit from the many regional attractions such as the Harrington Casino and Raceway and other uses on DuPont Highway, as well as annual attractions such as the Harrington State Fair. In addition, the City would like to increase its resident population working within City limits. Apartments above retail or offices in the Downtown would offer additional housing options for a wider range of ages and income levels, and additional retail and office uses in the Downtown would offer more job opportunities for residents.
The City further wishes to encourage foot traffic and make the streets more pedestrian friendly, beautify the public realm, and promote public safety through street activity. The City has been advancing placemaking principles that promote pedestrian activity and retaining and attracting neighborhood scale businesses. For instance, the City received funding to reconstruct the sidewalks in the Downtown. This is a major enhancement project to enhance character, as well as bring the Downtown into Americans with Disabilities Act compliance.

Page | 13 Final Plan
Marketing, promotion, and additional branding efforts are also needed to encourage local residents, employees, and visitors to regularly visit downtown businesses and community events. Businesses need to be organized and set forth joint marketing and special events. The City would also like to focus on business recruitment, including maintaining an inventory of available business space and publicizing commercial opportunities.
Downtown Planning Process
Downtown Reconnaissance Survey
At the beginning of the Downtown planning process, City Planning Consultants visited the City of Harrington and walked the streets that would eventually comprise the Downtown boundary in order to best observe, document, and photograph its existing conditions. This survey included documentation of uses and businesses, urban form, contributing features to community identity and character, property maintenance and upkeep, redevelopment opportunities, streetscape conditions, and overall walkability. One of the Consultants has served as Harrington’s City Planner for over ten years and is very familiar with the City and was able to give even deeper insight to this process than would a casual observer who did not have nearly the same depth and breadth of knowledge.
Stakeholders & Partnerships
Stakeholders and partners play significant roles in achieving the goals stated within this Plan. It is important that everyone work together to implement the Plan as well as work toward improving the overall Downtown. When forming a Downtown Merchants’ Organization, it is important to strive for diversity, dedication, and positive promotion within leadership positions. The City should encompass a supportive role and not a leadership role other than the initial coordination. The local stakeholders identified within the Downtown include, but are not limited to:
• Business Owners• Property Owners• City of Harrington City Hall
• City of Harrington Police Department• Residents/Consumers• Harrington Senior Center• U.S. Post Office - Harrington• Norfolk Southern Railroad• Religious Institutions• Financial Institutions• Harrington Historical Society
Partners play a significant role within the Downtown. While these partners may not reside in the City limits, the resources, knowledge, and overall support to the Downtown can be significant. The potential partners identified within the Downtown include, but are not limited to:
• Harrington-Greenwood-Felton Centennial Rotary Club
• Central Delaware Chamber of Commerce• Kent Economic Development• Delaware Economic Development Office• Kent County & Greater Dover Tourism• Delaware Department of Transportation• Delaware Department of Natural Resources &
Environmental Control• Small Business Association - Delaware District
Office• United States Department of Agriculture -
Business and Cooperative Rural Development
Community Outreach
Community outreach is an important component in the planning process. The opinions of residents, business owners and operators, property owners, and visitors help to identify what they think the important issues are that need to be addressed and how they think the Downtown can be improved in the future. The following outreach methods were completed during the process of creating this Plan:
• Task Force Meetings (4);• Downtown Survey;• Community Outreach Events (2);• Public Presentation (draft Plan); and• Public Hearing.
Task Force MeetingsThe Downtown Task Force was appointed by the City Manager and was comprised of a number of
Downtown Development District PlanChapter 1. The Introduction

Page | 14 Final Plan
Harrington citizens, business owners, and nonprofit organization members who are active in the community. Members donated numerous hours to attend meetings, provided their input on a variety of topics, decorated their businesses and organizations for Downtown open houses, encouraged friends and family members to participate in online surveys, attended public presentations, and most importantly, gave invaluable input into the Downtown Plan that could not have been written without their support and encouragement.
The Task Force met on four separate occasions:
Task Force Meeting No. 1 | Kick-OffThe Task Force kick-off meeting was held on December 1, 2015 at the Price Community Center. Task Force members were present to hear the City Planning Consultants discuss background on the 2014 Downtown Development Districts Act, Neighborhood Building Blocks Fund (NBBF) Grant, and Harrington’s successful NBBF grant application. The overall project scope and schedule was discussed, as well as project roles and responsibilities. A brief overview of recent projects and investments was given that led into a discussion of the Downtown’s demographics and existing conditions. Members were introduced to their homework assignment – a SWOT analysis – where they were asked to walk the Downtown and think about its strengths, weaknesses, opportunities, and threats. Members were also asked to review and comment on draft survey questions that would be finalized and made public in January 2016. A proposal for a community outreach event was also discussed – Love Your Downtown. Members were also asked to consider whether they would like to see any changes to the proposed Downtown boundary.
Task Force Meeting No. 2 | VisioningThe second Task Force meeting focused on visioning activities and was held on January 12, 2016, also at the Price Community Center. Task
Force members heard the City Planning Consultants review five model projects: Winchester, VA; Apex, NC; Milford, DE; Keswick Village, PA; and a mixed-use
Habitat for Humanity project located in Albany, NY. Consultants also discussed lessons learned in interviewing staff from these and other “model” towns, as well as their own past experiences. Members were asked their opinions on the proposed Downtown boundaries. The SWOT analysis that was assigned as homework during the first meeting was discussed in depth (information can be found in Chapter Two under Economic & Market Analysis). Members were introduced to their homework assignment – consideration of possible goals and objectives. They were also asked to attend the upcoming community outreach event – Love Your Downtown – and were reminded to participate in the downtown survey and ask others to as well.
Task Force Meeting No. 3 | Goals & ObjectivesThe third Task Force meeting focused on goals and objectives and was held on March 10, 2016, again at the Price Community Center. Task Force members heard the City Planning Consultants present an overview of the downtown survey results. A follow-up to the previous Task Force meeting’s SWOT analysis was held, based on results of the survey. Members began a discussion of goals and objectives that would be completed at the following meeting.
Task Force Meeting No. 4 | IncentivesThe fourth Task Force meeting centered on a discussion of possible incentives to be offered within the Downtown. It was held on March 23, 2016 in the Harrington City Hall Council Chambers. Goals and objectives for the Downtown were finalized and the ultimate vision was determined. Direction was determined for incentives and the Task Force gave 100% buy-in to the process to-date.
Downtown SurveyIn January 2016, an online survey was opened to all residents, business owners and operators, property owners, renters,
Downtown Development District PlanChapter 1. The Introduction

Page | 15 Final Plan
employees, and visitors to the City of Harrington. The online survey ran from January 11, 2016 through February 19, 2016. Paper copies of the survey were also made available to those without internet access. Postcards describing the Downtown project, as well as requesting completion of the survey, were distributed at the Love Your Downtown Open House, throughout the Downtown, and emailed to various stakeholders. The survey was also available for those who chose to complete it in a paper format. These were returned to the City Hall and were manually entered into the online survey for data analysis. A total of 88 responses were collected. Surveys were differentiated for residents/visitors and merchants. The purpose of the survey was to collect information on the frequency and purpose of consumer activity in the Harrington area, the demand for new and expanded commercial offerings, the factors that influence local consumer shopping decisions, and the needs of local business owners and operators.
The survey focused on the following areas:
• when and where visitors shopped in the Downtown;
• features that attract respondents to a shopping/business area;
• advantages and disadvantages of Harrington’s Downtown;
• safety;• preferred future scenarios;• businesses respondents would like to see in the
Downtown;• changes that would improve the Downtown;• needs for Downtown business expansion;• potentially useful services for local merchants;• importance of various consumer segments;• barriers and obstacles facing Downtown
businesses; and• forms of advertising currently utilized by
Downtown businesses.
Forty percent of survey respondents were Harrington residents. Nearly 65% of those responding to the survey were women. Over 93% of the respondents were white and over 97% indicated they were not Hispanic or Latino. Slightly over 45% of respondents indicated their age to be between 45 and 64. The following list briefly summarizes
responses to the survey:
• The most common frequencies for visiting Downtown Harrington was “once every few months” (31% of respondents) and “once a month” (23% of respondents).
• Respondents indicated that the places they most frequently visited in the Downtown were the “Post Office or Bank” and “Retail”.
• The most commonly identified time to visit the Downtown was Monday-Friday, before 5:00pm.
• When questioned about safety, 100% of respondents indicated they felt safe in the Downtown during the day and 61% indicated they felt safe during the night.
• The factors “friendly local service,” “supporting local businesses,” and “convenient location” were most commonly cited as major advantages of the Downtown.
• “Lack in variety of goods and services” was most commonly cited as a major disadvantage of the Downtown.
• When questioned about the types of businesses respondents would like to see come to the Downtown, the most common requests were for personal service uses, pubic and civic uses, and commercial retail uses, with specific requests such as a small grocery store and hair salon. Locally-owned restaurants, coffee shops, and specialty food shops were the most requested food-related businesses, with specific requests such as an ice cream shop, bistro, and sports bar.
• When asked if respondents “strongly agree” that certain traits attract them to a shopping/business area, “friendly customer service,” “quality of products and services,” and “variety of products and services” were most commonly rated as influencing factors.
• 40% of respondents to the merchant survey indicated they had a need to expand. In a separate question, only 40% of respondents indicated that they were committed to keeping their business Downtown.
Additional information gleaned from the survey can be found throughout this Plan. The survey forms and more detailed results can be found in the Appendix.
Downtown Development District PlanChapter 1. The Introduction

Page | 16 Final Plan
Community Outreach - Love Your Downtown Open House On February 5, 2016, the Harrington Downtown Development District Partnership (comprised of the City of Harrington, City Planning Consultants, and Downtown businesses and nonprofits) held an event, Love Your Downtown, in conjunction with the City Council’s proclamation of February as City Goes Red Month and February 5th as Wear Red Day. In addition to working with the City to promote City Goes Red Month and Wear Red Day to urge all citizens to show their support for women and the fight against heart disease, the Love Your Downtown Open House encouraged businesses to create red window displays and decorations. This outreach event encouraged area residents to visit Downtown businesses, nonprofits, and government agencies to learn what they sell or services they provide, and hopefully to encourage these same people to patron a new business or entity. Each participating business/nonprofit was provided an event card that encouraged each person to visit all the businesses/nonprofits shown on the Downtown map and obtain a signature of each business to be eligible for a gift basket upon completion. An educational project booth was displayed within the City Hall Council Chambers to wrap up the end of the day by drawing event cards to win the two gift baskets. The purpose of this booth was to display information on the Downtown project, gain feedback on the proposed boundary and SWOT (strengths, weaknesses, opportunities, and threats) analysis (see Chapter Two), and to encourage attendees to fill out the downtown survey. There was a proposed boundary map and SWOT analysis, as well as information on the 2014 Downtown Development District Act for community members to review and ask questions.
Nine stakeholders participated in the open house:
City of Harrington Staff members Joyce Wix, Beverley Ireland, and City Manager Teresa Tieman join City Planning Consultants Lauren Good and Debbie Pfeil of KCI Technologies at the Love Your Downtown project booth displayed in City Hall.
Happy Tails Dog Grooming The Harrington Florist & Cakery
City Manager Teresa Tieman with OMG Collage owner Marie Gannon
The Clutter Box
Cook’s Tire CenterPower in Praise Ministries
Harrington City HallHarrington Police Department
Harrington Historical Society (HHS)Mayor Anthony Moyer, HHS President
Jean Miller, HHS Treasurer Viva Poore, and City Manager Teresa Tieman
Downtown Development District PlanChapter 1. The Introduction

Page | 17 Final Plan
Community Outreach - Senior Center Birthday CelebrationGene Price, Director of Harrington Senior Center, Inc., invited the City Planning Consultants to attend their February 16, 2016 birthday celebration to discuss the Downtown project. Keeping the “Love Your Downtown” theme of the open house event, display tables were set up and the two Consultants gave brief presentations on the Plan and eventual goals of Downtown Development District designation with the State. They also assisted numerous celebration participants in filling out their downtown surveys (more information above). Celebrants who filled out surveys were entered into a raffle for gift baskets provided by the City Planning Consultants.
Public PresentationOn April 14, 2016, a joint meeting of the Harrington City Council, Planning Commission, and Downtown Task Force was held at the Price Community Center, and was open to the public. All stakeholders with physical addresses located within the Downtown were hand-delivered a flyer inviting them to attend. Information about the presentation was also advertised in the newspaper and posted on the City’s website. At this meeting, City Planning Consultants gave a presentation on the Plan’s development, the outreach process, the Downtown vision, the Plan’s goals and objectives, implementation strategies and timelines, incentives, and an overview of the Downtown Development District Designation application process. All attendees were invited to ask questions. This presentation served as the public release of the Plan document and the following day (April 15th) marked the beginning of the public comment period, which would end on May 9th at the close of the Public Hearing.
Public HearingThe Public Hearing on Harrington’s Downtown Development District Plan was held on May 9, 2016 and public comments were received from April 15th through the close of the Public Hearing. A legal notice advertising the Public Hearing was published in the Delaware State News on April 24, 2016 and in The Journal on April 27, 2016. All public comments received during this period are provided in the Appendix.
Local Press CoverageThe City thanks The Journal for their coverage and support of this project with news articles published on the following dates: February 3, 2016; February 10, 2016; April 6, 2016; and April 20, 2016. Copies of these articles can be found in the Appendix.
Downtown Development District PlanChapter 1. The Introduction

Page | 18 Final Plan
Agency Coordination
A draft of this Downtown Plan was submitted to the Office of State Planning Coordination (OSPC) on April 15, 2016, the same time the draft was released to the public, in accordance with the Neighborhood Building Blocks Grant Agreement.
Existing Documents, Activities & Organizations
Comprehensive Land Use Plan
The City of Harrington’s Comprehensive Land Use Plan was adopted on December 16, 2013 and certified by the Governor. Its primary vision is to maintain the quality of life and rural character of the community while protecting the health, safety, economic health, and welfare of its citizens. Harrington recognizes that responsible and sustainable use of land and natural resources is critical to the economic growth of the community.
The function of the Comprehensive Land Use Plan is to provide direction relating to growth management, redevelopment, transportation, environmental protection, and City services based on past and present data and trends. The Comprehensive Plan identified areas of improvement and implementation items for future consideration.
While applicable to the entire City, the Comprehensive Plan holds a number of themes that can be used to further inform the Downtown planning process. It indicates that the downtown in every small town reflects the heart and soul of the community. Harrington’s Downtown should reflect the City’s small town character with seasonal window displays that encourage the community to shop locally. It should be the location of events and gatherings for neighbors and businesses. The community should be able to park their vehicles, walk, or ride their bicycles to the Downtown to shop, eat, and socialize. The Comprehensive Plan’s
themes and goals that are relevant to the Downtown have been incorporated throughout this Plan and, most specifically, into Chapter Four.
Upon adoption of the Comprehensive Land Use Plan, the City prepared a comprehensive rezoning to ensure the proposed zoning changes complement the approved future land use classifications. During this process, all parcels were compared to the existing zoning to determine proposed zoning changes. Notifications were sent to the affected property owners allowing an opportunity to meet with the City to discuss the changes and to determine if property owners wished to oppose the proposed zoning. Based on requested meetings by the property owners, only eight parcels were in opposition to the proposed zoning changes. These eight parcels were reviewed and a recommendation was made to allow the current zoning classification to stand. One hundred and sixty-seven parcels (excluding the eight opposed parcels) were presented for zoning changes and adopted as presented in Ordinance 15-07 on July 20, 2015. Ordinance 15-16 was presented to amend the recently adopted Comprehensive Land Use Plan, Exhibit 17 - Future Land Use to change the eight parcels to complement the existing land use classification. This Ordinance was adopted on December 7, 2015. The City submitted the Comprehensive Land Use Plan Amendment to the Office of State Planning Coordination on February 1, 2016 and presented at the Preliminary Land Use Service (PLUS) meeting on February 24, 2016. Correspondence was received regarding the PLUS application with no State objections.
Zoning Regulations & Design Standards
The 2013 Comprehensive Land Use Plan identified certain needs as they pertain to aesthetic appearance and the function of the Downtown. During this process, it was discovered that the Downtown area had several spot zoning classifications and the neighboring uses were not complementary in nature. The identified needs included, but were not limited to, the following:
• lack of character and maintenance;• structure and curb appeal improvements;• new street lighting for remaining downtown
area; and
Downtown Development District PlanChapter 1. The Introduction

Page | 19 Final Plan
• window displays and maintenance of vacant buildings.
The City’s Zoning Ordinance (Chapter 440 of the City Code) recently underwent a comprehensive update, which was adopted on July 20, 2015 and ensured the neighborhood uses were allowed throughout the area. The majority of the Downtown is in the C-2 Central Commercial Zone, which was completely updated to be a major component in the City’s redevelopment efforts. The intent of this zoning district is to create a lively, safe, human-scaled downtown area in which people will want to live, visit, shop, and work. The C-2 Zone regulations permit a variety of uses that one finds in a traditional downtown. In addition, the design standards focus on creating a pedestrian-oriented space through form-based site, building design, and placemaking standards.
The Downtown also includes a smaller portion of C-3 Service Commercial Zone, which permits uses and has zoning requirements that are more typical of a higher commercial highway environment than a traditional, walkable downtown. A more detailed description and assessment of the zoning districts within the Downtown are provided in Chapter Two.
Healthy Community Action Plan
The Harrington Healthy Community Action Plan (HCAP) provides a tool containing strategies based on community assessment data and input from a partnership team comprised of positive, active, diverse, committed, and community-driven individuals that brought several different viewpoints to the project. A community assessment was completed using the Community Health Assessment and Group Evaluation (CHANGE) tool developed by the Centers for Disease Control and
Prevention (CDC). Project goals were to develop and/or strengthen the capacity of the Harrington community to reduce obesity and other chronic diseases and improve the health of residents by implementing policies, systems, environmental strategies, and programmatic
supports to increase healthy eating and opportunities for active living and healthy behaviors.
The HCAP, while applicable to the entire City, includes some goals that have and can be used to further inform strategies for the Downtown:
• develop a mixed use zoning classification (this goal was achieved through the adoption of new C-2 Zone regulations in Chapter 440, Zoning in 2015);
• develop a bicycle and pedestrian plan;• conduct annual Harrington Healthy Community
Day;• continue the Farmers’ Market; and• encourage medical and dental services to locate
in Harrington.
Strategies for State Policies & Spending
On April 14, 2016, Governor Markell signed Executive Order 59 adopting the 2015 Delaware Strategies for State Policies and Spending. Originally approved in 1999 and updated in 2004 and 2010, the 2015 document is the third iteration and is now available online. A link has been provided in the Appendix.
The purpose of this document, as with previous Strategies for State Policies and Spending documents, is to coordinate land use decision making with the provision of infrastructure and services in a manner that makes the best use of natural and fiscal resources. The importance of such coordination lies in the fact that land use decisions are made at the local level, while the bulk of infrastructure and services that support land use decisions are funded by the State. The development of the State Strategies document with local governments and citizens helps to create a unified view toward growth and preservation priorities that all levels of government can use to allocate resources.
The document uses the following area designations:
• Levels 1 and 2 identify areas of the State that are most prepared for growth and where the State can make the most cost-effective infrastructure investment for schools, roads, and public safety.
• Level 3 areas reflect areas where growth is anticipated by local, county, and State
ACTION PLAN August 2011
Downtown Development District PlanChapter 1. The Introduction

Page | 20 Final Plan
plans in the longer term, or areas that may have environmental or other constraints to development. State investments will support growth in these areas; however, the State may have other priorities in the near term, especially for Levels 1 and 2.
• In Level 4 areas, the State will make investments that will help preserve a rural character, such as investments to promote open space and agriculture. The State is also looking to enhance agricultural activities by encouraging the location of complementary businesses in these areas.
• Out-of-Play lands are those that cannot be developed for reasons including designation as federally- or state-owned protected lands, parkland, the development rights have been purchased, or State and local regulations prohibit development.
The entirety of Harrington’s Downtown has been designated as Level 1. A link to the Office of State Planning’s website with more information and official maps can be found in the Appendix. According to the 2015 document, in investment Level 1 areas, State investments and policies should support and encourage a wide range of uses and densities, promote a variety of transportation options, foster efficient use of existing public and private investments, and enhance community identity and integrity. Overall, it is the State’s intent to use its spending and management tools to maintain and enhance community character, to promote well-designed and efficient new growth, and to facilitate redevelopment within these areas.
Public InvestmentsSince fiscal year 2010, significant public investments have been made to the Downtown. The investments made were between fiscal years 2010-2013:
• Clark Street - $33,354 DelDOT funded with no City match
• Streetscape Phase 1 - $24,000 Transportation Enhancement Program with no City match
• Streetscape Phase 1 - $302,032 ($248,600 DelDOT funded and $53,432 City funded)
• Clark Street Curbing - $6,010 City funded• Freedom Park - $49,987 ($20,000 Delaware
Land Trust funded and $29,987 matching funds)
Downtown Streetscape ImprovementsThe City of Harrington received funding for several improvements within the Downtown. This project not only served to enhance the Downtown character, but achieved Americans with Disabilities Act compliance. The DelDOT Transportation Enhancement and Community Transportation Fund provided monies for construction of the Downtown Streetscape Project.
Phase one consisted of the enhancement of the sidewalks and intersections on Commerce Street from Dorman Street to Fleming Street and on Clark Street from Fleming Street to Hanley Street. The extent of work at each location included:
• removal and disposal of 620 linear feet of curbing• removal and disposal of 11,400 square feet of
existing concrete sidewalk and asphalt paving
Downtown Development District PlanChapter 1. The Introduction

Page | 21 Final Plan
Downtown Development District PlanChapter 1. The Introduction
• installation of 622 linear feet of concrete curbing• installation of 11,000 square feet of concrete
sidewalk and driveway apron• installation of 50 tons of hot mix paving• installation of 15 landscaped islands• installation of electric conduit and lighting for
18 street lights• installation of 5 aluminum drain outlets
Freedom ParkFreedom Park, located on the corner of Fleming Street and Mechanic Street, was once a vacant lot with broken pieces of concrete and weeds used as an overflow parking lot. The Police Department, with approval from the City Council approving
Resolution 13-R-11 on July 15, 2013, applied for a Delaware Land Trust Fund (DTF) grant in the amount of $20,000 for landscaping, signage, and sidewalks. A 50% match was required from the City; therefore, monies from seized funds and donations accounted for the match. With the vision of the Harrington Police Department and support of the Mayor and City Council, the new park was designed to include a gazebo, benches, sign, Christmas tree, flag pole, irrigation, fence, and landscaping so that it could be a multi-purpose open space area. Freedom Park is the site of many Downtown events throughout the year. More information about these events can be found below in the Downtown Events section.
Designations
The City of Harrington is one of ten “Commercial District Affiliate” (CDA) designations by the State of Delaware Department of Economic Development

Page | 22 Final Plan
Office (DEDO). This designation is for communities that choose to implement downtown revitalization strategies similar to designated Main Street programs, but on a smaller scale. Some of these towns are “testing the waters” as they consider future Main Street designation. DEDO works with these communities to build strategies that will encourage partnership development, new funding opportunities, and increased opportunities for small businesses. The CDA municipalities can participate in Downtown Delaware’s group training activities led by state and national downtown development experts. Affiliates are in the “network” to learn about best practices in the field of revitalization, to work with a downtown business development expert, and to trade best practices with peers from around the state, particularly in the area of business development. Many of Delaware’s CDAs are direct beneficiaries of USDA grant-related activities. Ultimately, CDAs are offered an opportunity to plan proactively for a vibrant, synergistic downtown commercial business district based on the Four Point Main Street model.
On June 3, 2008, representatives from the Delaware Economic Development Office presented the “Main Street Program and Next Step for Downtown” to the City identifying the Main Street Four-Point Approach. The four point approach presented included:
Organization | Develop a budget, gauge community interest, have a speakers bureau, gauge volunteer level, ascertain pledges, and prepare the Delaware Main Street application to DEDO.
Design | Streetscape design, design incentives, and review zoning to include project buildings.
Promotion | Coordinate a calendar of events.
Economic & Restructuring | Work with a DEDO business development specialist, make use of free energy audits, and develop a building/business inventory.
The next steps were preparing a Main Street work plan to move forward in applying for the Main Street designation. The official Main Street application was never submitted by the City of Harrington
based on the lack of Downtown stakeholders and partners.
Downtown Events
Several large events take place in the Downtown throughout the year that bring the community together.
Heritage Day is an annual celebration of the City’s history, featuring a parade (above, far), food, games (above, low), entertainment, and crafts, as well as an
annual watermelon-eating contest.
Police National Night Out is an annual community-building campaign that promotes police-community partnerships and neighborhood camaraderie to make
neighborhoods safer, better places to live.
Downtown Development District PlanChapter 1. The Introduction

Page | 23 Final Plan
Lake Forest High School also rotates its annual Homecoming Parade, which takes place in Harrington’s Downtown every few years. In addition to these events, there are also a number of popular community services, including Parks and Recreation programs, Police Department community events, school outreach events, Library community programs, local church and nonprofit organization events, and supportive local business’ events that occur either within or very close to the Downtown area.
Freedom Park is the site of many Downtown Events including Movies in the Park (top) and Music in the Park (logo, bottom). These events draw many participants
from throughout the community.
Freedom Park is also the site of the City’s annual Christmas Tree Lighting Ceremony, as well as a spot where many people congregate for the Christmas
Parade. As you can see above, the site is well-decorated for all of the City’s holiday festivities.
based on the lack of Downtown stakeholders and partners.
Downtown Events
Several large events take place in the Downtown throughout the year that bring the community together.
Heritage Day is an annual celebration of the City’s history, featuring a parade (above, far), food, games (above, low), entertainment, and crafts, as well as an
annual watermelon-eating contest.
Police National Night Out is an annual community-building campaign that promotes police-community partnerships and neighborhood camaraderie to make
neighborhoods safer, better places to live.
Downtown Development District PlanChapter 1. The Introduction


The Hubof Delaware
City of Harrington Property OwnersOrganizations
MerchantsResidents
It’s good to be in the Hub...
City of Harrington Downtown Development District Plan
Chapter Two.
Downtown Harrington -The Data


Page | 27 Final Plan
Through the many assets, opportunities, and challenges identified through this Downtown Plan, it is clear that Harrington’s Downtown is well-positioned for growth and infill development. This Plan builds from these strengths, carries out the City’s vision, and puts the placemaking recommendations in the Comprehensive Plan and recent zoning updates to work. Redevelopment is a top priority and Harrington wishes to address several critical issues that may be hindering the Downtown from meeting its economic potential and capitalize on its many strengths and opportunities.
Demographics & Housing
Population
Harrington’s estimated population in 2013 was 3,616, a very slight increase over the 2010 U.S. Census count of 3,562 and only a 14% increase to the 2000 population of 3,174. While Harrington’s population growth during this 2000-2013 time period is more in line with that of the State’s 18% growth, it should be noted that Kent County’s population growth is more than double that of the City’s at 30% during the same 13-year time period. Population figures are not available for the Downtown due to the way the Census collects data at this smaller area level, but the Census Blocks that most closely correspond to the Downtown exhibited a population growth of 20% from 2000 to 2010, growing from a population of 460 to 554.
Almost 60% of the Downtown is comprised mostly of working aged individuals (aged 20-65). The next largest group in the Downtown is comprised of school-aged individuals, with almost 26% between the ages 5-19. Seniors make up 8.5% of the population and preschoolers (less than 5 years old) make up less than 8%. As you can see from the population pyramids shown in Figure 1, the population of the Downtown is skewed slightly to the younger age groups, while the City as a whole has higher senior and elderly populations. The median age of the City of Harrington was 33 years according to the 2010 Census.
Figure 1. Population Pyramids, 2010
-6 -4 -2 0 2 4 6 8
Under 510-1420-2430-3440-4450-5460-6470-7480-84
POPULATION PYRAMID FOR DOWNTOWN, 2010
% Female % Male
-8 -6 -4 -2 0 2 4 6 8
Under 5
10-14
20-24
30-34
40-44
50-54
60-64
70-74
80-84
POPULATION PYRAMID FOR CITY, 2010
According to the 2010 Census, over 66% of the Downtown’s population was white, 19% was black, 6% was two or more races, and 8% was other. The category “other” encompasses American Indian or Alaska Native, Asian, Native Hawaiian or other Pacific Islander, and other races not specifically listed. Persons of Hispanic or Latino origin accounted for 8% of the Downtown’s population. These numbers vary slightly from what can be seen in the City as a whole, where 68% of the population was white, 23% was black, and 8% was other. Five percent of the Downtown population was of Hispanic or Latino origin. This comparison shows that the Downtown is slightly more diverse than the City as a whole. The percentages shown for the City very closely mirror those shown for Kent County and the State of Delaware as well. See Figure 2 for a breakdown of races within the Downtown, City, County, and State.
Downtown Development District PlanChapter 2. The Data

Page | 28 Final Plan
Figure 2. Racial Breakdown, 2010
64%22%
1%
0%
0% 6% 7%
Races within the Downtown, 2010
White Black or African American
American Indian & Alaska Native Asian
Native Hawaiian & Other Pacific Islander Some Other Race
Two or More Races
69%
23%
1%
1% 0% 2% 4%
Races within the City, 2010
White Black or African American
American Indian & Alaska Native Asian
Native Hawaiian & Other Pacific Islander Some Other Race
Two or More Races
68%
24%
1%2%
0% 2% 3%
Races within Kent County, 2010
White Black or African American
American Indian & Alaska Native Asian
Native Hawaiian & Other Pacific Islander Some Other Race
Two or More Races
69%
21%
1%3% 0% 3% 3%
Races within State of Delaware, 2010
White Black or African American
American Indian & Alaska Native Asian
Native Hawaiian & Other Pacific Islander Some Other Race
Two or More Races
Income & Poverty
Harrington’s 2013 median household income was estimated to be $38,182, more than $15,000 below the Kent County median of $55,000 and more than $20,000 below the State median of $60,000. Median per capita income was $17,891, compared to the County’s $24,851 and the State’s $29,819. The City’s poverty rate of 19.7%, according to the 2009-2013 American Community Survey, was almost 60% greater than the State’s 11.7% rate. Unfortunately, this information is not available at the Census Block level and, thus, cannot be determined for the Downtown area.
Housing & Homeownership
The City’s 2013 homeownership rate of just over 50% greatly falls behind the County (72.3%), State (72.5%), and national (64.9%) rates. According to the 2013 Comprehensive Land Use Plan, the percentage of owner-occupied units throughout the City has been decreasing over the past 25 years, although the actual number of units is still the largest segment of housing stock that can be found. This is due to a dramatic increase in the number of mobile homes and trailers within City limits as part of the annexation of a mobile home park between 1990 and 2000 and the construction of several multi-family structures in the 2000s. Within the Downtown, the homeownership rate is even lower, at only 45%. The Downtown also has a residential vacancy rate that is nearing 15%.
The 2000 Census identified 674 owner-occupied housing units within the City. Seventy percent of those were valued between $50,000 and $99,999. Less than 1% were valued above $150,000, while almost 7% were valued below $50,000. The median value was $83,800. The largest market segment for renter-occupied units was for the $500-$749 price range, with one-third of renters falling in that category. Just over 8% of renters paid over $750 per month, while almost one-third paid less than $300. The median monthly rental price paid in 2000 was $434.
The 2010 Census saw a 20% increase in the number of owner-occupied housing units. The values of those units also rose considerably, with almost 70%
Downtown Development District PlanChapter 2. The Data

Page | 29 Final Plan
of units ranging in value from $100,000 to $299,999. There were still 27% of owner-occupied units that had values of less than $100,000, while just over 3% had values over $300,000. The median value for owner-occupied units was $151,600. The number of renter-occupied units increased by almost 30% during the same time period. The largest market segment for renter-occupied units was for the $1,000-$1,499 price range, doubling since 2000, with 28% of renters falling in that category. Almost half of renters paid over $750, while almost one-quarter still paid less than $300. The median rental price paid in 2010 was $1,103 per month.
Table 1. City Housing Values & Renter Costs2010 2000
No. % No. %
Ow
ner-
Occ
upie
d
Total Units 812 - 672 1
<$50,000 150 18.5% 45 6.7%
$50,000-$99,999 75 9.2% 472 70.0%
$100,000-$149,999 178 21.9% 154 22.8%
$150,000-$199,999 207 25.5% 3 0.4%
$200,000-$299,999 174 21.4% 0 0.0%
$300,000-$499,999 28 3.4% 0 0.0%
$500,000-$999,999 0 0.0% 0 0.0%
$1,000,000+ 0 0.0% 0 0.0%
With Mortgage 506 62.3% 364 54.0%
Without Mortgage 306 37.7% 310 46.0%
Ren
ter-
Occ
upie
d
Total Units 528 - 418 -
<$200 10 1.9% 78 18.7%
$200-$299 117 22.2% 57 13.6%
$300-$499 73 13.8% 88 21.1%
$500-$749 81 15.3% 139 33.3%
$750-$999 99 18.8% 35 18.4%
$1,000-$1,499 148 28.0% 0 0.0%
$1,500+ 0 0.0% 0 0.0%
Harrington offers a variety of architectural features and character in single-family homes throughout its neighborhoods and a number of multi-family housing units available for rental options, including state-assisted housing. Both single- and multi-family housing options are available within the Downtown.
In Harrington, the greatest segment of the housing stock (28%) was built from 1990 to 1999. As of the
2010 Census, the majority of homes in the City are between 11 and 20 years old. Homes built before 1940 (75 years old or older) make up about 20% of the housing stock. Houses built between the 1940s and 1960s account for another 20% of the housing stock. About 15% of the housing stock was built in the 1970s and 1980s.
Employment
The 2009-2013 American Community Survey estimates indicated there were 1,830 residents in Harrington that were in the labor force (16 years and over and employable). Out of those residents in the civilian labor force, there were a total of 331 residents that were unemployed. The City’s unemployment rate was 18%. This rate is three times the County’s and two times the State’s unemployment rates, at 6.1% and 8.9%, respectively.
Workers were employed in the following occupations: management, business, science, and arts occupations (28.6%); sales and office occupations (23.1%); service occupations (22.0%); natural resources, construction, and maintenance occupations (13.2%); and production, transportation, and material moving occupations (13.2%). Based on comparisons to the State, Harrington’s residents have relative specializations in the community and social services, health technologists and technicians, and healthcare support occupations, meaning that residents have more of these occupations than the State average. The top ten industries represented by City residents include those listed in Table 2.
Table 2. Industries Represented by City ResidentsIndustry %
Educational Services, Health Care & Social Assistance
24.7%
Retail Trade 17.8%
Arts, Entertainment & Recreation, Accommodation & Food Services
11.6%
Manufacturing 10.6%
Public Administration 10.4%
Other Services, except Public Administration 8.0%
Construction 7.8%
Transportation & Warehousing, Utilities 3.0%
Wholesale Trade 2.6%
Information 1.6%
Downtown Development District PlanChapter 2. The Data

Page | 30 Final Plan
Land Use & Zoning
Land Use
There is a well-balanced mix of commercial, residential, and institutional land uses within the Downtown. The most prevalent land uses in terms of land area are commercial and residential uses. Commercial uses total 6.4 acres, making up almost a quarter of the Downtown, excluding right-of-way. Single-family residential land totals 5.7 acres and 22% of the Downtown. Mixed-use, which contains both non-residential and residential uses, comprises 4.4 acres of land and 17% of the total area. Institutional land uses such as government, religious, and civic uses total 4.1 acres and 16%. There are 12 vacant parcels totaling 2.1 acres and 8% of the Downtown. These parcels are entirely vacant and do not contain a building, whether occupied or unoccupied. There are six multi-family residential lots on 1.2 acres and 4% of the total land area. Two acres, or 7%, of the land in the Downtown are used for the railroad. There is one park, Freedom Park, on a site of slightly more than 1/8th of an acre that comprises 0.5% of the Downtown’s total area. See Map 3. Existing Land Use and Table 3. Existing Land Use for the distribution of each land use type within the Downtown’s boundaries. Please note that the figures in the table below do not exactly match the figures in this paragraph as the table accounts for the acreage within the right-of-way.
Table 3. Existing Land Use, 2016
Land UseNo.
ParcelsNo.
Acres% of
Downtown
Right-of-Way n/a 6.3 19.3%
Commercial 22 6.2 19.0%
Single-Family Residential
26 5.7 17.4%
Mixed Use 16 4.3 13.1%
Institutional 22 4.1 12.5%
Railroad 2 2.0 6.1%
Vacant 11 1.9 5.8%
Multi-Family Residential
5 1.2 3.7%
Park/Open Space 5* 1.0 3.1%
109* 32.7 100%*Note: Freedom Park and the Police Department share a parcel and are
counted twice in the Parcel column.
Although the uses are generally dispersed throughout the Downtown, there is an evident clustering of uses. There is a concentration of institutional uses near Mechanic Street, between Dorman Street and Railroad Avenue. The majority of the single-family homes are grouped west of Dorman Street as well as on the south side of Clark Street, between Ward Street and the former Spartan Station. Commerce Street, from Railroad Avenue to Dorman Street, exemplifies traditional ‘Main Street’ character as it contains a variety of neighborhood-scale commercial retail uses, such as antiques, a general store, and a combined florist and bakery. It also includes service-oriented uses such as a post office, banks, and City Hall, as well as mixed-use buildings with apartments on the second floor.
The City wishes to create a more vibrant live-work-play community with a mix of residential, retail, service, and entertainment uses. A major challenge and opportunity for the Downtown is to evolve with the right mix of uses that would promote day and night economic activity, as well as year-round activity. The Downtown would benefit from more daily amenities such as groceries, nighttime restaurants, a movie or play theater, and housing options for all age and income groups. Retail, entertainment, and lodging uses in the City could dovetail and capitalize on the abundant commercial and entertainment attractions and events outside of the Downtown, such as the Harrington Casino and Raceway and the Delaware State Fair.
Additional retail, office, and entertainment uses in the Downtown would offer more job opportunities for residents. As Harrington would also like to increase and diversify its resident population that works within City limits, apartments above retail or offices in the Downtown would offer even more housing options that could appeal to a broader range of ages and income groups.
Zoning
The Downtown is located in the central area of the City where moderate and high-density mixed-use development patterns are established and desired and where building reuse and infill to create higher densities is encouraged. The C-2 Central Commercial Zone advances a centrally located mixed-use area, as
Downtown Development District PlanChapter 2. The Data

Page | 31 Final Plan
it encourages the establishment and continuation of small commercial retail, professional business, arts and culture, restaurant, and entertainment uses in conjunction with supportive residential uses. The C-2 Zone consists of 95 parcels on 21 acres, making up the majority (80%) of the Downtown, excluding rights-of-way.
The C-2 Zone gives developers flexibility in design, while maintaining and enhancing the character of the City. The design and development standards focus on creating a pedestrian-oriented traditional downtown through form-based site and building design and placemaking standards. It permits a wide range of uses that help create an environment where most daily needs can be met. The C-2 Zone also allows small lot sizes and minimal front and side yard setbacks, which allow buildings closer to each other and to the street and sidewalk that create a more compact, pedestrian-scale environment. The streetscape standards require street trees, lights, and sidewalks and the architectural standards aim to create a sense of place and promote sidewalks and storefronts as public spaces.
The Downtown also includes the C-3 Service Commercial Zone, which consists of twelve parcels on over 4 acres, making up 17% of the District. There are two groupings of C-3 zoned parcels: on the north side of Clark Street between Delaware Street and the Volunteer Fire Department site entrance and at the southern end of the Downtown boundary between O Alley and the Norfolk Southern Railroad. The intent of the C-3 Zone is to provide for highway-oriented retail and automotive and heavier service-type business activities, which ordinarily require main-highway locations and cater to transient as well as to local customers. The C-3 Zone permits all of the uses in the C-2 Zone, as well as drive-through facilities, motor vehicle services, sales and repair shops, supermarkets, shopping centers, storage and warehouses, funeral homes, commercial greenhouses, and agricultural supply stores. The lot area, yard, and dimension requirements, as well as parking and sign standards, are more typical of a suburban commercial highway environment than a traditional, walkable downtown.
Table 4. Zoning, 2016
ZoningParcels Acres
No. No. %
C-2 Central Commercial 95 21.0 80%
C-3 Service Commercial 12 4.4 17%
R-1 Single Family Res. 1 0.9 3%
108 26.3 100%**The remaining 6.4 acres and 20% of the Downtown is comprised of right-of-way.
Economic Development
The City desires to continue to stimulate development in the Downtown and build off these recent successes. The City supports additional infill development on vacant parcels for mixed uses, as well as the adaptive reuse of existing structures. While the majority of the empty structures are older and may not be up to current building code regulations, they still hold great development potential. The City should continue to assist in the regulatory process with these issues to improve existing businesses, attract new businesses, and facilitate infill development.
In 2007, the City authorized the City Planning Consultant to review the current development application procedures and create methods to streamline and clarify the process. A two tier review process was presented and adopted by the City Council that created a Category A Site Plan Review and a Category B Administrative Plan Review. This tier system allowed specific development applications to be completed without any public meeting, if the project was Code compliant. These procedures can be found in the City of Harrington Code, Chapter 440-287, Uses Requiring Site Plans. The resulting process was less expensive in terms of time and cost. This process has been very successful and encourages redevelopment through onsite guidance and building improvements, and is believed to have initiated a downtown resurgence.
This section has been broken down into three Economic Development sections to assist in identifying the importance of each area: existing structure redevelopment, vacant land development, and priority redevelopment areas.
Downtown Development District PlanChapter 2. The Data

Page | 32 Final Plan
Existing Structure RedevelopmentThe City previously had several vacant buildings prior to 2007. Since then, many of those have been occupied with new businesses. Vacant buildings with storefronts can contribute to increasing the curb appeal by providing seasonal window displays as well as promoting upcoming citywide events. This will allow pedestrian traffic an opportunity to view the storefront information and perhaps entice a potential stakeholder to occupy the vacant building.
There were several redevelopment projects where current property and business owners have made improvements to existing buildings. These improvements included exterior renovations and signage upgrades, among other things. The successful recent redevelopment projects that have been completed in the Downtown include:
Downtown Development District PlanChapter 2. The Data
The Harrington Florist & Cakery, before (left) and after (right), with a new facade. Changes include new
signage, paint, and awnings.
A once vacant lot in a prominent Downtown location (left) is now used as the local Farmers’ Market (right).
The site has been updated with landscaping and signage appropriate
for the use.
A vacant, boarded up building (left), became Downtown Junction (right).
The building was painted with contrasting colors and received new signage. Due to the interior set-up, side and rear window displays were not feasible, so the owner decided to
fill these spaces with historical photos of Downtown Harrington, received from the Delaware Public Archives.

Page | 33 Final Plan
Downtown Development District PlanChapter 2. The Data
Once known as Spartan Station, a mostly-vacant strip mall (left),
this space has been occupied by Connections Community Support Programs (right), an organization
that provides care to those suffering from substance abuse issues.
Harrington’s City Hall, located at 106 Dorman Street, has recently
undergone renovations, both to its interior and its exterior.
OMG Collage, before (left) and after (right), with an updated facade.
Changed include updated paint and new signage.
The Calloway Building recently received a facelift (right) consisting of paint, new awnings, and new signage.
This building is currently occupied by The Clutter Box, Happy Tails Dog
Grooming, and Anchors Aweigh, a new restaurant to be opening spring
2016.

Page | 34 Final Plan
Downtown Development District PlanChapter 2. The Data
Power in Praise Ministries, a church located at 14 Clark
Street, was once a building that
sat vacant in the Downtown’s gateway for a period of many
years.
Many of the stores and nonprofits Downtown have updated their signage recently. The signage adds to the visual appeal of both the business/organization and the Downtown.
Two new businesses have recently occupied existing vacant structures
in the Downtown: Anchors Aweigh (left) and
Blue Hen Construction (right).

Page | 35 Final Plan
Downtown Development District PlanChapter 2. The Data
Most recently, two vacant structures were redeveloped and the tenants are now open for business. Both business owners are very friendly, eager to expand the business, and will be an asset to the commnity. These businesses provide additional services to the Downtown area and are listed below:
• Anchors Aweigh is a full service carry out or sit down restaurant located at 29 commerce Street. Harry Marker, a Navy Veteran, is the owner and has over 25 years of experience in the restaurant business. He found the new location while reading The Guide and thought the Downtown location to be ideal. He is known for his cheesesteaks, Italian subs, and large breakfast sandwiches. Mr. Marker would like to support the church community on Sundays and is looking forward to moving his BBQ and smoker outside on the patio during the warm weather. They are open Tuesday-Sunday for breakfast and lunch.
• Blue Hen Construction provides services for residential and light commercial construction, located at 1 Dorman Street. Darrin and Laura Simpson are the owners and started the business in 2007. Mr. Simpson is a Lake Forest graduate and a Harrington native, never living more than 5 miles away from his hometown. They have designed and built several single-family homes throughout Delaware, including within Harrington. Mr. and Mrs. Simpson wanted an office centrally located and saw an opportunity to be in Downtown Harrington.
In addition to the completed redevelopment projects listed above, a large multi-use structure known as “Stones Tavern & Package” is under renovation with a new owner. This structure has remained vacant since fire damages in February 2015. The new owner intends to keep the Stone’s name and reopen a sports bar and grill to include a package store.
These improvements clearly show a strong private investment and interest in the Downtown, as shown on Map 5. Downtown Redevelopment.
Vacant Land DevelopmentThe City prefers vacant land to be developed to stimulate the Downtown growth; however, this land can also be utilized in many other ways. Vacant lots can be developed as a gateway, sitting area, courtyard, event location, or be kept as green open space. This promotes visual curb appeal rather than an underdeveloped vacant lot with no sense of belonging or contribution to the vitality of the Downtown.
As shown on Map 6. Priority Redevelopment Projects, there are 27 parcels totaling just over 5 acres that are classified as vacant or underutilized property. These parcels offer opportunities for compatible infill development. Nine of these parcels currently contain a building, which are either vacant or the yard area is large enough to be subdivided and developed under the current Zoning Regulations. There are seven parcels with vacant buildings. Two properties are currently used as open space with amenities, but are classified as infill potential as they are privately owned. Potential infill could include additional park amenities or improvements.
Priority Redevelopment AreasIt is a priority for Harrington to reduce the number of vacant structures as well as vacant lots. The curb appeal and occupancy rate plays a vital role in sustaining the Downtown as an economic development engine for the City.
The City strives to ensure all structures are being maintained in a safe, Code compliant manner.
On the corner of Clark Street and East Street, the City took possess of an unsafe structure, known as the “Old Mission”. Based on the condition of the structure as
well as health and safety concerns, the City demolished the structure and graded the lot. This location is identified as one of the Downtown gateways and the property is
currently for sale.

Page | 36 Final Plan
Downtown Development District PlanChapter 2. The Data
Harrington took possession of a structure, known as the “Old Mission” property located on the corner of Clark and East Streets. This structure was not maintained or safe for occupancy; therefore, the City demolished the structure and graded the site. This property is now being offered for sale.
Another structure that lacks property maintenance and Code compliance is located on the west side of Commerce Street next to the WSFS Bank. It has been condemned by the City and is awaiting advertisement of demolition.
There are some highly visible and notable vacant lots at prominent locations in the Downtown. These vacant lands are considered to be an asset as they offer prime opportunities for infill development that fit within the context of the Downtown vision and goals. For this reason, these lots are identified as priority redevelopment areas located on Map 6. Priority Redevelopment Projects.
These areas have been defined as priorities for redevelopment based on existing infrastructure, walkability, key locations with high visibility, and needed curb appeal improvements. The priority for redevelopment areas ranks the vacant structures first and foremost, followed by vacant lots as stated below:
1. Vacant Structures
North end of the Connections Complex located on the corner of Clark Street & Reed Street, formerly Kottage Kafe.
Clark Street two-story vacant building next to Bowers Group, formerly an antique retail store.
Single-family two story residential structure located at 19 Dorman Street.
2. Vacant Lots
Gateway parcels located on south side of Clark Street and east side of East Street.
Gateway parcels located on the east side of Delaware Avenue.
Parcel located on Commerce Street.
Parcel located on Hanley Street.
Natural & Cultural Resources
Floodplains
Special flood hazard areas, or the floodplain, are a graphic representation of the base flood on the Federal Emergency Management Agency’s (FEMA) Flood Insurance Rate Maps (FIRM). The base flood is the flood expected to have a 1% chance of being equaled or exceeded in any given year. In a 30-

Page | 37 Final Plan
year period (the standard length of a conventional residential mortgage), there is a 26% chance that a structure in the regulated floodplain will be flooded by a 1% chance flood, also known as the 100-year flood event. The City has adopted and enforces Floodplain Regulations, found in Chapter 212 of the City Code, and also participates in the National Flood Insurance Program.
The Downtown is in an area of minimal flood hazard, with no special flood hazard areas mapped as of the latest FIRM publication of July 7, 2014. Although there are no special flood hazard areas mapped as of the writing of this Plan, current FEMA Flood Insurance Rate Maps should be consulted prior to the purchase of real estate and development-related activities.
Wetlands
Wetlands are defined by wetland hydrology, hydric soils, and hydrophytic vegetation and are important to reduce or mitigate flooding impacts, maintain and improve water quality, and provide habitat for various plant and animal species. The United States Army Corps of Engineers (USACE) regulates tidal and nontidal wetlands under Section 404 provisions of the Federal Clean Water Act. The State more stringently regulates tidal and some nontidal wetlands (e.g., perennial and intermittent streams/ditches and ponds containing a surface water connection to other wetlands) under the Subaqueous Lands Act (7 Del.C. Chapter 72) and the Regulations Governing the Use of Subaqueous Lands.
There are no mapped wetlands located within the Downtown’s boundaries. Although there are no wetlands mapped within the Downtown as of the writing of this Plan, it is always important to consult reputable sources to verify this information prior to the purchase of real estate or any development-related activities.
Sourcewater Protection
Approximately 27% of the Downtown lies within the City’s Excellent Recharge Area, designated by the State’s Department of Natural Resources and
Environmental Control (DNREC). A portion of the southernmost parcel in the Downtown also contains Wellhead Protection Area. The areas affected can be seen on Map 7. Environmental Features. Harrington adopted a Source Water Protection Ordinance, Chapter 350 of the City Code, in 2008 in order to meet requirements of the State Source Water Protection Act of 2001. The purpose of Harrington’s Source Water Protection Ordinance is to ensure that land use activities are conducted in such a way as to minimize the impact on, and reduce the risk of contamination to, excellent groundwater recharge areas and wellhead protection areas, which are the source for public drinking water in the City.
Per the City’s Source Water Protection Ordinance, underground and aboveground storage tanks would be prohibited in these areas, as well as junk yards, scrap yards, salvage yards, mines and gravel pits; however, these latter uses are not ones that would be conducive to a traditional downtown environment regardless. New development in these areas is limited in the amount of gross impervious cover that is created; however, this threshold may be exceeded if stormwater is treated according to green technology best management practices to remove contaminants and if roof drains are discharged into underground recharge systems or onto permeable surfaces. This is not a complete list of requirements for development within Source Water Protection Areas and, thus, Chapter 350 of the City Code should be consulted accordingly.
Historic Preservation
The 2013 Comprehensive Land Use Plan entertained the notion of creating three historic districts, one of which could include a large portion of the Downtown. Although the City did not intend to impose historic preservation by ordinance under that Comprehensive Plan, the City Council noted its willingness to work with property owners or private groups to recognize properties that are of significance to the community, the State, and the Nation. If requested to assist private preservation efforts, the City will support property owners’ requests for federal funding for historic preservation or designation of the potential districts.
Downtown Development District PlanChapter 2. The Data

Page | 38 Final Plan
One potential district called out in the Comprehensive Plan, the largest of the three proposed in that Plan, could extend along Delaware Avenue and Railroad Avenue. Potential boundaries are described as North Street and Simmons Road on the north, Delaware Avenue on the east, Reese Avenue on the south, and West Street on the west. Areas of interest include Calvin, Dorman, and Commerce Streets. The area is representative of urbanization and early suburbanization from 1880 to 1940. The potential historic district retains its physical integrity as the density remains the same as when it was first built.
One property in Harrington is currently listed on the National Register of Historic Places, St. Stephen’s Protestant Episcopal Church, and can be found within the Downtown on Fleming Street. Today, the former church is now part of the Harrington Historical Society complex and is home to the Society’s library as well as many museum displays.
Many other symbols of Harrington’s history existing throughout the Downtown:
Physical, Public Realm & Walkability
Connectivity & Walkability
The City is located at the intersection of two major arterial roads - U.S. Route 13 and State Route 14. Route 13 connects commuters to Dover and Seaford and Route 14 to neighboring Milford. This location and proximity to major access routes provides convenient access to surrounding communities, which is a key asset and offers an opportunity for bringing additional people into the Downtown.
Harrington’s Downtown has not experienced major traffic problems, unlike other nearby towns, since the majority of the regional traffic travels on Route 13; however, it is important that the Downtown continues to attract a segment of highway travelers and not only local residents in order to remain prosperous. One problem the Downtown does experience is the local railroad stopping the flow of traffic daily as the train crosses the street and/or stops at the station. Map 8. Transportation shows the road, sidewalk, and bike route network within and surrounding the Downtown.
The Downtown has existing pedestrian-friendly
St. Stephens Protestant Episcopal Church. Source: Delaware Public Archives
St. Stephen’s Church, as it now looks, is used as part of the Harrington Historical Society complex. As of April 2016, it is the only property in the City of Harrington that is listed on the National Register of Historic Places.
A sign, located at the corner of Commerce Street, Mechanic
Street, Hanley Street, and Railroad Avenue, marks the location of historic “Clark’s
Corner”.
A sign, located at the Harrington Post Office, commemorates the “First Rural Free Delivery Route,” beginning in Delaware on October 3, 1898 with the establishment of a route originating in Harrington. Joseph G. Peckham was appointed to serve as carrier. The route was 17.25 miles long and approximately 600 families were served.
Downtown Development District PlanChapter 2. The Data

Page | 39 Final Plan
characteristics, such as being small and compact, having an extensive sidewalk network, and motorists generally having high visibility at intersections and pedestrian crossings. In addition, while not a traditional gridded street pattern, the Downtown’s streets were laid out at nearly 90- and 45-degree angles, making them fairly easy to navigate. The Downtown streets also connect very well to the adjacent residential neighborhoods with their abundant sidewalk network.
The largest block is approximately 500’ by 350’, making them easily traversable; however, the addition of crosswalks at intersections and/or mid-block crosswalks could be considered in more highly trafficked areas. One feature that does distract from the Downtown’s connectivity are two one-way streets, Dorman Street and Fleming Street. These are relatively narrow streets that do allow parallel parking, but are not wide enough to allow for two-way traffic. These streets do closely parallel one another and do not offer so much of an inconvenience to the Downtown as to be detrimental.Although the Downtown does exhibit positive connectivity and walkability in general, there is a lack of streetscape amenities (e.g., street trees, greenery, benches) that can contribute to the streets feeling wider and ultimately make pedestrians less comfortable.
Sidewalks & Biking
The City wishes to encourage foot traffic by making the streets more pedestrian-friendly, beautifying the public realm, and promoting public safety through street activity. The City has been advancing placemaking strategies that promote pedestrian activity and retaining and attracting neighborhood scale businesses. Examples of this include upgrading street lighting and crosswalk, sidewalk, and curbing improvements (information about these improvements can be found in Chapter One under Public Investments).
Curb bump-outs and on-street parking are effective traffic calming measures. A Downtown business has chosen to decorate this particular bump-out with a colorful display of furniture, further adding to the appeal of the adjacent store, while still maintaining a free-flowing pedestrian walkway.
The wide turning radius and “right turn keep moving” sign at the Downtown’s main intersection is designed for vehicles to maintain speed. The wide radius also creates a long pedestrian crossing. Intersections such as these can be confusing for visitors who are not familiar with the area.
Downtown sidewalk in a predominantly residential area in need of repair.
Downtown Development District PlanChapter 2. The Data

Page | 40 Final Plan
Downtown Development District PlanChapter 2. The Data
Map 8. Transportation displays the locations of sidewalks within and connecting to the Downtown. In general, the sidewalks in the Downtown are in good condition and are well-maintained. The 2013 Comprehensive Land Use Plan (discussed in Chapter One) includes the results of a sidewalk inventory and study prepared by the Dover/Kent County Metropolitan Planning Organization, which shows missing sidewalks and needed repairs, and makes recommendations for construction or improvement based on priority levels. The highest priorities were streets in the City that lacked a sidewalk on either side of the street and streets that were closer to the Downtown. There were no sidewalks in the Downtown that were categorized as a high priority. A mid-priority area existed on Hanley Street from Mispillion Street to Clark Street. The City received funding to reconstruct some of the sidewalks in the Downtown (information about these improvements can be found in Chapter One under Public Investments). The project enhanced the Downtown character as well as included Americans with Disabilities Act compliance.
The Transportation Map (Map 8) shows that the State of Delaware has identified Clark Street, Commerce Street, and West Street as bicycling routes; however, Clark Street is the only street that has been designated as having a “bikeway”. A bikeway, in these terms, means that the street includes shoulders and wide outside lanes, which may or may not be marked and signed as bike routes and, as such, cyclists should be alert for occasional turn lanes in these areas. Clark Street has not been marked and signed as a bike route within the City
of Harrington. As Figure 3 shows, Clark Street also experiences high traffic volume, with over 5,000 vehicles daily and so cyclists should take care when traveling on this roadway.
As the downtown provides a greater regional draw, it will be important to continue to maintain sidewalks and enhance traffic calming measures that offer cyclists and pedestrians comfort, safety, and convenience.
Figure 3. Bicycle Map
Sidewalk in a predominantly commercial area that has been improved as part of the Downtown Streetscape Improvement project.
Delaware Avenue, near the Downtown boundary. A “Share the Road” sign has good intentions; however, a designated bike lane or shared lane markings would be more beneficial. Delaware Avenue is a State-maintained and regulated roadway.
Source: Delaware Bicycle Maps, Delaware Bicycle Council

Page | 41 Final Plan
Downtown Development District PlanChapter 2. The Data
Bus Route
The DART Harrington-Dover Bus Route 117 currently runs Monday-Friday connecting the Delaware State Fairgrounds and Dover. There is one bus stop located within the Downtown at Delaware Avenue just north of Clark Street. There are two other bus stop locations within the City: Clark’s Corner and US 13 at Delaware State Fairgrounds. Current buses operate leaving Downtown Harrington to Dover from 5:38 a.m. until 8:37 p.m. at this location. Routes leave Dover and arrive at the Downtown location from 8:11 a.m. until 10:11 p.m. Route 117 stops can easily connect with other bus services to New Castle and Sussex County locations. The route and times should be verified before relying on this information to secure public transportation, as the bus route is subject to change. The U.S. Census indicates that the majority of Harrington residents commute using private vehicles rather than alternative forms of transportation.
Figure 4. DART Route 117
Railroad
A railroad operated by the Norfolk Southern Railroad divides the Downtown, impeding connectivity and limiting movement. There is only one crossing in the Downtown at Clark Street. Since it is difficult to obtain approval for new at-grade crossings of a main railroad line, any additional crossing, vehicular or pedestrian, will not be likely. While the railroad limits mobility in the Downtown, it is also a significant part of the City’s heritage. The Railroad Museum and the rail lands south of Clark Street offer a historical context and character to the Downtown. The 2013 Comprehensive Land Use Plan recommends improvements to the tracks in order to better blend in with the Downtown character. The Comprehensive Plan also states that the City strongly supports and encourages commuter rail service with a stop in Harrington.
The railroad station recently underwent exterior renovations, which improved the aesthetic quality of the building. As the building is located in the Downtown’s northern gateway, this renovation was a needed and appreciated improvement to the site; however, the City would still like to work with Norfolk Southern to devise a plan for improving the entire site.
Source: DART First State
A DART bus passing through the Downtown.
Harrington’s Downtown bus stop is located on Delaware Avenue. Its location is marked by the sign posted on the electric pole, shown on the right side of this photo.

Page | 42 Final Plan
Downtown Development District PlanChapter 2. The Data
The railroad station is located in the middle of the Downtown and is in need of improvements, specifically around the pedestrian areas to include Railroad Avenue and the Delaware Avenue gateway. These improvements could range from planter boxes, designated parking improvement areas, as well as green open areas. This area is currently looked upon more as a manufacturing and/or storage yard than a Downtown gateway, something the City is hoping to change.
Gateways & Streetscapes
It is a goal of the City to reinforce the Downtown’s identity with attractive gateways at its edges. Improved gateways are an important aspect of downtowns, as they help to define identity, signify
The Norfolk Railroad Station - before renovations (above) and after (below).
The Norfolk Southern Railroad runs north-south through the Downtown. While the railroad at times limits both vehicular and pedestrian/cyclist mobility in the Downtown, it also offers historical context and character to the District. In the first photo to the left, a train passes by the station. In the upper photo, a caboose sits outside of the Train Museum, located on Hanley Street, adjacent to the working rail line. In the lower photo, a railroad crossing sign and arm is located at the only crossing on Clark Street.

Page | 43 Final Plan
Downtown Development District PlanChapter 2. The Data
to travelers that they have entered an historic area, and instill a sense of place and civic pride. Potential strategic gateways for Harrington’s Downtown include Commerce Street, Clark Street, and Delaware Avenue.
Commerce Street GatewayThe intersection at Commerce Street and Mispillion Street offers a prominent gateway. Here, the City transitions from residential to non-residential uses, includes the architecturally prominent Trinity United Methodist Church, and is the location where ‘Main Street’ streetscape improvements begin such as crosswalks, curb ramps, and street lighting. An area of concern is the appearance of the other Downtown entrances.
Clark Street GatewayThe intersection of Clark Street and East Street also offers a prominent gateway. This gateway begins with a residential area, then transitions to vacant lots and a mix of residential and neighborhood uses such as the Connections complex.
Delaware Avenue GatewayTravelers entering the Downtown on Delaware Avenue and Clark Street first see vacant areas and an under-maintained railroad station with “no trespassing” signs. There is no sense of arrival into
a historic and revitalizing Downtown; however, just past the railroad, the well-maintained intersection at Commerce Street and the historic bank become an appealing focal point.
Downtown StreetscapesThe Downtown, particularly Commerce Street, has a distinct streetscape and architectural features that help create a unique identity and character, and that exemplify a traditional historic downtown. The key streetscape features in the Downtown include the historic brick strip in the sidewalks, pedestrian scale street lighting, red brick buildings, and other distinguishable architecture. Interesting signage, attractive window displays, and sidewalk furnishings placed by business owners also add character and charm. Buildings in the commercial core are generally built up to the sidewalk, anchor the intersection corners, and are within close proximity to one another. All of these factors contribute in defining the streetscape as a public realm and create a more interesting and pedestrian-friendly environment.

Page | 44 Final Plan
Downtown Development District PlanChapter 2. The Data
Further south on Commerce Street, between Dorman Street and the Downtown boundary at Mispillion Street, there are mixed-use and single-family residential homes that further add to the Downtown’s unique architecture and small town historic character, contributing to an attractive gateway.
Open Space
There are four open space and recreational areas totaling just under one acre and 3% of the total Downtown area: Freedom Park on Mechanic Street; privately owned lands on Commerce Street; the Farmers’ Market on Commerce Street; and a privately owned playground that was once part of a daycare located in Spartan Station at the corner of Mill Street and East Street. When available to the public, these amenities are key assets and opportunities as they offer residents and visitors a gathering space for community events and programs and another place to visit while in the Downtown.
Window displays, street furniture, and plantings help soften a building’s mass and bulk, and help to create a more inviting public streetscape.
Creative signage and detail adds visual appeal to an otherwise blank brick wall.
The McKnalt Carpenter & Baker Funeral Home, located on Commerce Street, reflects the traditional residential architecture found in the Downtown, which has been preserved and enhanced through adaptive reuse. This preservation and reuse helps to characterize the Downtown.
What could have been a large parking area is being used as a public space. This small shed is also the site of Santa’s House when he comes to visit Harrington’s Downtown each December. During other times of the year, it is used as a small picnic area adjacent to the Harrington Florist & Cakery.
The Downtown Harrington Farmers’ Market, located in a once-vacant lot on Commerce Street, is open on Saturdays May through September. The sign posted onsite will have opening and closing days listed, as well as times of operation.
Located on the corner of Fleming Street and Mechanic Street, Freedom Park was once a vacant lot filled with broken pieces of concrete and weeds, used as an overflow parking lot for the area. It is now used as a centrally located Downtown park that can provide a location for multiple community events.

Page | 45 Final Plan
Downtown Development District PlanChapter 2. The Data
Open Space
There are four open space and recreational areas totaling just under one acre and 3% of the total Downtown area: Freedom Park on Mechanic Street; privately owned lands on Commerce Street; the Farmers’ Market on Commerce Street; and a privately owned playground that was once part of a daycare located in Spartan Station at the corner of Mill Street and East Street. When available to the public, these amenities are key assets and opportunities as they offer residents and visitors a gathering space for community events and programs and another place to visit while in the Downtown.
The McKnalt Carpenter & Baker Funeral Home, located on Commerce Street, reflects the traditional residential architecture found in the Downtown, which has been preserved and enhanced through adaptive reuse. This preservation and reuse helps to characterize the Downtown.
What could have been a large parking area is being used as a public space. This small shed is also the site of Santa’s House when he comes to visit Harrington’s Downtown each December. During other times of the year, it is used as a small picnic area adjacent to the Harrington Florist & Cakery.
The Downtown Harrington Farmers’ Market, located in a once-vacant lot on Commerce Street, is open on Saturdays May through September. The sign posted onsite will have opening and closing days listed, as well as times of operation.
Located on the corner of Fleming Street and Mechanic Street, Freedom Park was once a vacant lot filled with broken pieces of concrete and weeds, used as an overflow parking lot for the area. It is now used as a centrally located Downtown park that can provide a location for multiple community events.
Parking
There are large expanses of parking covering a significant portion of the Downtown. The total parking area, including the driveways and driving aisles, is approximately 5 acres and comprises 15% of the total Downtown area.
Off-street parking for existing structures are provided for several parcels; however, many structures cover the majority of their associated lots and cannot meet the parking requirements. In addition, many of the streets in the Downtown have available on-street parking on at least one side. The majority of Downtown customers park in the two bank parking areas and walk to multiple locations; however, these lots are not designated as shared or
satellite parking areas. The parking supply appears to exceed demand, as there is often on-street and off-street parking spaces available during the day and night. In fact, most parking areas are predominantly vacant in the Downtown during daytime and evening hours unless an organized event is taking place.
Some parking areas in the Downtown are not improved with pavement, striping, or curbing. Some of these private, undesignated, and unimproved parking areas are along the public street, creating visual blight and use valuable land that could have higher and more beneficial uses. Since there does not appear to be an imminent issue with parking supply, there is an opportunity to redevelop the underutilized lots.
The City’s parking regulations require parking lots to be located behind or to the side of the primary structure, require connections from public sidewalks to parking lots, and in some cases require vehicular connections between adjacent lots. Commercial parking lots are also required to have screening, landscaping, and adequate circulation and dimensions. Non-residential uses are required to have one off-street parking space for a prescribed amount of building square footage. In order to eliminate the potential undue burden of complying with the parking requirements for property owners and developers, alternatives and credits are offered toward complying with the regulations. Since many private lots and on-street spaces are under capacity, there is an opportunity to allow off-site parking lots, on-street parking, and shared parking
While this is a privately-owned parking lot located between Commerce Street and Hanley Street, it is often underutilized.

Page | 46 Final Plan
Downtown Development District PlanChapter 2. The Data
arrangements to be counted toward the required amount of spaces. Property owners and prospective developers should be made aware of these parking alternatives and credits.
Map 9. Downtown Parking shows off-street parking lots, both private and public, that contain five or more spaces. This map clearly shows an abundance of off-street parking for customers and employees, some on parking areas that have not enforced private use only. It is necessary for dwelling units to provide off-street parking so the tenants and/or property owners can have guaranteed on-site parking.
The City is fortunate in the fact that they have areas that can be improved along Hanley Street and Railroad Avenue to provide on-street parking within the Downtown area and in close walking proximity to so many of the Downtown businesses. This is a high priority redevelopment area that could include Norfolk Southern Railroad as a partner. Improvements can be made in these areas for pedestrian connectivity, lighting, benches, walking tours, and on-street parking. The City Planning Consultant also recommended walking tour signs within these two areas demonstrating the railroad’s history within the City. It could be further designed where the benches, bike racks, and signs are in the form of a train or represent the train theme on the amenities. The installed light poles could include banners along the areas extending the railroad branding theme. This should be master planned in order to maximize the potential design and funding opportunities.
Economic & Market Analysis
Downtown Jobs
According to the U.S. Census Bureau’s Center for Economic Studies, there were 17 people living in the Downtown who held primary jobs in 2013. Sixty-five percent (65%) of these were aged 30 to 54. Downtown citizens held jobs in the industries listed in Table 5.
Table 5. Industries Represented by Downtown Residents
Industry %
Arts, Entertainment & Recreation 23.5%
Manufacturing 23.5%
Public Administration 17.6%
Retail Trade 11.8%
Agriculture, Forestry, Fishing & Hunting 5.9%
Educational Services 5.9%
Health Care & Social Assistance 5.9%
Transportation & Warehousing 5.9%

Page | 47 Final Plan
Downtown Development District PlanChapter 2. The Data
None of these residents actually worked within the Downtown, although 65% worked less than 10 miles from their home. Figure 5 shows the distance and direction residents travel to work. Table 6 accounts for the top locations where residents work. In contrast, 26 people held jobs in the Downtown who commuted from outside the area. 38.5% of these workers traveled less than 10 miles to arrive at their jobs. The same percentage traveled 10 to 24 miles to arrive. One person traveled more than 50 miles.
Figure 5. Downtown Resident Jobs by Distance & Direction, 2013
Table 6. Downtown Resident Top Job LocationsPlace %
Dover, DE 11.8%
Milford, DE 11.8%
Camden, DE 5.9%
Harrington, DE 5.9%
Highland Acres, DE 5.9%
Figure 6 shows the distance and direction workers travel to get to the Downtown for their job. Table 7 accounts for the top locations from where workers originate.
Figure 6. Downtown Workers’ Origins by Distance & Direction, 2013
Table 7. Downtown Workers’ Top Origin LocationsPlace %
Harrington, DE 11.5%
Dover, DE 3.8%
Laurel, DE 3.8%
Carneys Point, NJ 3.8%
As shown in Figure 7, there is an imbalance between the number of people who are employed within the Downtown who live outside the area and the number of people who live within the Downtown who work outside the area. This is important to be aware of for the Downtown to become a successful live-work-play community. Since this is indeed one of the goals, the City and its partners should aim to have a more balanced inflow/outflow count in the future - or at least try to capture some of the downtown employees in the Downtown.
Figure 7. Downtown Job Inflow/Outflow, 2013

Page | 48 Final Plan
Downtown Development District PlanChapter 2. The Data
SWOT Analysis
The SWOT analysis is a strategic balance sheet that includes lists of the Downtown’s strengths, weaknesses, opportunities, and threats. The purpose of outlining this information is to help the City understand the Downtown from an unbiased perspective. The benefits of a SWOT analysis are that it provides learning and knowledge critical to the Downtown’s vitality and prosperity. This information was gathered over the course of several Task Force meetings, the downtown survey, public outreach, and background research.
Items from the Downtown SWOT analysis can be found on the next page. This information was used to help create the goals, objectives, and strategies found in Chapter Four. The SWOT Analysis form shown below was a homework assignment for the Downtown Task Force, reviewed and updated at each Task Force meeting.
city ofharringtondelaware
DOWNTOWN DEVELOPMENT DISTRICT PLAN: SWOT ANALYSIS
OPPORTUNITIESSTRENGTHS WEAKNESSES
THREATS

Page | 49 Final Plan
Figure 8. SWOT Analysis
Strengths Weaknesses• ADA compliant sidewalks are required for all new residential
construction and development• 2013 Comprehensive Land Use Plan was adopted• Farmers’ Market has been in operation in the Downtown since the
summer of 2011• The Senior Center, located within the Downtown, provides healthy
meals, physical activity classes, transportation, health screenings, and educational/awareness programs
• Caring business owners and tenants• Seasonal window and sidewalk displays• Ongoing streetscape improvements• Neighborhood community presence• Ongoing curb appeal improvements• Freedom Park location• Central location• Low taxes• Truck bypass• Space availability• Rail system• Public utilities• DART bus stop location• Walkability• Public library nearby• Museums open to the public• Availability of parking• Emergency services (Police, EMS, Paramedics, Fire)• Easy planning process• Friendly City staff• Parks & Rec• Only railroad tower in Delaware• Great housing stock• Variety of businesses• “Main Street” program• Council desire to see City grow
• There is not a comprehensive Downtown bicycle and pedestrian plan in place
• Railroad tracks and station - improvements needed to blend with the Downtown character
• Lack of overall character and maintenance• Overall structure and curb appeal improvements lacking• Lack of signage for Downtown directory/map of merchants• Lack of signage for truck bypass• Signage needed to direct people to available parking• Lack of public involvement• Lack of employment• Lack of promotion• Lack of community events• Lack of stakeholder organizations• Lack of positivity - looking to the next person• Lack of unity - positive message• Communication - difficult to find information, especially if one does
not use social media/internet• Rental vs. homeownership rate• City Council divided on how and where City should grow• Aesthetics• Railroad Avenue appearance• Signage at Commerce & Clark Street intersection
Opportunities Threats• Harrington Healthy Community Partnership Team has been in place
since 2010• Farmers’ Market promotion and expansion• Neighborhood community presence• Central community event location• Ongoing streetscape improvements• Ongoing curb appeal improvements• Vacant buildings within the Downtown area could provide window
displays• Downtown business organization with local business officers and
oversight• Downtown merchant involvement for community events and
seasonal decorations• Ability to reroute traffic to truck bypass for Downtown events• Railroad/historic train• Provision of kiosk/map for Downtown information• Harrington’s history (e.g., 100th _____)• Expand business offerings• Learning from each other - making connections (stakeholder
outreach program)• Willing to work together to support Downtown advertisement• Aesthetic issues are easy to fix• Vacant buildings/storefronts do not have to look vacant• Design standards/accountability• “Good/Nice letters” --> City of Salisbury example• Beautification Committee• “Enterprise Club” --> mini Shark Tank• Need something to make people want to get out of their vehicle
• Vacant buildings within the Downtown area are not provided with ongoing maintenance
• Crumbling infrastructure• Future demand for infrastructure• Lack of unity• U.S. Route 13• Aesthetics can make some areas look scary
Downtown Development District PlanChapter 2. The Data


The Hubof Delaware
City of Harrington Property OwnersOrganizations
MerchantsResidents
It’s good to be in the Hub...
City of Harrington Downtown Development District Plan
Chapter Three.
Downtown Harrington -The Vision


Page | 53 Final Plan
In order for the Downtown Plan to properly create a vision for the future, research was conducted to see what the past held, learned the needs of the present, and created changes for the future. John F. Kennedy presented two great quotes that pertain to the visions of the Plan:
“CHANGE is the law of life and those who look only to the past or present are certain to miss the future.”
“Those who look only to the past or the present are certain to miss the future.”
As show below, older Harrington images were found thanks to the Delaware Public Archives, along with photos near the relevant location taken by KCI. They clearly show the path from past to the present.
Commerce Street and Clark Street intersection looking south.
Corner of Clark Street and Commerce Street - U.S. Post Office
Clark Street and Mechanic Street intersection - formerly the First National Bank, now Community Christian Church.
Downtown Development District PlanChapter 3. The Vision

Page | 54 Final Plan
Clark Street view looking north - Norfolk Southern Railroad Train Station
Corner of Commerce Street and West Mispillion Street - Trinity United Methodist
Church
Fleming Street - St. Stephen’s Protestant Church (recently
placed on the National Register of Historic Places)
Downtown Development District PlanChapter 3. The Vision

Page | 55 Final Plan
Corner of Clark Street and East Street - Formerly the Acme Super Market (above) and Spartan Station; now,
Connections Community Support Programs, Inc. (below)
Commerce Street and Dorman Street intersection. View looking north on Commerce Street.
Commerce Street looking north toward Downtown
Downtown Development District PlanChapter 3. The Vision

Page | 56 Final Plan
As seen on the map above, Harrington was and still is
“The Hub of Delaware”
Downtown Development District PlanChapter 3. The Vision

Page | 57 Final Plan
After almost a year of studying, planning, and gathering ideas and input from the community in the Downtown planning process, eight core visions emerged for Downtown Harrington:
One.Downtown is a place where people come to play, work, shop, and live – a vibrant and important community
gathering place.
Two.Downtown is safe and friendly for people of all ages, income levels, and cultures.
Three.Downtown is an economic engine for the City, promoting a diverse economic environment that supports local
entrepreneurial ventures.
Four.Downtown is a successful and desirable neighborhood with a variety of housing choices and a mix of uses.
Five.Downtown values its historic buildings and encourages compatible, high-quality new construction.
Six.Downtown’s streets safely accommodate many modes of travel: pedestrians, bicycles, automobiles, transit, and
freight.
Seven.Downtown’s streetscape is active and comfortable day and night, with pedestrian-scale lighting, landscaping,
seating, and other coordinated amenities that establish a distinct identity.
Eight.Downtown has thriving public events that are local and regional destinations.
Downtown Development District PlanChapter 3. The Vision


The Hubof Delaware
City of Harrington Property OwnersOrganizations
MerchantsResidents
It’s good to be in the Hub...
City of Harrington Downtown Development District Plan
Chapter Four.
Downtown Harrington -The Goals, Objectives & Strategies


Page | 61 Final Plan
This chapter lays out an integrated, holistic plan for improving the Downtown by addressing ten key issues. In many cases, these issues overlap - for example, the lack of activity in the Downtown is partially the result of the limited number of businesses. Similarly, many of the strategies proposed address more than one issue - for example, a strategy that generates additional activity in the Downtown may also involve youth and students as well as bringing potential customers for businesses.
The chapter is organized around the ten issues. Each topic is established around a broad goal - a statement of what the community wants to achieve in the long term with respect to the Downtown. The goals reflect the Vision for Downtown, found in Chapter Three. The chapter also sets out objectives related to each of the ten goals. These objectives are statements of what needs to be done for the community to move forward toward achieving the goal. For each objective, the chapter then sets out specific strategies - projects or activities - that contribute to accomplishing the stated objective.
This Plan describes many of the proposed actions in detail to ensure that various groups or organizations that may carry out the different strategies in the future understand the thinking that went into the Plan. This should enable them to carry out the intent of the Plan even if the actual strategy is modified to better reflect the situation when the strategy is implemented or to capitalize on new opportunities.
Goal No. 1Strengthen residential neighborhoods, with an emphasis on encouraging homeownership, rehabilitating older buildings, maintaining the existing character, and avoiding incompatible development.
Background | A strong and robust Downtown residential population is critical to the overall health and vitality of the area. Downtown residents provide a steady and consistent clientele for the retail, service, dining, and entertainment uses found Downtown and create around-the-clock vibrancy for the area.
Downtown is home to a dynamic population that spans a wide range of ages and incomes. Each segment of the population has a diverse set of housing needs and preferences that should be reflected in the types of housing provided. There are various types of housing
options that can meet a diverse Downtown housing market. General categories include upper floor rental units, apartment buildings, townhouses, live/work spaces, and single-family residences. These options typically involve re-using existing buildings as well as in-fill construction on vacant or underutilized properties.
Placing residents within close proximity to jobs and amenities increases street level activity and creates a vibrant environment throughout the Downtown. Public and private entities should work together to identify housing needs and preferences and foster partnerships to meet these needs.
ObjectiveImprove and expand the overall housing stock to provide for and attract both older and younger household populations, thereby supporting all household incomes in the Downtown.
StrategyContinually evaluate zoning and land use regulations to ensure policies allow for and encourage Downtown housing in the form of rehabilitation and preservation of existing buildings, infill development, and new construction.
StrategyActively monitor the condition of existing housing and enforce the City’s Property Maintenance Code.
StrategyCreate a clearinghouse, database, and/or promotional brochure of existing residential financing options and incentives.
Goal No. 2Create a Downtown where shops, banks, and other traditional businesses flourish alongside creative enterprises in a friendly, lively, and successful atmosphere.
Background | To achieve our vision of the Downtown, existing businesses need to be more successful and additional businesses that build on the Downtown’s strengths need to be attracted to the area. This will require a focused effort to attract new customers to
Downtown Development District PlanChapter 4. The Goals, Objectives & Strategies

Page | 62 Final Plan
Downtown and to promote Downtown as a desirable place to do business. The City must think in terms of marketing Downtown as well as its individual businesses to both consumers and to business people.
Downtown functions in a regional economy - it competes with other commercial centers for customers’ spending. It also competes with other locations to attract and retain businesses. As the regional economy has evolved over the last few decades, customers for downtown businesses have been siphoned off, first by big box retailers and then by new retail centers. For Downtown to prosper, it has to reestablish a niche in the larger regional economy. Downtown Harrington offers a unique set of opportunities including its small-town historic character, convenient access, and the availability of moderate cost space - successful revitalization must build on those opportunities.
ObjectiveIdentify and support an organization to lead and champion Downtown revitalization.
StrategyEstablish a formal Downtown Merchants’ Association within the City of Harrington to foster new development and redevelopment Downtown and to help implement the goals, objectives, and strategies identified in this Plan.
StrategyDevelop a comprehensive marketing and branding strategy for Downtown revitalization.
Downtown Harrington lacks a clear identity in the minds of the public. While the City has a logo - the Hub of Delaware - Downtown is simply downtown. A program should be undertaken to develop a “brand” for the Downtown that creates a clear identity for the area while reflecting the core values of the community. This “brand” should then be used in a comprehensive marketing program.
StrategyEstablish an ongoing program of retail promotions to encourage consumers to use Downtown businesses.
Businesses within Downtown Harrington
periodically conduct retail promotion activities to attract customers to Downtown and increase sales. An ongoing program of retail promotions should be undertaken including consideration of the following types of activities:• Develop targeted retail promotions aimed
at specific consumer groups such as Downtown workers or people who live in Downtown or other specific area
• Develop cluster cross-business referral discount programs where customers who make purchases at Downtown businesses receive discounts on other purchases made at participating businesses in the Downtown
• Assist local businesses to participate in existing internet discount coupon programs such as Living Social or Groupon
StrategyEstablish a system for connecting potential businesses with property owners.
ObjectiveImprove the economic vitality of existing Downtown businesses.
The economic vitality of Downtown is dependent on people spending money in Downtown businesses and on activities located there.
StrategyIncrease the awareness of Downtown businesses by creating an internet business directory and map.
To provide people with up-to-date information about what is available in the Downtown, a web-based business directory should be established and regularly updated. This directory should categorize businesses by the goods and services they provide. For each business, the site should provide information about the business, provide a link to a map showing the location of the business, and a link to the business’ website if they have one.
StrategySupport the Buy Local program.
Downtown Development District PlanChapter 4. Goals, Objectives & Strategies

Page | 63 Final Plan
Most Downtown businesses are, and likely will continue to be, locally-owned independent businesses. The State of Delaware has a Buy Local program. Downtown businesses and improvement activities should support the Buy Local program and encourage area residents and visitors to think about buying “locally” when they make purchases.
ObjectiveIncrease the number and diversity/variety of businesses and other uses in the Downtown.
As the Downtown has struggled in recent years, both the number and diversity of retail businesses and services has decreased. A key component of this Plan involves increasing the number and diversity of businesses in the Downtown.
StrategyUndertake a targeted business recruitment program.
Attracting new businesses and uses to the Downtown should be a shared responsibility. On one hand, the primary responsibility rests with the property owners who have space to rent or sell, but the Downtown Merchants’ Association and City can also play a role in identifying and recruiting potential tenants. Typically, business recruitment involves advertising and responding to inquiries. A proactive targeted business recruitment program should be undertaken to interest businesses and other organizations to move to Downtown. This program could include the following types of activities:• Develop recruiting materials and a welcome
packet that provide information about the current business mix, the market, space costs and availability, and the sources of assistance
• Develop a “How to Start a Business in Harrington Guide”
• Establish a group of “business ambassadors” consisting of Downtown business and property owners and others who are involved in Downtown who will agree to be involved in the actual recruiting process and meet with people who are interested in
Downtown• Identify potential targets - individuals,
businesses, or organizations - focusing on the following groups:• independent, locally-owned enterprises• businesses that are not located in
Harrington and might be potentially interested in relocating from another location
• businesses that are located outside of Harrington that may have the potential to open an additional location in Harrington
• home-based entrepreneurs/businesses in the Harrington area that may be ready to open a full-time business
• potential business owners who are interested in the Downtown
• Do background research about each identified target to learn about their business and space situation in preparation for an informed contact
• Personally contact each target to talk about Downtown Harrington, explain what it has to offer as a location, and provide targets with a welcome packet and other information about the community and Downtown
• Maintain ongoing contact with people who may be interested in Downtown in the future but who are not yet ready to make a space commitment
StrategyEstablish a system for connecting potential businesses with property owners.
A number of different people own buildings in Downtown and various people handle the rental of space in those buildings. When people are identified who have an interest in Downtown, making the connection to the property owners is a key step. A central listing of available space in Downtown should be created and maintained, and a system for connecting potential tenants with property owners established.
StrategyGradually add retail space that capitalizes on new, higher income residents and employees, as
Downtown Development District PlanChapter 4. Goals, Objectives & Strategies

Page | 64 Final Plan
their numbers increase.
StrategyEncourage the development of niche businesses.
There is an opportunity for Downtown businesses that provide shopping experiences and goods or services that are unique. Niche retail establishments that offer high quality products that are locally produced or have qualities that are “uniquely Harrington” can appeal to both tourists and the local community. Also, providing interesting, enjoyable, and unique shopping experiences can have great appeal.
StrategyEncourage sit down restaurants with outdoor seating areas.
The City should provide opportunities for outdoor dining and gathering spaces that promote active and lively streetscape environments. Appropriate sidewalk widths will have to be provided in order to accommodate small dining tables without restricting pedestrian flow. Revisions may be required to allow restaurants to operate outdoor dining within the public right-of-way. Temporary, low-level decorative barriers that also incorporate planter boxes should be used to separate dining from pedestrian through-traffic on the sidewalk.
StrategyEncourage personal service businesses to locate within the Downtown.
ObjectiveAttract new private and public investment.
StrategyEvaluate existing incentive programs and create additional incentive programs, as appropriate.
StrategyStrengthen the relationship with supportive economic development based organizations with extended resources to ensure the Downtown’s vacant structures and lots are
being marketed and occupied with investments.
ObjectiveEncourage and support businesses, nonprofits, government, and citizens working together to attain common goals and fully capitalize on the Downtown’s resources.
StrategyMarket the Downtown for customers and businesses, including joint marketing and promotions among businesses and special events.
StrategyAssist in marketing walkability and community events with local merchants.
StrategyEncourage businesses of similar types to standardize hours of operation to provide a more coordinated and cohesive Downtown and a more consistent and predictable environment for visitors and patrons.
StrategyFocus on enhancing the characteristics that set Downtown apart from other places in the City.
The U.S. Route 13 highway commercial corridor is more auto-oriented and occupied by businesses that need to attract and accommodate vehicle traffic. Downtown can also accommodate and attract vehicle traffic, but what makes it unique is that it is also a good place to get out of the car and walk around. Economic activity can be enhanced by improving pedestrian infrastructure and providing interesting experiences through public art, architecture, and urban design throughout the Downtown. Rather than view Downtown as being in competition with the highway commercial corridor, it should be seen as an opportunity to have complementary and unique commercial neighborhoods.
ObjectivePromote a balanced mix of service, restaurant, retail, public, and residential uses.
Downtown Development District PlanChapter 4. Goals, Objectives & Strategies

Page | 65 Final Plan
ObjectiveEncourage infill while preserving and strengthening the existing Downtown character.
Goal No. 3Preserve natural and cultural resources by encouraging the appropriate preservation and/or reuse of older buildings and sites and the protection of environmentally sensitive resources.
Background | The Downtown has an opportunity to become a leader in transitioning to a greener economy. This includes opportunities to increase the rate of recycling among Downtown residents and businesses as well as to reduce overall energy use. In its past, Downtown Harrington was a walkable community where people shopped Downtown and lived in the surrounding residential neighborhoods. Over the years, some of these things have changed; however, the Downtown has the potential to recapture more of a mixed-use character with employment, shopping, services, and housing all available in a compact area.
ObjectiveEncourage the appropriate reuse of older buildings, particularly including the rehabilitation of historically or architecturally significant buildings.
ObjectiveProtect the amounts and quality of groundwater and promote groundwater recharge.
Sustainability and best management practices (BMPs) should play a larger role in future development, redevelopment, and improvements to reduce stormwater runoff. The following are sustainable practices and applications that should be considered for future development, redevelopment and improvements in the Downtown.
StrategyInvestigate the use of permeable pavers and porous asphalt in new parking lot construction to reduce stormwater runoff, especially in designated Source Water Protection Areas.
StrategyEncourage the use of native plant material.
StrategyIncrease the urban tree canopy.
StrategyEncourage biodiversity.
StrategyUse bioswales, bioretention, and rain gardens in new development, parking lots, and the public right-of-way to reduce stormwater runoff.
ObjectiveEncourage the Downtown to be a model green community that fosters environmentally sound practices.
StrategyPromote recycling among Downtown businesses and residents.
An informational program should be conducted to inform property owners, businesses, and residents about the benefit of recycling and to encourage them to utilize the substation.
StrategyEncourage the Downtown to be a model for City recycling efforts by increasing the share of the wastes generated by Downtown businesses and residents that are recycled.
StrategyPromote programs to improve the energy efficiency of Downtown buildings and infrastructure.
The Sustainable Energy Utility (and other State agencies) offers a number of loan, grant, and technical assistance programs to assist both residential and non-residential property owners and businesses reduce their energy use. A program should be developed to make people in the Downtown aware of these programs and to help them participate in these programs. This could include making program information available, holding workshops, and providing one-on-one assistance.
Downtown Development District PlanChapter 4. Goals, Objectives & Strategies

Page | 66 Final Plan
Goal No. 4Improve the appearance of the Downtown’s public and private realm.
Background | The appearance of an area influences how people feel about it. If the area is attractive, clean, and well-maintained, it creates a positive, inviting feeling. Conversely, if the area is rundown and poorly maintained, it is a deterrent to people coming to the area. The basic infrastructure of Downtown Harrington (or the bones) is quite attractive. Commerce Street is lined with older buildings that in large measure have retained their basic character. The location of buildings at the back of the sidewalk is consistent, and reasonably intact, with a few exceptions. The City recently undertook streetscape improvements that upgraded portions of the Downtown with improved sidewalks and new ornamental street lighting. A number of storefronts have also been improved.
In spite of its “good bones” and prior improvement efforts, the appearance of the Downtown is not as inviting and welcoming as it could be. Both the public infrastructure and private buildings need to be “spruced up” to make the Downtown more attractive. While the historic character of buildings should be maintained and enhanced, Downtown should be “brightened up” with the addition of more color to buildings.
ObjectiveProvide and support streetscapes that foster a sense of place, civic pride, belonging, and accessibility for all members of the community.
StrategyEstablish a volunteer-based Downtown clean-up/beautification day and/or program.
StrategyCoordinate existing efforts to provide greenery and flowers in the Downtown.
Efforts should be made to regularly provide greenery and flowers throughout the Downtown. The use of planters and appropriate species of street trees should be investigated.
StrategyDevelop a public art program for Downtown
improvements.
Public art can enhance the Downtown environment and highlight a creative economy. The City should include public art in downtown improvement projects at appropriate locations. A focus of this program could be to tap into a local Harrington artist.
StrategyExtend streetscape improvements and street lighting throughout the Downtown.
StrategyContinue to support the improvements and events at Freedom Park.
StrategyIncrease property maintenance and zoning enforcement throughout the Downtown.
ObjectiveEnhance the visual appearance of the City-maintained buildings in the Downtown.
ObjectiveIntegrate the railroad station and tracks into the Downtown’s character.
ObjectiveSeek to extend the best features of existing development into newer development and promote compatible infill development into the Downtown. Promote new construction that extends the community’s character and promotes a pedestrian-friendly environment.
ObjectiveEnhance the visual appearance of privately-owned buildings within the Downtown.
StrategyWork with property owners to upgrade the appearance of buildings.
While most buildings in the Downtown are attractive, historic structures, the overall visual environment can be somewhat drab and uninviting. A number of tenants and property
Downtown Development District PlanChapter 4. Goals, Objectives & Strategies

Page | 67 Final Plan
owners have invested in their buildings and some have used bright colors or interesting signage as part of their improvement. A short term improvement program should be undertaken to work with property owners to clean and brighten-up buildings throughout the Downtown. This effort should include the following components:• A cooperative program should be
undertaken to help property owners clean up the exterior of their buildings by identifying areas where a coordinated effort might reduce the costs for individual owners. This might include power washing of buildings, window cleaning and repair, and similar activities that have significant mobilization or equipment costs that can be shared.
• A program or design project to encourage property owners to “brighten up” the facade of their buildings by painting doors, trim, or building accents with bright colors. One possibility would be to create a “Doors of Downtown” concept in which property owners and/or businesses are encouraged to paint their front door or the trim around the front door in a bright color. This could then be used as part of the marketing identity for Downtown.
StrategyWork with property owners/businesses to light up storefronts/store windows including spaces that are currently vacant.
Some Downtown businesses light their display windows in the evening while others do not. In addition, many of the storefronts of vacant spaces are unlit. This creates dark spots in the nighttime environment in the Downtown. A program should be developed to work with existing businesses and the owners of building spaces to install attractive displays in storefronts and to light them in the evening. This program could use high school students and other volunteers to develop and maintain the window displays for participating businesses and property owners. This program could also include seasonal window painting and seasonal activities.
Goal No. 5Proactively plan for improved infrastructure (e.g., structures, roads, utilities, pedestrian connectivity, routine maintenance).
Background | There is a set of core facilities that supports the Downtown including its streets, sidewalks, park, street lighting, traffic signals, water and sewer systems, telecommunication networks, power systems, and similar infrastructure. This infrastructure also includes public parking facilities both on street and in parking lots, facilities for pedestrians and bicyclists, and bus service. This group of infrastructure is additionally discussed under Goals No. 6 and 7. For Downtown to be an economically viable and attractive place, these basic systems must work, be well maintained, and be attractive.
StrategyImplement improvements such as bicycle racks, transit bus shelter, benches, planters, downtown directory, and common area outdoor sitting areas.
StrategyIdentify, prioritize, and correct accessibility barriers to sidewalks, curbs, pedestrian signals, and other pedestrian facilities.
StrategyInvestigate the provision of a broadband ring around the City or free WiFi services within the Downtown.
Making wireless access to the internet a universal service has the capacity to enhance City management and public safety, especially when used by City employees, police officers, and firefighters out in the field. It can also be viewed as a social service to visitors and tourists as well as residents who many not have access to private high-speed service. The most compelling benefit of offering free internet access Downtown is its ability to attract and improve economic development.
Downtown Development District PlanChapter 4. Goals, Objectives & Strategies

Page | 68 Final Plan
StrategyUse high efficiency lighting such as LEDs when street lighting and other lighting is replaced or upgraded.
The City should adopt a policy to use high efficiency lighting when feasible for street lighting and other outdoor and indoor lighting of public facilities. The City should also encourage private property owners and developers to consider the use of high efficiency lighting when new lighting is installed.
StrategyEnsure underground utilities are evaluated for replacement or repair when road reconstruction projects are being addressed.
All road restoration projects within the Downtown create an opportunity to evaluate existing conditions to ensure services are being provided without disruption to their maximum ability.
Goal No. 6Enhance the Downtown’s transportation and circulation system to connect and integrate amenities and destinations.
ObjectiveCreate an environment that promotes the use of alternative transportation including walking, biking, and transit to move around and come to the Downtown.
StrategyImprove traffic flow.
StrategyPromote the use of alternative transportation.
A program should be undertaken to promote the use of mass transit and other non-automobile forms of transportation to come to the Downtown. This might include programs to offer incentives to people who use the bus to come to Downtown, such as a Bus ‘n Buy program in which people who make a purchase in the Downtown are provided a voucher for a free
or discounted ride or special transit promotion days to encourage use of the bus system. These programs would need to be coordinated with DART to ensure their viability.
StrategyDevelop a bicycle and pedestrian plan.
StrategyImprove bicycle facilities and lanes.There are currently limited facilities for bicycles in the Downtown. As part of the program to improve pedestrian facilities, additional places for parking and locking bicycles should be installed. Although the State has designated Clark and Commerce Streets as part of the State’s regional bicycle route, they have also noted that these roads routinely experience traffic in excess of 5,000 vehicles daily. While Clark Street includes shoulders and wide outside lanes, Commerce Street does not. Consideration should be given to encouraging recreational cyclists to use alternative streets unless their destination is on a main street in the Downtown.
ObjectiveDevelop a comprehensive Downtown wayfinding system.
Wayfinding should be a coordinated effort with the goal of directing pedestrians, cyclists, and motorists by providing directions to popular destinations, events, and information relevant to the Downtown. The City should implement a coordinated wayfinding program that can better guide travelers to the Downtown and more effectively direct movement within and around Downtown.
StrategyPursue funding options to develop a comprehensive wayfinding program.
StrategyEstablish a high quality wayfinding program to better direct motorists to and from the Downtown from the surrounding community and the regional highway system. This entails the placement of signs along roadways well outside the boundaries of the Downtown.
Downtown Development District PlanChapter 4. Goals, Objectives & Strategies

Page | 69 Final Plan
Downtown Development District PlanChapter 4. Goals, Objectives & Strategies
StrategySupplement the proposed wayfinding program with printed maps and brochures, digital and audio tours, a freestanding kiosk(s), and/or website and apps to guide visitors throughout the Downtown.
Goal No. 7Provide a sufficient amount of parking within the Downtown and ensure its use is properly managed.
ObjectiveOptimize Downtown parking for all stakeholders and visitors.
StrategyConduct a comprehensive parking study to guide the Downtown parking program.
The City should conduct a comprehensive Downtown parking study to quantify and qualify existing parking assets, obtain detailed parking demand data by location, time period, and day of week, including event days, to quantify future parking need, refine potential public parking locations/feasibility, and evaluate cost implications of parking operations/management efficiencies. Railroad Avenue and Hanley Street are a priority redevelopment area located Downtown for improvements such as additional on-street parking, sidewalks, bicycle racks, and pedestrian amenities.
StrategyImprove bicycle parking facilities within the Downtown.
ObjectiveEnsure that there is adequate and appropriately located parking to meet the needs of residents, employees, and patrons.
StrategyImprove parking signage.
There is one public parking lot currently in the Downtown, but ample on-street parking; however, there are limited signs directing people to either the lot or on-street parking
areas. The lot is not clearly marked to designate it as public parking. The City should undertake a program to install signs directing people to the public parking lot at City Hall and other public parking areas as may be available in the future, and clearly designate which spaces are for public use in those lots where there are also reserved spaces.
Goal No. 8Create a Downtown that is alive night and day with
events and activities.
Background | Events and activities can attract visitors to Downtown Harrington, generating activity, creating a greater sense of community, showcasing the Downtown area, and reinforcing Downtown as a community focal point, and social and entertainment center. During the public outreach process, Harrington residents, employees, visitors, and business owners discussed numerous events and festivals they enjoyed, both past and present, including Heritage Day, the Strawberry Festival, and Concerts in the Park, among others. While not all of these events are active, they are well-known and many hope to see current ones continued and/or expanded, and past ones revived.
In addition, the simple request of “more events downtown” has been frequently heard throughout the process. Unfortunately, Downtown may currently lack sufficient space to host or expand regular large-scale events. By creating new spaces for improved community events, including new open space or utilizing parking areas or rights-of-way, the City can better position Downtown to become a stronger and more vibrant center for art and entertainment.
ObjectiveIncrease the number and diversity of cultural, entertainment, and recreational activities and events in the Downtown that attract a wide range of people to the Downtown.
StrategyContinue current activities and events designed to bring people to the Downtown, with a focus on increasing participation in these activities and expanding the potential for integrating business enhancement actions during events.

Page | 70 Final Plan
Downtown Development District PlanChapter 4. Goals, Objectives & Strategies
Many of the current activities and events are designed to bring people Downtown. In some cases, these are people who come for the specific events but are not regular customers of Downtown businesses. Current activities should be reviewed and new activities designed to include tie-ins with Downtown businesses such as retail promotions to convert event attendees into customers. This can include having concurrent activities involving the businesses during the events or activities, promotions that encourage event participants to return to shop at Downtown businesses such as discount coupons for future purchases, or information about what is available in Downtown in the way of goods and services. As part of this effort, a media and marketing plan should be developed to capitalize on events that are already occurring in the Downtown.
StrategyReview past and historical events and festivals that could be revived or incorporated with other events (e.g., Strawberry Festival, Harrington Healthy Community Day). Encourage new Downtown volunteers to get involved in the planning and organization of the events to ensure they are maximizing the amount of visitor business during the events.
StrategyContinue the Downtown Farmers’ Market.
Look at opportunities to partner with and take advantage of the state’s Buy Local and other Department of Agriculture programs to expand the existing Downtown Farmers’ Market.
StrategyDevelop and maintain a coordinated calendar of community events and activities with a focus on Downtown activities.
The City of Harrington maintains a calendar of community activities on its website, but it is not a complete list. An implementation item should be the development of a consolidated calendar of community events and activities. This should include a system to collect and disseminate information about all public and community
activities and events that occur in or involve Downtown Harrington.
Goal No. 9Create a Downtown where residents, workers,
visitors, and patrons feel safe both day and night.
Background | To achieve Harrington’s vision for the Downtown, visitors must feel safe when they think about coming to Downtown, business owners have to know that Downtown is safe - for their own business and for their customers, and residents have to be safe to live in Downtown. Creating an environment in which people feel safe in Downtown is absolutely essential to improving the area, to attracting new customers and businesses, and to making Downtown a desirable place to live. Unless Downtown is safe, and is also perceived to be safe, other efforts to improve the Downtown will struggle.
A perception of safety emerges from a variety of factors. There needs to be a visible police presence and involvement with the Downtown community to make people feel safe, as well as to deter inappropriate activity. But safety is not just about having more police. It also involves having more “eyes on the street” and more positive activity in the Downtown. It requires creating a cooperative environment in which property owners, business people, and residents work with the police and each other to address issues and concerns. It requires having more people in the Downtown - think about the difference in how you feel walking along an empty street versus one that is alive with people. It requires having a physical environment that feels safe - that is well lit and that is comfortable to be in. The following describes a program for increasing the perception, as well as the reality, of safety in the Downtown.
ObjectiveEnsure that the environment in the Downtown promotes a feeling of safety.
The physical environment contributes to a person’s perception of safety. A well-lit, clean, and nicely maintained space creates one perception while a dimly or unevenly lit space that is littered and poorly maintained conveys a different feeling. The Task Force meetings and downtown survey identified a number of concerns about the lighting and overall

Page | 71 Final Plan
Downtown Development District PlanChapter 4. Goals, Objectives & Strategies
physical environment in Downtown,
StrategyIncrease street level vitality by encouraging the active use of ground floor space in the Downtown core.
StrategyConduct a lighting inventory study of the Downtown to determine areas of poor lighting, especially for pedestrians.
StrategyImprove pedestrian facilities and street lighting.
ObjectiveEnsure that people feel safe in Downtown by minimizing activities that contribute to concerns about safety.
The behavior of a few people can greatly influence the overall perception of public safety in Downtown Harrington. This includes motorists speeding through the Downtown and patrons congregating on the sidewalk outside of businesses, potentially creating disturbances. The Police Department is working to reduce these behaviors but it requires an ongoing effort. The following actions are designed to reduce the amount of problems or anti-social behavior in the Downtown.
StrategySupport Police Department efforts to reduce anti-social behavior in the Downtown.
The efforts of the Police Department to reduce the incidence of anti-social behavior in Downtown should be endorsed and supported by the community-at-large and people should be encouraged to help the Department by helping to “make the case” against offending businesses and their patrons. This should include encouraging Downtown residents to report incidents of inappropriate behavior, to participate in public meetings, and to support directing police services and resources to these activities including budget hearings and similar events. Ongoing efforts should be made to locate and secure outside funding to support the Police Department’s work in these areas.
StrategyPublicize and enforce the State’s “Yield to Pedestrians in the Crosswalk” law.
The agency responsible for the jurisdiction of the street should regularly upgrade the marking of crosswalks in the Downtown and install clear “yield to pedestrian” signs and indicators. Several of the streets in the Downtown are maintained by the Delaware Department of Transportation. An informational campaign should be undertaken to inform the public and motorists to yield to pedestrians in a crosswalk.
ObjectiveEnhance community policing to increase citizen awareness of the police presence in the Downtown.
The Harrington Police Department plays a critical role in creating a safe downtown. The Department recognizes this and supports the concept of community policing. Many people are unaware of what the Department is doing to ensure that the Downtown is a safe place. The following actions are designed to increase the awareness of the Police Department’s ongoing community policing activities in the Downtown.
StrategyPublicize Police Department community policing activities in the Downtown.
An ongoing program should be undertaken in conjunction with the Police Department to make both Downtown interests and the greater community more aware of what the Department is doing to improve public safety in the Downtown and how people can assist them in this effort. This program will need to evolve over time, but should include articles in The Harrington Journal, City Chatter Newsletter, and Chief’s Corner about the activities of the Police Department, activities to make people aware of Downtown patrols and patrol officers, publicity for successful efforts to reduce problem behavior, and a mechanism to provide support for Police Department funding and activities that relate to the Downtown.

Page | 72 Final Plan
Downtown Development District PlanChapter 4. Goals, Objectives & Strategies
StrategyCreate a community event procedure to establish a clearinghouse to ensure an appropriate police presence at Downtown activities as well as any additional services such as trash, traffic control, public works, and City personnel.
A system should be established that informs the City and all departments of planned activities in the Downtown - even those not requiring event permits. This should provide the City with sufficient lead time to allow them to assess the need for a City service and to schedule additional coverage if appropriate. This system should function as the clearinghouse where various groups can notify and work with the City to ensure that an appropriate police presence is provided during special events and activities.
Goal No. 10Create an environment in which young people feel welcome in the Downtown and contribute to making it a friendly, lively, and successful atmosphere.
Background | Our youth are the future of Downtown. If they develop an interest in and a habit of doing things in the Downtown, this will pay long term dividends to the community. It is key that young people be involved in deciding how they can help and what roles they should play in both implementing this Downtown Plan and being involved in the City in general. This section looks at some possible approaches for involving them in the implementation process.
ObjectiveFoster more involvement by local school students and other young people in Downtown activities.
StrategyEstablish a City of Harrington student liaison position.
The City of Harrington should designate a person to act as a student liaison to work with young people and to involve them in Downtown revitalization activities.
StrategyAdd student representatives to existing
and future City committees, as appropriate, especially in regard to the Downtown.
Young people should have a seat at the table and participate in the decisions about the future of the Downtown and help determine how students can be involved in the implementation of the Downtown Plan. Student board member positions should be created and solicited. This effort should include a commitment to ensure that these student board members will be able to get to and from meetings.
StrategyConsider the creation of a program for Downtown businesses to mentor young adults and involve them as interns.
Involving high school students in Downtown businesses will increase their interest in the Downtown while allowing them to develop important job and life skills. A program should be established to place young people as “student interns” in Downtown businesses. This effort should include a commitment on the part of the businesses to provide the student with ongoing mentoring during the internship period.
StrategyInvolve students in projects to improve the Downtown.
The City of Harrington student liaison should work with student representatives to identify ways that young people can be involved in the implementation of the Downtown Plan and to help organize those activities.
ObjectiveExpand the range of businesses and activities in the Downtown that appeal to younger customers.
StrategyCreate a home base for teens.
Young people care about the future of their community and its Downtown. A recurring theme is that there is not much to attract young adults to Downtown and little for them to do if they do come to Downtown. Students and other

Page | 73 Final Plan
young people should be invited to participate in a program to plan and develop an appropriate “home base” for teens in Downtown. The nature and size of this facility will need to evolve during the planning process to ensure that it meets the needs of the City’s youth and is sustainable over the long term.
StrategyKeep youth informed about the Downtown.The City of Harrington’s student liaison should provide information about Downtown activities and programs to area schools as well as the Harrington Public Library for publication and dissemination among students. The liaison should also work with interested faculty and staff to ensure that students are kept involved in Downtown activities.
StrategyDevelop a directory of youth activities.
A number of groups and organizations conduct activities that involve young people and students. Typically each organization or program promotes its own activities. In conjunction with the coordinated calendar of community events and activities, a system should be put in place to establish a comprehensive directory and calendar of youth-oriented programs.
Downtown Development District PlanChapter 4. Goals, Objectives & Strategies


Page | 75 Final Plan
The following is a restatement of the ten goals developed for Downtown Harrington:
Goal No. 1Strengthen older residential neighborhoods, with an emphasis on encouraging homeownership, rehabilitating
older buildings, maintaining the existing character, and avoiding incompatible development.
Goal No. 2Create a Downtown where shops, banks, and other traditional businesses flourish alongside creative enterprises
in a friendly, lively, and successful atmosphere.
Goal No. 3Preserve natural and cultural resources by encouraging the appropriate preservation and/or reuse of older
buildings and sites and the protection of environmentally sensitive resources.
Goal No. 4Improve the appearance of the Downtown’s public and private realm.
Goal No. 5Proactively plan for improved infrastructure (e.g., structures, roads, utilities, pedestrian connectivity, routine
maintenance).
Goal No. 6Enhance the Downtown’s transportation and circulation system to connect and integrate amenities and
destinations.
Goal No. 7Provide a sufficient amount of parking within the Downtown and ensure its use is properly managed.
Goal No. 8Create a Downtown that is alive night and day with events and activities.
Goal No. 9Create a Downtown where residents, workers, visitors, and patrons feel safe both day and night.
Goal No. 10Create an environment in which young people feel welcome in the Downtown and contribute to making it a
friendly, lively, and successful atmosphere.
Downtown Development District PlanChapter 4. Goals, Objectives & Strategies


The Hubof Delaware
City of Harrington Property OwnersOrganizations
MerchantsResidents
It’s good to be in the Hub...
City of Harrington Downtown Development District Plan
Chapter Five.
Downtown Harrington -The Implementation


Page | 79 Final Plan
Key Priority Projects
While several private and public investments have been made Downtown, it is crucial moving forward that focus be given to a few key priority projects. Based on the SWOT analysis, downtown survey, development activity, and collected data, the priority projects were defined as the Railroad Area Improvements and Redevelopment Areas.
Railroad Area Improvements
Railroad area improvements would take place along Delaware Avenue and Railroad Avenue to Hanley Street. This area is located in the middle of the Downtown and is an opportunity to create a walking train tourism destination. Each street has different improvement needs within the area.
Delaware AvenueDelaware Avenue has been identified as a Downtown gateway from Delaware Avenue to Clark Street. The western side of the street accesses a rail storage yard as well as the Train Station and is predominantly a gravel surface with no landscaping or identified parking spaces. This area could easily be improved by adding landscaping components, marked parking spaces, and a buffer between the storage yard and Delaware Avenue. The eastern side of the street provides a mix of vacant lots between a few neighborhood businesses. This area could be improved by new structures being built on the vacant lots or landscaped green open spaces.
Railroad Avenue & Hanley StreetThe Railroad Avenue and Hanley Street location is a great opportunity for improvements to be designed in a master plan that would allow visitors to walk from the northern portion of Railroad Avenue past the Train Museum on Hanley Street. During this walking tour, visitors can read educational and historical signs regarding the railroad service to Harrington and the State of Delaware. The train theme could include the “Hub of Delaware” slogan, benches, safe pedestrian connectivity, low level lighting, trash receptacles, and bicycle racks. This design theme could be used throughout the project, ensuring train shapes are used in all of the design features. The master plan should include amenities, additional on-street parking, lighting, drainage,
sidewalks, as well as fence relocation.
The initial identified stakeholders could include Norfolk Southern Railroad, the Harrington Historical Society, Delaware Department of Transportation, Kent County Tourism, train enthusiast organizations, and the Delaware Economic Development Office Downtown Delaware Main Street Program, along with the Downtown stakeholders.
Redevelopment Areas
Redevelopment areas are identified as vacant structures and vacant lots located in the Downtown area. Some of them are further identified as a potential gateway. Map 6. Priority Redevelopment Projects, shows the two areas for redevelopment. These areas have been defined as priorities for redevelopment based on existing infrastructure, walkability, key locations with high visibility, and needed curb appeal improvements. The curb appeal and occupancy rate plays a vital role in sustaining the Downtown as an economic development engine for the City. Each type of redevelopment has different improvement needs within this area:
Vacant StructuresThe number of vacant structures have drastically fallen since 2007; however, those few that are currently vacant play a critical role when stakeholders are looking to invest in this area. It is important that filling existing structures be the first priority for the Downtown. Structures can remain vacant for several reasons such as rent being too high, selectivity with specific tenants, structure not being up to building code requirements, lack of investment to bring the property to the current market needs, difficulty in finding tenants, location, etc. To actively market the vacant structures and provide a presence Downtown, it is recommended that any vacant structure with windows provide seasonal displays and promote City events as well as post the property and owner contact information for potential occupancy. It is further recommended that the City work with all existing structures that have boarded windows to recommended window replacement or encourage the installation of older Downtown images such as those located on Downtown Junction’s exterior walls.
Downtown Development District PlanChapter 5. The Implementation

Page | 80 Final Plan
Vacant LotsThe Downtown area has quite a few vacant lots; however, several of them are very small in size and it would be difficult to meet all of the development requirements if they were to be developed separately. Some of the challenges to the small vacant lots, if required, include stormwater management, off-street parking, entrance and exit locations, trash services, fire lanes, and loading spaces. These vacant lots are strongly encouraged to provide landscaping and amenities while they remain undeveloped. The gateway parcels located along Delaware Avenue, Clark Street, and Commerce Street offer prime opportunities for infill development that fits within the context of the Downtown vision and goals.
Implementation
The implementation items are based on the downtown survey, collected data, existing conditions, Task Force member input, as well as City staff and City Planning Consulting input.
Upon Plan Adoption
State of Delaware Downtown Development District Designation Application | The City Planning Consultant will prepare the application and City Resolution based on the recently adopted Downtown Development District Plan. This application and supportive materials will be submitted no later than June 1, 2016, as required for this year’s application cycle.
Completion within One Month of Plan Adoption
City Website Page | The City will create a separate page for the Downtown Development District Plan and all information pertaining to the Downtown.
Private/Public Investment Tracking | The City Finance Clerk will be responsible for tracking all the private and public investments within the Downtown. This includes all permits, development applications, City improvement projects, as well as any additional City expenses for services.
City Vacant Lot & Structure Website | The City currently provides a map with detailed information
regarding each Commercial vacant lot and structure within the City limits. This will be expanded to include all vacant lots located within the City limits.
Downtown Revitalization Area Tax Incentive Program | The City will update Chapter 378 of its Code to match the Downtown boundaries shown on Map 1. Downtown Boundary, clarify the Program process, and ensure it is user friendly. All improvements to the exterior of existing commercial structures located in the Downtown area facing Commerce Street and/or Clark Street are eligible to apply for a partial exemption from the City’s real estate taxes.
Development and Redevelopment Incentives | The City will formalize the proposed incentives for Downtown and Citywide and present them to the City Council for consideration and approval. This can be used as a marketing tool to stimulate growth, which can be revisited annually during the budget process.
Completion within Three Months of Plan Adoption
Downtown Business Map | This map would feature all Downtown businesses along with the physical location, pictures, and business profile information. The City Planning Consultant will arrange specific days to meet, take photographs, and obtain the profile information. They will then create the informational map and have it posted to the City website that houses the Downtown page.
Downtown Marketing Brochure | The City Planning Consultant will create a Downtown brochure with pertinent marketing information and available resources for distribution and posting on the City’s website. The launch of the brochure and new planning tools will be sent to the County and State Economic Development agencies, local Chamber of Commerce, and tourism organizations as well as to real estate agencies.
City Community Event Calendar | The City will host, maintain, and update a Citywide community calendar with links and/or information to any event hosted in the area. It will be the responsibility of the organization to provide the information and notify the calendar contact person within the City
Downtown Development District PlanChapter 5. The Implementation

Page | 81 Final Plan
to update the calendar. A clear procedure will be developed prior to this service being provided live. This tool will assist everyone to schedule their event in advance and strive to avoid conflicts with other planned events.
Community Event Notification Procedure |Create an event procedure to ensure awareness of the event to include the need for any additional City services to be reviewed and approved by the City departments.
Railroad Area Improvements | Initial meeting with the City Manager, City Planning Consultant, and City Engineer to discuss the railroad area master plan and opportunities for project funding. The City Planning Consultant will prepare a rough conceptual aerial plan for discussion purposes, funding opportunities, and identify next steps in stakeholder outreach meetings.
Railroad Area Improvements | City Manager and City Consultant stakeholder meetings will be held with State agencies as well as Norfolk Southern Railroad to discuss the project partnership opportunities.
Completion within Six Months of Plan Adoption
Buy Local Program | The State of Delaware hosts a Buy Local Program and this branding can be used throughout the Downtown area and even citywide.
Downtown Merchants’ Organization | The City should coordinate and facilitate the first Downtown organizational meeting. All property owners, businesses, and identified Downtown stakeholders should be invited. The goal of the first meeting is to seek interest, discuss intent, define the City’s supportive role, leadership positions, and next steps to include a meeting date.
Completion within One Year of Plan Adoption
City Spring Clean Up | The City currently hosts a yearly clean-up program that allows Harrington residents the ability to remove large bulk items and bring them to the Public Works Yard. This program will be expanded to include a volunteer-
based Downtown or Citywide clean-up day during this week.
Downtown Annual Report | The Downtown Merchants’ Organization and the City should prepare an annual report regarding specific accomplishments, investment and incentive tracking, implementation status, membership, and path moving forward within the Downtown. This should be presented to City Council as well as pertinent State agencies on a regular annual basis.
Downtown Promotions & Event | The Downtown Merchants’ Association will create annual promotional events as well as participate in organized events located Downtown. This information will be promoted at a minimum on the City’s Downtown website. This will also provide an opportunity to discuss the business and window display initiatives.
Economic Development Organization | The City should coordinate and facilitate the first Citywide Economic Development Organization meeting. Large employers, identified stakeholders, and a variety of business owners, realtors, and tenants should be invited. The goal of the first meeting is to seek interest, discuss intent, define the City’s supportive role, leadership positions, and next steps to include a meeting date. Once the leadership has been established to include meeting formats, it is recommended additional advisory members be asked to assist from Kent County Economic Development Department and the State of Delaware Department of Economic Development.
Infrastructure Improvements | Identify improvement areas for items such as bicycle racks, Downtown information kiosk or structure, bus shelter, benches, outdoor sitting areas, lighting upgrades as well as new lighting, bicycle route designations, wayfinding signage, pedestrian linkage and ADA improvements, as well as opportunities for the removal of overhead wires.
Landscaping and Tree Plan | Identify the public and private areas for landscape and tree plantings as well as determine the most appropriate native species for the area. Further determine the associated time and maintenance costs.
Downtown Development District PlanChapter 5. The Implementation

Page | 82 Final Plan
Parking Pavement Alternatives | The City will investigate alternative paving methods such as permeable pavers, porous asphalt, etc. for parking areas located within the Downtown. A workshop with multiple vendors should be set up to determine options moving forward along with estimated costs and long term maintenance.
Parking Study | Research and prepare a parking study that focuses on off-street parking within the Downtown. This should include existing parking availability as well as areas for improvement such as along Railroad Avenue and Hanley Street. This should also include the wayfinding signage program.
Vacant Lot Improvements | The City will meet with the owners of the vacant lots to discuss improvement options and occupancy initiatives.
Youth Organization Involvement | Research the local youth organizations to include an understanding of their capabilities. Solicit involvement from the organizations and select a youth liaison to serve as part of the Merchants’ Association.
Completion within Three Years of Plan Adoption
Beautification Program | Identify existing structures and sites that are in need of curb appeal-type improvements. These can range from landscaping, paint, shutters, detrimental object removal, and power washing to name a few. The property owner from each identified site could be contacted by City Code Enforcement personnel to discuss the program as well as any incentives available for the improvements. The program would include recognition within the City newsletter, City website, certificate from the Mayor and Council, as well as a temporary sign on the property to be rotated for future winners. This program can be set up on a Ward-specific basis, Citywide, or Downtown specific.
Business Recruitment Program | The Downtown Merchants’ Association and the City Manager will develop a recruitment program. The City Manager will continue to work closely with the County and State Economic Development and Tourism agencies to actively promote and recruit new businesses.
Downtown Art Program | The Downtown Merchants’ Association will develop a Downtown public art program. A few ideas to being with may include local art organizations, sponsor a themed art contest, winners from the Delaware State Fair, etc. as these can be displayed in local business’ windows and special showing locations Downtown.
Marketing & Branding Strategy | The City and Downtown Merchants’ Association will create a comprehensive branding and marketing strategy for the Downtown.
Recycling | The City will promote all existing recycling programs and forward information for vendor recycling programs to all commercial, multi-family, and mixed-use businesses.
Sustainability Workshop | The City will host a free workshop with vendors to assist in the education of new sustainable initiatives and products. The public workshop will also provide information on potential funding opportunities. Examples of a few initiatives are recycling, solar, energy efficiency, etc.
WiFi Service | Investigate the opportunity to provide free WiFi services in the Downtown as this will attract customers and new businesses. Research the potential for a broadband ring that could also serve Harrington’s multiple emergency organizations.
Ongoing Implementation
Code Evaluation | The City will continue to evaluate zoning and land use regulations.
Communication with Key Agencies & Organizations | Continue ongoing communication and interaction with the State of Delaware Economic Development Office, Kent County Economic Partnership, and the Greater Kent Committee to ensure vacant structures and lots are marketed to attract new investments.
Funding Opportunities | The City will continue to research a variety of funding opportunities to support the Downtown Plan initiatives.
Downtown Development District PlanChapter 5. The Implementation
Page | 83 Final Plan
Organization of Downtown Events | Continue to support all events located Downtown as well as promote all events on a regional scale to optimize the number of visitors. Ensure each event has a Police presence where the level of involvement is determined by the Police Chief. Walking Police presence is encouraged in a small Downtown area where the officer can respond quickly to their respective vehicle, if needed.
Police Department Presence | Continue to increase the Police Department presence at all events as well as regular foot patrol Downtown.
Property Maintenance & Code Enforcement | Continue to increase property maintenance and zoning code enforcement.
Redevelopment & Development Promotion | The City will continue to work closely with the County and State Economic Development agencies, local Chamber of Commerce and Tourism organizations as well as the real estate agencies to actively promote and recruit new businesses to Harrington.
Political Will & Implementation Ability
The City has invested time and money in relation to the growth and development in Harrington. Development resources, updated Codes, and tools have been a priority within the City starting in 2006 when a City Planning Consultant was hired to assist in managing several critical projects. The list of adopted projects demonstrates the history of political will and the large amount of investment made in relation to development and redevelopment:
Downtown Revitalization Tax Incentive ProgramOn September 7, 2015, the City Council approved Ordinance 05-07 providing tax incentives for revitalization activities in the Downtown area.
Board of AdjustmentOn November 20, 2006, the City Council approved Ordinance 06-13 rewriting the Zoning Ordinance relating to the Board of Adjustment.
Planning CommissionOn January 16, 2007, the City Council approved Ordinance 07-01 rewriting the Zoning Ordinance
relating to the Planning Commission, Site Plans, and the Approval Process. This Ordinance created the two tier expedited review process throughout the City: Category A Site Plan and Category B (Administrative) Plan Review.
Zoning Ordinance - Commercial UsesOn April 2, 2007, the City Council approved Ordinance 07-02 amending the regulations applicable to the C-3 Service Commercial Zone by permitting uses allowed in the C-1 Neighborhood Commercial or the C-2 Central Commercial Zones to be located in the C-3 Service Commercial Zone.
Zoning Ordinance - Residential UsesOn April 16, 2007, the City Council approved Ordinance 07-04 amending the regulations applicable to permit any use permitted in the R-1 zoning district to be placed in the R-3 and R-4 districts.
Subdivision OrdinanceOn June 4, 2007, the City Council approved Ordinance 07-05 replacing the Land Subdivision Regulations of 2004 in its entirety.
Municipal FeesOn June 18, 2007, the City Council approved Ordinance 07-07 consolidating the City of Harrington fee charges for the various municipal services and located them in one Code section. Chapter 180, Municipal Fees was created and is used frequently for all City applications.
Zoning Ordinance - R-2 DistrictOn September 4, 2007, the City Council approved Ordinance 07-10 by eliminating the requirement that lots on which multi-family dwellings are placed remain under single ownership for the life of the building. This amendment will permit, for example, individual ownership of each side of a duplex.
Downtown Revitalization Tax Incentive ProgramOn April 7, 2008, the City Council approved Ordinance 08-01 to expand the area covered by the Downtown Revitalization Tax Incentive Program to include the area along Clark Street between East Street and southbound U.S. Route 13, to clarify the tax incentives are restricted to exterior improvements made to structures in commercial zones, and to cap the cumulative total of the tax exemptions at the total cost of the improvements.
Downtown Development District PlanChapter 5. The Implementation

Page | 84 Final Plan
Source Water Protection RegulationsOn August 4, 2008, the City Council approved Ordinance 08-03 adopting new Source Water Protection Regulations. The State of Delaware Source Water Protection Law of 2001 required the City to adopt regulations governing the use of land within wellhead protection and excellent groundwater recharge potential areas in order to protect these areas from activities and substances that may harm water quality and subtract from overall water quantity.
CodeCodificationOn December 15, 2008, the City Council approved Ordinance 08-07, which consolidated all approved and adopted Ordinances in the City of Harrington into “The Code of the City of Harrington” with Chapters and Sections. This allowed the entire Code to be placed in a catalog format and be made available online as a development resource and tool. The City Code is maintained and hosted by General Code.
City Zoning MapOn April 5, 2010, the City Council approved Ordinance 10-01 updating the “Zoning Map of the City of Harrington” by providing two exhibits that clearly indicate the zoning of the properties located within the City limits of Harrington. All City records were updated to reflect the correct zoning classification and are available on the City’s website.
Sidewalk and Curbing - New ConstructionOn November 7, 2011, the City Council approved Ordinance 11-07 requiring all new construction to include the installation of sidewalks and curbing on street frontages, on corner lots, and the side exposed to traffic. All corners will be handicap accessible. Sidewalk and curbing must be installed before a certificate of occupancy is issued. This Ordinance increases the pedestrian connectivity within the City limits.
Council District MapOn March 5, 2012, the City Council approved Ordinance 12-05 adopting a new district map that reflects the reapportioned districts that are nearly equal in population as shown by the most recent federal decennial census.
Comprehensive Land Use PlanOn December 16, 2013, the City Council approved Ordinance 13-04, adopting the new Harrington
Comprehensive Land Use Plan.
Chapter 440 Zoning RewriteOn July 20, 2015, the City Council approved Ordinance 15-06, which replaced Chapter 440 Zoning to revise the Zoning Code in its entirety. This project included the modification to the C-2 Central Commercial Zone, which is the predominant zoning classification for the Downtown.
Comprehensive RezoningOn July 20, 2015, the City Council approved Ordinance 15-07, which is a Comprehensive Rezoning to align property zoning to the Future Land Use Map adopted as part of the Comprehensive Land Use Plan. It also amends the Zoning Map for the City of Harrington to reflect the zoning changes.
Development ToolkitThe City Planning Consultant provided the City with a finalized Development Toolkit that included user-friendly guides for developers, engineers, and surveyors to use when completing development applications. These toolkits, created for concept, preliminary, final, and administrative site plans, as well as for zoning compliance certificate applications, include information on procedures, process flowcharts, and checklists for submittal requirements. The toolkits will help to ensure that the City receives all of the information required to review an application in the first submission, as well as ensures that applicants are fully aware of the application process and timeline.
Downtown Development District PlanOn May 9, 2016, the City Council approved Ordinance 16-06, which adopted a Downtown Development District Plan. The City Planning Consultant was asked to write an application for a Neighborhood Building Blocks Fund grant, which funded this Plan. The Plan’s goals are to improve commercial vitality, stimulate job growth, build a diverse array of businesses, help build a stable community of long-term residents, increase home ownership for all income levels, and reduce the amount of vacant housing. The Plan has brought together numerous planning efforts and documents, united stakeholders with a shared vision for the Downtown, and is the key document for the Downtown to articulate common goals and strategies, coordinate economic development efforts, identify priority development and redevelopment opportunities, and assist in marketing
Downtown Development District PlanChapter 5. The Implementation

Page | 85 Final Plan
and community events.
The intent behind this Plan is to ensure steps are taken to move the Downtown in the direction of being the City’s economic development engine to host several events by creating a sense of belonging and community pride. Harrington strives to become a successful place of interest for stakeholders, tourism, guests, new homebuyers relocating to the City, customers, and new businesses. For this to continue and increase additional awareness, the local Government leadership must continue to:
• always promote Harrington in a positive manner;• educate the Public on all City initiatives;• clarify rumors by obtaining and sharing factual
information;• lead by example;• promote the Citywide activities;• be actively involved in events; and • support the administration and planning and
engineering projects, initiatives, and funding applications.
City departments should participate in these events as they have two public facilities (City Hall and the Police Department) Downtown, as well. This Plan does not detract from the importance of other crucial areas within the City; however, this promotes a common event and activity location within the community while supporting local businesses within a safe walking distance. The political will and ability to implement the Plan is essential for the fate of Downtown for years to come as well as any potential funding opportunities in the future. This is a living document and should continually be looked upon frequently for implementation and guidance within the Downtown.
Downtown Coordination
During the Task Force meetings and research for the Downtown Plan, it was determined that all successful Downtown Districts in Delaware, as well as other states, have a strong merchant organization, as well as other supportive organizations. It was further found that the local government administration and leadership held a stakeholder member role in the organization, rather than a leadership position. The member positions within the merchant organization should be the City Manager or his/her designee as well as a member of City Council. The role would be supportive in nature and ensure that
event coordination, promotion, and communication remain a priority with the City.
The Task Force discussed forming a Merchants’ Association that would focus specifically on the Downtown as the needs are quite different from the commercial businesses located on the commercial corridor on U.S. Route 13. The organization could participate and promote the scheduled events in the Downtown and include newly formed events at Freedom Park as well as organize separate promotional events on a regular basis such as First Fridays, quarterly holiday events, frequent flyer programs, etc. The City should participate in these events as well as they have two public facilities (City Hall and the Police Department) Downtown. The Downtown stakeholders will need to come together and form the Merchants’ Association to promote their investment and create a vibrant Downtown community.
Downtown Branding Strategy
Branding is a tool that the City of Harrington can use to define the Downtown and develop a long-term vision for a place that is compelling to many residents and visitors. Ultimately, it can be used to influence and shape positive perceptions of a location, creating a foundation that helps make that place desirable as a destination for residents to call home, visitors to spend time, and businesses and investors to develop.
As a key implementation component of the Downtown Plan, initiating a successful Downtown branding strategy requires honest and thoughtful responses to the following questions:
• What does Downtown Harrington stand for today - what are its strengths and weaknesses?
• What can and should Downtown Harrington stand for in the future, and how do we articulate this?
• What will make Downtown Harrington unique, valued, and attractive to target businesses and consumer audiences?
• How will we make this new positioning become a reality?
• What role do key stakeholders and community groups have in bringing the Downtown Harrington brand to life?
• How will we measure the success of the branding strategy?
Downtown Development District PlanChapter 5. The Implementation

Page | 86 Final Plan
Although the Downtown Plan and process has provided answers and insight to some of these questions, there remains work to be done. Armed with the answers to all of these questions, the City of Harrington can work toward developing a brand for Downtown. While the process communities undertake to develop a unified brand for downtown may differ, the following steps are commonly considered:
• define clear objectives;• understand the target audience;• identify the current brand image;• set the aspirational brand identity;• develop the positioning; • create value propositions; and• execute the brand strategy.
Define Clear Objectives
Prior to beginning the process, the City should identify what the Downtown Harrington branding strategy is trying to achieve. What specific results is the City of Harrington seeking from the development of a brand strategy? Is the primary objective to attract and retain residents? Drive commerce? Attract visitors? Change current perceptions? The answers to these questions, and the priorities among them, help define the scope of the project, and the key activities that form the approach to the initiative.
While the Downtown Plan focuses on improvements and projects to be undertaken within the Downtown, it also provides an initial understanding of objectives the City and community share for the Downtown’s future. Reviewing community outreach and the Plan’s vision for Downtown will help provide a foundation for branding objectives that best respond to community needs and desires.
Understand the Target Users
Understanding all the Downtown users can be a difficult step in place branding, as it is tempting to put everyone into one group. Time should be taken to identify the types of people the City of Harrington wants to attract to the Downtown. These groups should be minimized in number, however, and prioritized based on importance to the objectives of the branding strategy. Focusing on a few, specific
audiences can uncover more detailed and specific insights rather than gathering a variety of general insights.
Identify the Current Brand Image
What image does Downtown Harrington give people today? Is it simply Commerce Street? Is it City Hall? The train station? Has this image of Downtown Harrington changed over time? This step in the process is designed to gain insight to the benefits and associations that residents, employees, business owners, and visitors have with the Downtown and to assess the gap between the current state and the desired state.
Community outreach conducted throughout the planning process helps to establish an understanding of the current Downtown identity. Understanding that identity, or lack of identity, helps to determine the steps necessary to mend that image.
Set the Aspirational Brand Identity
What image does Downtown Harrington want to give users? How does the City want the public to describe Downtown? An aspirational brand identity should be within reach and credible for the brand. It should craft the association you want residents, employees, business owners, and visitors to make when they think of Downtown Harrington.
Sometimes area branding is not about inventing something - it can be about discovering what is already there. The City of Harrington could examine the perceived strengths of the Downtown and build on these to create the aspirational brand identity. Whatever the result, the aspirational brand identity should influence future business and community decisions and should be an identity Downtown Harrington can sustain for a long period of time.
Develop the Positioning
What are the benefits that Downtown Harrington wants to own or offer in the minds of the public? Brand positioning is the means for transitioning the Downtown’s current brand image to the aspirational brand identity it desires. It is a promise or benefit
Downtown Development District PlanChapter 5. The Implementation

Page | 87 Final Plan
that Downtown Harrington wants to own in the minds of the user.
The aspirational brand identity and its associated positioning typically has a long horizon. Perceptions of the Downtown will not change overnight and could require significant changes over time to see the aspirational identity become a reality.
Create Value Propositions
What does the positioning mean for each user and what are the messages that should be communicated to influence their perceptions? Once defined, it is important to make the propositions actionable. The key is to take a critical look at Downtown Harrington’s characteristics and policies and to ensure that they are aligned to the aspirational brand identity.
Execute the Brand Strategy
In developing the Downtown Harrington branding and promotional plan, it is critical to identify every point at which a potential user may come into contact with the brand. Every interaction with the public is an opportunity to enhance or diminish the Downtown Harrington brand. These points of contact may vary widely in form, including the physical environment, street signage, advertising, brochures, websites, events, and interaction with residents. Much of the execution relies on improving these points of contact, to lend credibility to the new brand.
Consistency
This Downtown Development District Plan is consistent with the City of Harrington’s certified Comprehensive Land Use Plan in that it furthers a number of goals and objectives related to downtown redevelopment, economic development, and housing. The Comprehensive Plan identified a number of needs and goals that have been more specifically addressed in this Plan, and which have been assigned specific strategies with associated implementation timelines in order to ensure their successful completion.
The Downtown, as depicted in Map 1. Downtown Boundary,
is entirely within a Level 1 Investment Area as shown in the Strategies for State Policies and Spending. This is the highest priority area for State investment; therefore, the Downtown and Downtown Plan are consistent with the goals and objectives of the Strategies for State Policies and Spending.
Downtown Development District PlanChapter 5. The Implementation


The Hubof Delaware
City of Harrington Property OwnersOrganizations
MerchantsResidents
It’s good to be in the Hub...
City of Harrington Downtown Development District Plan
Chapter Six.
Downtown Harrington -The Incentives


Page | 91 Final Plan
Existing Incentives
Expedited Review Process | CitywideIn 2007, a two-tiered review process was presented and adopted by the City Council that created a Category A Site Plan Review and a Category B Administrative Plan Review. This tier system allowed specific development applications to be completed without any public meeting, if the project was Code compliant with an Administrative review process. These procedures can be found in the City of Harrington Code, Chapter 440-287, Uses Requiring Site Plans. If the requirements were followed as stated in the City Code, the process was faster and less expensive in terms of time and cost. This process has been very successful and encourages redevelopment through onsite guidance and building improvements and is believed to have initiated a Downtown resurgence.
Downtown Revitalization Area Tax Incentive Program | DowntownOn May 7, 2012, the City Council approved Ordinance 12-07 relating to the Downtown Revitalization Area Tax Incentive Program. All improvements to the exterior of existing commercial structures located in the downtown area facing Commerce Street and/or Clark Street are eligible to apply for a partial exemption from the City’s real estate taxes. See City Code Chapter 378 Downtown Revitalization Area Tax Incentive Program.
Sewer and Water Impact Fee Calculations | CitywideOn February 19, 2013, the City Council approved Ordinances 13-01 and 13-02 regarding the calculation of Equivalent Dwelling Units (EDUs) in relation to sewer and water impact fees. This revision was adopted based on Kent County Levy Court’s impact fee calculations.
Site Plan Extension | CitywideOn June 2, 2014, the City Council approved Ordinance 14-09, which extended the length of time for a site plan approval. The Planning Commission’s site plan approval shall become null and void unless a zoning compliance certificate has been issued for the proposed development within two years from the date of the Planning Commission approval. The Planning Commission may, for good cause, grant an extension of up to a total of eighteen months.
Reduced Fee Adoption | CitywideOn June 16, 2014, the City Council approved Ordinance
14-04, which adopted a new fee schedule, reducing the water impact fee from $2,000 to $1,170 and adjusting other municipal fees.
Water Usage Fee Reduction | CitywideOn September 16, 2014, the City Council approved Ordinance 14-14 to reduce the water usage fees. This ordinance reduced the water rate for in-City users from $3.55/1,000 gallons of usage to $3.25/1,000 gallons of usage and for out-of-City users from $4.72/1,000 gallons of usage to $4.32/1,000 gallons of usage.
First-Time Home Buyer Realty Transfer Tax Exemption | CitywideOn April 18, 2016, the City Council approved Ordinance 16-04 to allow for an exemption from the realty transfer tax for first-time homebuyers as defined in the City of Harrington Code, Chapter 378 Taxation.
Proposed Incentives
Sewer Impact Fee Reduction | CitywideThe Sewer Impact Fee will be reduced and will have annual step increases.
Direct Job Creation Impact Fee Waiver | CitywideA tiered system to waive water and sewer impact fees based on the number of full-time jobs created within the City.
New Business License Fee Waiver | DowntownNew businesses located in the Downtown, as shown on Map 1. Downtown Boundary, will be eligible for a one-time waiver of its Business License fee for the first three years. Businesses will still be required to obtain the Business License. This license waiver does not apply to rental licensing.
Development Application Fee Reduction | DowntownDevelopment applications for a Category A or Category B plan review within the Downtown, as shown on Map 1. Downtown Boundary, are eligible for a one-time fee reduction in the amount of $200 per parcel and/or application.
Development Application Expedited Review Time | DowntownAny site plan review applications submitted in the Downtown, as shown on Map 1. Downtown Boundary, will receive review comments within 10 working days from
Downtown Development District PlanChapter 6. The Incentives

Page | 92 Final Plan
the date of submission to the City.
First-Time Home Buyer Tax Abatement | DowntownA first-time homebuyer for an owner-occupied single-family home may be eligible for a one-time abatement of the first full tax assessment billing.
Other Funding & Support Opportunities
Federal Sources
Brownfield Economic Development Initiative(BEDI) | BEDI is a competitive program used to spur the return of brownfields to productive economic reuse. BEDI grants must be used in conjunction with HUD Section 108 guaranteed loans.
Community Development Block Grant (CDBG) | CDBG grants are funds from the U.S. Department of Housing and Urban Development (HUD) for community revitalization through housing, infrastructure, and economic development programs that serve the interests of low- and moderate-income populations.
Economic Development Administration (EDA) Grant | EDA grants can be used to finance construction and rehabilitation of infrastructure and facilities that are necessary to achieve long-term growth and economic vitality.
Environmental Protection Agency (EPA) Assessment Grant | Assessment grants provide funding to carry out cleanup activities at brownfield sites. An applicant must own the site for which funding is requested at the time of the application.
Historic Preservation Tax Credit Program (HPTC) | HPTC provides developers with a federal tax credit up to 20% off of the costs associated with the renovation or rehabilitation of a building listed on the National Register of Historic Places.
HOME | HOME provides grants to states and municipalities to fund a wide range of activities intended to assist in building, buying, and/or rehabilitating affordable housing.
Low Income Housing Tax Credit (LIHTC) Program | The LIHTC program provides a dollar to dollar tax credit to attract equity investments to finance the development of affordable housing.
Neighborhood Stabilization Program (NSP) | NSP grants are funds made available to acquire and rehabilitate abandoned or foreclosed housing or residential properties in neighborhoods.
New Market Tax Credit (NMTC) Program | The NMTC Program attracts investment capital to qualifying low-income census tracts by permitting individual and corporate investors to receive a tax credit against their Federal income tax return in exchange for making equity investments in specialized institutions called Community Development Entities (CDEs).
U.S. Department of Transportation (DOT) Tiger Grant | Tiger Grants provide funds for investment in road, rail, transit, and port projects that promise to achieve critical national objectives that make communities more livable and sustainable.
State Sources
Advantage 4 | This grant program assists qualified borrowers in the purchase of their own home by providing down payment and closing cost assistance in the form of a grant equal to 4% of the first mortgage loan amount.Clean Transportation Incentive Program | This program provides grants and rebates for Delawareans, Delaware counties and municipalities, and Delaware businesses for the purchase of new,
Downtown Development District PlanChapter 6. The Incentives

Page | 93 Final Plan
alternatively fueled vehicles and electric vehicle charging stations.
Delaware Emergency Mortgage Assistance Program (DEMAP) | DEMAP is designed to assist Delawareans who are 90 days or more delinquent on their mortgage payments. Reasons for hardship are limited to unemployment or reduction in hours as a result of a downturn in the economy, illness, or injury. The Delaware State Housing Authority brings the mortgage current with a lump sum payment and makes additional payments for up to 24 months that allows the borrower to stabilize their financial position.
Energy Assessments | The Delaware Sustainable Energy Utility is subsidizing energy audits performed by the University of Delaware’s Industrial Assessment Center. This program also serves to train UD graduate students through hands-on energy auditing experience. After the building assessment, participants receive a list of recommended energy conservation measures, estimated costs and savings, and payback periods.
Energy Efficiency Investment Fund (EEIF) |The EEIF program helps businesses offset upfront costs for energy efficiency improvements and offers two grant/loan options for installation of energy efficiency projects.
First Time Homebuyer Tax Credit | This program is a federal income tax credit designed to help make homeownership more affordable to qualified homebuyers. Homebuyers who elect to use the federal tax credit are eligible to claim a portion of the annual interest paid on their mortgage as a special tax credit.
Green Energy Program | This program provides grant incentives for qualifying renewable energy systems installed in Delaware. In order to qualify for rebates, a participant’s electricity provider must collect funds for the program and currently offer a grant program for renewable energy projects. Each utility company offering rebates has unique program regulations, requirements, program budgets, incentive levels, and application forms.
Green Infrastructure | Green infrastructure loans are available for projects at below market interest rates. Interest rate subsidies and/or principal forgiveness may be provided based on the affordability of the project. Wastewater facilities and environmentally innovative projects are eligible.
Home Purchase Rehabilitation Program | This program assists homebuyers purchase a home that may need to be repaired, improved, or made more energy efficient. The cost to purchase the home and the costs of repairs (up to $35,000) are combined into one loan.
Housing Development Fund (HDF) | The HDF is designed to provide financing for developers through sponsoring agencies. Types of developments that will be considered include, but are not limited to, the acquisition and/or rehabilitation of existing housing, the adaptive reuse of buildings, and new construction.
Leaking Storage Tank Remediation | These loans provide a source of low interest financing for protecting the State’s groundwater supplies by rehabilitating underground storage tank systems. Eligibility is open to owners or lessees of underground storage tank facilities that need rehabilitation in order to meet regulatory requirements and where the applicant demonstrates ability to repay the loan.
Low Income Housing Tax Credit (LIHTC) | The statewide program provides a direct federal income tax credit to qualified owners and investors to build, acquire, or rehabilitate rental housing units to rent to working low-income Delawareans. The equity raised through the tax credit investment makes it possible for developers to attract the financing needed to create or restore low-income rental housing.
National Register of Historic Places Technical Assistance | The Delaware Department of State, Division of Historical & Cultural Affairs provides technical assistance to parties interested in applying for recognition on the National Register of Historic Places.
Neighborhood Assistance Act (NAA) | The NAA program encourages businesses and individuals
Downtown Development District PlanChapter 6. The Incentives

Page | 94 Final Plan
who pay Delaware state income taxes to invest in programs serving impoverished neighborhoods or serving low- and moderate-income families. In exchange for a qualified contribution to benefit an approved non-profit program, the NAA provides state tax credits equal to 50% of the investment.
Recycling | Recycling programs support the statewide universal recycling law and offers grants, loans, business sector recycling toolkits, and technical assistance. Government, commercial, and non-profit applicants are eligible for grants and loans to increase the recycling rate.
Second Mortgage Assistance Loan (SMAL) | SMAL assists income qualified borrowers in the purchase of their own home by providing down payment and closing cost assistance in the form of second mortgages. SMAL must be used in conjunction with the Delaware State Housing Authority’s Homeownership Loan.
SEU Low-Interest Loan Program for Businesses and Non-Profits | The Delaware Sustainable Energy Utility will provide direct low-interest loans to businesses, non-profits, and governments for the purpose of financing energy conservation measures. Loans can range between $25,000 and $1 million.
Strong Neighborhood Housing Fund (SNHF) | The SNHF is intended to fund local jurisdictions and non-profit development agencies to acquire, renovate, and sell vacant, abandoned, foreclosed, or blighted buildings in targeted areas.
Stormwater Infrastructure | Loans are available for stormwater infrastructure projects at below market interest rates. Interest rate subsidies and/or principal forgiveness may be provided based on the affordability of the project. Projects with water quality benefits are eligible.
Sustainable Energy Utility (SEU) | The SEU buys solar renewable energy credits (SREC) for $0.45 per watt from solar installations up to 50Kw. In exchange, the generation owners assign SREC generated over the next 20 years to the SEU. Residential photovoltaic systems up to 50kW are eligible to generate for SREC procurement.
Waste Reduction | This program conducts free waste assessments to help participants understand Best Management Practices (BMPs) and navigate service options related to waste streams. Government and commercial applicants are eligible for technical assistance to increase the recycling rate, reduce waste generation, and cut costs.
Weatherization Assistance Program (WAP) | WAP is a free service that is designed to reduce energy costs for low-income families by improving the energy efficiency of their home. Grant funds are provided by the U.S. Department of Energy and state sources for administering the program. Residential home owners, low-income housing developers and owners, and home renters are eligible to apply for direct grants to install energy efficiency and home weatherization measures.
Welcome Home/Home Again | This is a home ownership program that provides first mortgage financing at below-market interest rates to qualified homebuyers.
Downtown Development District PlanChapter 6. The Incentives

The Hubof Delaware
City of Harrington Property OwnersOrganizations
MerchantsResidents
It’s good to be in the Hub...
City of Harrington Downtown Development District Plan
Chapter Seven.
Downtown Harrington -The Evaluation


Page | 97 Final Plan
The short term success of the Downtown Development District Plan should be measured in two ways. First, has the City in fact implemented, in a timely manner and with a reasonable commitment of resources, the actions set forth in this Plan. Second, have the conditions in the Downtown improved as a result of the implementation of the Downtown Development District Plan.
The evaluation should review each action in the Plan that should have been undertaken during the time period covered by the evaluation as well as the continuing/ongoing activities. For each of these actions, the evaluation should address the following:
• Was the action carried out as planned?• If not, why not or how was it changed?• How successful was the action from an operational
perspective (number of participants or other indicators of involvement/participation)?
• How could the action be improved if it is a recurring or ongoing activity?
• Should the activity be continued? Be modified?• Is there any evidence that the action has had a
positive impact on the Downtown?
In addition to the status evaluation noted above, an evaluation of the effectiveness of implementing the Plan should be conducted. The effectiveness report should document at least the following:
• the nature and amount of all public improvements undertaken within the Downtown;
• the number, type, and value of investments made in private property within the Downtown including renovations, expansions, or new buildings;
• the number and type of new businesses that opened in or relocated to the Downtown including the number of new jobs created;
• the number and type of businesses that closed or relocated from the Downtown including the number of jobs lost;
• the number and type of business expansions within the Downtown including the number of new jobs created; and
• the percentage change in taxable property valuation of all private property in the Downtown.
As part of this review, the City Manager and City Planner should consider whether any amendments should be made to the Downtown Plan to improve its
effectiveness or to respond to changing conditions or opportunities. If they believe that an amendment of the Plan is warranted, they should prepare appropriate amendments and submit them for consideration and possible recommendation to the City Council as formal amendments. The objective of this process is that the Downtown Development District Plan will become a “living document” that is updated and refined on an ongoing basis to serve as a guide for the community’s downtown revitalization activities.
A key element of the evaluation process is keeping the Downtown community, volunteers, and the larger Harrington community aware of the progress being made to implement (and possibly revise and update) the Downtown Development District Plan. This reporting should take a number of forms including, but not limited to, the following:
• Following each periodic evaluation, the City Manager and City Planner should prepare a summary of the progress made during the past evaluation period and the key achievements in improving the Downtown. This should be done as a one or two page handout that can be posted on the City’s website and printed and distributed to the Downtown community and volunteers and used as a handout at Downtown events and activities.
• Following the presentation of the progress report to the City Council, a celebration should be held to note the progress made during the evaluation period, to recognize special accomplishments, and to thank the Downtown community and volunteers for their contributions to the success.
• The City should establish a regular process for reporting successes in implementing the Plan to the local media and encouraging them to provide coverage.
Downtown Development District PlanChapter 7. The Evaluation


The Hubof Delaware
City of Harrington Property OwnersOrganizations
MerchantsResidents
It’s good to be in the Hub...
City of Harrington Downtown Development District Plan
Chapter Eight.
Downtown Harrington -The Maps


Page | 101 Final Plan
NORFOLK SOUTHERN RAILROAD
C S
T
FRANKLIN ST
NEW ST
SHORT ST
HIG
H S
T
W M
ILBY
ST
E M
ILBY
ST
THO
RPE
ST
MIL
L ST
WO
LCO
TT S
T
PEC
K AV
E
REED ST
THOMAS ST
WARD ST
FLEMINGST
RAILROAD AVE
EAST ST
DELAWAREAVE
MEC
HAN
ICST
ELI
BER
TYST
DORMAN ST
HANLEY ST
MIS
PILL
ION
ST
COMMERCE ST
CLA
RK
ST
DOW
NTO
WN
ARE
A10
8 Pa
rcel
s33
Acr
es
City
of
Har
ringt
on
Dow
ntow
nD
evel
opm
ent
Dis
tric
t
Har
ringt
on, D
elaw
are
Map
1. D
ownt
own
Boun
dary
Dow
ntow
n De
velo
pmen
t Dist
rict
¯5/
9/20
16
010
020
050
Feet


Page | 103 Final Plan
!
NORFOLK SOUTHERN RAILROAD
C ST
FRANKLIN ST
NEW ST
SHORT ST
HIG
H S
T
W M
ILBY
ST
E MILB
Y ST
THO
RPE
ST
MIL
L ST
WO
LCO
TT S
T
PECK
AVE
REED ST
THOMAS ST
WARD ST
FLEMIN
GST
RAILROAD AVE
EAST ST
DELAWARE AVE
MEC
HAN
IC S
T
ELI
BERT
YST
DORMAN ST
HANLEY ST
MIS
PILL
ION
ST
COMMERCE ST
CLA
RK S
T
DO
WN
TOW
N A
REA
108
Parc
els
33 A
cres
City
of
Har
ring
ton
Dow
ntow
nD
evel
opm
ent
Dis
tric
tH
arrin
gton
, Del
awar
e
Map
2. D
ownt
own
Aeria
lDo
wnt
own
Deve
lopm
ent D
istric
t
¯5/
9/20
16
010
020
050
Feet


Page | 105 Final Plan
NORFOLK SOUTHERN RAILROAD
FRANKLIN ST
C ST
NEW ST
HIG
H S
T
W M
ILBY
ST
SHORT ST
E MILB
Y ST
GRA
NT
ST
WO
LCO
TT S
T
THO
RPE
ST
MIL
L ST
MASTEN ST
REED ST
THOMAS ST
WARD ST
PECK
AVE
EAST ST
FLEMING ST
RAILROAD AVE
DELAWAREAVE
HANLEY ST
MISP
ILLIO
N ST
DORMAN ST
E LI
BERT
Y ST
COMMERCE ST
CLAR
K ST
Dow
ntow
n B
ound
ary
Exis
ting
Land
Use
Res
iden
tial
Mul
tifam
ily
Com
mer
cial
Mix
ed
Inst
itutio
nal
Ope
nspa
ce
Vaca
nt
Rai
lroad
Har
ringt
on, D
elaw
are
Map
3. E
xist
ing
Land
Use
Dow
ntow
n De
velo
pmen
t Dist
rict
¯5/
9/20
16
010
020
050
Feet


Page | 107 Final Plan
NORFOLK SOUTHERN RAILROAD
C ST
FRANKLIN ST
NEW ST
HIG
H S
T
W M
ILBY
ST
SHORT ST
E MILB
Y ST
GRA
NT
ST
THO
RPE
ST
WO
LCO
TT S
T
MIL
L ST
MASTEN ST
REED ST
THOMAS ST
PECK
AVE
WARD ST
FLEMIN GST
EAST ST
RAILROAD AVE
DELAWAREAVE
MEC
HA
NIC
ST
HANLEY ST
DORMAN ST
MIS
PILL
ION
ST
ELI
BERT
YST
COMMERCE ST
CLA
RK S
T
Dow
ntow
n Bo
unda
ry
Zoni
ngC-
2 Ce
ntra
l Com
mer
cial
C-3
Serv
ice
Com
mer
cial
R-1
Sing
le-F
amily
Res
iden
tial
Har
ringt
on, D
elaw
are
Map
4. Z
onin
gDo
wnt
own
Deve
lopm
ent D
istric
t
¯5/
9/20
16
010
020
050
Feet


Page | 109 Final Plan
NORFOLK SOUTHERN RAILROADH
IGH
ST
W M
ILBY
ST
C ST
FRANKLIN ST
NEW ST
WO
LCO
TT S
T
SHORT ST
E MILB
Y ST
THO
RPE
ST
MIL
L ST
MASTEN ST
REED ST
THOMAS ST
WARD ST
MEC
HAN
IC S
T
FLEMINGST
RAILROAD AVE
EAST ST
PECK
AVE
DELAWAREAVE
MIS
PILL
ION
ST
HANLEY ST
DORMAN ST
E LI
BERT
Y ST
COMMERCE ST
CLA
RK S
T
Dow
ntow
n Bo
unda
ry
Dow
ntow
n Bu
ildin
gs
1
23
4
5
67 8
9
1011
Dow
ntow
n Ju
nctio
n
Cook
s Tire
Cen
ter
Pow
er in
Pra
ise M
inist
ries
Farm
ers'
Mar
ket
Conn
ectio
ns C
SP
OM
G Co
llage
Happ
y Ta
ils D
og G
room
ing
The
Clut
ter B
ox
Harr
ingt
on F
loris
t & C
aker
y
The
Bow
ers G
roup
P&R
Build
ers,
Inc.
1 2 3 4 5 6 7 8 9 10 11
Har
ringt
on, D
elaw
are
Map
5. D
ownt
own
Rede
velo
pmen
tDo
wnt
own
Deve
lopm
ent D
istric
t
¯5/
9/20
16
010
020
050
Feet


Page | 111 Final Plan
NORFOLK SOUTHERN RAILROAD
C ST
FRANKLIN ST
NEW ST
SHORT ST
E MILB
Y ST
HIG
H S
T
W M
ILBY
ST
THO
RPE
ST
MIL
L ST
PECK
AVE
WO
LCO
TT S
T
REED ST
THOMAS ST
WARD ST
FLEMIN GST
RAILROAD AVE
EAST ST
DELAWAREAVE
ELI
BERT
YST
MEC
HAN
IC S
T
HANLEY ST
DORMAN ST
MIS
PILL
ION
ST
CLA
RK S
T
COMMERCE ST
Har
ringt
on, D
elaw
are
Map
6. P
riorit
y Re
deve
lopm
ent P
roje
cts
Dow
ntow
n De
velo
pmen
t Dist
rict
¯5/
9/20
16
010
020
050
Feet
Vaca
ncie
s as
of 2
015
Dow
ntow
n Bo
unda
ry
Dow
ntow
n St
ruct
ures
Vaca
nt S
truc
ture
- Pr
iorit
y 1
Railr
oad
Impr
ovem
ent A
rea
Vaca
nt L
ot -
Prio
rity
2


Page | 113 Final Plan
C ST
FRANKLIN ST
NEW ST
SHORT ST
GRA
NT
ST
E MILB
Y ST
HIG
H S
T
W M
ILBY
ST
THO
RPE
ST
MIL
L ST
PECK
AVE
WO
LCO
TT S
T
REED ST
THOMAS ST
WARD STFLEMIN G
ST
RAILROAD AVE
EAST ST
DELAWAREAVE
MEC
HAN
IC S
T
ELI
BERT
YST
HANLEY ST
DORMAN ST
MIS
PILL
ION
ST
COMMERCE ST
CLA
RK S
T
Dat
a S
ourc
es:
Par
cel -
Ken
t Cou
nty
DOW
NTO
WN
ARE
A10
8 Pa
rcel
s33
Acr
es
NORFOLK SOUTHERN RAILROAD
Lege
nd
Dow
ntow
n Bo
unda
ry
Exce
llent
Rec
harg
e Ar
ea
Wel
l Hea
d Pr
otec
tion
Area
s
City
of
Har
ringt
on
Dow
ntow
nD
evel
opm
ent
Dis
tric
t
Har
ringt
on, D
elaw
are
Map
7. E
nviro
nmen
tal F
eatu
res
Dow
ntow
n De
velo
pmen
t Dist
rict
¯5/
9/20
16
010
020
050
Feet


Page | 115 Final Plan
!!
!!
!!
!!
!!
!!
!!
!!
!!
!!
!!
!!
!!
!!
!!
!!
!!
!!
!!
!!
!!
!!
!!
!!
!!
!!
!!
!!
!!
!!
!!
!!
!!
!!
!!
!!
!!
!!!!!!!!!!!!!!!!!!!!!!!!!!!!!!!!!!!!!!!!!!!!!!!
!!!!!!!!!!!!!!!!!!!!!!!!!!!!!
! ! ! ! ! ! ! ! ! ! ! ! ! ! ! ! ! ! ! ! ! ! ! ! ! ! ! ! ! ! ! ! ! ! ! ! ! ! ! ! ! ! ! ! !
! ! ! ! ! ! ! ! ! ! ! ! ! ! ! ! ! ! ! ! ! ! ! ! ! ! ! ! ! ! ! ! ! ! ! ! ! ! ! ! ! ! !
!!!!!!!!!!!!!!!!!!!!!!!!!!!!!!!!!!!!!!!!!!!!!!
NORFOLK SOUTHERN RAILROADJa
THIR
D S
T
W M
ISPI
LLIO
N S
TM
ISPI
LLIO
N S
T
C ST
BROW
N ST
SHORT ST
WEINER AVE
FRANKLIN ST
NEW ST
HARRINGTON AVE
THO
RPE
ST
DICKERSON ST
MIL
L ST
HIG
H S
T
MASTEN ST
REED ST
E MILB
Y ST
THOMAS ST
WARD ST
GRA
NT
ST
WO
LCO
TT S
T
W M
ILBY
ST
FLEMING ST
EAST ST
PECK
AVE
MEC
HAN
IC S
T
HANLEY ST
WLI
BERT
Y ST
DELAWARE AVE
DORMAN ST COMMERCE ST
E LI
BERT
Y ST
CLAR
KST
WEST ST
RAILROAD AVE
Dow
ntow
n Bo
unda
ry
Build
ing
Park
ing
Area
Side
wal
ks
!!
Bike
Rou
te
Stre
et M
aint
enan
ceCi
ty O
wne
d
Stat
e O
wne
d
Har
ringt
on, D
elaw
are
Map
8. T
rans
port
atio
nDo
wnt
own
Deve
lopm
ent D
istric
t
¯5/
9/20
16
015
030
075
Feet


Page | 117 Final Plan
NORFOLK SOUTHERN RAILROADJa
C ST
NEW ST
SHORT ST
HIG
H S
T
W M
ILBY
ST
E MILB
Y ST
MASTEN ST
THO
RPE
ST
MIL
L ST
WO
LCO
TT S
T
REED ST
PECK
AVE
THOMAS ST
WARD ST
FLEMING ST
RAILROAD AVE
EAST ST
DELAWAREAVE
HANLEY ST
DORMAN ST
E LI
BERT
Y ST
MISP
ILLIO
N ST
COMMERCE ST
CLAR
K ST
FRAN
KLIN
ST
GRA
NT
ST
MEC
HAN
IC S
T
88
57
538
Har
ringt
on, D
elaw
are
Map
9. D
ownt
own
Park
ing
Dow
ntow
n De
velo
pmen
t Dist
rict
¯5/
9/20
16
010
020
050
Feet
Park
ing
as o
f 201
5
17
50
1019
22
6
29
32
15
Park
ing
Area
Park
ing
Lots
U
nim
prov
edw
ith S
trip
ing
Dow
ntow
n Bo
unda
ry
Pote
ntia
l Par
king
Ex
pans
ion


The Hubof Delaware
City of Harrington Property OwnersOrganizations
MerchantsResidents
It’s good to be in the Hub...
City of Harrington Downtown Development District Plan
Chapter Nine.
Appendix


Page | 121 Final Plan
Downtown Survey:Resident/Visitor Survey
Downtown Development District PlanChapter 9. Appendix


Page | 123 Final Plan
Downtown Development District PlanChapter 9. Appendix

Page | 124 Final Plan
Downtown Development District PlanChapter 9. Appendix

Page | 125 Final Plan
Downtown Development District PlanChapter 9. Appendix

Page | 126 Final Plan
Downtown Development District PlanChapter 9. Appendix

Page | 127 Final Plan
Downtown Development District PlanChapter 9. Appendix

Page | 128 Final Plan
Downtown Development District PlanChapter 9. Appendix

Page | 129 Final Plan
Downtown Survey:Merchant Survey
Downtown Development District PlanChapter 9. Appendix


Page | 131 Final Plan
Downtown Development District PlanChapter 9. Appendix
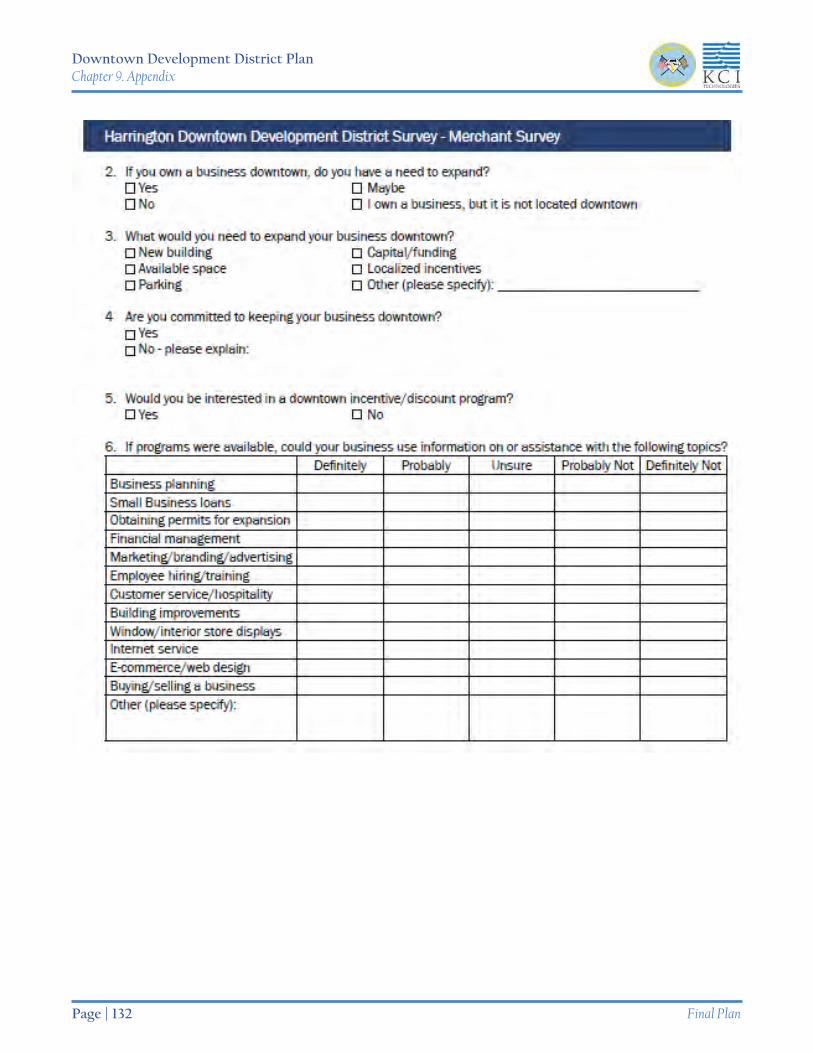
Page | 132 Final Plan
Downtown Development District PlanChapter 9. Appendix

Page | 133 Final Plan
Downtown Development District PlanChapter 9. Appendix

Page | 134 Final Plan
Downtown Development District PlanChapter 9. Appendix

Page | 135 Final Plan
Downtown Development District PlanChapter 9. Appendix


Page | 137 Final Plan
Downtown Survey:Survey Results
The data provided in the following tables and graphs accurately matches that provided in the original survey results; however, the format has been modified to complement this document..
Downtown Development District PlanChapter 9. Appendix


Page | 139 Final Plan
Q1. Are you a:Answered: 90 Skipped: 0
Answer Choices Responses
Harrington Resident 41.11% 37
Harrington Property Owner 14.44% 13
Harrington Business Owner 6.67% 6
Harrington Employee (within the downtown area)
13.33% 12
Visitor 24.44% 22
Total 90
Q2. How often do you shop at the following locations?Answered: 82 Skipped: 8
Write-In Responses:
Greenwood
Baltimore
Middletown
Beaches
Easton
Georgetown
Christiana Mall
Salisbury Mall
Beach Outlets
5+ times a week
2-4 times a week
Once a week
Once a month
Once every few months
NeverTotal
Downtown Harrington 6.58%5
10.53%8
15.79%12
22.37%17
31.58%24
13.16%10
76
Route 13 Corridor 21.79%17
39.74%31
25.64%20
5.13%4
6.41%5
1.28%1
78
Milford 3.95%3
25.00%19
27.63%21
18.42%14
11.84%9
13.16%10
76
Seaford 0.00%0
1.49%1
7.46%5
7.46%5
38.81%26
44.78%30
67
Dover/Camden 6.58%5
17.11%13
28.95%22
26.32%20
18.42%14
2.63%2
76
0% 10% 20% 30% 40% 50%
Visitor
Harrington Employee (withinthe downtown area)
Harrington Business Owner
Harrington Property Owner
Harrington Resident
Downtown Development District PlanChapter 9. Appendix
0.00% 10.00% 20.00% 30.00% 40.00% 50.00%
Dover/Camden
Seaford
Milford
Route 13 Corridor
Downtown Harrington
5+ times a week 2-4 times a week Once a week
Once a month Once every few months Never

Page | 140 Final Plan
Q3. What places/stores do you visit in Harrington’s downtown?Answered: 80 Skipped: 10
Answer Choices Responses Write Ins:
Retail 50.00% 40 Trinity UM Church; Friends & Family; Insurance; Harrington Florist & Cakery (2); Museums; Post Office, occasionally; bank; answer to #2 Downtown Harrington applies to these places only; The Clutter Box; Happy Tails excellent dog grooming services; The Clutter Box Antiques; bank; Harrington Public Library
Service 16.25% 13
Restaurant 38.75% 31
City 21.25% 17
Freedom Park 8.75% 7
Post Office or Bank 75.00% 60
Farmers’ Market 7.50% 6
Other (please specify) 15.00% 12
Q4. What time do you typically visit Harrington’s downtown?Answered: 78 Skipped: 12
Answer Choices Responses
Monday-Friday, before 5pm 51.28% 40
Monday-Friday, 11am-2pm 17.95% 14
Monday-Friday, after 5pm 12.82% 10
Saturday-Sunday, before 5pm 11.54% 9
Saturday-Sunday, after 5pm 6.41% 5
0% 10% 20% 30% 40% 50% 60% 70% 80%
Other (please specify)
Farmers' Market
Post Office or Bank
Freedom Park
City
Restaurant
Service
Retail
0% 10% 20% 30% 40% 50% 60%
Saturday-Sunday, after 5pm
Saturday-Sunday, before 5pm
Monday-Friday, after 5pm
Monday-Friday, 11am-2pm
Monday-Friday, before 5pm
Downtown Development District PlanChapter 9. Appendix

Page | 141 Final Plan
Q5. Have you attended any of the following events in the past three years?Answered: 64 Skipped: 26
Answer Choices Responses Write-Ins:
Heritage Day 84.38% 54 I attended all but Police Night Out annually, but none in the past three years; Movies; no recently moved here; Library functions, Church
Police National Night Out 37.50% 24
Tree Lighting Ceremony 34.38% 22
Christmas Parade 75.00% 48
Other (please specify) 7.81% 5
Q6. How do you most often travel to establishments in the downtown?Answered: 77 Skipped: 13
Answer Choices Responses
Walk 9.09% 7
Bike 0.00% 0
Drive and use on-street parking 46.75% 36
Drive and use municipal parking 7.79% 6
Drive and use parking at one establishment, then leave the downtown 11.69% 9
Drive, use one establishment’s parking, and visit multiple places 9.09% 7
Drive and use multiple establishments’ parking lots 15.58% 12
0% 10% 20% 30% 40% 50% 60% 70% 80% 90%
Other (please specify)
Christmas Parade
Tree Lighting Ceremony
Police National Night Out
Heritage Day
0% 10% 20% 30% 40% 50%
Drive and use multiple establishments'parking lots
Drive, use one establishment's parking, andvisit multiple places
Drive and use parking at one establishment,then leave the downtown
Drive and use municipal parking
Drive and use on-street parking
Bike
Walk
Downtown Development District PlanChapter 9. Appendix

Page | 142 Final Plan
Q7. Which of the following attracts you to a shopping/business area?Answered: 77 Skipped: 13
Strongly Agree
Agree Neither
Agree nor Disagree
DisagreeStrongly Disagree
TotalWeighted Average
Variety of products & services
45.21%33
36.99%27
10.96%8
4.11%3
2.74%2
73 1.82
Quality of products & services
47.89%34
36.62%26
9.86%7
4.23%3
1.41%1
71 1.75
One-stop shopping 20.90%14
41.79%28
20.90%14
11.94%8
4.48%3
67 2.37
Look & feel of the business area
33.82%23
47.06%32
13.24%9
4.41%3
1.47%1
68 1.93
Friendly customer service 57.53%42
34.25%25
6.85%5
1.37%1
0.00%0
73 1.52
Independent stores over chains
35.71%25
28.57%20
28.57%20
7.14%5
0.00%0
70 2.07
Nearby places to eat 30.99%22
38.03%27
23.94%17
5.63%4
1.41%1
71 2.08
Shopping after 5pm 19.12%13
33.82%23
35.29%24
7.35%5
4.41%3
68 2.44
Convenient location 32.39%23
45.07%32
16.90%12
4.23%3
1.41%1
71 1.97
Convenient parking 40.85%29
36.62%26
15.49%11
4.23%3
2.82%2
71 1.92
Pedestrian safety & convenience
38.36%28
39.73%29
13.70%10
4.11%3
4.11%3
73 1.96
Price 36.62%26
45.07%32
14.08%10
2.82%2
1.41%1
71 1.87
Write Ins: Attend church meetings and services; Uniqueness of shops (Clutter Box and Antique Store); My bank and insurance co are within walking distance. I shop the Clutter Box for quality and service.
0 0.5 1 1.5 2 2.5 3
Price
Pedestrian safety and convenience
Convenient parking
Convenient location (close to home or work)
Shopping after 5pm on weekdays and…
Nearby places to eat
Independent stores over chains
Friendly customer service
Look and feel of the business area
One-stop shopping (variety of products in…
Quality of products and services
Variety of products and services
Downtown Development District PlanChapter 9. Appendix

Page | 143 Final Plan
Q8. Do you feel safe in Harrington’s downtown during the day and night?Answered: 78 Skipped: 12
Yes No Total
Day 100.00%78
0.00%0
78
Night 62.32%43
37.68%26
69
Comments:
Too many young kids hanging out.
Too many drugs - just like everywhere these days, also crime - due to plea bargain with some. Harrington police chief Norman is exceptional from talks I had with other residents. Some officers not trusted.
Too many people that walk in the street not on the sidewalks.
I avoid night - crime is everywhere.
Don’t visit at night.
Way too many teenagers walking around, up and down Clark Street and side streets. Vacant houses have squatters and you can see drug paraphenalia on the streets. Not even safe to drive thru ATM after 5pm. Even during the day there are nefarious looking guys hanging around the Junction across from the post office.
Wonderful police department.
Not here at night.
You can watch drug exchanges happening as you ride by.
Dim lighting, kids/people. I. That area at night.
I don’t particularly feel safe anywhere in Harrington at night. Buildings and houses are in disrepair; I have witnessed fights/arguments on the street; streets can seem desolate; I don’t know the people of the town the way I did at one time; town has a lot of traffic just passing through. I feel safer during the day; although, not as safe as I did at one time.
The news with violence in Harrington.
Needs more lighting in certain areas.
Not always, parts of town is run down. I’m in the market to buy a home and I’m going to look at one on E. Center St. I have 3 small children and safety is my main concern.
There are numerous groups of teenagers hanging around and no visible police presence in town. Some areas are dark and not well lit.
I am usually alone and I don’t see a lot of police patrolling the area.
I wouldn’t walk alone at night, which is sad since I grew up here doing that. But I can see the differences between then and now. More drugs in the area make me nervous and the methadone clinic isn’t helping. It just brings more addicts to the area for a quick fix then they stick around. There has been more crime since it opened. I wish I could feel comfortable letting my kids play like I did.
It depends on the *atmosphere* or *feel* of the area. Sometimes it feels ok other times it doesn’t.
Have you read the news? All the creepy druggies and other people wandering vacantly about make me uncomfortable. Also, I’m averse to getting shot.
At times there is a group of young men walking the streets.
For the most part I feel safe walking downtown during the day except for a certain location where there are always people loitering around the store entrance. I do not walk anywhere in town after dark that includes walking home from work or walking my dog.
City not safe at night.
0% 20% 40% 60% 80% 100% 120%
Night
Day
Yes No
Downtown Development District PlanChapter 9. Appendix

Page | 144 Final Plan
Q9. Currently, what are the major advantages of Harrington’s downtown?Answered: 75 Skipped: 15
Answer Choices Responses
Convenient location 56.00% 42
Fair prices 25.33% 19
Friendly local service 62.67% 47
Easy to find parking 32.00% 24
Supporting local businesses 62.67% 47
Less traffic and crowds 41.33% 31
Within walking distance 34.67% 26
Selection of goods/services 10.67% 8
Know local employees 32.00% 24
Events at Freedom Park 21.33% 16
Small town/historic character
34.67% 26
Other (please specify) 8.00% 6
Write-Ins:
Post office & bank; That is where the post office is; None; None that come to mind; It is getting there but it does not have enough “curb appeal”; Within walking distance once parked at an establishment and going to others.
Q10.Currently, what are the major disadvantages of Harrington’s downtown?Answered: 69 Skipped: 21
Answer Choices Responses
Inconvenient location 5.80% 4
Poor appearance 36.23% 25
Lack in variety of goods/services
82.61% 57
High prices 7.25% 5
Difficult/inconvenient to park/walk
24.64% 17
Limited hours 39.13% 27
Traffic 11.59% 8
Poor customer service 0.00% 0
Other (please specify) 8.70% 6
Write-Ins:
None; Train (2); Roads in bad shape; Crime - Not fun to shop when you have to watch your car!; A “bistro” or coffee shop would be an ideal addition to help improve the look and feel of the downtown area as well as a bakery.
0% 10% 20% 30% 40% 50% 60% 70%
Other (please specify)
Small town/historic character
Events at Freedom Park
Know local employees
Selection of goods/services
Within walking distance
Less traffic and crowds
Supporting local businesses
Easy to find parking
Friendly local service
Fair prices
Convenient location
0% 10% 20% 30% 40% 50% 60% 70% 80% 90%
Other (please specify)
Poor customer service
Traffic
Limited hours
Difficult or inconvenient to park and walk
High prices
Lack in variety of goods/services
Poor appearance
Inconvenient location
Downtown Development District PlanChapter 9. Appendix

Page | 145 Final Plan
Q11. Imagine Harrington’s downtown in ten years. How appealing are these future scenarios?Answered: 75 Skipped: 15
Very Appealing
Somewhat Appealing
Not Appealing
No Opinion
Don’t Know
TotalWeighted Average
An attractive place to call home with a mix of residential styles (e.g., single-family, townhouses, apartments) that appeal to a variety of ages and incomes
40.28%29
41.67%30
12.50%9
5.56%4
0.00%0
72 1.83
An aesthetic blend of green space, natural elements, and pedestrian amenities with an historic flavor
54.17%39
40.28%29
2.78%2
2.78%2
0.00%0
72 1.54
A place with new professional offices and businesses that provides jobs and employees who patron other establishments in the downtown
45.07%32
28.17%20
18.31%13
7.04%5
1.41%1
71 1.92
A meeting place and the center of community activities with a mix of shopping, restaurants, cultural, and recreation spaces
67.12%49
21.92%16
4.11%3
5.48%4
1.37%1
73 1.52
A niche destination place where specialty retail stores and restaurants attract visitors from out of town
44.59%33
33.78%25
10.81%8
8.11%6
2.70%2
74 1.91
A place where locally owned stores/service shops for personal errands and dining/entertainment opportunities serve mainly the residents of the Harrington area
43.06%31
37.50%27
9.72%7
5.56%4
4.17%3
72 1.90
A regional destination retail center attracting people from a distance with a mix of retailers
26.39%19
41.67%30
20.83%15
9.72%7
1.39%1
72 2.18
Write-Ins: • Craft/flea market.• There isn’t much in our downtown. No local parks for children to play in, no coffee shops to sit in. Look at
downtown Milford they have so much in such a little area.• Any combination that could serve local people but also attract people from other areas. a ton of cars drive through
on the way to someplace else but few stop. It’s a pretty little area. I think cuter than Milford an I feel more safe than in Milford, but fewer attractions here. I don’t understand why. I moved here 3 years ago. Part of my job involves going to small towns all over DE and the eastern shore. Very few towns are as pretty as Harrington or feel as safe as Harrington but seem to attract more downtown businesses. Milford and Seaford are downright scary after dark. I’ve never felt uneasy walking my dog in downtown Harrington at night.
• Should have some type of convenience store downtown like Dollar General. It would also be wonderful to have some type of walking path.
• I agree with most of these, there are professional buildings by 13, past Arbys etc. I think the downtown area should be made quaint almost but not exactly like Milford. A place where you walk and look around and say, yeah, this is MY town and I’m glad.
0 0.5 1 1.5 2 2.5
A regional destination retail center attractingpeople from a distance with a mix of…
A place where locally owned stores/serviceshops for personal errands and…
A niche destination place where specialtyretail stores and restaurants attract visitors…
A meeting place and the center ofcommunity activities with a mix of…
A place with new professional offices andbusinesses that provides jobs and…
An aesthetic blend of green space, naturalelements, and pedestrian amenities with…
An attractive place to call home with a mixof residential styles (e.g., single-family,…
Downtown Development District PlanChapter 9. Appendix

Page | 146 Final Plan
Q12.What general service businesses would you like to see come to downtown?Answered: 72 Skipped: 18
Write-Ins:
Wawa, Cracker Barrel; Grocery store, specialty foods - bakery, coffee, etc.; Professional office space on the 2nd/3rd floor above ground level shops/restaurants; Pizza shop; Fast food ice cream; A hair salong could also be a great addition
Answer Choices Responses
Public and civic (e.g., library, park, community center, community garden, gallery) 54.17% 39
Institutional (e.g., religious, government, education, financial) 13.89% 10
Personal service (e.g., health club, beauty, tailor, dry cleaning, jewelry, household repair) 59.72% 43
Convenience store 19.44% 14
Commercial retail (e.g., general merchandise, clothing, hardware, household supplies & furnishings) 51.39% 37
Professional office (e.g., medical, law, accounting, architecture) 31.94% 23
Specialty retail (e.g., antiques, plants/flowers, gift shops) 38.89% 28
Youth programs 30.56% 22
Temporary (e.g., vendors, events) 15.28% 11
Other (please specify) 8.33% 6
Q13.What food-related businesses would you like to see in the downtown?Answered: 72 Skipped: 18
Write-Ins:
Brew pub; None; KFC; Don’t need any more; We already have nice store in Downtown, we need to support that; We need a good bakery with fresh rolls and pastries; Coffee shop, book store like Barnes and Noble, sports bar with TVs, movie theater; A ‘bistro’ or other quaint eatery would be lovely, a bakery wouldn’t hurt either.
Answer Choices Responses Answer Choices Responses
Locally owned restaurants 68.06% 49 Chain restaurants 22.22% 16
Coffee shop 61.11% 44 Evening Dining 45.83% 33
Breakfast/lunch dining 45.83% 33 Tavern and grill 36.11% 26
Fast food/take out 9.72% 7 Deli/sandwich 50.00% 36
Grocery store 22.22% 16 Specialty food (e.g., bakery, butcher, ice cream) 47.22% 34
Other (please specify) 11.11% 8
0% 10% 20% 30% 40% 50% 60% 70%
Other (please specify)
Temporary (e.g., vendors, events)
Youth programs
Specialty retail (e.g., antiques,…
Professional office (e.g., medical, law,…
Commercial retail (e.g., general…
Convenience store
Personal service (e.g., health club, beauty,…
Institutional (e.g., religious, government,…
Public and civic (e.g., library, park,…
0% 10% 20% 30% 40% 50% 60% 70% 80%
Other (please specify)
Specialty food (e.g., bakery, butcher, ice…
Grocery store
Deli/sandwich
Fast food/take out
Tavern and grill
Breakfast/lunch dining
Evening dining
Coffee shop
Chain restaurants
Locally owned restaurants
Downtown Development District PlanChapter 9. Appendix

Page | 147 Final Plan
Q14.What types of arts and cultural events/activities are best suited for downtown?Answered: 70 Skipped: 20
Answer Choices Responses
Outdoor concert 52.86% 37
Food festival 65.71% 46
Antique festival 48.57% 34
Seasonal/holiday festival 65.71% 46
Cultural/heritage festival 40.00% 28
Kid-friendly/family event 58.57% 41
“First Friday” 40.00% 28
Other (please specify) 15.71% 11
Q15.What changes do you believe would help improve the downtown area?Answered: 71 Skipped: 19
Answer Choices Responses Answer Choices Responses
Improved appearance 54.93% 39 Improved parking 36.62% 26
Greater variety of stores 78.87% 56 Better quality of merchandise 26.76% 19
Greater selection of merchandise 26.76% 19 Greater variety of merchandise 28.17% 20
Better atmosphere 26.76% 19 Greater feeling of safety 26.76% 19
More competitive pricing 11.27% 8 Improved customer service 2.82% 2
Expanded store hours 25.35% 18 Less traffic congestion 8.45% 6
Additional promotion & advertising 30.99% 22 Additional outdoor seating 21.13% 15
Attractive outdoor dining areas 43.66% 31 Creative storefronts & signage 35.21% 25
0% 10% 20% 30% 40% 50% 60% 70%
Other (please specify)
"First Friday" (regular day where downtownbusinesses stay open later in the evening)
Kid-friendly/family event
Cultural/heritage festival
Seasonal/holiday festival
Antique festival
Food festival
Outdoor concertWrite-Ins:
Various mixers; Merchants night (5); Street dance; Grow Heritage Day the way it used to be. You used to have streets of vendors and yardsale tables. You have 4 types of people who come to these events: people who love freebies, yardsale items, homemade items, homesales. When I was a kid this event was huge! K9 demonstrations, streets of yardsale tables, now its not worth gonig to. Why can’t you walk during the Christmas Parade? Only floats? Just odd that have so many rules for fun things. How about a street dance like Greenwood does?; Any of the above but the current downtown space doesn’t seem to adequately support these uses; Old time band concerts would be wonderful to try with ice cream socials topped off with one of Norman’s movies; It would be nice to have some stores open later in the evenings. It’s hard to accommodate everyone, that’s for sure.
0% 10% 20% 30% 40% 50% 60% 70% 80% 90%
Other (please specify)
Attractive outdoor dining areas
Additional promotion and advertising
Expanded store hours
More competitive pricing
Better atmosphere
Greater selection of merchandise
Greater variety of stores
Improved appearance Other (please specify) [8.45% / 6 responses]:
Dedicated bike trail; I think the storefront signage is top notch; It would be great to see a business and next to it would be a place like Dolce Bakery/Barnes/Starbucks or something like that - the downtown needs more curb appeal but so does the city. Need to start getting on banks and investors to do something with empty houses; Prices; Sorry, I know it’s more than 5. It’s hard not to go over 5. I really do hope this works out; A library.
Downtown Development District PlanChapter 9. Appendix

Page | 148 Final Plan
Q16.Is there a community similar to Harrington that you feel has a vibrant and attractive downtown that we can learn from?Answered: 35 Skipped: 55
Town Responses Town Responses Town Responses
Milford, DE 18 Milton, DE 5 Berlin, MD 4
Lewes, DE 3 Dover, DE 2 St. Michaels, MD 2
East Northport, NY 1 Greenwood, DE 1 Rehoboth, DE 1
Smyrna, DE 1
Q17.If there were vacant buildings or lots in downtown Harrington, what do you think they should be used for to create more economic activity for the downtown?Doyouhavespecificlocationsinmind?Answered: 41 Skipped: 49
Responses:
• Coffee shop/bakery (similar to LaDolce in Milford) in one of the two buildings next to OMG Collage. A small, up-scale restaurant/pub at old Stone’s Hotel. Mid-price, extended lease apartments above Stone’s Hotel. A breakfast-lunch deli/restaurant replacing Hoagie Time.
• No. Maybe a farm market. That is what attracted my family. The farmers were so friendly and accepting of new people and this creates jobs, turn over of money and of course the market - could also have a community communications office. When and moved here 45 years ago and came from New Castle.
• Somewhere kid friendly. Arts and crafts, pottery, play time cafe. There’s no where to take your kids to have fun!• No. (2)• Sitting area.• Soup kitchens, Code Purple, indoor flea market.• Food courts, Dollar Tree.• Specialty market, Dollar Tree.• Building next to WSFS.• Outdoor seating.• I would love to see a consignment shop, used bookstore, coffeehouse and/or card & gift shop in the place of
that nasty Downtown Junction which is a drug haven and smells like curry & incense. Harrington should do a pop-up program like Milford to attract small, new businesses.
• Free farmers’ market.• Old Jay’s Market-area - gas and convenience store.• You have quite a few vacant areas or empty buildings in the downtown area. I hear Stones is becoming a pizza
restaurant which would be awesome. How about the building on the corner across from the post office that has been empty for years, the empty lot that salvation army used to be in? The Hoagie Time building is empty again. There is no beautiful flowers or benches. Nothing welcoming in the area.
• Things listed earlier in survey.• Parking. There is no parking downtown to visit any stores. Building near bank that has been condemned.• We definitely need an upscale eatery/pub. A place you could get a quality sandwich/burger or salad and a beer
or wine. Nothing that would become a late night booze hall.• Theater. (2)• Youth center.• I know both Milford and Milton have rent breaks for startups. I would love to see a gym or some sort of fitness
classes downtown.• Restaurants, pubs, antique stores, family owned reatil stores.• Clothes at reasonable prices, gifts. Create a downtown that is a draw for all. Food.• Bakery• Arts center• Let investors fix up these vacant and run down housing. I think make it easier process for investors to build on
vacant lots
Downtown Development District PlanChapter 9. Appendix

Page | 149 Final Plan
Q17. Responses Continued:
• The City seems to be down zoning commercial properties to TND and then claim they want growth. Businesses bring people.
• Boutique coffee shop, news stand, books, doctor or dentist.• It would be nice to have a theater for creative arts.• Old Salvation Army lot and Farrow building could be redeveloped with shops.• Empty lots on Clark and Commerce Streets.• Children related activities, new stores, or restaurants.• Kid center (arts, crafts, games, music) coffee shop, book store• Fix them up first & put in educational or retail locations• Not vacant, but I have always wondered about the RR car and building, by M&T Bank, is that ever open to
tour?• Dining, commercial retail• A library within walking distance of downtown would be great.• Yes, maybe pop up shops (such as for vintage or thrift stores) or creative window displays for holidays or
appropriate seasons.• Nice restaurant. Grocery store. Clothing store. Dry cleaners. There are so many options because right now we
have nothing but3 businesses to choose but they do not provide the necessities of life such as groceries, clothes, etc.
• Offices.
Q18.If there was one thing that you could keep the same and one thing you could change about downtown Harrington, what would those be?Answered: 41 Skipped: 49
Responses:
• Keep the eye-pleasing store fronts such as The Harrington Florist & The Clutter Box. Fix-up or remove and replace the unsafe eye-sore buildings like the one just past the WSFS bank.
• Where I worked at Dupont Co. in the communications dep. taking visitors around and explaining some of the history. We had family who lived in Sussex all of their lives and had large farms.
• Encourage renovating the buildings. Less apartments in the downtown area make a business.• Storefronts displayed; new growth same character design.• Sub Shop• Senior Center• Feel of original buildings• Like the new street lights• Historic look; vacant buildings filled• No need to change• Keep the local merchants that bring flavor to Harrington such as the Bakery, Florist, Clutter Box, Happy Tails,
Antique shop, etc. Get rid of the businesses that discredit the town as mentioned above. And close down the new drug rehab place!
• More variety/convenient parking.• Keep the lights - new fixtures look nice. Add hours to present downtown businesses.• Let’s fill these buildings we have empty and PRETTY up our neighborhood. Let’s offer some amazing things
through the holidays like Berlin does in their downtown area. Our downtown is SMALL we have to make people want to stop in.
• Keep small atmosphere; more businesses.• I would keep as much of the historic feel to the downtown, to include Clark Street and Commerce Street - this
includes housing.• I loved when Taylor’s Hardware was downtown. The place was hopping with customers and you were just a
hop skip and a jump away if you needed something quick.• Keep the same - the small town feeling, historical and the post office. Change - upkeep on the buildings must
improve. Need eateries, bakeries, tea/coffee shops.• Not sure
Downtown Development District PlanChapter 9. Appendix

Page | 150 Final Plan
Q18. Responses Continued:
• Keep friendly local business owners. Get rid of Stones.• Keep small town atmosphere and lose vacant buildings.• Nothing is more beautiful than Commerce Street at Christmas. Add a gym. Encourage professional services to
have offices downtown. That would attract a base of people who have jobs, and then when stores open they would have a customer base.
• Better Christmas decorations, more police patrols for tractor trailers driving illegally on road.• Charm of downtown-keep more retail to create a walking day of events for many.• DO NOT change the historical features but build around the appearance of empty buildings.• Keep the charm of downtown. Get rid of vacant buildings downtown. Have a boutique downtown.• I like the look of the shops along Commerce Street. The unattractive area and homes along the railroad tracks.• Keep: small shops. Change: road width.• I like the attractive window displays from businesses that are DT and I think we need more variety of
businesses DT. I think we need a business association that is active and focused on business not politics.• Keep the hometown feel, but improve the overall appearance.• Keep the same: local businesses. Change: parking.• Def keep the small town feel but would make sure to fix up the old buildings. Condemned buildings look bad
and make Harrington look poor.• The traffic’s not bad, but it isn’t a good place to be at night.• I love the small town feel, locally owned business, municipal interaction with residents (polic night out, etc).
The only thing I would change is the lack of activity for teens. My son used to love going to united at the church, he wanted something along those lines. The issues that continually happened there would be the one thing I would like changed.
• Definitely keep the “small town vibe”. That’s always so impressive, esp as a town develops. Change building appearances, perhaps a local artist could help with that area. Signage, building front ideas, etc.
• Keep the improved street lights. Expand the street to complete Commerce Street and incorporate Clark Street.• Same-the great Antique and Floral Shop, and the banks. Different-everything else.• I would like to see more attractive landscapes and a variety of interesting and unique businesses as well as a .• The 2 antique shows are great and so is the flower/bake shop. Naturally the banks and post office are great but
that is all there is.• Friendly people• Freedom Park & the Museum are both very nice. I would change the look and atmosphere of Stone’s - eliminate
the liquor store. People actually ride their lawnmowers to the liquor store! I wonder what visitors think of that!
Q19.Do you have any other ideas that you feel would help attract residents, businesses, and visitors to downtown Harrington?Answered: 31 Skipped: 59
Responses:
• Use the grassy lot at the corner of Clark & Commerce as a small park with benches, flowers, flags, an elevated platform, etc. as a meeting place, drink coffee, eat lunch, read a book, and more.
• I don’t know what the financial situation is in Harrington but I do know from many senior residents that they feel that the taxes are too high, and the sewer and water is not fair. I agree if what I was told by City Hall that the sewer was calculated on the amount of water used, which they took 2x the water bill and made that the amount for the sewer because there are no meters for the sewer. Seniors have a hard time because of the high tax and the unfair water bills.
• Longer business hours, maybe some Sunday hoursa nd another good business besides waht is already there.• Events and things to draw them.• More shops.• Allow zoning of some of the vacant houses on Clark Street and Commerce Street to be businesses. So many
small businesses would thrive if given the opportunity to be embraced by a small town.• Family oriented - parks and picnic area.• Let’s get a committee together of an array of age groups: people with kids and without.• More word of mouth advertising
Downtown Development District PlanChapter 9. Appendix

Page | 151 Final Plan
Q19. Responses Continued:
• We need to get rid of the convenience store across from the post office. It can build where Jays Market was, near WT Chipman to serve that part of the community. It can be far for those people to walk to the shopping centers on the highway. This store would supply a deli and a convenient shopping choice. Stones needs to go! It has always been an eyesore and an embarrassment to Harrington. Once that building is torn down a nicer facility can be constructed to house a nice/upscale eatery/pub with parking. The closed sub shop near Nationwide could become a specialty coffee/tea/bakery, but would need to use the parking lot across the street. The antique stores are nice and draw people who would hopefully eat at some of my previously listed eateries. Some of the remaining buildings may need to have some work done on them in order to draw businesss on the street level for shoppers and professional businesses on the upper floors. This small, intense shopping area can become a highly positive influence on Harrington.
• Not sure.• Create a rail with trail for bikes and pedestrians that connects to other towns along the rail road.• Local family owned businesses.• A unique venue.• On the right track with movies and events downtown.• Fix up the existing buildings and encourage new businesses.• More stores. Increased variety of merchandise.• More enforcement with empty buildings that are going to ruin all over town. You may start to get the
downtown looking ok but once they leave that area the rest of the city is NOT attractive with empty housing.• I feel having a historic district that extends one block past the Methodist church on Commerce Street would
help make the area more attractive and bring the history of Harrington to life.• I wish businesses would band together to promote doing business in Harrington.• Offer more modern ideas without losing the small town feel, keep the community involved.• Variety in stores, lots of knick knack stores and they’re not that widely appealing.• We absolutely need a park with a playground for the kids. Even if it’s small, it would be great.• Keep the small town feel, but make it aesthetically pleasing and easy to get to.• I don’t know.• I’d like to know how many towns have done this and are successful 3, 5 yrs down the road. What did they do?
How have they maintained it?• Less city government restrictions to make it more desirable to move, work and build a business in town.• Having some type of gimmick, ie. Milford has the river walk and Georgetown has the circle. Harrington needs
something to set it apart and make it special.• I think one of the main things that needs to be be done is to clean up the entire town. I think there are codes on
the books for type of furniture on porches, junk piled in yards, cars sitting in yards that don’t run. I also think landlords need to improve rentals. Many are in need of repairs and I have a feeling many are not up to codes.
• I wish i did.• The train station is a terrible eyesore-fix it and paint it! Fix Railroad Avenue along the fence - parking is a mess!
No loitering on street corners and in front of businesses.
Q20.I have completed the Resident/Visitor section of the survey.Answered: 74 Skipped: 16
Answer Choices Responses
Yes 100.00% 74
0% 20% 40% 60% 80% 100%
Yes
Downtown Development District PlanChapter 9. Appendix

Page | 152 Final Plan
Q21.If you own a business downtown, do you have a need to expand?Answered: 5 Skipped: 85
Answer Choices Responses
Yes 40.00% 2
No 20.00% 1
Maybe 0.00% 0
I own a business, but it is not located downtown
40.00% 2
Q22.What would you need to expand your business downtown?Answered: 4 Skipped: 86
Answer Choices Responses
New building 25.00% 1
Available space 50.00% 2
Parking 25.00% 1
Capital/funding 25.00% 1
Localized incentives 25.00% 1
Other (please specify) 25.00% 1
Write-Ins:
• None
Q23.Are you committed to keeping your business downtown?Answered: 5 Skipped: 85
Answer Choices Responses
Yes 40.00% 2
No 60.00% 3
Comments:
• taxes taxes taxes
0% 10% 20% 30% 40% 50%
I own a business, but it is notlocated downtown
Maybe
No
Yes
0% 10% 20% 30% 40% 50% 60%
Other (please specify)
Localized incentives
Capital/funding
Parking
Available space
New building
0% 10% 20% 30% 40% 50% 60% 70%
No
Yes
Downtown Development District PlanChapter 9. Appendix

Page | 153 Final Plan
Q24.Would you be interested in a downtown incentive/discount program?Answered: 4 Skipped: 86
Answer Choices Responses
Yes 75.00% 3
No 25.00% 1
Q25.If programs were available, could your business use information on or assistance with the following topics?Answered: 4 Skipped: 86
Definitely Probably UnsureProbably
NotDefinitely
NotTotal
Weighted Average
Business planning 25.00%/1 25.00%/1 0.00%/0 0.00%/0 50.00%/2 4 3.25
Small Business loans 25.00%/1 0.00%/0 25.00%/1 0.00%/0 50.00%/2 4 3.50
Obtaining permits for expansion 33.33%/1 0.00%/0 33.33%/1 0.00%/0 33.33%/1 3 3.00
Financial management 0.00%/0 33.33%/1 0.00%/0 0.00%/0 66.67%/2 3 4.00
Marketing/branding/advertising 25.00%/1 25.00%/1 0.00%/0 0.00%/0 50.00%/2 4 3.25
Employee hiring/training 0.00%/0 0.00%/0 0.00%/0 0.00%/0 100.0%/4 4 5.00
Customer service/hospitality 0.00%/0 33.33%/1 0.00%/0 0.00%/0 66.67%/2 3 4.00
Building improvements 25.00%/1 0.00%/0 25.00%/1 0.00%/0 50.00%/2 4 3.50
Window/interior store displays 33.33%/1 0.00%/0 0.00%/0 0.00%/0 66.67%/2 3 3.67
Internet service 50.00%/2 0.00%/0 0.00%/0 0.00%/0 50.00%/2 4 3.00
E-commerce/web design 0.00%/0 0.00%/0 0.00%/0 0.00%/0 100.0/3 3 5.00
Buying/selling a business 0.005/0 0.00%/0 0.00%/0 0.00%/0 100.0%/3 3 5.00
Comment: Harrington can’t handle their own issues sure don’t know how to run a business.
0% 10% 20% 30% 40% 50% 60% 70% 80%
No
Yes
0 1 2 3 4 5 6
Buying/selling a business
E-commerce/web design
Internet service
Window/interior store displays
Building improvements
Customer service/hospitality
Employee hiring/training
Marketing/branding/advertising
Financial management
Obtaining permits for expansion
Small Business loans
Business planning
Downtown Development District PlanChapter 9. Appendix

Page | 154 Final Plan
Q26.How useful to your business are/could be the following services?Answered: 4 Skipped: 86
Very Useful
Useful UselessDon’t Know
TotalWeighted Average
Group business training (e.g., workshops, speakers)
0.00%0
25.00%1
75.00%3
0.00%0
4 2.75
Cooperative advertising coordination0.00%
050.00%
250.00%
20.00%
04 2.50
Marketing of the downtown as a shopping destination
25.00%1
25.00%1
50.00%2
0.00%0
4 2.25
Facade grants25.00%
125.00%
150.00%
20.00%
04 2.25
Public improvement projects25.00%
125.00%
150.00%
20.00%
04 2.25
Business directories, brochures, maps25.00%
125.00%
150.00%
20.005
04 2.25
Website or internet resources0.00%
050.00%
250.00%
20.00%
04 2.50
Retail event coordination25.00%
125.00%
150.00%
20.00%
04 2.25
Special event coordination25.00%
125.00%
150.00%
20.00%
04 2.25
Downtown-wide WiFi25.00%
125.00%
150.00%
20.00%
04 2.25
Formation of a downtown merchants’ association
25.00%1
25.00%1
50.00%2
0.00%0
4 2.25
0 0.5 1 1.5 2 2.5 3
Formation of a downtown merchants'…
Downtown-wide WiFi
Special event coordination
Retail event coordination
Website or internet resources
Business directories, brochures, maps
Public improvement projects
Façade grants
Marketing of the downtown as a shopping…
Cooperative advertising coordination
Group business training (e.g., workshops,…
Downtown Development District PlanChapter 9. Appendix

Page | 155 Final Plan
Q27.Iffinancialassistancewereavailable,wouldyouconsiderbuildingimprovements such as facade work or new signage?Answered: 4 Skipped: 86
Answer Choices Responses
Yes 50.00% 2
No 50.00% 2
Q28.What are your business’ busiest and slowest months?Answered: 3 Skipped: 87
Busiest Month(s) Slowest Month(s)
• April thru December• March - October• June, July, August
• January thru March• November - February• December
Q29.What are your business’ hours of operation for both your busiest and slowest months?Answered: 2 Skipped: 88
Busiest Month(s) Slowest Month(s)
• 10:30 / 5• 9:00am to 6:00pm
• 10:30 / 5• 9:00am to 6:00pm
Q30.What are your thoughts on store hours?Answered: 4 Skipped: 86
Answer Choices Responses
I am open all the hours I need to be 50.00% 2
I can’t be open more for personal reasons
0.00% 0
I would like to be open more hours but can’t afford the staff
0.00% 0
I would like to be open more hours but can’t find good staff
0.00% 0
I would be open more hours if I were sure of sales
50.00% 2
I would be open more hours if everyone else were
0.00% 0
0% 10% 20% 30% 40% 50% 60%
No
Yes
0% 10% 20% 30% 40% 50% 60%
I would be open more hours if everyoneelse were
I would be open more hours if I were sureof sales
I would like to be open more hours butcan't find good staff
I would like to be open more hours butcan't afford the staff
I can't be open more hours for personalreasons
I am open all the hours I need to be
Downtown Development District PlanChapter 9. Appendix

Page | 156 Final Plan
Q31.Would you be interested in expanding your hours for special events?Answered: 4 Skipped: 86
Answer Choices Responses
Yes 50.00% 2
No 50.00% 2
Q32.How many people, including owners, does your business employ in each of the following categories?Answered: 2 Skipped: 88
Full time (32 or more hours per week) year-round
Part time, year-round Seasonal
• 2• 4
• 2 • 2
Q33.How important are the following consumer segments to your business?Answered: 3 Skipped: 87
Very important Important Not important Not sure Total Weighted Avg.
Males 100.00%/2 0.00%/0 0.00%/0 0.00%/0 2 1.00
Females 100.00%/2 0.00%/0 0.00%/0 0.00%/0 2 1.00
Age: Under 18 100.00%/2 0.00%/0 0.00%/0 0.00%/0 2 1.00
Age: 18-24 100.00%/2 0.00%/0 0.00%/0 0.00%/0 2 1.00
Age: 25-44 100.00%/2 0.00%/0 0.00%/0 0.00%/0 2 1.00
Age: 45-64 100.00%/1 0.00%/0 0.00%/0 0.00%/0 1 1.00
Age: 65+ 100.00%/1 0.00%/0 0.00%/0 0.00%/0 1 1.00
Harrington residents 66.67%/2 0.00%/0 33.33%/1 0.00%/0 3 1.67
Regional residents (outside Harrington)
100.00%/2 0.00%/0 0.00%/0 0.00%/0 2 1.00
Downtown employees 50.00%/1 0.00%/0 50.00%/1 0.00%/0 2 2.00
Students 33.33%/1 33.33%/1 33.33%/1 0.00%/0 3 2.00
Tourists and visitors 50.00%/1 0.00%/0 50.00%/1 0.00%/0 2 2.00
0% 10% 20% 30% 40% 50% 60%
No
Yes
0 0.5 1 1.5 2 2.5
Tourists and visitors
Students
Downtown employees
Regional residents (outside Harrington)
Harrington residents
Age: 65+
Age: 45-64
Age: 25-44
Age: 18-24
Age: Under 18
Females
Males
Downtown Development District PlanChapter 9. Appendix

Page | 157 Final Plan
Q34.What are some of the major barriers or obstacles facing your business today?Answered: 2 Skipped: 88
Answer Choice Responses
Customer traffic (not enough/shrinking) 50.00% 1
Property improvements (e.g., facade) 0.00% 0
Cost of rent/property 50.00% 1
Availability of telecommunications services 0.00% 0
Cash flow/working capital 0.00% 0
General operating costs 0.00% 0
Outdated machinery/technology 0.00% 0
City/County/State codes or regulations 50.00% 1
Skill level/preparation of employees 0.00% 0
Current economic conditions 50.00% 1
Public safety/crime 0.00% 0
Parking 50.00% 1
Congestion/traffic 0.00% 0
Payroll costs 0.00% 0
Competition 0.00% 0
Insurance costs 0.00% 0
Availability of employees 0.00% 0
Computer/technology issues 0.00% 0
Other (please specify) 0.00% 0
0% 10% 20% 30% 40% 50% 60%
Other (please specify)
Availability of employees
Competition
Congestion/traffic
Public safety/crime
Skill level/preparation of employees
Oudated machinery/technology
Cash flow/working capital
Cost of rent/property
Customer traffic (not enough/shrinking)
Downtown Development District PlanChapter 9. Appendix

Page | 158 Final Plan
Q35.How do you reach potential customers?Answered: 4 Skipped: 86
Answer Choices Responses
Newspapers 25.00% 1
Magazines 0.00% 0
Radio 0.00% 0
Television 0.00% 0
Yellow Pages 25.00% 1
Direct Mail/Catalogs 0.00% 0
Window Displays 50.00% 2
Billboards 0.00% 0
Word of Mouth 50.00% 2
Internet 75.00% 3
Local Service Organizations 0.00% 0
Referrals 75.00% 3
Other (please specify) 25% 1
Write-Ins: Signs
Q36.Home Zip CodeAnswered: 75 Skipped: 15
Zip Code City/Town No. Responses Zip Code City/Town No. Responses
19952 Harrington, DE 50 19943 Felton, DE 7
19904 Dover, DE 3 19963 Milford, DE 3
19901 Dover, DE 2 19947 Georgetown, DE 1
19950 Greenwood, DE 1 19954 Houston, DE 1
19960 Lincoln, DE 1 19709 Middletown, DE 1
19801 Wilmington, DE 1 19806 Wilmington, DE 1
21875 Delmar, MD 1
0% 10% 20% 30% 40% 50% 60% 70% 80%
Other (please specify)Referrals
Local Service OrganizationsInternet
Word of MouthBillboards
Window DisplaysDirect Mail/Catalogs
Yellow PagesTelevision
RadioMagazines
Newspapers
Downtown Development District PlanChapter 9. Appendix

Page | 159 Final Plan
Q37.Work Zip CodeAnswered: 53 Skipped: 37
Zip Code City/Town No. Responses Zip Code City/Town No. Responses
19952 Harrington, DE 19 19901 Dover, DE 6
19963 Milford, DE 4 19904 Dover, DE 3
19943 Felton, DE 3 19933 Bridgeville, DE 1
19934Camden-
Wyoming, DE1 19903 Dover, DE 1
19702 Newark, DE 1 19971 Rehoboth, DE 1
19801 Wilmington, DE 1 20658 Marburg, MD 1
21801 Salisbury, MD 1 n/a Retired 7
Q38.AgeAnswered: 75 Skipped: 15
Answer Choices Responses
Under 18 4.00% 3
18-24 1.33% 1
25-44 26.67% 20
45-64 45.33% 34
65+ 22.67% 17
Q39.GenderAnswered: 70 Skipped: 20
Answer Choices Responses
Male 37.14% 26
Female 62.86% 44
0% 10% 20% 30% 40% 50%
65+
45-64
25-44
18-24
Under 18
0% 10% 20% 30% 40% 50% 60% 70%
Female
Male
Downtown Development District PlanChapter 9. Appendix

Page | 160 Final Plan
Q40.Household’s Annual IncomeAnswered: 62 Skipped: 28
Answer Choices Responses
< $15,000 3.23% 2
$15,000-$24,999 14.52% 9
$25,000-$34,999 14.52% 9
$35,000-$49,999 12.90% 8
$50,000-$74,999 16.13% 10
$75,000-$99,999 16.13% 10
$100,000-$149,999 16.13% 10
$150,000-$199,999 4.84% 3
$200,000+ 1.61% 1
Q41.RaceAnswered: 75 Skipped: 15
Answer Choices Responses
White 93.33% 70
Black or African American 4.00% 3
American Indian & Alaskan Native
0.00% 0
Asian 1.33% 1
Native Hawaiian & Other Pacific Islander
0.00% 0
Other (please specify) 1.33% 1
Write-In: White and African American, you should really let people choose two or more races
Q42.Hispanic OriginAnswered: 45 Skipped: 45
Answer Choices Responses
Hispanic or Latino (of any race)
2.22% 1
Not Hispanic or Latino 97.78% 44
0% 2% 4% 6% 8% 10% 12% 14% 16% 18%
$200,000+
$150,000-$199,999
$100,000-$149,999
$75,000-$99,999
$50,000-$74,999
$35,000-$49,999
$25,000-$34,999
$15,000-$24,999
<$15,000
0% 20% 40% 60% 80% 100%
Other (please specify)
Native Hawaiian and Other Pacific Islander
Asian
American Indian and Alaskan Native
Black or African American
White
0% 20% 40% 60% 80% 100% 120%
Not Hispanic or Latino
Hispanic or Latino (of any race)
Downtown Development District PlanChapter 9. Appendix

Page | 161 Final Plan
News Articles:The Journal - February 3, 2016The Journal - February 10, 2016
The Journal - April 6, 2016The Journal - April 20, 2016
Downtown Development District PlanChapter 9. Appendix

Page | 162 Final Plan
Downtown Development District PlanChapter 9. Appendix

Page | 163 Final Plan
Downtown Development District PlanChapter 9. Appendix

Page | 164 Final Plan
Downtown Development District PlanChapter 9. Appendix

Page | 165 Final Plan
Downtown Development District PlanChapter 9. Appendix

Page | 166 Final Plan
Downtown Development District PlanChapter 9. Appendix

Page | 167 Final Plan
Letters of Support:
State Senator F. Gary Simpson, 18th DistrictState Representative William R. “Bobby” Outten, 30th District
LeFeisha D. Cannon, Power in Praise Ministries, Inc.Marie Gannon, OMG Collage
Catherine D. McKay, Connections Community Support ProgramsViva Poore, Harrington Historical Society
Robert E. Price, Jr., Harrington Senior Center, Inc.Darrin Simpson, Blue Hen Construction
James M. Callaway, Trinity United Methodist Church
Combined Letter of Support:Downtown JunctionBowers Group, LLC
The Clutter Box AntiquesHappy Tails Dog Grooming
Harry Marker LLC t/a Anchors AwayThe Harrington Florist & Cakery
Downtown Development District PlanChapter 9. Appendix

Page | 168 Final Plan
Downtown Development District PlanChapter 9. Appendix

Page | 169 Final Plan
Downtown Development District PlanChapter 9. Appendix

Page | 170 Final Plan
Downtown Development District PlanChapter 9. Appendix

Page | 171 Final Plan
Downtown Development District PlanChapter 9. Appendix

Page | 172 Final Plan
Downtown Development District PlanChapter 9. Appendix

Page | 173 Final Plan
Downtown Development District PlanChapter 9. Appendix

Page | 174 Final Plan
Downtown Development District PlanChapter 9. Appendix

Page | 175 Final Plan
Downtown Development District PlanChapter 9. Appendix

Page | 176 Final Plan
Downtown Development District PlanChapter 9. Appendix

Page | 177 Final Plan
Downtown Development District PlanChapter 9. Appendix

Page | 179 Final Plan
Public Hearing Notice & Public Comments
Downtown Development District PlanChapter 9. Appendix

Page | 180 Final Plan
Downtown Development District PlanChapter 9. Appendix
MC
/TJ,
Wed
nesd
ay, A
pril
27, 2
016
22

Page | 181 Final Plan
Downtown Development District PlanChapter 9. Appendix


Page | 183 Final Plan
Local Enabling Legislation
Downtown Development District PlanChapter 9. Appendix

Page | 184 Final Plan
Downtown Development District PlanChapter 9. Appendix

Page | 185 Final Plan
Websites & Links of Interest
Downtown Development District PlanChapter 9. Appendix

Page | 187 Final Plan
CityCity of Harrington: http://harrington.delaware.gov/2013 Comprehensive Land Use Plan: http://harrington.delaware.gov/comprehensive-land-use-plan/Harrington Fire Company Inc.: http://harringtonfireco.com/Lake Forest South Elementary School: http://www.lf.k12.de.us/south/Lake Forest W.T. Chipman Middle School: http://www.lf.k12.de.us/chipman/Parks & Recreation: http://www.hprnews.com/Police Department: http://harrington.delaware.gov/police-department/Upcoming Events: http://harrington.delaware.gov/events/
LocalKent County Levy Court: www.co.kent.de.usLake Forest Church Association - Food Pantry: https://sites.google.com/site/lakeforestchurchassociation/home
State2015 Strategies for State Policies and Spending: http://www.stateplanning.delaware.gov/strategies/Buy Local: http://dda.delaware.gov/marketing/BuyLocal.shtmlDelaware Public Archives: http://archives.delaware.gov/index.shtmlDelaware State Housing Authority: http://destatehousing.comDelaware Sustainable Energy Utility: www.energizedelaware.orgDelaware Transit Corporation: www.dartfirststate.comDepartment of Agriculture: http://dda.delaware.govDepartment of Economic Development Office: http://dedo.delaware.govDepartment of Health and Social Services: http://dhss.delaware.gov/dhssDepartment of Natural Resources and Environmental Control: http://dnrec.delaware.govDepartment of Transportation: http://deldot.govDowntown Development Districts: http://stateplanning.delaware.gov/dddOffice of State Planning Coordination: http://stateplanning.delaware.govState Historic Preservation Office: http://history.delaware.gov/preservation
FederalFEMA Online Flood Maps: https://msc.fema.gov/portalNational Register of Historic Places: https://www.nps.gov/nr/U.S. Census Bureau: www.census.govU.S. Department of Transportation: https://www.transportation.govU.S. Economic Development Administration: https://www.edu.govU.S. Environmental Protection Agency: https://www3.epa.govU.S. Department of Agriculture: www.usda.gov/wps/portal/usda/usdahomeU.S. Department of Housing and Urban Development: http://portal.hud.gov/hudportal/HUD
Downtown Development District PlanChapter 9. Appendix

Thanks to everyone who contributed to the
City of Harrington Downtown Development District Plan
The Hubof Delaware
City of Harrington Property OwnersOrganizations
MerchantsResidents
It’s good to be in the Hub...