adolescent substance abuse in kentucky · pdf fileadolescent substance abuse in kentucky a...
TRANSCRIPT

ADOLESCENT SUBSTANCE ABUSE IN KENTUCKY
A Report Prepared for the HB 843 Children’s
Workgroup
February, 2004
2
Table of Contents Introduction ......................................................................................................... 3 Levels of Use: A Comparison of National and State Data ……………………..5 Drug Violations in Kentucky’s Schools …………………….…………………...8 Early Intervention Program ……………………………………………………..9 Juvenile Drug Court Data ……………………………………………………10 Department of Juvenile Justice Data ……………………………………………12 Adolescent Treatment in Kentucky Demographics of Adolescents in Treatment ………...………………….13 Referrals Sources ……………………………………………………17 Treatment Gap ……………………………………………………18 Accessibility ……………………………………………………18 Retention ……………………………………………………18 Co-Occurring Disorders ………………………………………………....19 EPSDT ……………………………………………………………20 Statewide Survey ……………………………………………………………21 Conclusions ……………………………………………………………………41 The Future of Adolescent Substance Abuse Treatment ……………………42 Appendix List of HB 843 Regional Planning Council Chairs ……………………44 Strategic Plan Committee Members ……………………………………45
3
Introduction In February 2001, the Kentucky Division of Substance Abuse (DSA) hired a Health Program Administrator to coordinate and promote adolescent substance abuse treatment programs in the state. One of the first tasks was to form a link with the Kentucky Adolescent Substance Abuse Consortium (KASAC), a grassroots organization which started in 1998, and whose mission is to “encourage an increase in the quality and types of treatment services available to alcohol and other drug using adolescents.” In August 2002, a team of five individuals representing DSA, KASAC, the Department of Juvenile Justice (DJJ) and a Regional Mental Health/Mental Retardation Board attended a Leadership Institute held at the Southeast School for Alcohol and Other Drug Programs in Athens, Georgia. The Institute topic was “Substance Abuse Among Juvenile Offenders: Policy Issues for Prevention and Treatment,” and included team members from seven states in the southeast region of the United States. In addition to recommending closer linkages between community-based treatment programs and DJJ, the team recommended the development of a state-wide strategic plan for increasing and improving adolescent prevention and treatment services. (A copy of this report can be found at this link: http://mhmr.chs.ky.gov/sa/kasac.asp ) In the fall of 2002, a steering committee was formed consisting of the Leadership Institute participants and other key stakeholders in order to begin the process of developing such a plan. Meetings were held at the University of Kentucky’s Institute on Women and Substance Abuse and Hazard Community College for the purpose of eliciting support from service providers and deciding on a specific course of action. An “Adolescent Treatment Fact Sheet” and a paper titled “Adolescent Treatment Issues in Kentucky” were developed to provide committee members and others with a consistent set of talking points when discussing the strategic plan with constituents. A survey was designed and administered to those attending a joint conference of KASAC and the Kentucky Association of Student Assistance Professionals in February and the March KASAC meeting in Hopkinsville. The survey was an effort to ascertain views on the strengths, as well as the needs and barriers to more effective adolescent services in local communities and in the state. In April 2003, the survey was mailed to approximately 60 key individuals across the state. The results of this initial mailing, as well as the results from the conference and March meeting were shared with the steering committee in late April. A second rendition of the survey was developed during May and early June with the assistance of Bob Kushner, a Northern Kentucky marketing researcher. Plans were made to administer the revised survey to a newly formed statewide advocacy group. Results were summarized and presented to the strategic planning committee at the annual KASAC meeting held in conjunction with the Kentucky School of Alcohol and Other
4
Drug Studies in July 2003. An overview of the strategic planning process was shared with those attending the Consortium meeting. During August, September and October 2003, surveys were administered to numerous individuals attending meetings and training events across the state. In late October, two committee members met with Mr. Kushner to examine a preliminary report. It was determined that additional surveys from selected areas of the state were needed to add validity to those respective regions’ data. A final effort to administer the survey to individuals from those regions occurred during an adolescent treatment workshop in mid-November. A final report was forwarded to the Division of Substance Abuse and to Northkey Community Care’s Collaboration Director for Youth Substance Abuse Treatment in late November. The initial survey results were shared with the HB 843 Children’s Workgroup in early January 2004. The group recommended changing the format of the survey results and suggested adding other needs assessment data to be forwarded to the HB 843 Regional Planning Councils for review. The initial survey results were shared with several groups representing the state’s Regional Mental Health/Mental Retardation Boards in late January and early February in order to get their input regarding interpretation of survey results. Staff from the Division of Substance Abuse, Northkey Community Care and the University of Kentucky’s Center on Drug and Alcohol Research (CDAR) then finalized the survey format in preparation for this report. Barry Kellond Health Program Administrator Division of Substance Abuse February 2004
5
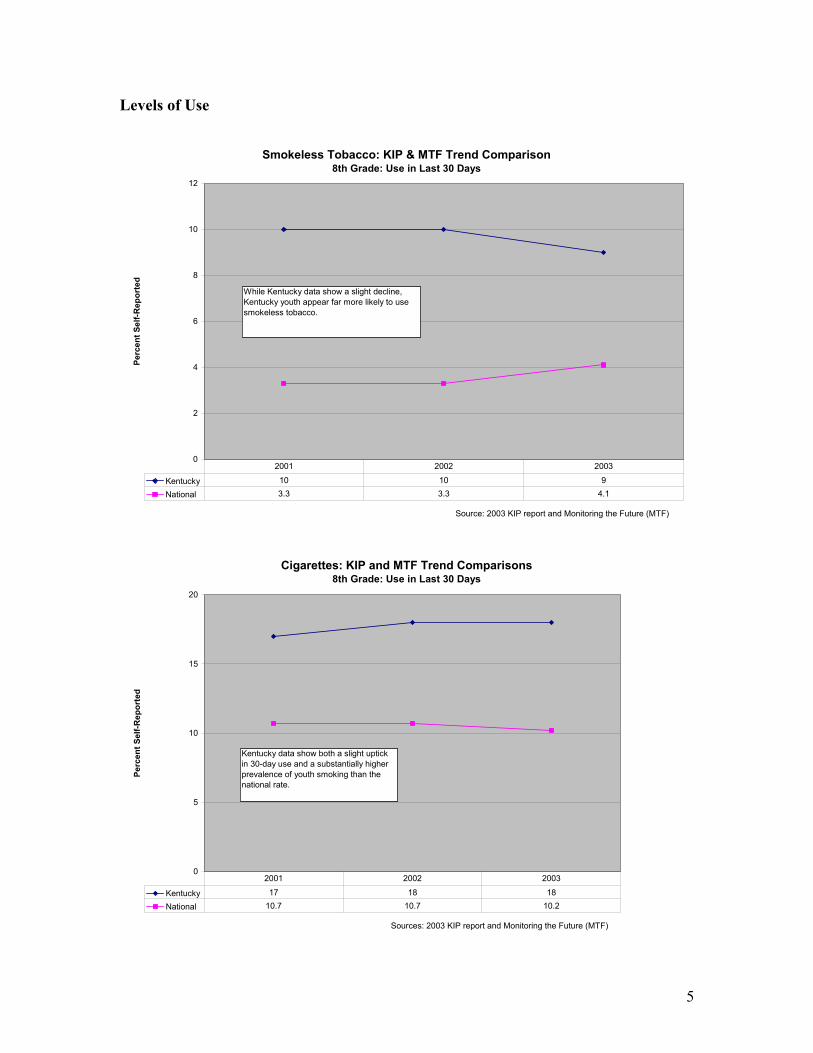
Levels of Use
Smokeless Tobacco: KIP & MTF Trend Comparison8th Grade: Use in Last 30 Days
0
2
4
6
8
10
12
Source: 2003 KIP report and Monitoring the Future (MTF)
Perc
ent S
elf-R
epor
ted
Kentucky 10 10 9
National 3.3 3.3 4.1
2001 2002 2003
While Kentucky data show a slight decline, Kentucky youth appear far more likely to use smokeless tobacco.
Cigarettes: KIP and MTF Trend Comparisons 8th Grade: Use in Last 30 Days
0
5
10
15
20
Sources: 2003 KIP report and Monitoring the Future (MTF)
Perc
ent S
elf-R
epor
ted
Kentucky 17 18 18
National 10.7 10.7 10.2
2001 2002 2003
Kentucky data show both a slight uptick in 30-day use and a substantially higher prevalence of youth smoking than the national rate.
6
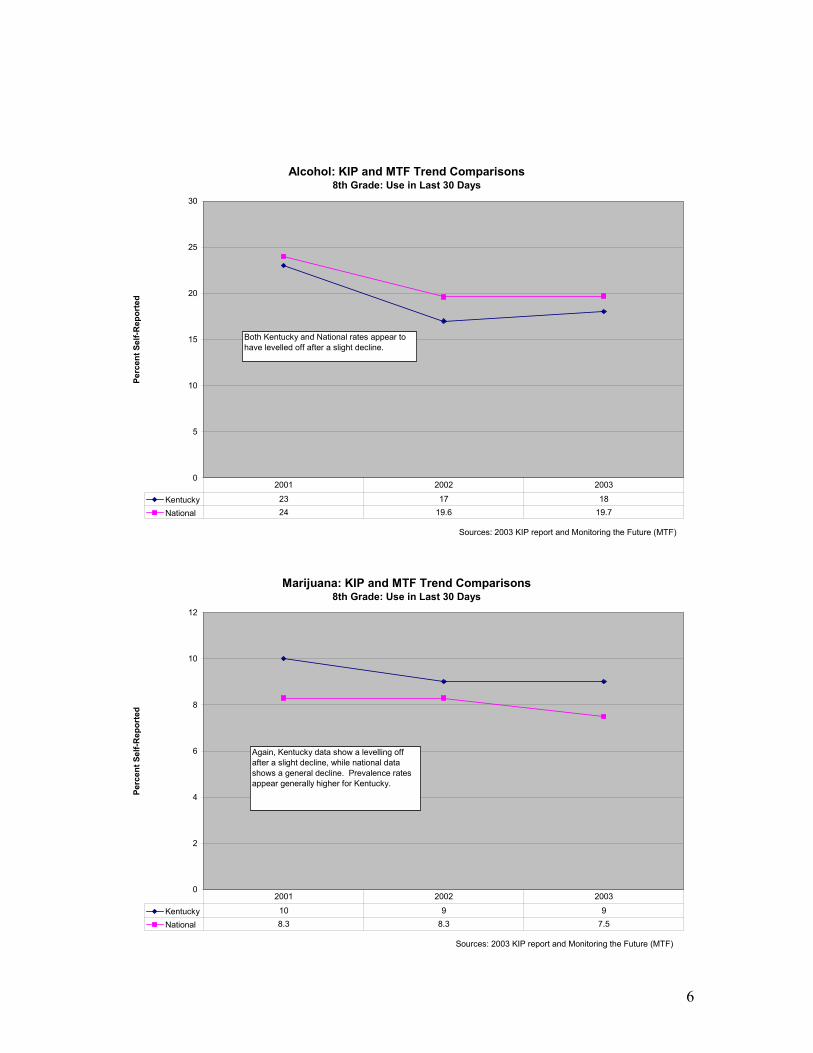
Alcohol: KIP and MTF Trend Comparisons8th Grade: Use in Last 30 Days
0
5
10
15
20
25
30
Sources: 2003 KIP report and Monitoring the Future (MTF)
Perc
ent S
elf-R
epor
ted
Kentucky 23 17 18
National 24 19.6 19.7
2001 2002 2003
Both Kentucky and National rates appear to have levelled off after a slight decline.
Marijuana: KIP and MTF Trend Comparisons8th Grade: Use in Last 30 Days
0
2
4
6
8
10
12
Sources: 2003 KIP report and Monitoring the Future (MTF)
Perc
ent S
elf-R
epor
ted
Kentucky 10 9 9
National 8.3 8.3 7.5
2001 2002 2003
Again, Kentucky data show a levelling off after a slight decline, while national data shows a general decline. Prevalence rates appear generally higher for Kentucky.
7
Binge Drinking Data In the Monitoring the Future National Study, binge drinking was measured by the number of occurrences in which a child drank five or more drinks in a row during the preceding two weeks. In 2003, approximately 28% of twelfth graders reported binge drinking, in comparison to 22% of tenth graders and 12% of eighth graders. The instances of reported binge drinking seem to increase with age according to the Monitoring the Future data (See Binge Drinking Table below). The same study showed that in 2003, less than half of children surveyed reported that binge drinking carried a ‘great risk’ in their opinion. Binge Drinking as measured by 5+ Drinks in a row in last 2 weeks
8th graders
10th graders
12th graders
2000 14.1% 26.2% 30.0% 2001 13.2% 24.9% 29.7% 2002 12.4% 22.4% 28.6% 2003 11.9% 22.2% 27.9% (Source: Monitoring the Future Study, University of Michigan) www.monitoringthefuture.org A local study called Kentucky Incentive for Prevention (KIP) measured binge drinking in the 2002 and 2003 survey with the same measure as Monitoring the Future Study (5+ drinks in a row in last 2 weeks). In 2003, approximately 29% of twelfth graders reported binge drinking compared to 23% of tenth graders and 11% of eighth graders. Kentucky and national trends appear to be similar, with binge drinking increasing with age. However, in 2003, slightly more tenth and twelfth graders in Kentucky reported more binge drinking than nationally (See Binge Drinking Table below). Binge Drinking as measured by 5+ Drinks in a row in last 2 weeks
8th graders
10th graders
12th graders
2002 11.0% 25.0% 30.0% 2003 11.0% 23.0% 29.0% (Source: KIP Student Survey, Division of Substance Abuse)
8
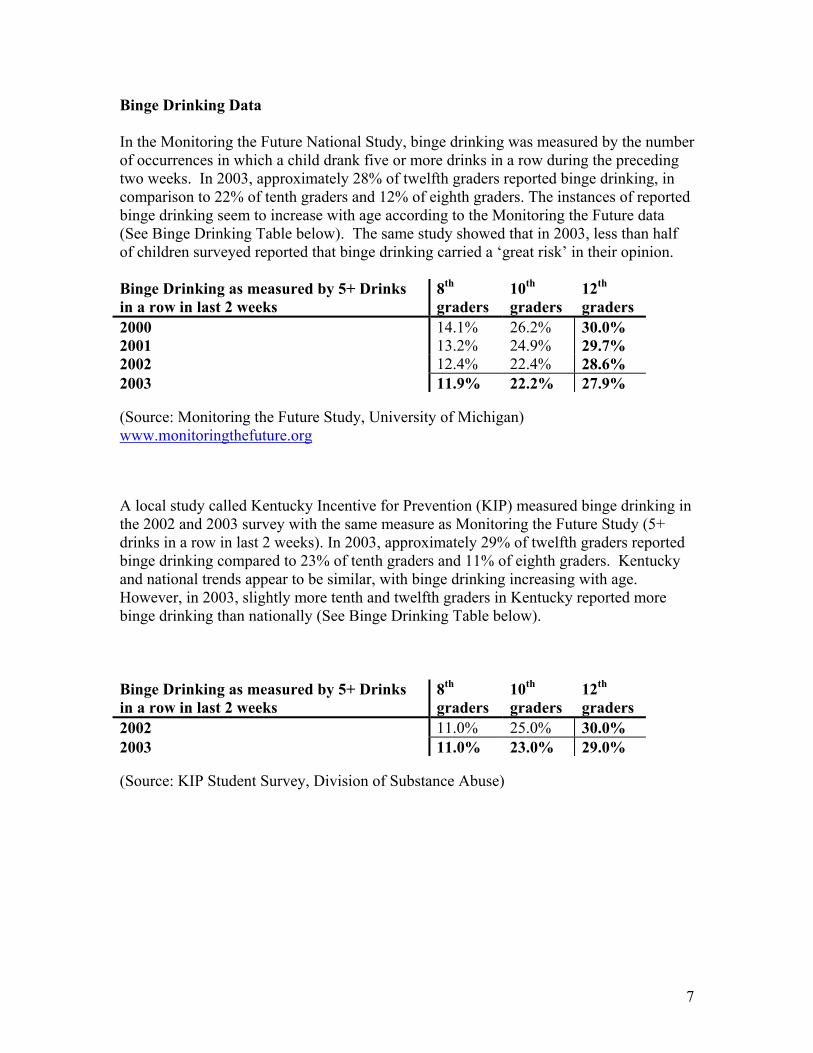
Drug Violations in Kentucky’s Schools The following chart illustrates the number of drug policy violations in the state. Although the number of violations during the 02-03 school year decreased from the previous two years, they remain high, especially when compared to other types of violations.
Drug Abuse Violations
29873052
2811
260027002800290030003100
00-01 01-02 02-03
School Year
Num
ber
Total Disciplinary Actions for Part II Law Violations
0
500
1000
1500
2000
2500
3000
3500
00-01 1925 537 2987 167 260 63 183 297 406 15
01-02 1461 796 3052 168 207 163 234 323 563 73
02-03 1484 760 2811 211 194 173 134 343 303 74 272 35 2
Assault - Ot her
Disorderly Conduct
Drug Abuse Violat ions
Drunkenness
Liquor LawsSex
Of f enses St olen
Propert y Vandalism
All Ot her Of f enses
Curf ew and Loit er ing
Terror ist ic Threat
Terror ist ic Bomb
Terroist ic- Chem/ Bio/
(Source: Center for School Safety)
9
Early Intervention Program
This Division of Substance Abuse-sponsored program targets youth who have been seen by Court Designated Workers due to their involvement in activities resulting in legal charges for substance abuse or violence, and who are eligible for court diversion, although adolescents referred by other sources may also participate in the program. The program is designed to provide intensive education for the youth, their parents and siblings; screen for substance use and violence as it is associated with alcohol and drugs, and make referrals to community resources for assessment and treatment when indicated. For more information about this program, refer to the following website: http://mhmr.chs.ky.gov/sa/eip.asp
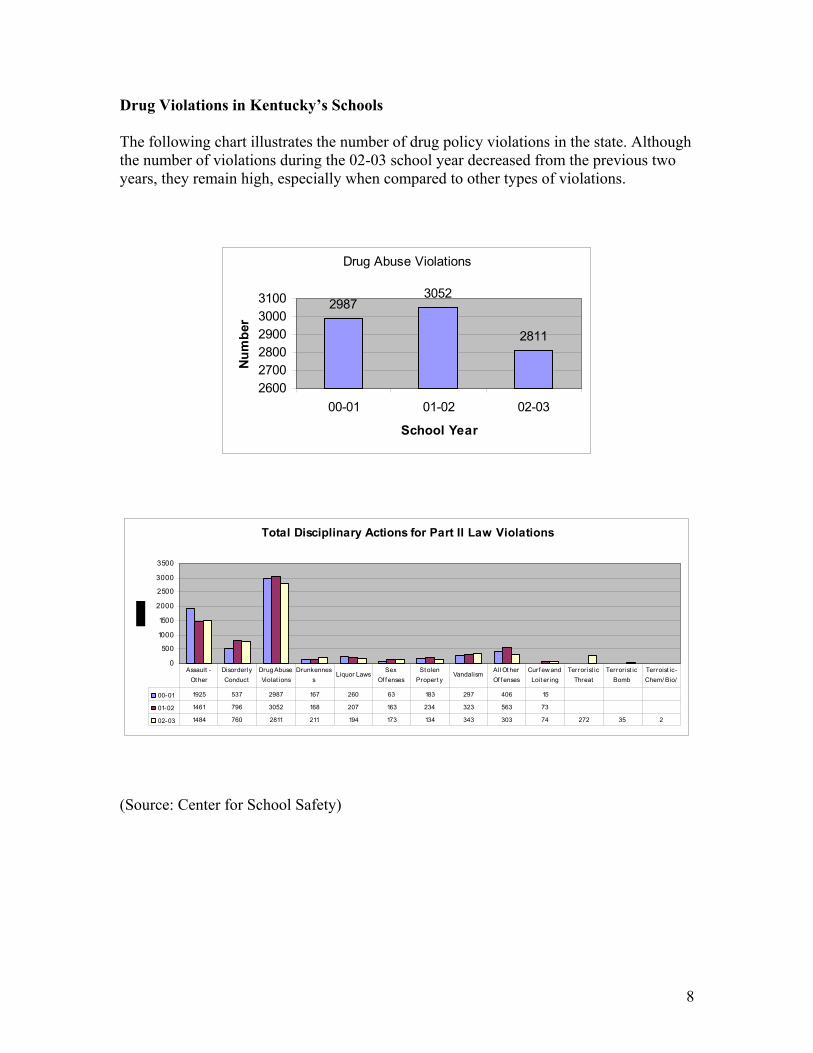
Below is a chart listing referral sources to the Early Intervention Program during FY 03:
Referral Source Number of Referrals Court Designated Worker 751 Juvenile Court 360 Drug Court 36 School 883 DCBS 23 Traffic Court 1082 DJJ 110 Other 144 Total 3389
Number of youth who attended an impact class with their parent(s): 2520
Number of youth completing a prevention/education class: 2006
Number of youth referred to treatment: 367
(Source: Division of Substance Abuse)
10
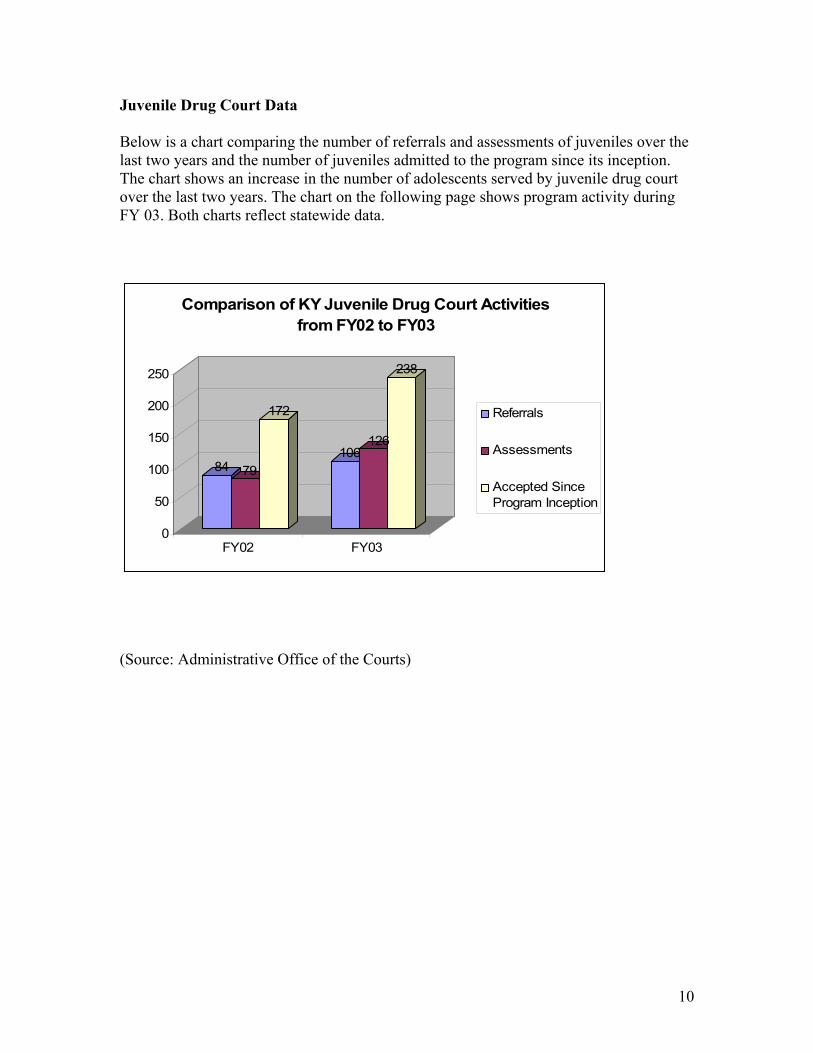
Juvenile Drug Court Data Below is a chart comparing the number of referrals and assessments of juveniles over the last two years and the number of juveniles admitted to the program since its inception. The chart shows an increase in the number of adolescents served by juvenile drug court over the last two years. The chart on the following page shows program activity during FY 03. Both charts reflect statewide data.
84 79
172
106126
238
0
50
100
150
200
250
FY02 FY03
Comparison of KY Juvenile Drug Court Activities from FY02 to FY03
Referrals
Assessments
Accepted SinceProgram Inception
(Source: Administrative Office of the Courts)
11
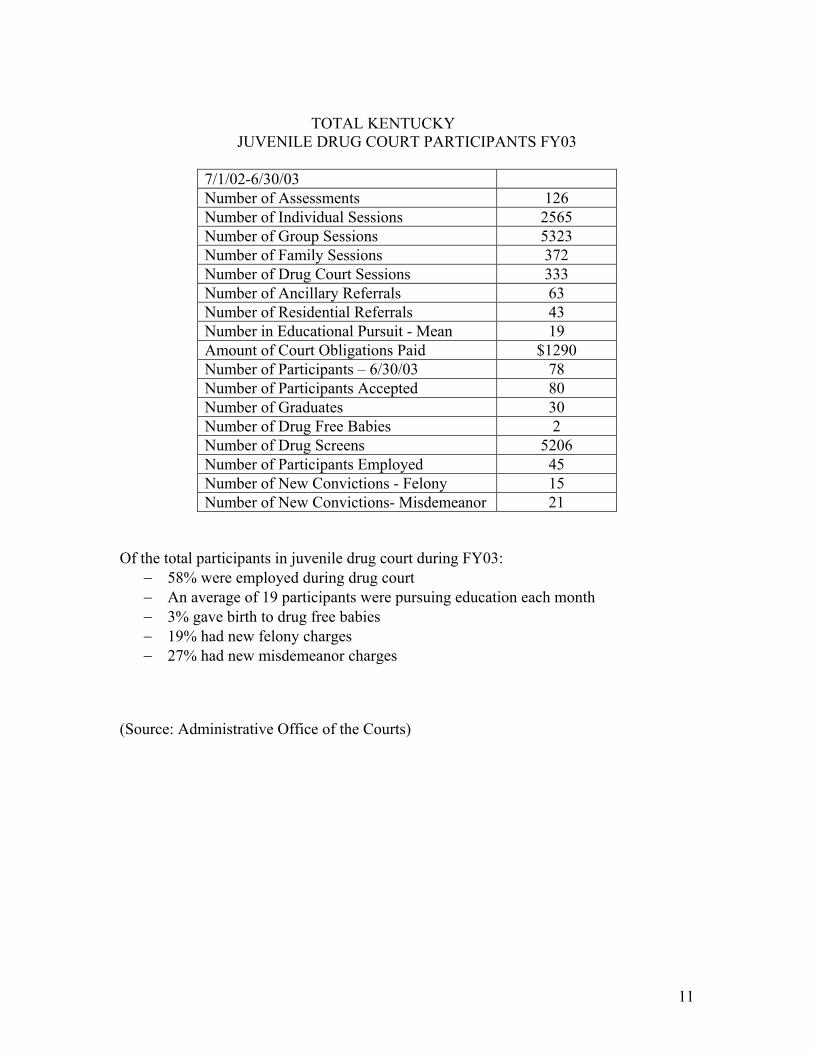
TOTAL KENTUCKY
JUVENILE DRUG COURT PARTICIPANTS FY03
7/1/02-6/30/03 Number of Assessments 126 Number of Individual Sessions 2565 Number of Group Sessions 5323 Number of Family Sessions 372 Number of Drug Court Sessions 333 Number of Ancillary Referrals 63 Number of Residential Referrals 43 Number in Educational Pursuit - Mean 19 Amount of Court Obligations Paid $1290 Number of Participants – 6/30/03 78 Number of Participants Accepted 80 Number of Graduates 30 Number of Drug Free Babies 2 Number of Drug Screens 5206 Number of Participants Employed 45 Number of New Convictions - Felony 15 Number of New Convictions- Misdemeanor 21
Of the total participants in juvenile drug court during FY03:
− 58% were employed during drug court − An average of 19 participants were pursuing education each month − 3% gave birth to drug free babies − 19% had new felony charges − 27% had new misdemeanor charges
(Source: Administrative Office of the Courts)
12
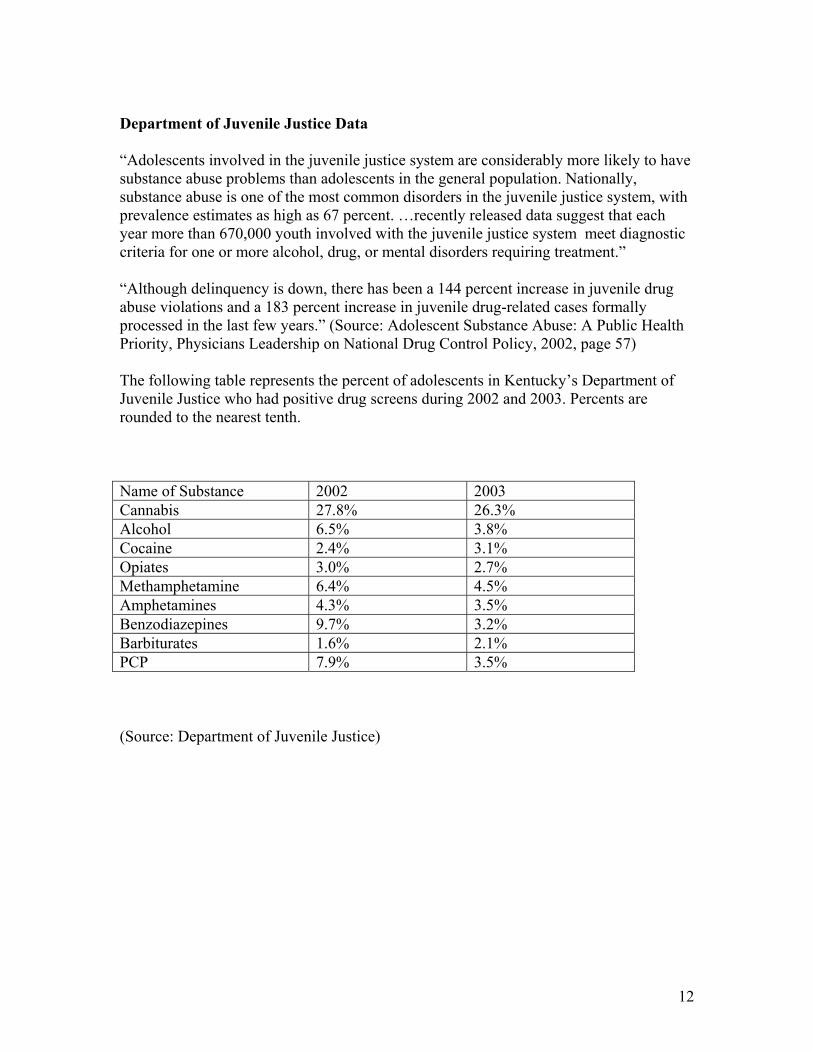
Department of Juvenile Justice Data “Adolescents involved in the juvenile justice system are considerably more likely to have substance abuse problems than adolescents in the general population. Nationally, substance abuse is one of the most common disorders in the juvenile justice system, with prevalence estimates as high as 67 percent. …recently released data suggest that each year more than 670,000 youth involved with the juvenile justice system meet diagnostic criteria for one or more alcohol, drug, or mental disorders requiring treatment.” “Although delinquency is down, there has been a 144 percent increase in juvenile drug abuse violations and a 183 percent increase in juvenile drug-related cases formally processed in the last few years.” (Source: Adolescent Substance Abuse: A Public Health Priority, Physicians Leadership on National Drug Control Policy, 2002, page 57) The following table represents the percent of adolescents in Kentucky’s Department of Juvenile Justice who had positive drug screens during 2002 and 2003. Percents are rounded to the nearest tenth. Name of Substance 2002 2003 Cannabis 27.8% 26.3% Alcohol 6.5% 3.8% Cocaine 2.4% 3.1% Opiates 3.0% 2.7% Methamphetamine 6.4% 4.5% Amphetamines 4.3% 3.5% Benzodiazepines 9.7% 3.2% Barbiturates 1.6% 2.1% PCP 7.9% 3.5% (Source: Department of Juvenile Justice)
13
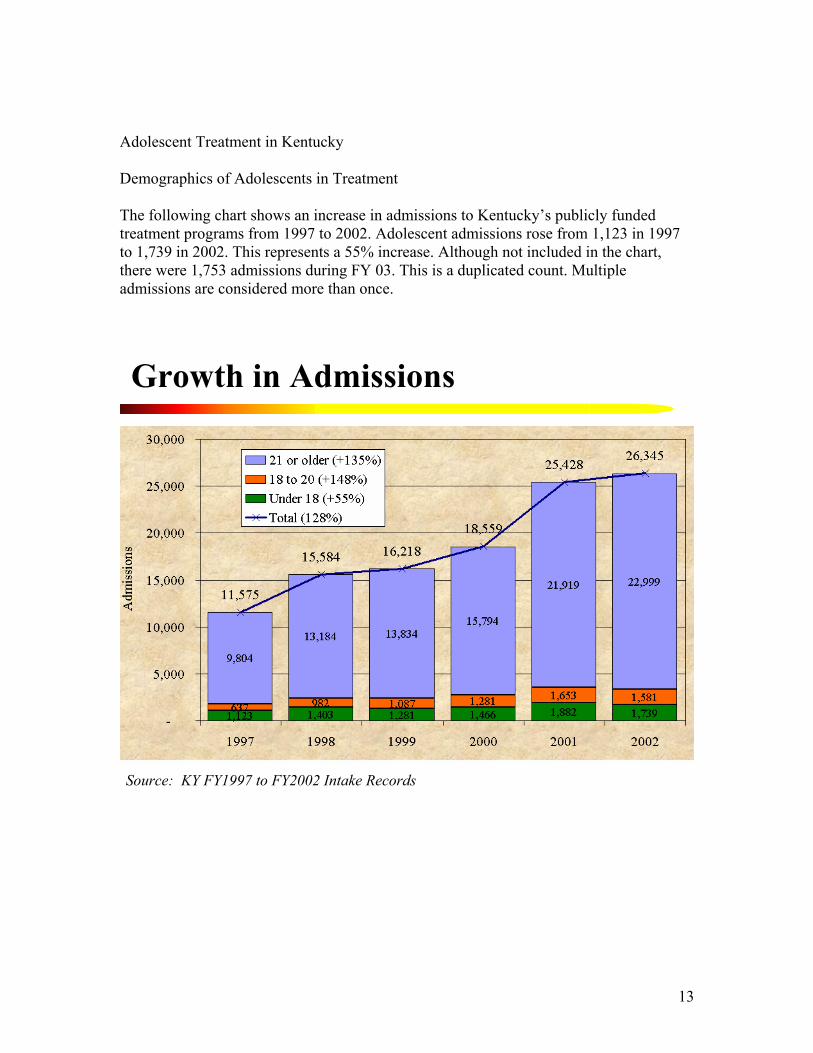
Adolescent Treatment in Kentucky Demographics of Adolescents in Treatment The following chart shows an increase in admissions to Kentucky’s publicly funded treatment programs from 1997 to 2002. Adolescent admissions rose from 1,123 in 1997 to 1,739 in 2002. This represents a 55% increase. Although not included in the chart, there were 1,753 admissions during FY 03. This is a duplicated count. Multiple admissions are considered more than once.
Growth in Admissions
Source: KY FY1997 to FY2002 Intake Records
14
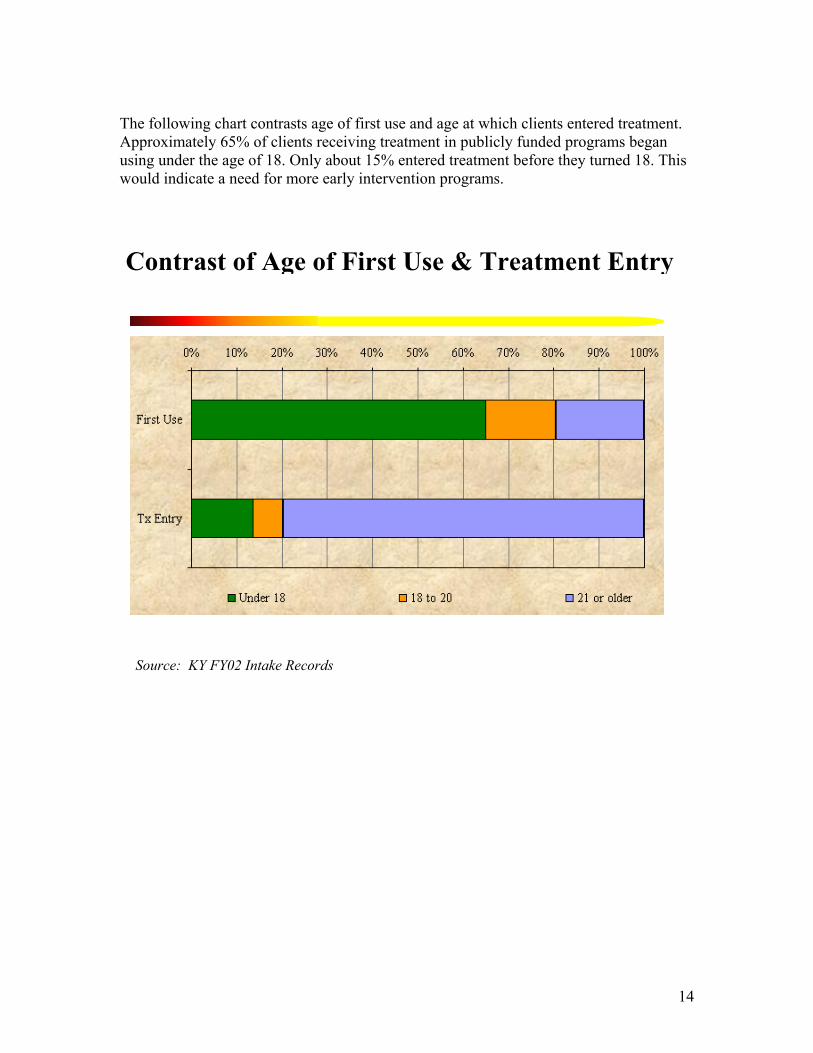
The following chart contrasts age of first use and age at which clients entered treatment. Approximately 65% of clients receiving treatment in publicly funded programs began using under the age of 18. Only about 15% entered treatment before they turned 18. This would indicate a need for more early intervention programs.
Contrast of Age of First Use & Treatment Entry
Source: KY FY02 Intake Records
15
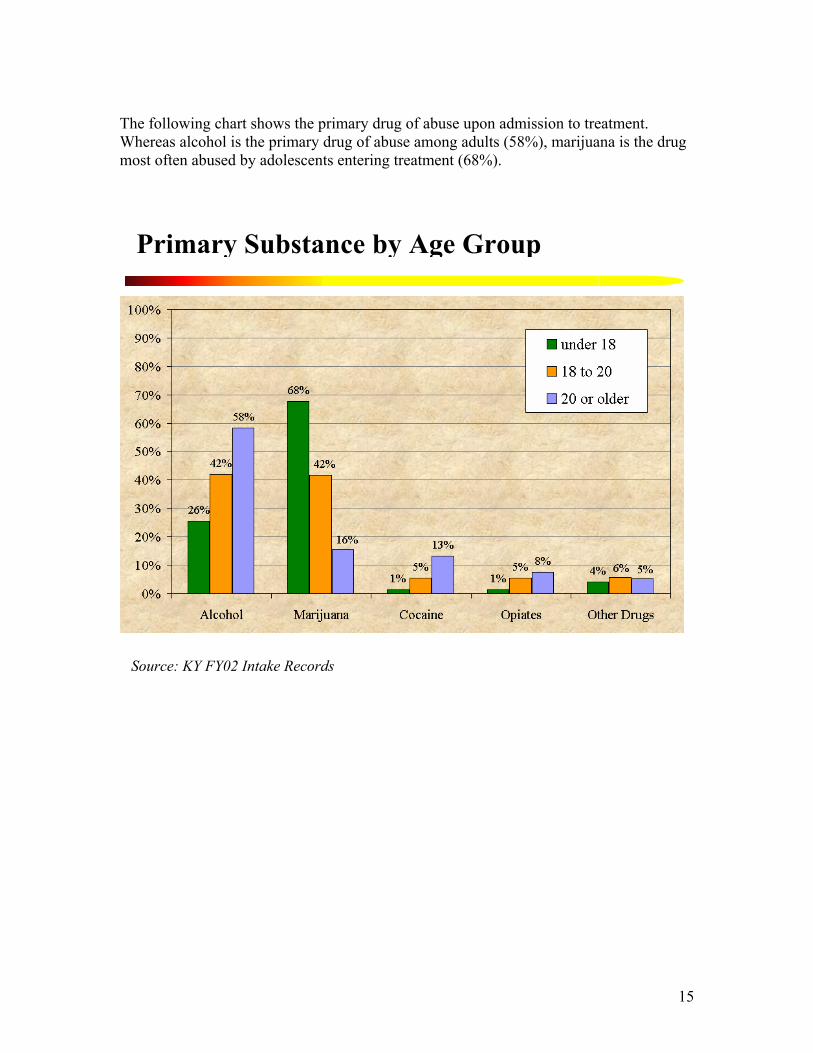
The following chart shows the primary drug of abuse upon admission to treatment. Whereas alcohol is the primary drug of abuse among adults (58%), marijuana is the drug most often abused by adolescents entering treatment (68%).
Primary Substance by Age Group
Source: KY FY02 Intake Records
16
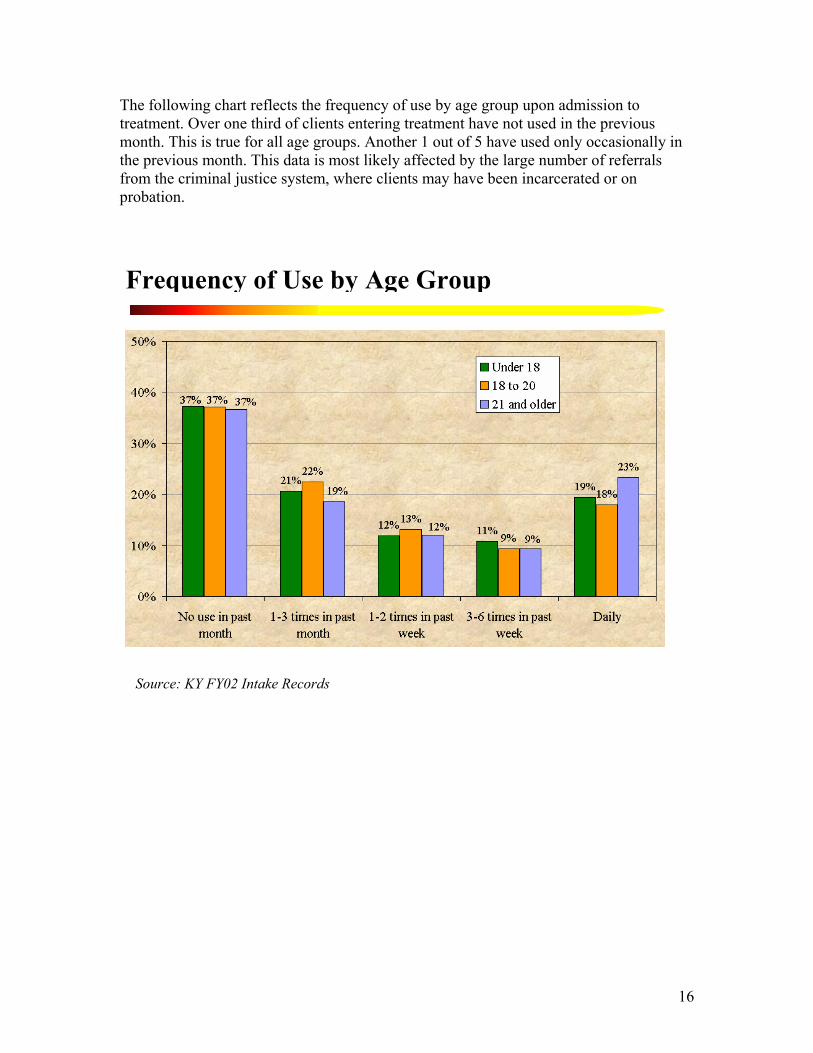
The following chart reflects the frequency of use by age group upon admission to treatment. Over one third of clients entering treatment have not used in the previous month. This is true for all age groups. Another 1 out of 5 have used only occasionally in the previous month. This data is most likely affected by the large number of referrals from the criminal justice system, where clients may have been incarcerated or on probation.
Frequency of Use by Age Group
Source: KY FY02 Intake Records
17
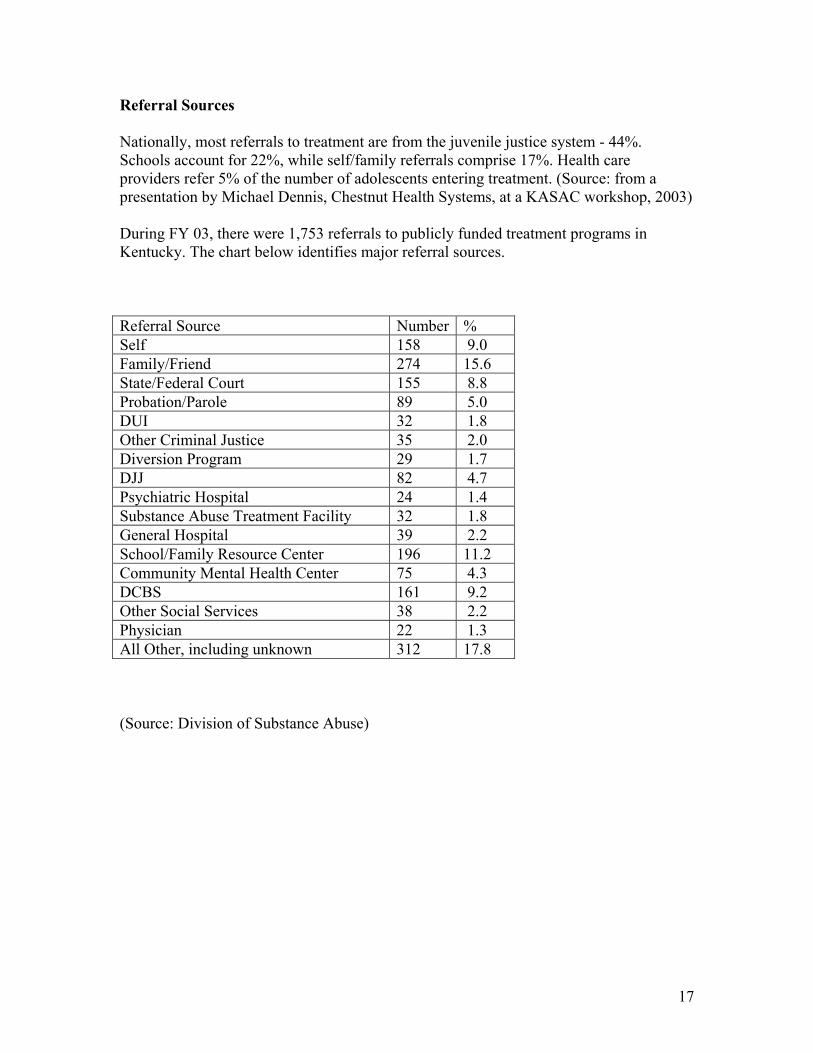
Referral Sources Nationally, most referrals to treatment are from the juvenile justice system - 44%. Schools account for 22%, while self/family referrals comprise 17%. Health care providers refer 5% of the number of adolescents entering treatment. (Source: from a presentation by Michael Dennis, Chestnut Health Systems, at a KASAC workshop, 2003) During FY 03, there were 1,753 referrals to publicly funded treatment programs in Kentucky. The chart below identifies major referral sources. Referral Source Number % Self 158 9.0 Family/Friend 274 15.6 State/Federal Court 155 8.8 Probation/Parole 89 5.0 DUI 32 1.8 Other Criminal Justice 35 2.0 Diversion Program 29 1.7 DJJ 82 4.7 Psychiatric Hospital 24 1.4 Substance Abuse Treatment Facility 32 1.8 General Hospital 39 2.2 School/Family Resource Center 196 11.2 Community Mental Health Center 75 4.3 DCBS 161 9.2 Other Social Services 38 2.2 Physician 22 1.3 All Other, including unknown 312 17.8 (Source: Division of Substance Abuse)
18
Treatment Gap In 1998, the University of Kentucky conducted the Household Survey of Adolescents. This survey, in addition to determining levels of drug use, estimated the percent of adolescents needing treatment based on an abuse or dependency diagnosis per the DSM IV, as well as the number of adolescents who had actually received treatment. Using 2001 census data, it is estimated that 32,500 Kentucky adolescents, or about 10% of the 12-17 year old population, need treatment. It is also estimated that about 4,700 of the 32,500 who needed treatment in 2001 received it. This number is approximately 15% of those who needed treatment, or1 out of 7. Of the 4,700 who received treatment in 2001, about 1,800 received services in a publicly funded Community Mental Health Center, slightly more than 1/3. The remaining 2/3 were seen in privately funded programs. (Source: Division of Substance Abuse) Accessibility There is a shortage of adolescent-specific treatment programs in the state. Of the 339 licensed treatment programs in the state, only 52- or 15%- have structured programming for adolescents. A structured program is defined as having, at minimum, a weekly outpatient group. An adolescent seeking services in a publicly funded treatment center is more likely to encounter a treatment professional trained in adult techniques than one trained specifically to work with adolescents. A list of licensed treatment programs offering structured adolescent services can be found at the following web site: http://mhmr.chs.ky.gov/sa/treatment/files/DTX.asp (Source: Division of Substance Abuse) Retention While less than 10% of adolescents with substance dependence problems receive treatment nationally, less than 50% stay 6 weeks, and 75% stay less than the 3 months recommended by the National Institute on Drug Abuse (NIDA). While no formal study has been done in Kentucky regarding retention, this national data illustrates the difficulty of retaining adolescents in treatment. There is a correlation between length of stay and success rate. The longer an adolescent is engaged in treatment, including continuing care, the greater the chances of long term abstinence. (Source: from a presentation by Michael Dennis, Chestnut Health Systems, at a KASAC workshop, 2003)
19
Co-Occurring Disorders For adolescents entering a mental health or substance abuse treatment program, co-occurring disorders are the norm. Estimates generally range from 50%-90%. It is believed that mental health issues often predate the substance use. Conduct disorders, ADHD, depression, anxiety and post traumatic stress disorder are the most common. Many mental health and substance abuse treatment providers do not have an adequate knowledge base to effectively treat co-occurring disorders. Adolescent clients often do not receive appropriate referrals. There is a need for cross training among providers and collaboration between systems on both a community and state level. (Source: Adolescent Substance Abuse: A Public Health Priority, Physicians Leadership on National Drug Control Policy, 2002, pages 49-53)
20
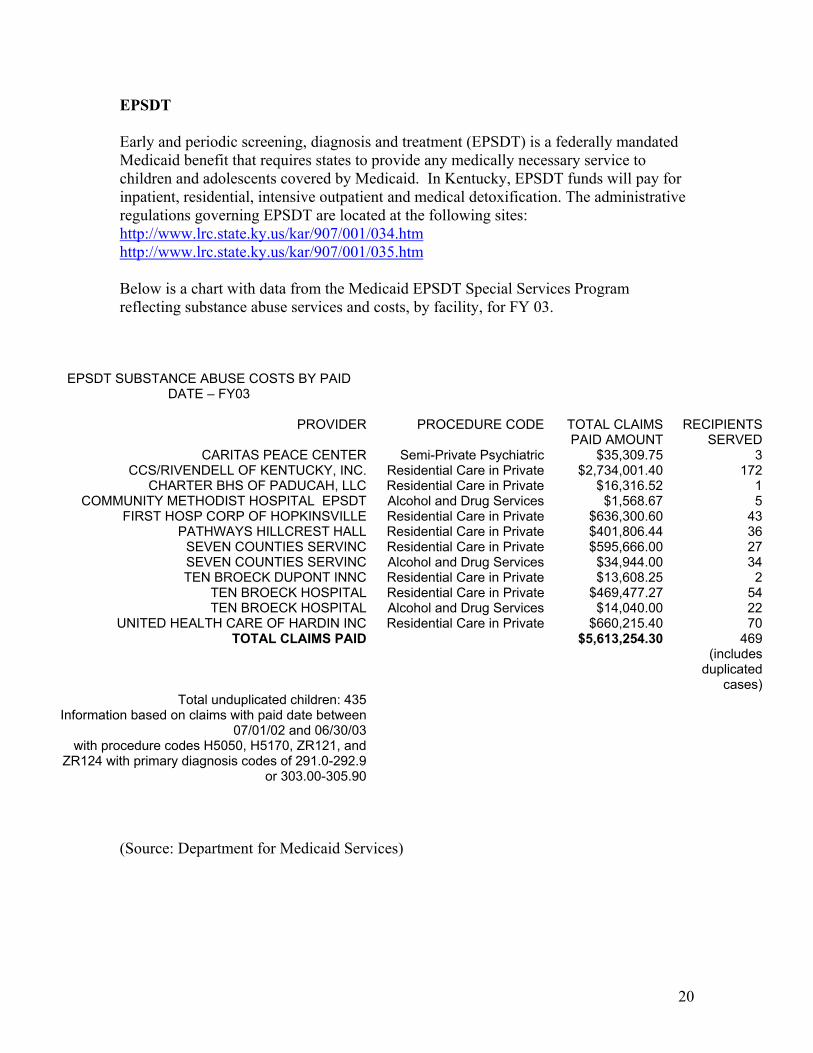
EPSDT Early and periodic screening, diagnosis and treatment (EPSDT) is a federally mandated Medicaid benefit that requires states to provide any medically necessary service to children and adolescents covered by Medicaid. In Kentucky, EPSDT funds will pay for inpatient, residential, intensive outpatient and medical detoxification. The administrative regulations governing EPSDT are located at the following sites: http://www.lrc.state.ky.us/kar/907/001/034.htm http://www.lrc.state.ky.us/kar/907/001/035.htm Below is a chart with data from the Medicaid EPSDT Special Services Program reflecting substance abuse services and costs, by facility, for FY 03.
EPSDT SUBSTANCE ABUSE COSTS BY PAID DATE – FY03
PROVIDER PROCEDURE CODE TOTAL CLAIMS
PAID AMOUNT RECIPIENTS
SERVEDCARITAS PEACE CENTER Semi-Private Psychiatric $35,309.75 3
CCS/RIVENDELL OF KENTUCKY, INC. Residential Care in Private $2,734,001.40 172CHARTER BHS OF PADUCAH, LLC Residential Care in Private $16,316.52 1
COMMUNITY METHODIST HOSPITAL EPSDT Alcohol and Drug Services $1,568.67 5FIRST HOSP CORP OF HOPKINSVILLE Residential Care in Private $636,300.60 43
PATHWAYS HILLCREST HALL Residential Care in Private $401,806.44 36SEVEN COUNTIES SERVINC Residential Care in Private $595,666.00 27SEVEN COUNTIES SERVINC Alcohol and Drug Services $34,944.00 34TEN BROECK DUPONT INNC Residential Care in Private $13,608.25 2
TEN BROECK HOSPITAL Residential Care in Private $469,477.27 54TEN BROECK HOSPITAL Alcohol and Drug Services $14,040.00 22
UNITED HEALTH CARE OF HARDIN INC Residential Care in Private $660,215.40 70TOTAL CLAIMS PAID $5,613,254.30 469
(includes duplicated
cases)Total unduplicated children: 435
Information based on claims with paid date between 07/01/02 and 06/30/03
with procedure codes H5050, H5170, ZR121, and ZR124 with primary diagnosis codes of 291.0-292.9
or 303.00-305.90
(Source: Department for Medicaid Services)
21
Kentucky Statewide Strategic Planfor Adolescent Substance Abuse
Service Needs Assessment Survey
February, 2004

22
BackgroundThe Service Needs Assessment Survey was designed to assist in the development of a statewide strategic plan for increasing and improving adolescent substance abuse services.
Methodology
Respondents included substance abuse prevention and treatment professionals, those who work with adolescents in other settings such as schools and juvenile justice programs, advocates and concerned individuals. All regions of the state were surveyed.
Acknowledgement Our thanks to Bob Kushner, Directions Research, Inc., for his assistance in refining the survey and tabulating the results.
From February through early November, 2003, surveys were administered to individuals attending various meetings and training events sponsored by the Division of Substance Abuse and the Kentucky Adolescent Substance Abuse Consortium. Four-hundred and fifteen surveys were completed.
23
HIGHLIGHTS• Overall in Kentucky, and in each region of the state,
there is a high need for adolescent substance abuse services across the continuum of care.
• Aftercare is consistently rated as the most needed service in the state.
• Prevention, intervention, assessment and identification and individual counseling services are meeting state and regional needs more than school-based services, intensive outpatient, residential, inpatient and aftercare.
• The top three barriers to increasing services are lack of state funds, lack of service options and lack of community awareness of the problem.
24
RespondentRespondentDemographicsDemographics

25
Breakout of Responses
The 415 completed surveys were from the following areas:
Reporting Area Specific Area Count% of
Responses
Western Kentucky Four Rivers 11 2.7Pennyroyal 10 2.5River Valley 9 2.2Lifeskills 19 4.7Communicare 22 5.5
Seven Counties Seven Counties 88 21.8
NorthKey/Comprehend NorthKey 75 18.6Comprehend 7 1.7
Eastern Kentucky Pathways 21 5.2Mountain 21 5.2Kentucky River 24 6.0Cumberland River 10 2.5Adanta 15 3.7
Bluegrass Bluegrass 71 17.6
49 cases returned with area missing. This data included in Total Kentucky.Respondents were allowed to check more than one area where they currently work
26
Respondent DemographicsRespondent Demographics
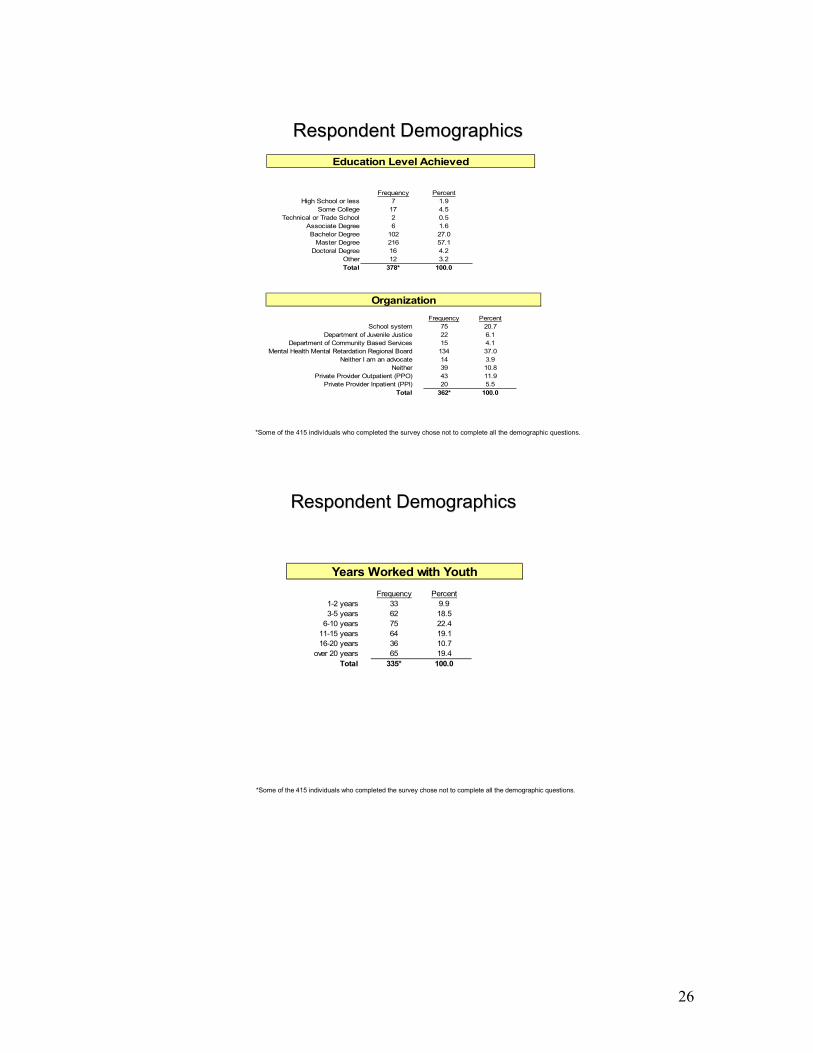
Frequency PercentHigh School or less 7 1.9
Some College 17 4.5Technical or Trade School 2 0.5
Associate Degree 6 1.6Bachelor Degree 102 27.0
Master Degree 216 57.1Doctoral Degree 16 4.2
Other 12 3.2Total 378* 100.0
Education Level Achieved
Frequency PercentSchool system 75 20.7
Department of Juvenile Justice 22 6.1Department of Community Based Services 15 4.1
Mental Health Mental Retardation Regional Board 134 37.0Neither I am an advocate 14 3.9
Neither 39 10.8Private Provider Outpatient (PPO) 43 11.9
Private Provider Inpatient (PPI) 20 5.5Total 362* 100.0
Organization
*Some of the 415 individuals who completed the survey chose not to complete all the demographic questions.
Respondent DemographicsRespondent Demographics
Frequency Percent1-2 years 33 9.93-5 years 62 18.5
6-10 years 75 22.411-15 years 64 19.116-20 years 36 10.7
over 20 years 65 19.4Total 335* 100.0
Years Worked with Youth
*Some of the 415 individuals who completed the survey chose not to complete all the demographic questions.
27
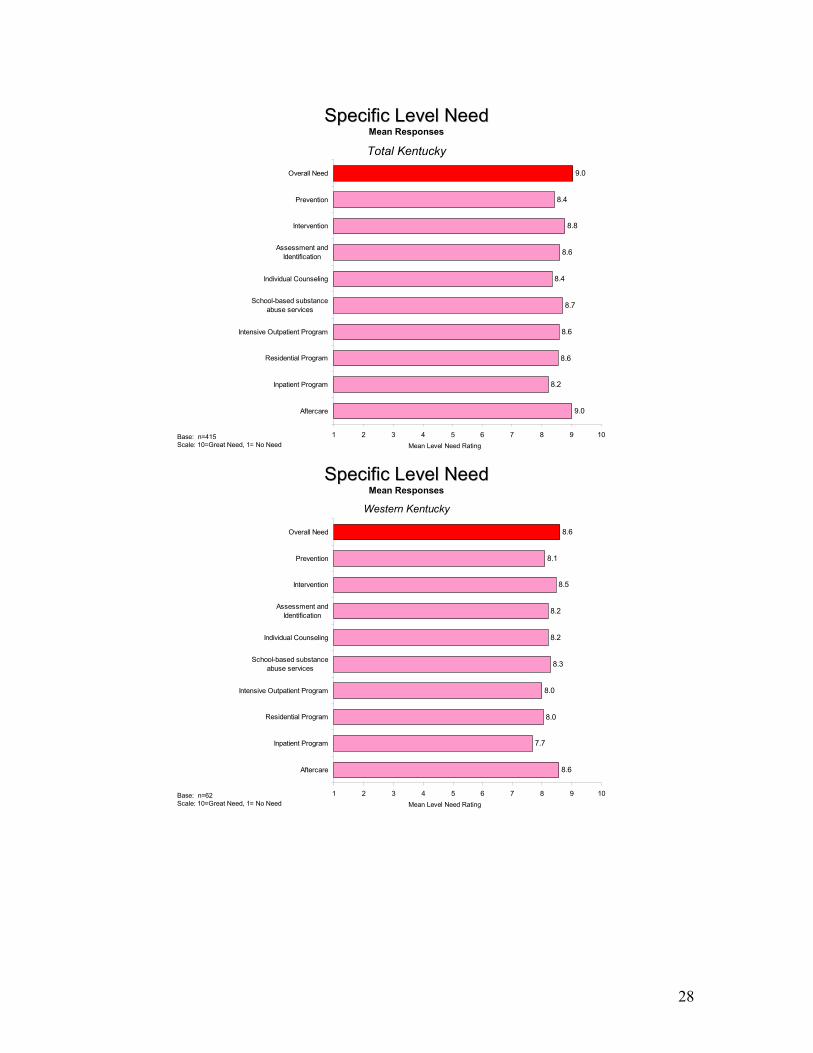
Specific Level NeedSpecific Level Need
Overall, and in the area of Kentucky where you serve Overall, and in the area of Kentucky where you serve youth, please rate the need level for each specific youth, please rate the need level for each specific
substance abuse prevention/treatment level using a substance abuse prevention/treatment level using a scale of 1scale of 1--10, where 1 means “No Need” and 10, where 1 means “No Need” and
10 means “Great Need”.10 means “Great Need”.
28
Specific Level NeedSpecific Level NeedMean Responses
Total Kentucky
Base: n=415Scale: 10=Great Need, 1= No Need Mean Level Need Rating
9.0
8.2
8.6
8.6
8.7
8.4
8.6
8.8
8.4
9.0
1 2 3 4 5 6 7 8 9 10
Aftercare
Inpatient Program
Residential Program
Intensive Outpatient Program
School-based substanceabuse services
Individual Counseling
Assessment andIdentification
Intervention
Prevention
Overall Need
Specific Level NeedSpecific Level NeedMean Responses
Western Kentucky
Base: n=62Scale: 10=Great Need, 1= No Need Mean Level Need Rating
8.6
7.7
8.0
8.0
8.3
8.2
8.2
8.5
8.1
8.6
1 2 3 4 5 6 7 8 9 10
Aftercare
Inpatient Program
Residential Program
Intensive Outpatient Program
School-based substanceabuse services
Individual Counseling
Assessment andIdentification
Intervention
Prevention
Overall Need
29
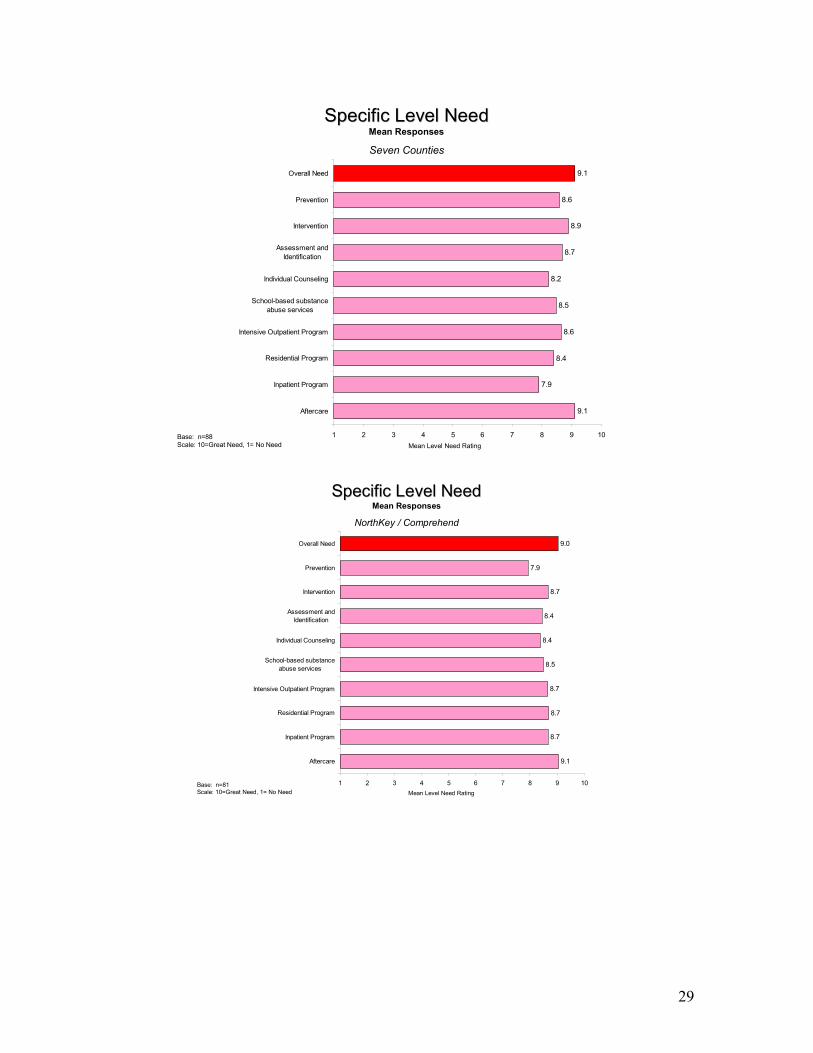
Specific Level NeedSpecific Level NeedMean Responses
Seven Counties
Base: n=88Scale: 10=Great Need, 1= No Need Mean Level Need Rating
9.1
7.9
8.4
8.6
8.5
8.2
8.7
8.9
8.6
9.1
1 2 3 4 5 6 7 8 9 10
Aftercare
Inpatient Program
Residential Program
Intensive Outpatient Program
School-based substanceabuse services
Individual Counseling
Assessment andIdentification
Intervention
Prevention
Overall Need
Specific Level NeedSpecific Level NeedMean Responses
NorthKey / Comprehend
Base: n=81Scale: 10=Great Need, 1= No Need Mean Level Need Rating
9.1
8.7
8.7
8.7
8.5
8.4
8.4
8.7
7.9
9.0
1 2 3 4 5 6 7 8 9 10
Aftercare
Inpatient Program
Residential Program
Intensive Outpatient Program
School-based substanceabuse services
Individual Counseling
Assessment andIdentification
Intervention
Prevention
Overall Need
30
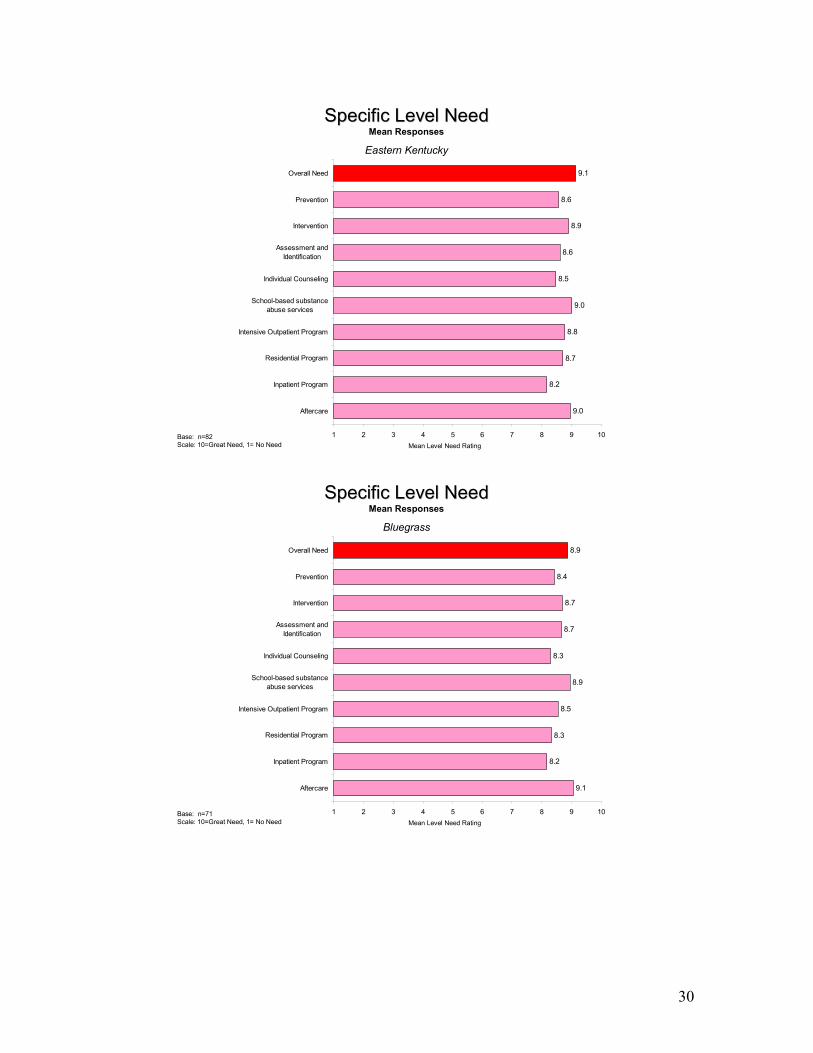
Specific Level NeedSpecific Level NeedMean Responses
Eastern Kentucky
Base: n=82Scale: 10=Great Need, 1= No Need Mean Level Need Rating
9.0
8.2
8.7
8.8
9.0
8.5
8.6
8.9
8.6
9.1
1 2 3 4 5 6 7 8 9 10
Aftercare
Inpatient Program
Residential Program
Intensive Outpatient Program
School-based substanceabuse services
Individual Counseling
Assessment andIdentification
Intervention
Prevention
Overall Need
Specific Level NeedSpecific Level NeedMean Responses
Bluegrass
Base: n=71Scale: 10=Great Need, 1= No Need Mean Level Need Rating
9.1
8.2
8.3
8.5
8.9
8.3
8.7
8.7
8.4
8.9
1 2 3 4 5 6 7 8 9 10
Aftercare
Inpatient Program
Residential Program
Intensive Outpatient Program
School-based substanceabuse services
Individual Counseling
Assessment andIdentification
Intervention
Prevention
Overall Need
31
Meets Specific Meets Specific Level NeedsLevel Needs
Overall, and in the area of Kentucky where you serve Overall, and in the area of Kentucky where you serve youth, please offer a general assessment of how your youth, please offer a general assessment of how your
area meets each specific substance abuse area meets each specific substance abuse prevention/treatment level using a scale of 1prevention/treatment level using a scale of 1--10, where 10, where 1 means “Meets Needs Poorly” and 10 means “Meets 1 means “Meets Needs Poorly” and 10 means “Meets
Needs Very Well”.Needs Very Well”.

32
Meets Specific Level NeedsMeets Specific Level NeedsMean Responses
Total Kentucky
Base: n=415Scale: 10=Meets Needs Very Well, 1= Meets Needs Poorly Mean Level Performance Rating
3.5
3.5
3.6
3.8
4.1
4.8
4.8
4.7
4.9
4.5
1 2 3 4 5 6 7 8 9 10
Aftercare
Inpatient Program
Residential Program
Intensive Outpatient Program
School-based substanceabuse services
Individual Counseling
Assessment andIdentification
Intervention
Prevention
Overall Performance
Meets Specific Level NeedsMeets Specific Level NeedsMean Responses
Western Kentucky
Base: n=62Scale: 10=Meets Needs Very Well, 1= Meets Needs Poorly Mean Level Performance Rating
3.5
3.7
3.4
3.7
3.8
4.5
4.6
4.7
5.0
4.1
1 2 3 4 5 6 7 8 9 10
Aftercare
Inpatient Program
Residential Program
Intensive Outpatient Program
School-based substanceabuse services
Individual Counseling
Assessment andIdentification
Intervention
Prevention
Overall Performance
33
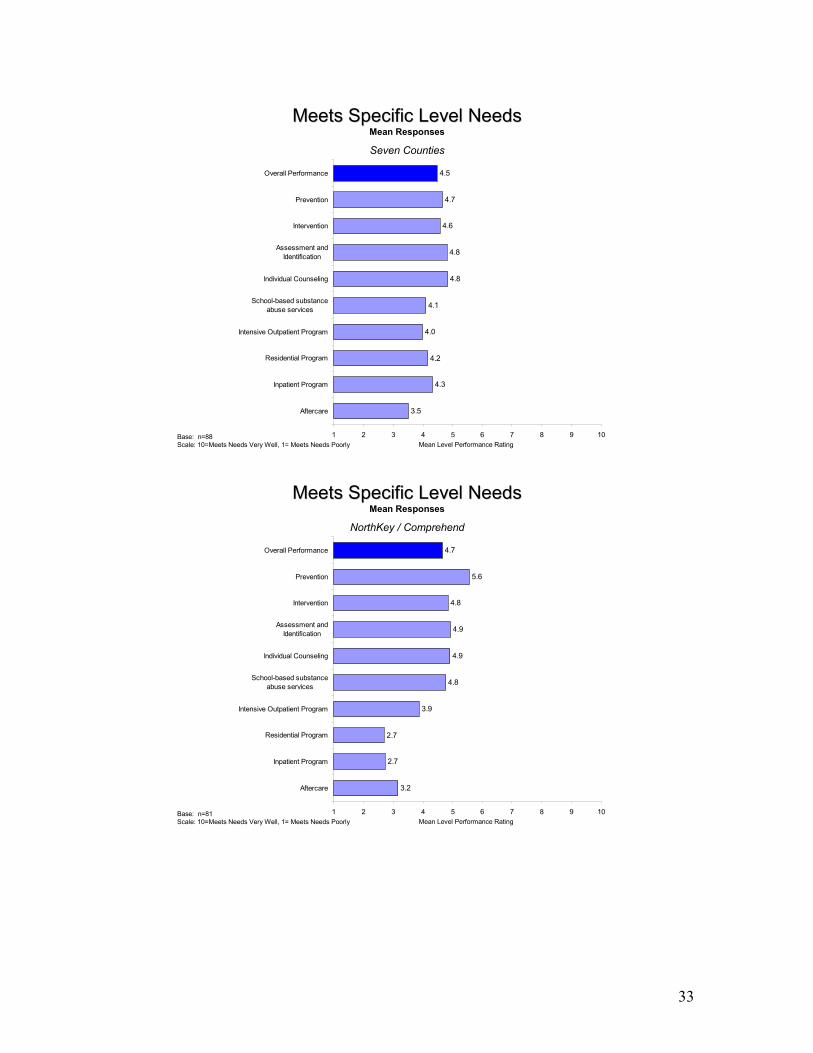
Meets Specific Level NeedsMeets Specific Level NeedsMean Responses
Seven Counties
Base: n=88Scale: 10=Meets Needs Very Well, 1= Meets Needs Poorly Mean Level Performance Rating
3.5
4.3
4.2
4.0
4.1
4.8
4.8
4.6
4.7
4.5
1 2 3 4 5 6 7 8 9 10
Aftercare
Inpatient Program
Residential Program
Intensive Outpatient Program
School-based substanceabuse services
Individual Counseling
Assessment andIdentification
Intervention
Prevention
Overall Performance
Meets Specific Level NeedsMeets Specific Level NeedsMean Responses
NorthKey / Comprehend
Base: n=81Scale: 10=Meets Needs Very Well, 1= Meets Needs Poorly Mean Level Performance Rating
3.2
2.7
2.7
3.9
4.8
4.9
4.9
4.8
5.6
4.7
1 2 3 4 5 6 7 8 9 10
Aftercare
Inpatient Program
Residential Program
Intensive Outpatient Program
School-based substanceabuse services
Individual Counseling
Assessment andIdentification
Intervention
Prevention
Overall Performance
34
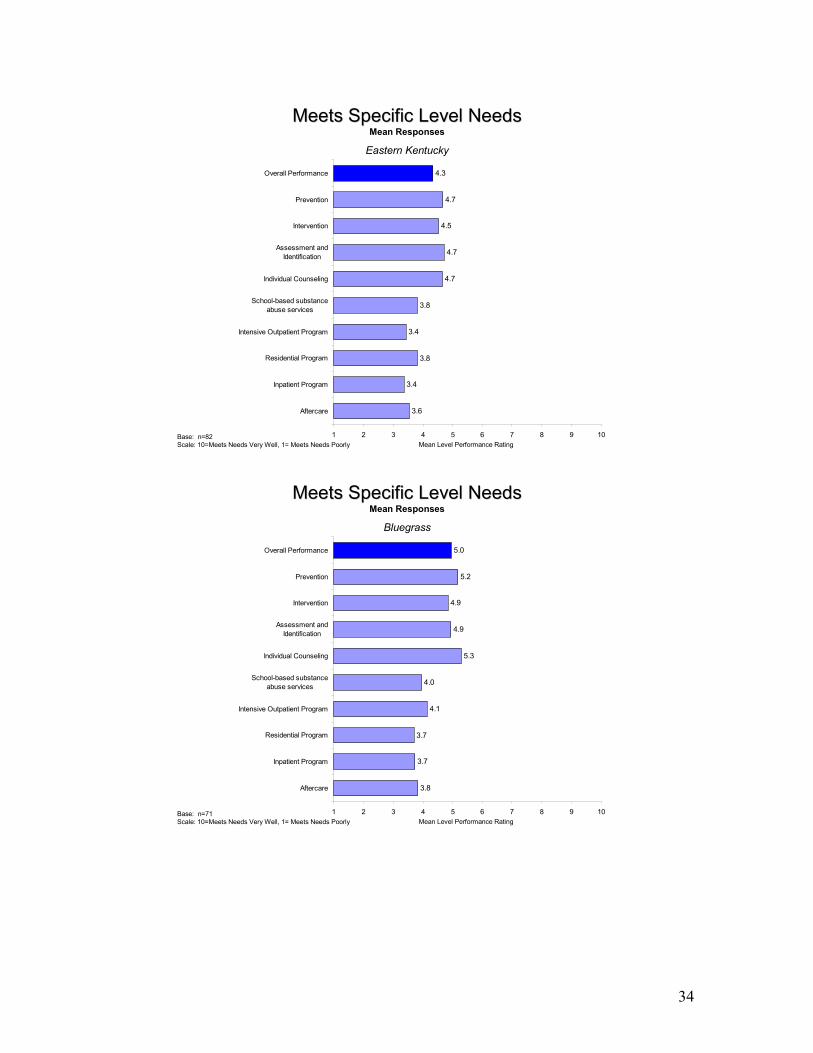
Meets Specific Level NeedsMeets Specific Level NeedsMean Responses
Eastern Kentucky
Base: n=82Scale: 10=Meets Needs Very Well, 1= Meets Needs Poorly Mean Level Performance Rating
3.6
3.4
3.8
3.4
3.8
4.7
4.7
4.5
4.7
4.3
1 2 3 4 5 6 7 8 9 10
Aftercare
Inpatient Program
Residential Program
Intensive Outpatient Program
School-based substanceabuse services
Individual Counseling
Assessment andIdentification
Intervention
Prevention
Overall Performance
Meets Specific Level NeedsMeets Specific Level NeedsMean Responses
Bluegrass
Base: n=71Scale: 10=Meets Needs Very Well, 1= Meets Needs Poorly Mean Level Performance Rating
3.8
3.7
3.7
4.1
4.0
5.3
4.9
4.9
5.2
5.0
1 2 3 4 5 6 7 8 9 10
Aftercare
Inpatient Program
Residential Program
Intensive Outpatient Program
School-based substanceabuse services
Individual Counseling
Assessment andIdentification
Intervention
Prevention
Overall Performance
35
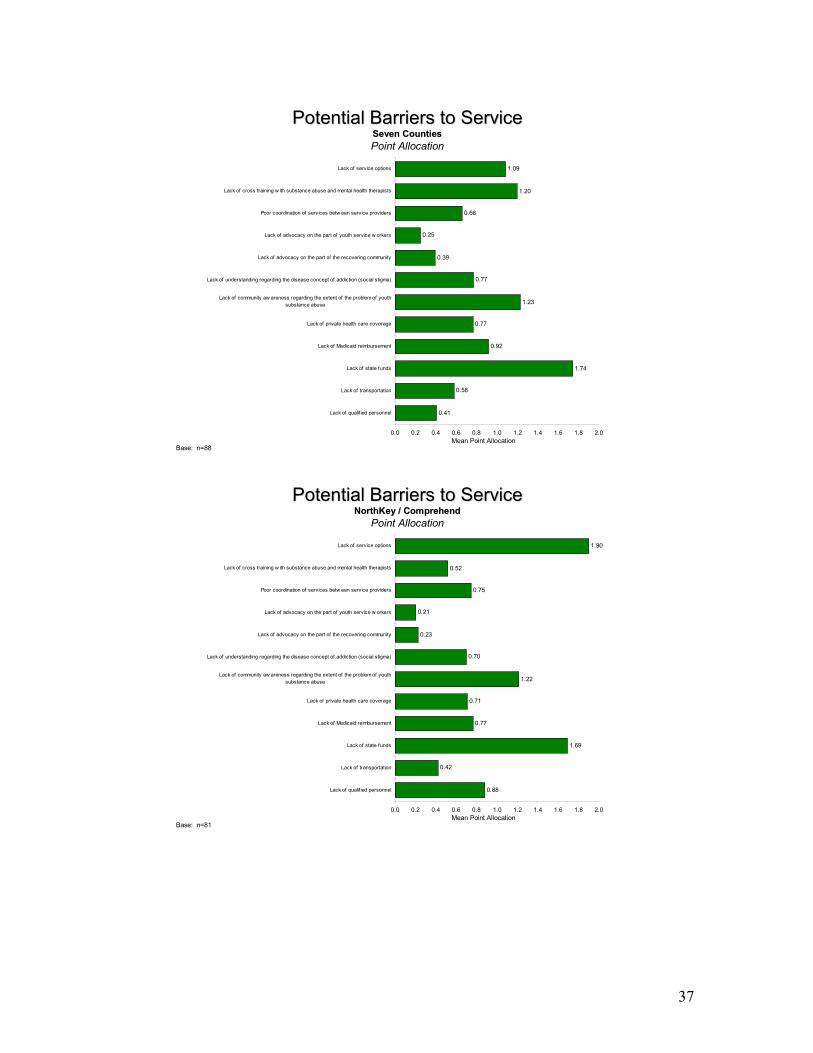
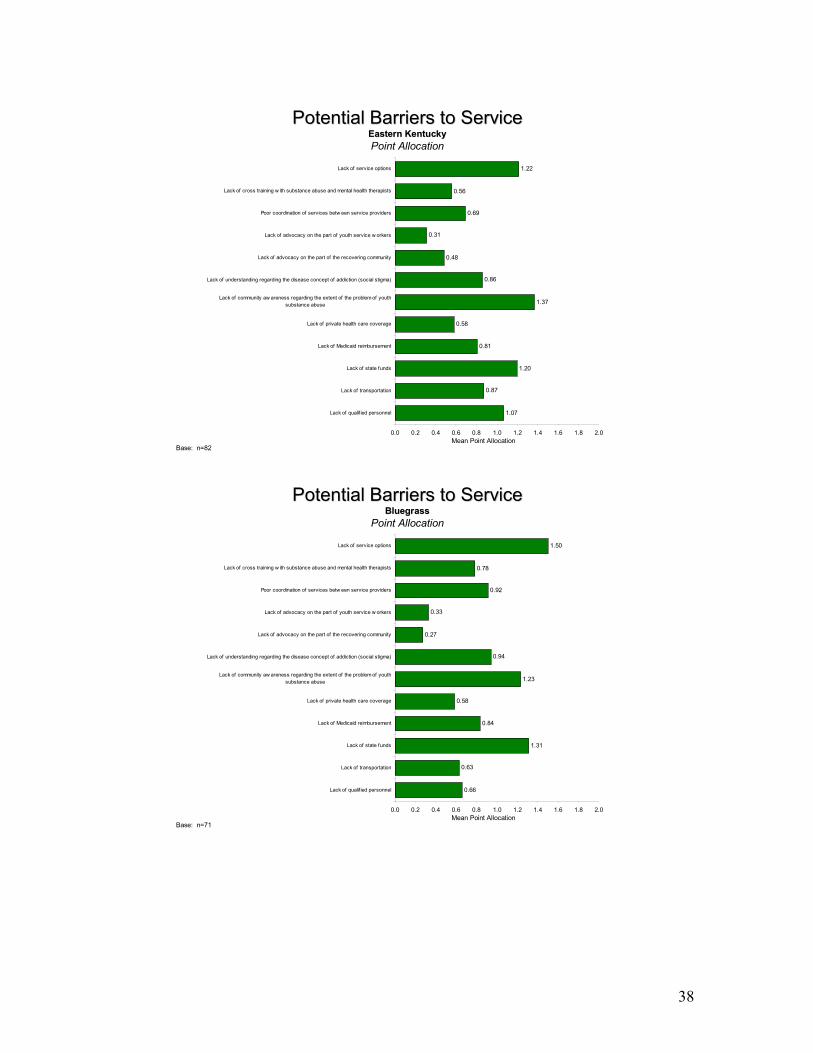
Potential BarriersPotential BarriersTo ServiceTo Service
Please tell us about the major barriers to adolescent Please tell us about the major barriers to adolescent substance abuse services in your area. Allocate ten substance abuse services in your area. Allocate ten
points across the potential barriers below.points across the potential barriers below.
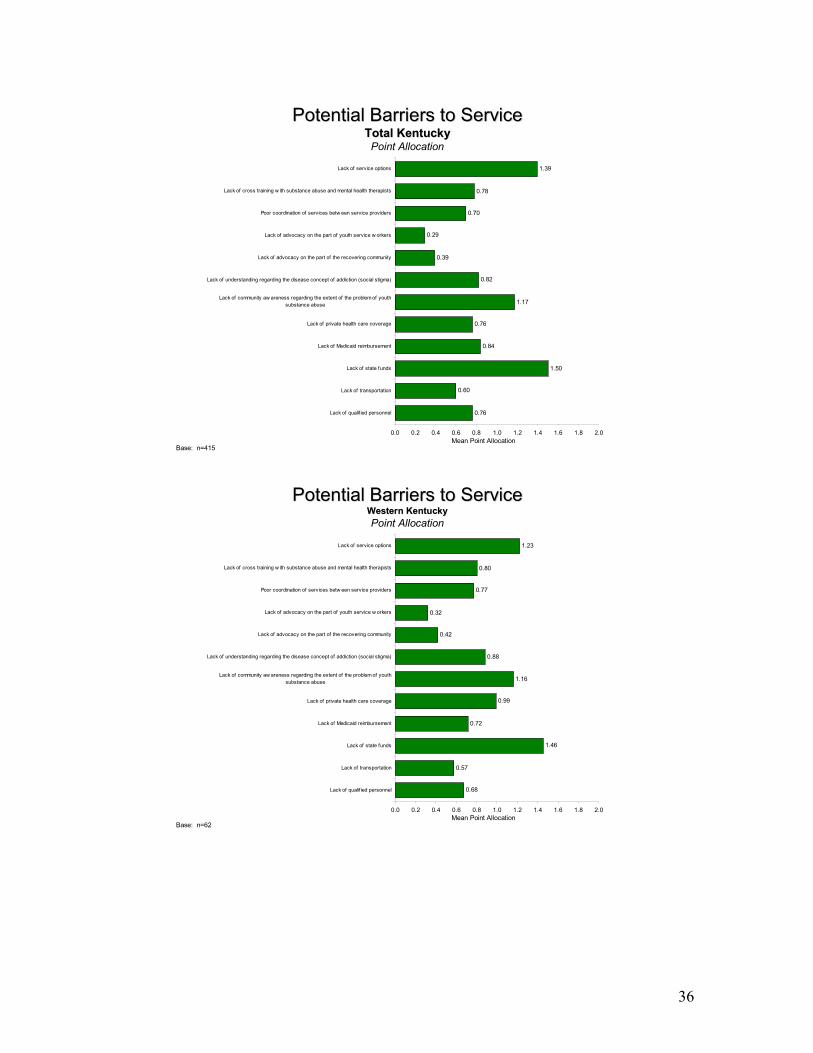
36
Potential Barriers to ServicePotential Barriers to ServiceTotal KentuckyTotal KentuckyPoint Allocation
Base: n=415Mean Point Allocation
0.76
0.60
1.50
0.84
0.76
1.17
0.82
0.39
0.29
0.70
0.78
1.39
0.0 0.2 0.4 0.6 0.8 1.0 1.2 1.4 1.6 1.8 2.0
Lack of qualif ied personnel
Lack of transportation
Lack of state funds
Lack of Medicaid reimbursement
Lack of private health care coverage
Lack of community aw areness regarding the extent of the problem of youthsubstance abuse
Lack of understanding regarding the disease concept of addiction (social stigma)
Lack of advocacy on the part of the recovering community
Lack of advocacy on the part of youth service w orkers
Poor coordination of services betw een service providers
Lack of cross training w ith substance abuse and mental health therapists
Lack of service options
Potential Barriers to ServicePotential Barriers to ServiceWestern KentuckyWestern KentuckyPoint Allocation
Base: n=62Mean Point Allocation
0.68
0.57
1.46
0.72
0.99
1.16
0.88
0.42
0.32
0.77
0.80
1.23
0.0 0.2 0.4 0.6 0.8 1.0 1.2 1.4 1.6 1.8 2.0
Lack of qualif ied personnel
Lack of transportation
Lack of state funds
Lack of Medicaid reimbursement
Lack of private health care coverage
Lack of community aw areness regarding the extent of the problem of youthsubstance abuse
Lack of understanding regarding the disease concept of addiction (social stigma)
Lack of advocacy on the part of the recovering community
Lack of advocacy on the part of youth service w orkers
Poor coordination of services betw een service providers
Lack of cross training w ith substance abuse and mental health therapists
Lack of service options
37
Potential Barriers to ServicePotential Barriers to ServiceSeven CountiesSeven CountiesPoint Allocation
Base: n=88Mean Point Allocation
0.41
0.58
1.74
0.92
0.77
1.23
0.77
0.39
0.25
0.66
1.20
1.09
0.0 0.2 0.4 0.6 0.8 1.0 1.2 1.4 1.6 1.8 2.0
Lack of qualif ied personnel
Lack of transportation
Lack of state funds
Lack of Medicaid reimbursement
Lack of private health care coverage
Lack of community aw areness regarding the extent of the problem of youthsubstance abuse
Lack of understanding regarding the disease concept of addiction (social stigma)
Lack of advocacy on the part of the recovering community
Lack of advocacy on the part of youth service w orkers
Poor coordination of services betw een service providers
Lack of cross training w ith substance abuse and mental health therapists
Lack of service options
Potential Barriers to ServicePotential Barriers to ServiceNorthKey / ComprehendNorthKey / Comprehend
Point Allocation
Base: n=81Mean Point Allocation
0.88
0.42
1.69
0.77
0.71
1.22
0.70
0.23
0.21
0.75
0.52
1.90
0.0 0.2 0.4 0.6 0.8 1.0 1.2 1.4 1.6 1.8 2.0
Lack of qualif ied personnel
Lack of transportation
Lack of state funds
Lack of Medicaid reimbursement
Lack of private health care coverage
Lack of community aw areness regarding the extent of the problem of youthsubstance abuse
Lack of understanding regarding the disease concept of addiction (social stigma)
Lack of advocacy on the part of the recovering community
Lack of advocacy on the part of youth service w orkers
Poor coordination of services betw een service providers
Lack of cross training w ith substance abuse and mental health therapists
Lack of service options
38
Potential Barriers to ServicePotential Barriers to ServiceEastern KentuckyEastern KentuckyPoint Allocation
Base: n=82Mean Point Allocation
1.07
0.87
1.20
0.81
0.58
1.37
0.86
0.48
0.31
0.69
0.56
1.22
0.0 0.2 0.4 0.6 0.8 1.0 1.2 1.4 1.6 1.8 2.0
Lack of qualif ied personnel
Lack of transportation
Lack of state funds
Lack of Medicaid reimbursement
Lack of private health care coverage
Lack of community aw areness regarding the extent of the problem of youthsubstance abuse
Lack of understanding regarding the disease concept of addiction (social stigma)
Lack of advocacy on the part of the recovering community
Lack of advocacy on the part of youth service w orkers
Poor coordination of services betw een service providers
Lack of cross training w ith substance abuse and mental health therapists
Lack of service options
Potential Barriers to ServicePotential Barriers to ServiceBluegrassBluegrass
Point Allocation
Base: n=71Mean Point Allocation
0.66
0.63
1.31
0.84
0.58
1.23
0.94
0.27
0.33
0.92
0.78
1.50
0.0 0.2 0.4 0.6 0.8 1.0 1.2 1.4 1.6 1.8 2.0
Lack of qualif ied personnel
Lack of transportation
Lack of state funds
Lack of Medicaid reimbursement
Lack of private health care coverage
Lack of community aw areness regarding the extent of the problem of youthsubstance abuse
Lack of understanding regarding the disease concept of addiction (social stigma)
Lack of advocacy on the part of the recovering community
Lack of advocacy on the part of youth service w orkers
Poor coordination of services betw een service providers
Lack of cross training w ith substance abuse and mental health therapists
Lack of service options

39
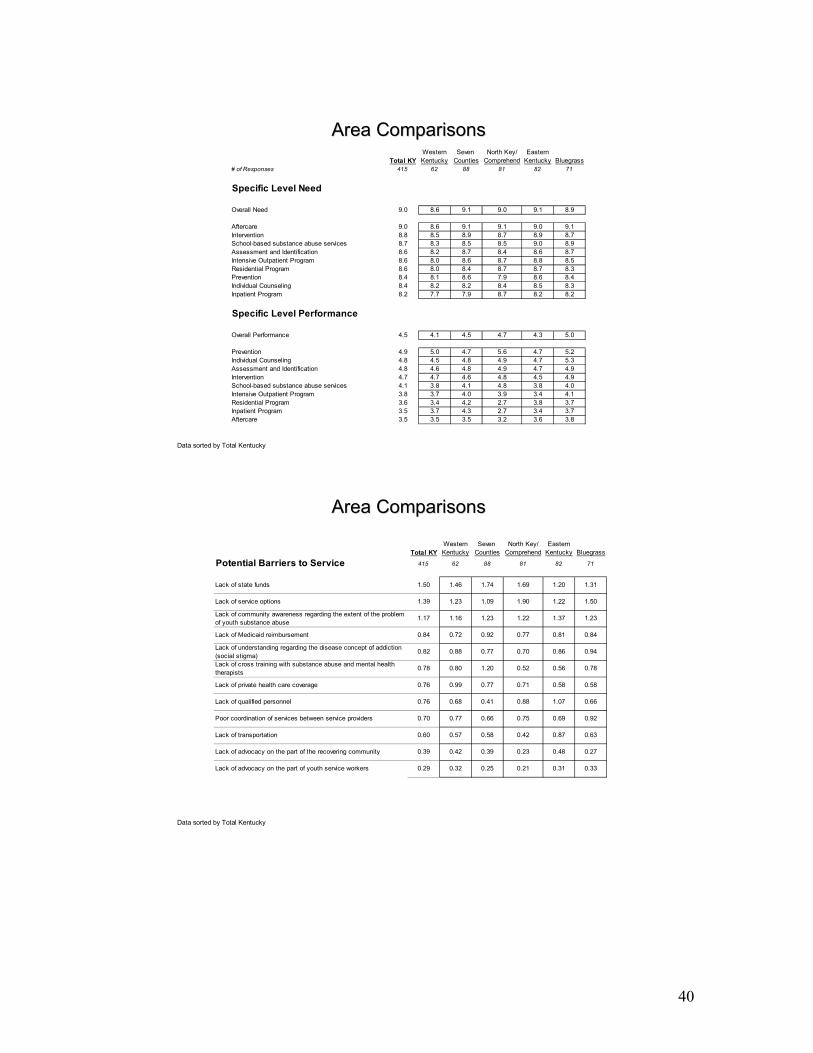
Area ComparisonsArea Comparisons
40
Western Seven North Key/ EasternTotal KY Kentucky Counties Comprehend Kentucky Bluegrass
# of Responses 415 62 88 81 82 71
Specific Level Need
Overall Need 9.0 8.6 9.1 9.0 9.1 8.9
Aftercare 9.0 8.6 9.1 9.1 9.0 9.1Intervention 8.8 8.5 8.9 8.7 8.9 8.7School-based substance abuse services 8.7 8.3 8.5 8.5 9.0 8.9Assessment and Identification 8.6 8.2 8.7 8.4 8.6 8.7Intensive Outpatient Program 8.6 8.0 8.6 8.7 8.8 8.5Residential Program 8.6 8.0 8.4 8.7 8.7 8.3Prevention 8.4 8.1 8.6 7.9 8.6 8.4Individual Counseling 8.4 8.2 8.2 8.4 8.5 8.3Inpatient Program 8.2 7.7 7.9 8.7 8.2 8.2
Specific Level Performance
Overall Performance 4.5 4.1 4.5 4.7 4.3 5.0
Prevention 4.9 5.0 4.7 5.6 4.7 5.2Individual Counseling 4.8 4.5 4.8 4.9 4.7 5.3Assessment and Identification 4.8 4.6 4.8 4.9 4.7 4.9Intervention 4.7 4.7 4.6 4.8 4.5 4.9School-based substance abuse services 4.1 3.8 4.1 4.8 3.8 4.0Intensive Outpatient Program 3.8 3.7 4.0 3.9 3.4 4.1Residential Program 3.6 3.4 4.2 2.7 3.8 3.7Inpatient Program 3.5 3.7 4.3 2.7 3.4 3.7Aftercare 3.5 3.5 3.5 3.2 3.6 3.8
Area ComparisonsArea Comparisons
Data sorted by Total Kentucky
Area ComparisonsArea Comparisons
Data sorted by Total Kentucky
Western Seven North Key/ EasternTotal KY Kentucky Counties Comprehend Kentucky Bluegrass
Potential Barriers to Service 415 62 88 81 82 71
Lack of state funds 1.50 1.46 1.74 1.69 1.20 1.31
Lack of service options 1.39 1.23 1.09 1.90 1.22 1.50
Lack of community awareness regarding the extent of the problem of youth substance abuse
1.17 1.16 1.23 1.22 1.37 1.23
Lack of Medicaid reimbursement 0.84 0.72 0.92 0.77 0.81 0.84
Lack of understanding regarding the disease concept of addiction (social stigma)
0.82 0.88 0.77 0.70 0.86 0.94
Lack of cross training with substance abuse and mental health therapists
0.78 0.80 1.20 0.52 0.56 0.78
Lack of private health care coverage 0.76 0.99 0.77 0.71 0.58 0.58
Lack of qualified personnel 0.76 0.68 0.41 0.88 1.07 0.66
Poor coordination of services between service providers 0.70 0.77 0.66 0.75 0.69 0.92
Lack of transportation 0.60 0.57 0.58 0.42 0.87 0.63
Lack of advocacy on the part of the recovering community 0.39 0.42 0.39 0.23 0.48 0.27
Lack of advocacy on the part of youth service workers 0.29 0.32 0.25 0.21 0.31 0.33
41
Conclusions
• Use of smokeless tobacco, cigarettes and marijuana by Kentucky’s 8th graders has leveled off or decreased slightly in the last year, but is higher than the national average.
• Use of alcohol by Kentucky’s 8th graders is lower than the national average, but increased in the last year.
• Kentucky’s 10th and 12th graders reported binge drinking at levels higher than the national average.
• Drug policy violations in Kentucky schools during the 2002-2003 school year decreased from the previous two years, but remain high, especially when compared with other types of violations.
• There has been a significant growth in juvenile drug court programs across the state over the last two years.
• There are a substantial number of adolescents in Kentucky’s juvenile justice system with substance abuse issues. Drug tests show marijuana as the primary drug of abuse.
• There has been a 55% increase in the number of adolescents admitted to publicly funded treatment programs in Kentucky over the last 5 years.
• Most individuals entering treatment started using substances as adolescents, but do not present for treatment until they are adults.
• Marijuana is the primary drug of abuse for adolescents admitted to a treatment program. Alcohol is second.
• Referral sources in Kentucky vary somewhat from those reported nationally. Family/friends are the primary referral source in Kentucky; schools are second, DCBS is third.
• There is a treatment gap in Kentucky. Only one out of seven adolescents who need treatment receives it.
• There is a shortage of adolescent specific treatment programs in Kentucky. • Co-occurring disorders are the norm for adolescents in treatment. • EPSDT is one of the few payor sources for adolescent treatment, and will not
cover all types of treatment. • Survey results indicate a need for increasing all levels of services across the state. • Aftercare is the highest need for adolescent substance abusers in Kentucky. • The three main barriers to improving adolescent substance abuse services are a
lack of state funds, a lack of service options, and a lack of community awareness about the problem.
42
The Future of Adolescent Substance Abuse Treatment Recent adolescent treatment research has resulted in some “lessons learned” regarding what is effective, and ineffective, in working with youth. Two particular research projects, the Cannabis Youth Treatment studies and the Adolescent Treatment Models, have revealed the following: Interventions associated with no or minimal change in substance use or symptoms:
Educational units alone Unstandardized outpatient services as usual Probation services as usual Passive referrals
Interventions associated with deterioration:
Treatment of adolescents in adult units and/or with adult models/materials (particularly outpatient)
Treatment of adolescents in groups including one or more highly deviant individuals
Effectiveness was associated with therapies that
Were manual guided and had developmentally appropriate materials Involved more quality assurance and clinical supervision Achieved therapeutic alliance with the adolescent (including motivational
enhancement approaches) and early positive outcomes Successfully engaged the adolescent in aftercare, support groups, positive peer
groups and more supportive recovery environments (Source: from a presentation by Michael Dennis, Chestnut Health Systems, at a KASAC workshop, 2003. For more information on the Cannabis Youth Treatment studies and the Adolescent Treatment Models, refer to this website: http://www.chestnut.org/LI/bookstore/index.html)

43
APPENDIX

44
Regional Planning Council Chairs
Region Convening Agency
Name Address City State ZIP
1 Four Rivers Mr. Scott Johnson
265 Cascade Drive Paducah KY 42003
2 Pennyroyal Ms. Carolyn Self
1507 South Main Hopkinsville KY 42241
3 River Valley Mr. Tom Stevenson
134 Old Bethel Road Sturgis KY 42459
4 LifeSkills Mr. Fred Keith 1314 Broadview Drive Bowling Green
KY 42101
5 Communicare Mr. Wayne Puckett
HC 88, Box 175 Hudson KY 40145
6 Seven Counties Services
Mr. Bernie Block
29 Chamberry Circle Louisville KY 40207
7 NorthKey Community Care
Ms. Carol Fausz
3019 Village Drive Edgewood KY 41017
8 Comprehend Mr. David Bolt P.O. Box 550 Vanceburg KY 411799 Pathways Mr. Kevin
HarrisonRamey/Estep Home,
Inc. P.O. Box 39Rush KY 42459
11 Mountain Comp Care
Mr. Andrew Dorton
620 Main Street Paintsville KY 41240
12 Kentucky River Ms. Lynda Congleton
P.O. Box 167 Beattyville KY 41311
13 Cumberland River Mr. Ralph Lipps
784 Court Road London KY 40741
14 The Adanta Group Ms. Wanda Bolze
167 Ferry Road Somerset KY 42503
15 Bluegrass Dr. Phil Berger 75 Candlewood Drive Nicholasville KY 40356

45
Adolescent Strategic Planning Committee GEOFF WILSON
RIDGE BEHAVIORAL HEALTH 3050 RIO DOSA DRIVE LEXINGTON KY 40509
CASSANDRA RUSSELL DJJ – DSD 495 FORREST HILL MOREHEAD KY 40351
KARI COLLINS KY RIVER COMMUNITY CARE PO BOX 794 JACKSON KY 41339
NANCY PFAADT EARLY INTERVENTION PROG 219 OLD TOWNE RD LOUISVILLE KY 40214
BARRY KELLOND DIVISION SUBSTANCE ABUSE 100 FAIR OAKS LANE 4E-D FRANKFORT KY 40621
LYNN POSZE INSTITUTE ON WOMEN & SUBSTANCE ABUSE 1151 RED MILE ROAD STE 1B LEXINGTON KY 40504-2645
CONNIE REED FAYETTE COUNTY DRUG COURT 149 N LIMESTONE ST LEXINGTON KY 40507
ERIN STEVENSON CDAR 915B S. LIMESTONE LEXINGTON KY 40536-9824
MARY PAT BEHLER YSAT/NORTHKEY 7459 BURLINGTON PIKE FLORENCE KY 41042
TERRY ADAIR MARYHURST 1015 DORSEY LN LOUISVILLE KY 40223
DAVID SOLOMON HENDERSON KY
MICHAEL GOSSER SEVEN COUNTY SERVICES 1220 BARDSTOWN ROAD LOUISVILLE KY 40204
LEWIS TUCKER 3223 STRATFORD AVE LOUISVILLE KY 40218
CONNIE DUNCAN LINCOLN TRAIL BEHAV HEALTH 3909 S WILSON RD RADCLIFF KY 40160
RANDA SIMPSON 2501 US 60 E MARION KY 42064
DENNIS DOUGHERTY WHITNEY YOUNG JOB CORPS 8460 SHELYVILLE RD SIMPSONVILLE KY 40067