adobe scene7 viewer study
TRANSCRIPT

1Adobe Scene7 Viewer Study: What Shoppers Want
[email protected] 1-877-SCENE7-0 www.scene7.com
Adobe Scene7 Viewer Study: What Shoppers Want
January 2010

2Adobe Scene7 Viewer Study: What Shoppers Want
Contents
Executive Summary 3Methodology and Participants 4Survey Steps and Results 9Summary 27Join the Conversation 27About Adobe Scene7 27References 27

3Adobe Scene7 Viewer Study: What Shoppers Want
Executive Summary
We are pleased to present the results of the first Adobe Scene7 survey addressing online shoppers’ interest in visual merchandising, entitled “Adobe Scene7 Viewer Study: What Shoppers Want.” This consumer-facing, quantitative study was conducted by Keynote Services, the leading provider of on-demand test and measurement products, who surveyed 300 people across three different age groups (18-29, 30-49, 50-64) to identify and analyze eCommerce shopping features on the product page most useful for shoppers making an online purchase, and importantly, to provide quantitative findings to help businesses design ideal viewer or “visual merchandising” experiences to improve conversions. Fifteen key questions were asked to determine consumers’ product viewing preferences. Both male and female participants were surveyed (49 percent/51 percent split) who were categorized as “medium to heavy online shoppers”, residing in North America, that had both researched and purchased a product online in the last 12 months and spent at least $500 shopping online throughout the year.
Key participant attributes:
• 94 percent had researched products within the past three months• 99 percent had purchased products online within the past three months• 41 percent had spent $1500 or more on online shopping this past year, which is nearly 30 percent greater
than the national average of $10691; 79 percent spent close to or more than the national average• 87 percent purchased electronics• 82 percent purchased clothing, shoes & jewelry• 80 percent purchased movies, music & games• 78 percent purchased computers & office equipment• 76 percent purchased books
• 86 percent use Internet Explorer/14 percent use Firefox• 35 percent spend more than 30 hours a week online (and 73 percent spend more than 16 hours a week
online)
This analysis of consumers’ product viewing preferences offers valuable insights for online merchandising and validates current eCommerce trends. Importantly, the results, across the board in each age bracket and across both genders, indicate that shoppers want an easy, quick way to browse—validating the “web design 101 rule” of eliminating as many clicks and scrolling as possible. In addition, all shoppers want to be provided as much visual information in as large a viewing format as possible—including interactive zoom that allows shoppers to dynamically pan and zoom to deeper levels of details—leading to another well known rule, “bigger is better”. As the study found, the two concepts go hand in hand; even in a full-screen view, shoppers still expected browsing to be quick and easy but also offer multiple levels of detail. And finally, the results pointed to the importance of offering as many images as possible (all colors and all views) with rich details—ideally featuring all sides of a product, creating a full 360-degree spin. Combining robust imagery with customer reviews/comments has shown to be the ultimate, preferred experience. More details are revealed in the following pages.
1 Retail E-Commerce Forecast: Cautious Optimism, eMarketer, June 2009.

4Adobe Scene7 Viewer Study: What Shoppers Want
Methodology and Participants
The Adobe Scene7 Viewer Study: What Shoppers Want was conducted in November 2009. The key objectives of the survey were to identify and analyze eCommerce shopping features on the product page most beneficial for engaging shoppers and enticing them to further explore merchandise, ultimately driving conversions. Statistically significant results were compiled based on responses from 300 participants representing age groups and gender equally.
Participants’ Genders:
Participants’ Age Groups:
49% (Male)
51% (Female)
35% 35%
30%
18-29 30-49 50-64

5Adobe Scene7 Viewer Study: What Shoppers Want
Last time participants researched products online:
Last time participants purchased products online:
Amount of money participants spent shopping online over the past 12 months:
As this chart illustrates, 79 percent of surveyed shoppers had purchased close to, or more than the national average of $1069 during the past year.
94%
3% 2% 1% 0% 0%
Within the past 3 months
Within the past 6 months
Within the past 9 months
Within the past 12 months
I have never researched online
More than 1 year ago
99.33%
0.33% 0.33% 0.00% 0.00% 0.00%
Within the past 3 months
Within the past 6 months
Within the past 9 months
I have never purchased online
Within the past 12 months
More than 1 year ago
0%
21%
38%
21% 20%
$0 to $500/year $500 to $1,000/year $1,000 to $1,500/year $1,500 to $2,000/year $2,000 and above

6Adobe Scene7 Viewer Study: What Shoppers Want
Types of products participants purchased online in the past 12 months (by Gender):
Types of products participants purchased online in the past 12 months (by Age):
89%
83%
80%
78%
75%
69%
68%
55%
30%
26%
4%
76%
91%
71%
79%
86%
50%
44%
44%
50%
49%
2%
Clothing, Shoes & Jewelry
Electronics
Books
Computers & Office
Movies, Music & Games
Grocery, Health & Beauty
Home & Garden & Pets
Toys, Babies & Kids
Sports & Outdoors
Tools, Auto & Industrial
Other
Female Male
85%
97%
85%
88%
89%
67%
52%
60%
54%
54%
2%
82%
81%
71%
70%
82%
50%
55%
52%
35%
33%
2%
80%
82%
70%
79%
69%
64%
61%
33%
28%
22%
6%
Clothing, Shoes & Jewelry
Electronics
Books
Computers & Office
Movies, Music & Games
Grocery, Health & Beauty
Home & Garden & Pets
Toys, Babies & Kids
Sports & Outdoors
Tools, Auto & Industrial
Other
18-29 30-49 50-64

7Adobe Scene7 Viewer Study: What Shoppers Want
The top categories most purchased by survey participants were electronics, clothing and accessories, movies, music, computers, electronics and books. Not surprising, 18-29 year olds purchased electronics online more frequently than the other age ranges and more men purchased electronics than women; while Home, Garden and Pet items were purchased more frequently by 50-64 year olds and women. Interestingly, the purchase of Computers and Office Supplies was comparable between men and women, but significantly lower among the 30-49 year old age bracket. The top categories purchased by survey participants closely correlate to the leading categories based on annual sales, according to a September 2009 report from Forrester Research, Inc. and Barclay’s Capital as illustrated below. Clothing (apparel and accessories) will be the leading category in 2010 with Consumer Electronics and Computers among the top five.

8Adobe Scene7 Viewer Study: What Shoppers Want
Similarly, eMarketer reported that the top categories for which detailed product information is most important are clothing, followed by computer hardware and software, electronics, then music, dvds and videos.2
Online Retail Categories for Which Detailed Product Information Is Most Important
2 The Customer Shopping Experience Online, eMarketer, September 2008.

9Adobe Scene7 Viewer Study: What Shoppers Want
Participants were also asked to name the sites (unaided recall) where they spend the most time researching and purchasing products online. The most popular sites mentioned were:
• Amazon: 279 responses (93% )• Ebay: 131 responses (44%)• Walmart.com: 44 responses (15%)• Best Buy: 37 responses (12%)• Newegg: 30 responses (10%)• Overstock: 29 responses (10%)• Dell: 20 responses (7%)• Buy.com: 19 responses (6%)• Target.com: 18 responses (6%)
This reflects how eCommerce pure plays and mass portals like Amazon and eBay have the highest use and, of course, the highest unaided brand recall rate. Overall, recall involving multi-channel merchants tended to be lower. Five out of the top nine were web pure plays—and Dell does not have its own retail stores. It’s evident that broad product offerings, price comparisons, and sites offering the lowest prices showed strong brand recall; nonetheless, there is ample online growth opportunity for multi-channel merchants.
Survey Steps and Results
To best simulate a true online shopping experience and identify the shopping features that consumers find most critical for making a purchase decision, specific interactive shopping scenarios for men and women (identically formatted but with gender-specific imagery to which participants could best relate) were created. Participants were told they had $100 to buy a coat. They were presented three different viewer experiences in random order and were asked to perform a set of interactive tasks and to answer as set of questions during each scenario. Each set of questions was created to identify the features of each viewing experience that would be most helpful for making a purchase decision.
The first shopping experience was called Alpha. The Alpha viewer enabled users to mouse over alternative views of the product without having to click.

10Adobe Scene7 Viewer Study: What Shoppers Want
By rolling over the product views, an automatic fly-out image with zoom details of the main or alternative images would appear.
By clicking “Full-Screen” a modal layer window appeared where participants could scroll to see an enlarged product view, and alternative images could be viewed in the enlarge window with a mouse click. The full-screen view required participants to scroll down to see the entire image, and the alternative images moved down the screen with the scrolling action.

11Adobe Scene7 Viewer Study: What Shoppers Want
After thoroughly reviewing Alpha, participants were asked to rate how helpful the Alpha viewer features were in making a purchase decision on a scale from 1 to 5, where 1 was ‘Not at all Helpful’ and 5 was ‘Very Helpful’.
• 93 percent found multiple views that can be browsed by moving the cursor very helpful• 90 percent found detailed zoom by moving the cursor over the main image area very helpful• 75 percent found full-screen views of all images very helpful
Participants were quoted as saying that the Alpha viewer was:• Easy to use. • Fast/Quickest.• Required no clicking.• Got detail and full-screen view all in one page.• Easiest to maneuver and did not involve too much “clicking” of the mouse.
93% 90% 75%
5% 6%
13%
2% 4% 11%
Multiple views that you can browse by moving your cursor
Detailed zoom by moving your cursor over the main image area
Full-screen views of all images
Positive (4-5) Neutral (3) Negative (1-2)

12Adobe Scene7 Viewer Study: What Shoppers Want
The next experience was called Beta.
With the Beta viewer, users could still mouse over the alternative images for another look at the product; however, with this viewer deeper product details were viewable by clicking on the primary image or “+” zoom control to interactively zoom as opposed to rolling-over the image for fly-out zoom details.

13Adobe Scene7 Viewer Study: What Shoppers Want
Also, clicking on “Full-Screen Zoom” presented users with a full-screen view and the ability to interactively zoom in multiple levels within that view on all of the alternative images. Users were also able to interactively zoom and pan on the product in the full-screen view by clicking “+” zoom controls or directly on any area of the image.
Note: All of the images across the viewers were identical, so feedback was not defined by merchandise or models.
Participants were again asked to rate how helpful the Beta viewer features were in making a purchase decision on a scale from 1 to 5, where 1 was ‘Not at all Helpful’ and 5 was ‘Very Helpful’.
90% 78% 82% 77%
7% 13% 11% 14%
3% 9% 7% 9%
Multiple views that you can browse by moving your cursor
Detailed zoom and pan on all images by clicking on the '+'
bu�on or main image
Full-screen views of all images Detailed zoom and pan on all full-screen images by clicking
on the '+' bu�on or main image
Positive (4-5) Neutral (3) Negative (1-2)

14Adobe Scene7 Viewer Study: What Shoppers Want
• 90 percent found multiple views that can be browsed by moving the cursor very helpful• 78 percent found detailed zoom and pan on all images by clicking the “+” button or main image very helpful • 82 percent found full-screen views of all images very helpful• 77 percent found detailed zoom and pan on all full-screen images by clicking the “+” button or main image
very helpful
Participants were quoted as saying the following about the Beta viewer:
• Didn’t have to click to enlarge to see details of item.• Beta gave the best full-screen view and the clearest image even when zooming.• The mouse zoom & pan were annoying, beta was the easiest to see everything.• Beta was the only viewer that responded immediately to the scroll on my mouse with zooming, the zoom on
the others was a hassle and I often got the menu under the right-click on the mouse by mistake and this took time to dismiss and continue...Beta is slick and fast with just the first features presented.
• Beta seemed the most user friendly for a shopper that does a lot of internet shopping. I don’t want to spend 5 minutes trying to get a zoom view of a color or the back of a jacket to find out that I don’t like it. Beta is fast and gives the shopper the information they want without having to switch to full view mode.
The third example was called Gamma. The Gamma viewer presented a combination of features from both the Alpha and Beta viewers.

15Adobe Scene7 Viewer Study: What Shoppers Want
Gamma offered users mouse over-driven alternative views with fly-out zoom details on rollover; and clicking on “Full-Screen Zoom” presented users with a full-screen view of all images along with the ability to interactively zoom in to additional levels and pan within that view.

16Adobe Scene7 Viewer Study: What Shoppers Want
Participants were again asked to rate how helpful the Gamma viewer features were in making a purchase decision on a scale from 1 to 5, where 1 was ‘Not at all Helpful’ and 5 was ‘Very Helpful’.
• 95.33 percent found multiple views that can be browsed by moving the cursor very helpful• 92.67 percent found detailed zoom by moving the cursor over the main image area very helpful • 87 percent found full-screen views of all images very helpful• 85.33 percent found detailed zoom and pan on all full-screen images by clicking the “+” button or main
image very helpful
Participants were quoted as saying the following about the Gamma viewer:• Best of both viewers: Roll over and enlarge full-screen. • Enlarged full-screen view gave detailed zoom. • Combines the ease of rollover zooming for beginner users with the full-screen images for pickier customers.
I feel like I could not only use this viewer myself, but I could tell my mother how to use it over the phone in a way she’d understand.
• I really like the “auto zoom” feature where I can point the mouse and it zooms in automatically. I prefer GAMMA to ALPHA b/c I get a larger view of the product, despite the longer loading time.
• I think Gamma is easiest to use and shows the details of the clothing much easier than the others viewers.
95.33% 92.67%
87.00% 85.33%
4.33% 5.33% 8.00% 9.33%
0.33% 2.00% 5.00% 5.33%
Multiple views that you can browse by moving your
cursor
Detailed zoom by moving your cursor over the main
image area
Full-screen views of all images
Detailed zoom and pan on all full-screen images by
clicking on the '+' bu on or main image
Positive (4-5) Neutral (3) Negative (1-2)

17Adobe Scene7 Viewer Study: What Shoppers Want
Next, participants were asked to rate the ease of their “shopping experience” across the three viewers on a scale from 1 to 5, where 1 was ‘Extremely Difficult’ and 5 was ‘Extremely Easy’.
Significantly lower than Gamma at a 95% confidence interval.
Significantly lower than Alpha at a 95% confidence interval.
• 82.33 percent of participants found that the Beta viewer was easiest• 91 percent of participants found that the Alpha viewer was easiest• 95.67 percent of participants found that the Gamma viewer was easiest
Participants’ feedback of the shopping experience using these three viewers supports that users prefer mouse-driven product exploration over click-driven. Shoppers do not want to take the extra step to click the mouse to unveil alternative product views and details; however, they do appreciate the ability to interactively zoom to deeper detail levels in order to truly examine products. Full-screen viewing with interactive zoom is more preferred because it enables even better examination of products.
91.00% 82.33%
95.67%
6.33% 12.33%
3.67% 2.67% 5.33% 0.67%
Alpha Beta Gamma
Positive (4-5) Neutral (3) Negative (1-2)

18Adobe Scene7 Viewer Study: What Shoppers Want
Participants were asked how much they agree or disagree with the following statement: “With this shopping experience, I have enough visual information to spend my $100 to buy this item.”
Significantly lower than Gamma at a 95% confidence interval
• 84 percent of participants found the Beta experience offered enough visual information to support a purchase decision
• 88 percent of participants found the Alpha experience offered enough visual information to support a purchase decision
• 93 percent of participants found the Gamma experience offered enough visual information to support a purchase decision
Not surprisingly, Gamma was preferred by participants both for its ease and quickness of mouse-driven browsing while also providing the most visual product detail information with full-screen interactive zoom; thus it best supports a purchase decision. Users’ preference for the Gamma viewer offers validation for current eCommerce trends.
88% 84%
93%
7% 10% 5%
5% 6% 2%
Alpha Beta Gamma
Strongly Agree (4-5) Neutral (3) Strongly Disagree (1-2)

19Adobe Scene7 Viewer Study: What Shoppers Want
After reviewing the three viewers, participants were also asked to rank in order of preference the viewer experience preferred most for making a purchase decision, where “1” was Most Preferred and “3” was Least Preferred. Again, Gamma was chosen by participants as the viewer most preferred for making a purchase decision. This was followed by Alpha and then Beta.
Significantly higher than Alpha and Beta at a 95% confidence interval.
Significantly higher than Beta at a 95% confidence interval.
After reviewing and evaluating these three viewers, participants were presented a fourth, and final, viewer for review. They were shown the first three viewers again for comparison purposes and then were presented with “Delta”, a multi-media enabled viewer that incorporated click-driven alternative views, with interactive full-screen zoom, color options, video sets, 360-degree spin with zoom on every angle, and user generated images with consumer commentary.
Full-screen interactive zoom with alternative views
35%
16%
49%
41%
24%
34%
24%
60%
17%
Viewer ALPHA Viewer BETA Viewer GAMMA

20Adobe Scene7 Viewer Study: What Shoppers Want
Colors with Interactive Zoom
Video

21Adobe Scene7 Viewer Study: What Shoppers Want
360-degree spin with interactive zoom
User generated images and comments

22Adobe Scene7 Viewer Study: What Shoppers Want
Delta became the preferred experience across all participants with a majority shifting their preferred viewer to Delta at 55 percent popularity (a statistically significant3 “win” over the other viewers) regardless of age or gender.
Fewer shoppers continued to dislike Gamma (15 percent) versus Alpha (21 percent) however, those with a preference for Beta largely moved over to Delta.
3 Significantly higher at 95% confidence interval.
18% 7%
20%
55%
61%
40%
65%
34%
21%
53%
15% 11%
Viewer ALPHA Viewer BETA Viewer GAMMA Viewer DELTA
Most Preferred (1) Neutral (2-3) Least Preferred (4)

23Adobe Scene7 Viewer Study: What Shoppers Want
In asking Delta advocates which features they preferred most, alternative views was chosen as the number one feature driving a purchase decision. Color options came in second, with spin, videos and customer images falling out in that order in terms of preferences.
The Delta viewer won over the participants:• Top preferred viewer overall.• It had customer pictures.• I really like the different options, views, colors, videos to give me information.• I think the customer images aren’t necessary if you have good alt views/angles and zooming on products but
I like the user friendliness of Gamma just with all the variety of Delta.
Although participants preferred the ease of the Gamma viewer shopping experience (less clicking and scrolling), the shoppers wanted the variety of visual data that the Delta viewer delivered. Conclusion: the variety of viewing options presented in Delta combined with the mouse-driven feature would deliver the ultimate product viewing experience.
71%
48%
26% 38%
18%
16%
26%
15%
30%
13%
13% 26%
59%
32%
69%
Views Colors Video Spin Customer Images
Least Preferred (4-5) Most Preferred (1-2) Neutral (3)

24Adobe Scene7 Viewer Study: What Shoppers Want
Based on participants’ preferred viewer experience, they were then asked to rate the usefulness of that viewer for each of the following product categories, where 1 was ‘Least Useful’ and 5 was ‘Most Useful’.
The top categories were clothing, sporting goods, toys, and electronics. Books, movies, music and games ranked lowest in terms of needing a viewer that offered an experience similar to that of the Delta viewer, categories in which purchase decisions are not frequently made based on a visual shopping experience.
27%
37%
71%
95%
87%
71%
46%
76%
73%
77%
24%
25%
22%
3%
11%
23%
31%
18%
19%
17%
49%
38%
8%
1%
2%
6%
23%
5%
8%
6%
Books
Movies, Music & Games
Computers & Office
Clothing, Shoes & Jewelry
Sports & Outdoors
Home & Garden
Grocery, Health & Beauty
Electronics
Tools, Auto & Industrial
Toys, Babies & Kids
Most Useful (4-5) Least Useful (1-2) Neutral (3)
25Adobe Scene7 Viewer Study: What Shoppers Want
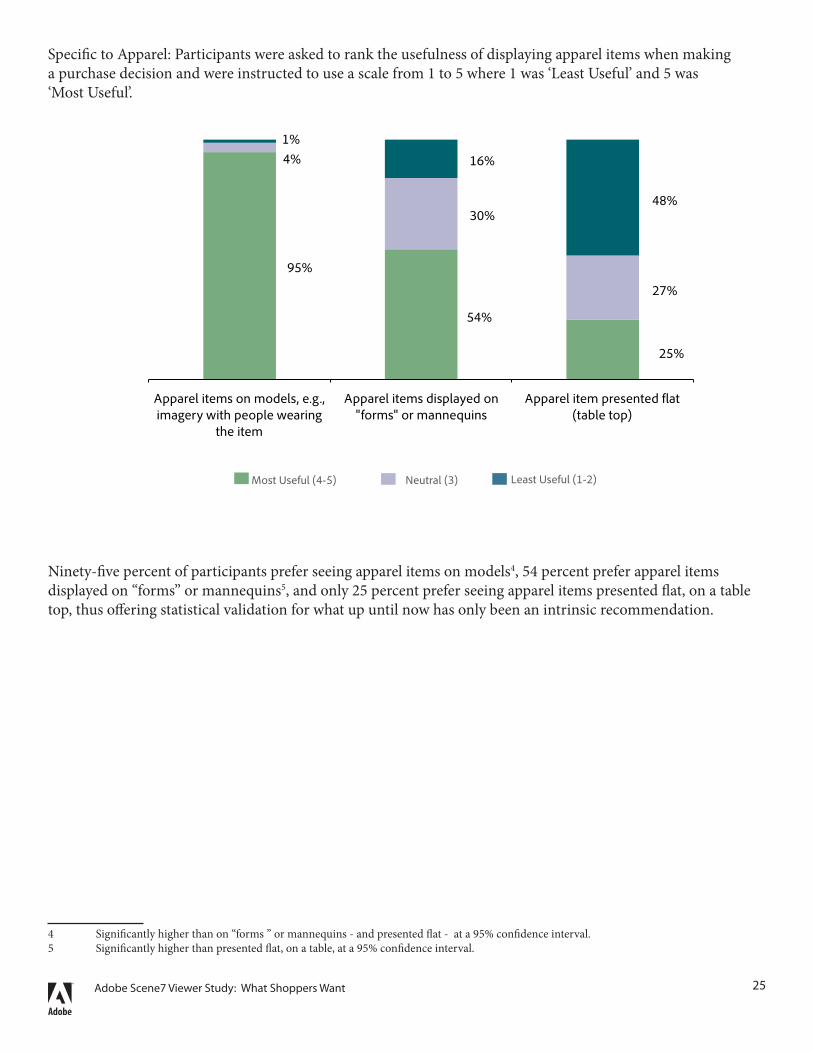
Specific to Apparel: Participants were asked to rank the usefulness of displaying apparel items when making a purchase decision and were instructed to use a scale from 1 to 5 where 1 was ‘Least Useful’ and 5 was ‘Most Useful’.
Ninety-five percent of participants prefer seeing apparel items on models4, 54 percent prefer apparel items displayed on “forms” or mannequins5, and only 25 percent prefer seeing apparel items presented flat, on a table top, thus offering statistical validation for what up until now has only been an intrinsic recommendation.
4 Significantly higher than on “forms ” or mannequins - and presented flat - at a 95% confidence interval.5 Significantly higher than presented flat, on a table, at a 95% confidence interval.
95%
54%
25%
4%
30%
27%
1%
16%
48%
Apparel items on models, e.g., imagery with people wearing
the item
Apparel items displayed on "forms" or mannequins
Apparel item presented �at (table top)
Most Useful (4-5) Least Useful (1-2) Neutral (3)

26Adobe Scene7 Viewer Study: What Shoppers Want
In the final portion of the survey, participants were presented with a list of features that enhance the online shopping experience and were asked to choose those features that they feel augment their personal shopping experiences. Alternative images and colors come up high at 96 percent, followed closely by spin at 91 percent. User ratings and comments were high, too, at 88 percent, and the ability to customize an item would influence more than 75 percent of participants to make an online purchase, which offers further support of the value for e-tailers in empowering their customers.
Interestingly, links to social sharing sites whereby one can share an item of interest with friends and family only came in at 27 percent. While social sharing offers the ability to get close friends to provide their opinions of products on their social sites, its ability to augment the personal shopping experience is lower especially compared to other features, including richer product visualization. Thus to encourage immediate purchase decisions, businesses should prioritize on providing relevant, complete visual information and third party user reviews rather than offering social sharing, which could potentially slow down a purchase as users wait to hear from their circle of friends.
58%
67%
91%
55%
88%
96%
50%
51%
41%
27%
75%
28%
21%
8%
28%
9%
4%
23%
26%
23%
23%
20%
13%
12%
1%
17%
3%
0%
27%
23%
36%
50%
5%
Pre-determined zoom areas on images with overlaid information
Download images in higher resolution
Ability to turn products around in a full 360-spin and zoom on any perspective
Video demonstrating feature highlights with product experts
Customer ratings, comments and reviews
Images of all available colors and pa�erns of an item
Live chat to talk with customer support about products
Product images contributed by other users/shoppers
Product videos contributed by other users/shoppers
Links to social sites to share items for feedback
Ability to customize an item (style, fabric, colors, monogramming)
Most Useful (4-5) Least Useful (1-2) Neutral (3)

27Adobe Scene7 Viewer Study: What Shoppers Want
Summary
Consumers are drawn to a visually-rich experience. Gone are the days when some well scripted prose and a flat shot of a product could close a sale. Now, shoppers need to feel like they are getting an “in-store” experience when they’re “browsing” online. The visual browsing experience is analogous to scanning the aisles and shelves in a physical store or even skimming short copy on a web product page—users want to quickly find or briefly read about products to uncover alternatives. Then in order to make their final decision, they want to continue to read and explore these products by delving into the detailed long copy and visual information more closely. High-quality, large images, with zoom, spin, and color options emulate the “touch-and-feel” experience of shopping in-store, while the use of video can show products in real use, simulating a “knowledgeable” in-store clerk’s live demonstrations. Through analysis of this study, one can conclude that the fewer steps (less clicks, less scrolling) involved in getting to the desired product information, the better. And, as our viewer testing illustrated, a mouse-over experience to quickly view products including a level of detail is preferred; however, this cannot replace a more interactive zoom experience that offers closer examination of merchandise. Shoppers want to buy online, they just need adequate visual support to make that purchase decision. Variety, ease of use, and large, zoomable product shots position products as saleable, increasing shoppers’ confidence that they just added the right products to their carts. The leaders in eCommerce who seek to understand their customers’ visual shopping preferences, will ultimately increase their conversions by differentiating themselves and delivering the optimal visual shopping experiences—making buyers out of browsers and loyalists out of lookers.
Join the Conversation
We hope that this research study is useful to your business. We welcome direct comments, questions and feedback. Please post your comments to our blog at blogs.adobe.com/scene7 or email them to [email protected].
About Adobe Scene7
The Adobe Scene7 hosted media platform is an industry-leading solution for e-commerce and multi-channel marketing companies worldwide to publish rich content to engage their audience and drive online business. Leading companies using Adobe Scene7 solutions include QVC, Harrods, Macy’s, Amazon, Office Depot, Polo Ralph Lauren, La-Z-Boy, Lands’ End, Blockbuster, Williams-Sonoma and Levi Strauss & Co. For more information about Scene7 hosted solutions visit www.scene7.com.
References
1 Retail E-Commerce Forecast: Cautious Optimism, eMarketer, June 2009.2 The Customer Shopping Experience Online, eMarketer, September 2008.3 “Barclays Capital Internet Data Book September 2009,” September 21, 2009, Forrester Research and Barclays Capital.
© 2010 Adobe Systems Incorporated. All rights reserved. Adobe, the Adobe logo, and Scene7 are either registered trademarks or trademarks of Adobe Systems Incorporated in the United States and/or other countries. All other trademarks are the property of their respective owners.