administrative charges for funded pensions: an...
TRANSCRIPT
No. 0016
Social Protection Discussion Paper Series
Administrative Charges for Funded Pensions: An International Comparison and Assessment
Edward Whitehouse
June 2000
Social Protection Unit
Human Development Network
The World Bank
Social Protection Discussion Papers are not formal publications of the World Bank. They present preliminary and unpolished results of analysis that are circulated to encourage discussion and comment; citation and the use of such a paper should take account of its provisional character. The findings, interpretations, and conclusions expressed in this paper are entirely those of the author(s) and should not be attributed in any manner to the World Bank, to its affiliated organizations or to members of its Board of Executive Directors or the countries they represent.
For free copies of this paper, please contact the Social Protection Advisory Service, The World Bank, 1818 H Street, N.W., MSN G8-802, Washington, D.C. 20433 USA. Telephone: (202) 458-5267, Fax: (202) 614-0471, E-mail: [email protected]. Or visit the Social Protection website at http://www.worldbank.org/sp.

Administrative charges for funded pensions: An international comparison and assessment
Edward Whitehouse
Pension fund charges reduce the rate of return on pension accounts in some countries by up to by two percentage points. Do charges of this scale undermine the case for funded pension provision? How can governments hold back costs and charges? This paper looks at evidence from thirteen countries, with policies ranging from complete liberalization of charge levels of structures to government imposed charge ceilings. The author stresses the trade-offs in limiting charges, especially in reduced competition and choice.
PENSION
REFORM
PRIMERrē-for´m
v.t. & i. 1. make (institution, procedure
etc.) better by removal or abandonment
of imperfections, faults or errors
prīmer n. 1. elementary book to
equip person with information
pe´nsio
n n. 1.
periodic p
ayment
made on ret
irement or
above
specified
age

Administrative charges for funded pensions: An international comparison and assessment
Edward Whitehouse*
* Director, Axia Economics and Consultant Economist, Social Protection Division, World Bank, Washington, D.C. This paper is part of the World Bank’s pension reform primer, a comprehensive, up-to-date resource for people designing and implementing reforms to retirement-income systems. The series is edited by Robert Palacios and Edward Whitehouse.
The author is grateful to Estelle James, Robert Palacios and Roberto Rocha of the World Bank, Paul Johnson and Ros Bennett of the Financial Services Authority, Costas Meghir of University College, London and the Institute for Fiscal Studies, Keith Chapman of the Australian Prudential Regulatory Authority, Richard Disney of Nottingham University and the Institute for Fiscal Studies, Juan Yermo of the Organisation for Economic Co-operation and Development and participants at a workshop on charging for financial services at the FSA, London in December 1999 for very useful comments and advice.
Correspondence: Axia Economics, 38 Concanon Road, London SW2 5TA; telephone +44 (0) 171 274 3025; e-mail [email protected]; web: http://www.axiaecon.com; or HDNSP, World Bank, 1818 H St NW, Washington, D.C. 20433; telephone +1 202 473 0435; fax +1 202 522 7247; web: http://www.worldbank.org/pensions.

Table of contents 1. Pension fund institutional structures and charges............................................................7
2. Measuring charges...............................................................................................................10
2.1 A formal analysis of administrative charges ...............................................................11
2.2 Alternative measures of charges...................................................................................12
2.3 Empirical comparisons ..................................................................................................14
2.4 Robustness of charge measures to changes in assumptions: rate of return...........15
2.5 Robustness of charge measures to changes in assumptions: earnings....................17
2.6 Robustness of reduction in yield measure with contribution-based levies ............19
2.7 Charge measures and duration of the pension policy ...............................................21
2.8 Gaps in contribution profiles........................................................................................23
2.9 Conclusion: which is the appropriate measure of charges?......................................25
3. International comparison of charge levels ......................................................................26
3.1 Latin America..................................................................................................................26
3.2 OECD countries.............................................................................................................31
3.3 Transition economies.....................................................................................................44
3.4 Summary ..........................................................................................................................46
4. Strategies to control charges in funded pension systems..............................................47
4.1 Improving transparency.................................................................................................48
4.2 Restricting charge structures .........................................................................................48
4.3 Restricting charge levels.................................................................................................51
4.4 Cross-subsidies to low-income workers......................................................................53
5. Strategies to control costs of funded pension systems..................................................55
5.1 Alternative institutional arrangements for funded pension systems.......................55
5.2 Economies of scale: some evidence.............................................................................57
5.3 Constraining portfolios..................................................................................................58
6. Conclusions..........................................................................................................................60
Bibliography..................................................................................................................................61

Table of figures and tables Table 1. Possible approaches to pension industry structure and charges...........................10
Figure 1. The relation between asset charge and charge ratio..............................................15
Figure 2. Charge ratio under different rate of return assumptions......................................16
Figure 3. Gross and net pension under different rate of return assumptions....................17
Figure 4. Charge ratio under different earnings growth assumptions.................................19
Figure 5. Reduction in yield under different rate of return assumptions............................20
Figure 6. Reduction in yield under different earnings growth assumptions.......................21
Figure 7. Pension policy duration and the charge ratio.........................................................22
Figure 8. Pension policy duration and the reduction in yield ...............................................23
Figure 9. Gaps in pension contributions and the charge ratio .............................................25
Table 2. Pension charges in Latin America .............................................................................28
Table 3. Pension charges in Chile.............................................................................................30
Table 4. Pension charges in Australia by fund type ...............................................................32
Table 5. Regulated marginal charges as a percentage of assets for mandatory funded pensions by fund size class in Sweden.............................................................................34
Figure 10. Regulated marginal charges by size class of fund and by voluntary sector charge in Sweden .............................................................................................................................35
Table 6. Personal pension charges in the United Kingdom .................................................37
Table 7. Frequency distribution of personal pension charges in the United Kingdom ...38
Figure 11. Distribution of pension charge ratios in the United Kingdom .........................39
Table 8. Average pension charge ratio in the United Kingdom, 1989-98 ..........................40
Table 9. Pension charges in Poland..........................................................................................44
Figure 12. Charge ratio in funded pension schemes in thirteen countries .........................46
Figure 13. Time profile of payments of different types of charge.......................................49
Figure 14. Costs and revenues in the Argentine funded pension system, 1994-99...........50
Figure 15. Personal pension charges and performance over ten years ...............................53
Figure 16. Annual administrative expenses per member by external or internal management, Australia, 1996-97 ...............................................................................................................58

5
Administrative charges for funded pensions: An international comparison and assessment
Edward Whitehouse The price of financial services is of great consequence for consumers. Mistakes due to
misunderstandings or the expense of collecting information can be costly, especially with long-
term contracts, such as pensions. Furthermore, private pensions will for most people be their
most valuable asset or second most valuable after their home.
However, measuring the price of financial services is more difficult than other goods
and services. Fees can take many different forms. Different kinds of charge interact and
accumulate in complex ways, particularly with long-term products, such as pensions and life
insurance. This often means that the price of financial services is not transparent.
Administrative charges are also of central interest to policy-makers, for whom
adequacy of retirement incomes is an important goal. Whether adequacy is defined as a basic,
minimum level of income or a minimum level of earnings replacement, charges on funded
pensions will have an important effect. This is especially important when, as in many countries
studied here, private pensions will provide a large part of current workers’ retirement incomes.
The funded pensions discussed in this paper are ‘mandatory’ in an important sense.
All workers must have a funded pension in three of the countries covered1 while elsewhere, (at
least some) people have a choice between remaining in a (reformed) public pension program
or switching to the new pension funds.2 Because of the mandate in these pension programs,
governments have an implicit fiduciary duty to ensure participants get reasonable returns. This
1 Bolivia, Kazakhstan, Mexico. 2 See Disney, Palacios and Whitehouse (1999) and Palacios and Whitehouse (1998) for a discussion.

6
fiduciary duty is stronger than governments’ responsibility for voluntary savings. In addition,
with explicit public-sector guarantees of pension values or implicit guarantees through means-
tested social-assistance programs, the government has a financial interest in ensuring that
funds perform well. Finally, high charges might discourage participation and encourage
evasion, as people treat contributions as a tax rather than savings. These arguments provide a
case for potential government intervention to control charges for funded pensions.
With voluntary funded pension systems or those that will only provide a small part of
retirement income, the case for intervention is weaker. Nevertheless, there may be equity
concerns. High fixed elements to charges that could discourage lower-income workers from
participation might justify some kind of regulatory action. Some governments also offer
explicit guarantees of the size of funded pension benefits or implicit guarantees through
means-tested social assistance programs.3 Low net returns can then affect government
finances directly.
It is easy to lose sight of the essential policy objective — ensuring retirement-income
adequacy — in the often complex, technical and involved issues in administrative charges.
The main determinant of adequacy in defined-contribution pensions — the net rate of return
— depends on many different factors. Government regulations of pension fund managers’
structure, performance and portfolios, for example, can have a powerful influence.4
Administrative charges are part of a broader set of policies that affect the net rate of return on
pension contributions.
The remainder of the paper is structured as follows. The next section describes
different countries’ pension systems and their policies and approaches to administrative
charges. Section 2 presents a formal analysis of measuring charges, setting out the
characteristics of different charge measures used in the empirical evidence and their inter-
relationship. This analysis shows that some measures can be very sensitive to changes in
parameters such as the rate of return or the rate of individual earnings growth. Section 3
provides an empirical comparison of charges for thirteen countries whose pension systems
have a defined contribution element. These consist of eight Latin American countries, plus
3 See Pennachi (1998) and Turner and Rajnes (2000). 4 See Srinivas, Whitehouse and Yermo (2000).
7
Poland and Kazakhstan among the transition economies and Australia, Sweden and the United
Kingdom among the OECD.5
Section 4 assesses a range of policies to control charges. These include improving the
transparency and disclosure of charges, restricting the structure of charges, imposing ceilings
on charge levels and direct cross-subsidies to low-income workers’ pension accounts. Section
5 looks at policy issues in controlling pension fund management costs.6 It examines alternative
institutional arrangements to the individual-based schemes that operate in the majority of the
countries discussed here. Two collective alternatives are assessed: employer-based schemes
and centralized, public management of pension fund assets. Section 6 concludes.
1. Pension fund institutional structures and charges
The focus of this paper is on mandatory funded pension plans.7 The most familiar
example internationally is Chile, which replaced its defined-benefit, public pay-as-you-go
scheme with individual retirement-savings accounts in 1981.8 Much of Latin America now has
mandatory funded pension programs, although these differ substantially in structure, size and
scope.9
There have also been many pension-reform initiatives in the former socialist countries.
Hungary and Poland introduced new schemes in 1998 and 1999.10 Other countries — such as
the Czech Republic — have opted for a mainly voluntary approach to private pensions
initially. Policy-makers in other countries have seriously discussed fundamental reforms, but
5 Denmark, the Netherlands and Switzerland also have large mandatory or quasi-mandatory funded pension systems. Most plans in the Netherlands, however, have a defined-benefit formula. Hong Kong will make its employer-based defined contribution plans mandatory fund in 2000. Other countries in various stages of introducing mandatory defined-contribution pensions include Costa Rica, Croatia, Latvia, Macedonia, Nicaragua, Romania and Venezuela. 6 I have tried to be consistent in the use of the term ‘charges’ to mean the fees individuals pay to managers and the terms ‘costs’ to mean the expenses of the fund management company. 7 Most countries’ schemes are not strictly mandatory, in the sense that all workers must participate in the funded, defined contribution scheme. But most require employees to make some provision, often with a choice between continued participation in a public pay-as-you-go scheme or diverting some of their contribution to an individual pension account. 8 There is a large literature on the Chilean reform. Prominent examples include Arrau, Valdés-Prieto and Schmidt-Hebbel (1993), Diamond (1994), Arrau and Schmidt-Hebbel (1994) and Edwards (1999). 9 Queisser (1998) is a good survey. 10 See Palacios and Rocha (1998) and Chlon, Góra and Rutkowski (1999) respectively.
8
changes to the public scheme — such as changing pension ages, accrual structures, indexation
procedures etc. — have been the focus of efforts so far.
Finally, OECD countries have also focused on reforming public programs. Australia,
Sweden and the United Kingdom have introduced new systems of mandatory individual
pension accounts.11 Australia’s scheme, known as the superannuation guarantee, originated in
the mid-1980s as part of a national industrial-relations deal. The government, concerned about
low savings rates and inflation, wanted to hold wage increases down. The unions agreed to a
payment into pension accounts as a substitute for a wage rise. However, this agreement
applied to (mainly) large employers covered by the centralized bargaining system. In 1992, the
scheme was extended throughout the economy, with a mandatory superannuation contribution
that will be phased in over a decade or so. The United Kingdom extended the framework for
opting out of the public pension scheme to individual pension accounts in 1988. Sweden
introduced its reform in 1999.
There are many differences in the structure of pension systems in these different
countries. Those with a long history of funded provision — such as Australia, the United
Kingdom, and the United States — have very diverse systems. Some funded pensions have a
defined benefit formula, where the pension value depends on years of membership of the
scheme and some measure of earnings. Most employer-provided pensions in the United
Kingdom and around half in the United States are of this sort. Others schemes are defined
contribution, where the pension depends on the accumulation of contributions and investment
returns. These include a minority of employer-provided pensions in the United Kingdom
(often called ‘money purchase’ schemes) and plans covering around half of members in the
United States (usually 401(k) plans, named after the relevant clause of the tax code). Defined-
contribution provision has been growing at the expense of defined-benefit in both countries,
although more rapidly in the United States. The superannuation guarantee (Australia) and
stakeholder plans (United Kingdom) are also of this type. Individual plans, such as personal
pensions in the United Kingdom and individual retirement accounts in the United States are
also defined contribution vehicles.
11 See Bateman and Piggott (1997, 1999) on Australia; Whitehouse (1998) on the United Kingdom; and Scherman (1999), Sundén (1999) and Palmer (2000) on Sweden.

9
In contrast, the new systems in Latin America and Eastern Europe are less diverse.
They have just a single defined-contribution program, usually based on individual accounts
with member choice of provider, along with a public scheme of varying size. These
differences in pension-industry structure are likely to have important effects on the level of
costs and charges.
Moreover, countries have taken very different approaches to charges. Table 1 tries to
characterize these with a single, simple metric. The most liberal regimes (subjectively
determined) are at the top, the most restrictive at the bottom.
The richer countries — Australia, Hong Kong, the United Kingdom and the United
States — tend to have few, if any, restrictions on charges. This is explained in part by the fact
that private pensions in the United States remain voluntary and the other countries built on
pre-existing voluntary systems.
Other countries limit the charge structure. Only one or two types of charge are
permitted from the possible menu (e.g., fixed versus variable rate, contribution versus assets
based charges etc.). Poland is slightly more restrictive, in that companies are limited to two
charges, one of which is subject to a ceiling although the other can take any value. Sweden has
a single charge up to a ceiling, but the limit varies with a complex formula to try to allow for
pension fund managers with different costs. Finally, the United Kingdom, with its new
stakeholder scheme will have a single charge with a low ceiling. This is also the regime in
Kazakhstan.
The Table also shows some alternative approaches. Many of the restrictions in the
countries listed above are designed to cross-subsidize lower paid workers. Without
restrictions, pension funds might charge relatively high fixed charges to reflect their fixed
costs. These would bear particularly heavily on low-paid workers, and, at the extreme, could
even take up all of their contributions. Mexico takes a more transparent approach, subsidizing
low-paid workers directly with a flat-rate government contribution paid on behalf of all
workers. Australia and the United Kingdom exclude many lower-paid workers from their
system.

10
Table 1. Possible approaches to pension industry structure and charges Strategy Country examples No restrictions Australia (superannuation guarantee)
Hong Kong United Kingdom (personal pensions) United States (401(k) plans)
Cross-subsidies to low-paid workers Mexico
Limits on charge structure Argentina Chile Hungary
Limits on charge structure and partial ceiling Poland
Variable ceiling on charges Sweden
Competitive bidding, multiple portfolios United States (thrift savings plan)
Fixed charge ceiling El Salvador Kazakhstan United Kingdom (stakeholder pensions)
Competitive bidding, single portfolio Bolivia
The final generic approach to charges is to hold a competitive auction to manage
pension assets in which charges play a prominent in the selection process. The Thrift Saving
Plan, a defined-contribution scheme for employees of the United States federal government,
holds periodic auctions for the rights to manage a small number of portfolios for its members.
Bolivia licensed just two managers for its funded pension system, after an international bidding
process.
Before turning to the empirical analysis, it is useful to look at issues in the
measurement of administrative fees.
2. Measuring charges
Charges on long-term financial products, including pensions, are levied in many
different ways. Some are one-off fees, usually a fixed sum payable up-front, although some
initial charges can be proportional to contributions in, say, the first year. Other one-off fees
are payable at the end of the term: one example is the charge for exercising an open-market
annuity option in a personal pension plan in the United Kingdom.
Others fees are ongoing. They can be a fixed fee per period, a percentage of
contributions or a percentage of the assets in the fund.
more restrictive

11
The variety of different levies means that it is impossible to measure of costs at any
point in time: the only meaningful calculation is over the lifetime of pension membership.
2.1 A formal analysis of administrative charges
Summarizing the different charges in a single number raises a host of complex issues.
This section, building on Diamond (1998, Appendix B), sets out a simple model to show the
relationship between different summary measures of charges. This formal analysis is an
important pre-requisite for choosing between different measures and understanding the
implications.
Individual earnings are assumed to grow at a rate g. Earnings at a given period t in
continuous time12 can be written as a multiple of earnings in period 0, when the individual
joins the pension fund
gtt eww 0= (1)
Assume a pension contribution rate as a proportion of earnings of c. The first type of charge
considered is one as a proportion of contributions, a1. The net inflow into the pension fund at
time t net of this charge is
gtewac 01 )1( − (2)
These contributions earn an annual investment return, r. However, an annual management
charge, a2, is levied as a proportion of the fund’s assets. So the net accumulation in the fund at
the end of the term (time T) from contributions made at time t is
))((01
2)1( tTargt eewac −−− (3)
12 Bateman, Doyle and Piggott (1999) present a similar model in discrete time.

12
Integrating (3) from time 0, when the pension plan is started, to time T, when accumulated
funds are withdrawn, gives the total fund as
rageewac
TragTar
−+−
−−+
−
2
)()(
011)1(
22
(4)
Any one-off charge, payable up-front (a0), would have earned an investment return up to
pension withdrawal. The pension benefit is therefore reduced by
Tarea )(0
2− (5)
A proportional exit charge, a3, can be deducted from the final accumulation in (4). Allowing
for all these charges gives the total net accumulation as
)1(1)1( 3
)(0
2
)()(
012
22 aea
rageewac Tar
TragTar −
−
−+−
− −−+
− (6)
Finally, to evaluate the impact of charges, it is useful to show the pension benefit that would
accumulate in the absence of any levies (i.e., setting all the a terms to zero)
rgeecw
TrgrT
−−− 1)(
0 (7)
To summarize, the equations above give lifetime pension contributions plus the investment
returns they earn less four different types of charges: a fixed, up-front fee (a0); a levy on
contributions (a1); an annual charge on the assets of the fund (a2); and an exit charge as a
proportion of the accumulated balance (a3).
2.2 Alternative measures of charges
There are four main potential measures of charges:13
13 The first three are suggested in the Financial Services Authority’s (1999) consultation paper on league tables, itself based on the detailed analysis by Bacon and Woodrow (1999). The charge ratio was proposed by Diamond (1998).

13
• The reduction in yield shows the effect of charges on the rate of return, given a set of
assumptions about the rate of return, the time profile of contributions and the term of the
plan. So, if the gross return assumed were 5 per cent a year and the reduction in yield 1.5
per cent, then the net return would be 3.5 per cent a year. In essence, equation (6) is
calculated as it stands, and then solved for the value of a2 that gives the same total
accumulation assuming that the up-front charge (a0), contribution-related fee (a1) and exit
charge (a3) are all zero.
• The reduction in premium shows the charge as a proportion of contributions, again for a
set of assumptions about investment returns etc. All of the other charges are in this case
subsumed into a1 in equation (6), rather than a2 in the reduction-in-yield case.
• The third measure, called MP1, was developed within the Financial Services Authority
(James, 2000). MP1 is the price of a managed portfolio that yields the market return,
excluding charges, on £1.
• A final measure is the charge ratio. This is defined as one minus the ratio of the
accumulation net of charges to the accumulation without charges, i.e., one minus the ratio
of equation (6) to equation (7).
These different measures are closely related. For example, the charge ratio is exactly
the same as the charge measured as a proportion of contributions (the reduction in premium).
To see this, write the accumulation, net of just a charge on contributions, a1
rgeewac
TrgrT
−−
−− 1)1()(
01 (8)
The charge ratio is one minus equation (8) divided by equation (7), which is simply a1, the
charge on contributions.
There seems to be some confusion about the inter-relationship between these different
measures. Murthi, Orszag and Orszag (1999) argue: ‘An alternative but fundamentally
equivalent, approach [to the charge ratio] is to compute an “annual charge equivalent” that
captures all costs and expresses them on an annualized basis’. They cite Rea and Reid’s (1998)
study of charges on mutual funds in the United States as an example of this approach, which is
the reduction-in-yield method. But the two measures can give different answers over relative
charges when assumptions are constant, and move in different directions when assumptions
change. The two measures, then, are not ‘fundamentally equivalent’.

14
2.3 Empirical comparisons
The different measures can be compared in practice by calculating equation (6) for a
variety of charges. The baseline assumptions are that individual earnings grow by 3 per cent a
year and annual investment returns are 5 per cent. Contributions are paid for a 40-year term.
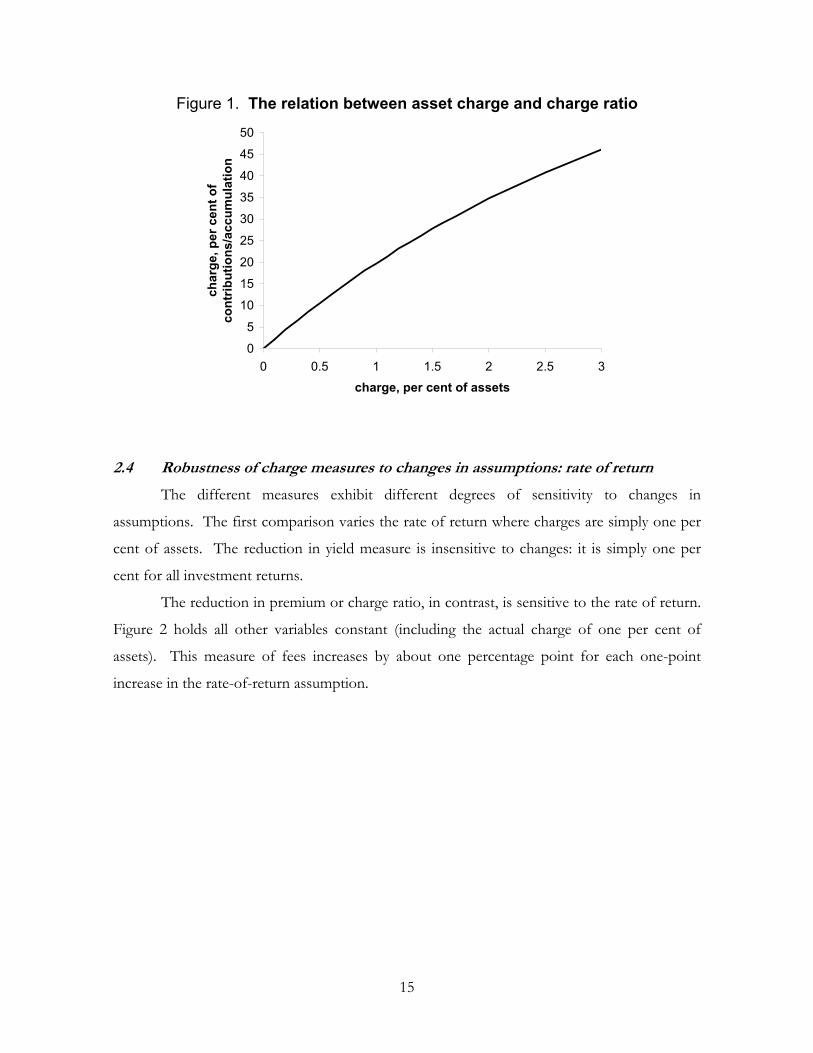
Figure 1 compares the first two measures — reduction in yield and the charge ratio (or
reduction in premium) — given a single charge as a percentage of assets. The horizontal axis
varies this charge between zero and 3 per cent. The vertical axis shows the effect this charge
would have on the final pension value (the charge ratio). As discussed previously, a charge on
contributions of this rate would have exactly the same effect on the final pension value. The
Figure shows that quite low charges on assets build up over the long period of a pension
investment to reduce the pension value substantially. A levy of one per cent of assets, for
example, adds up to nearly 20 per cent of the final pension value (or, equivalently, is 20 per
cent of contributions).
The relationship between the two measures is non-linear, but the deviation from
linearity is not large. The choice of either measure would not make much difference in
comparing either individual plans or countries’ systems with different levels of charges for a
given level of earnings growth and real returns. (These important conditions are discussed in
the following sub-sections.) For example, the doubling in asset management charges from 0.5
to 1 per cent a year increases the charge ratio by nearly 90 per cent. So the comparison of
reduction in yield gives very similar results to the comparison of charge ratios.
15
Figure 1. The relation between asset charge and charge ratio
0
5
10
15
20
25
30
35
40
45
50
0 0.5 1 1.5 2 2.5 3charge, per cent of assets
char
ge, p
er c
ent o
f co
ntrib
utio
ns/a
ccum
ulat
ion
2.4 Robustness of charge measures to changes in assumptions: rate of return
The different measures exhibit different degrees of sensitivity to changes in
assumptions. The first comparison varies the rate of return where charges are simply one per
cent of assets. The reduction in yield measure is insensitive to changes: it is simply one per
cent for all investment returns.
The reduction in premium or charge ratio, in contrast, is sensitive to the rate of return.
Figure 2 holds all other variables constant (including the actual charge of one per cent of
assets). This measure of fees increases by about one percentage point for each one-point
increase in the rate-of-return assumption.

16
Figure 2. Charge ratio under different rate of return assumptions (charge of one per cent of assets)
0
5
10
15
20
25
0 2 4 6 8 10rate of return, per cent
char
ge, p
er c
ent o
f co
ntrib
utio
ns/a
ccum
ulat
ion
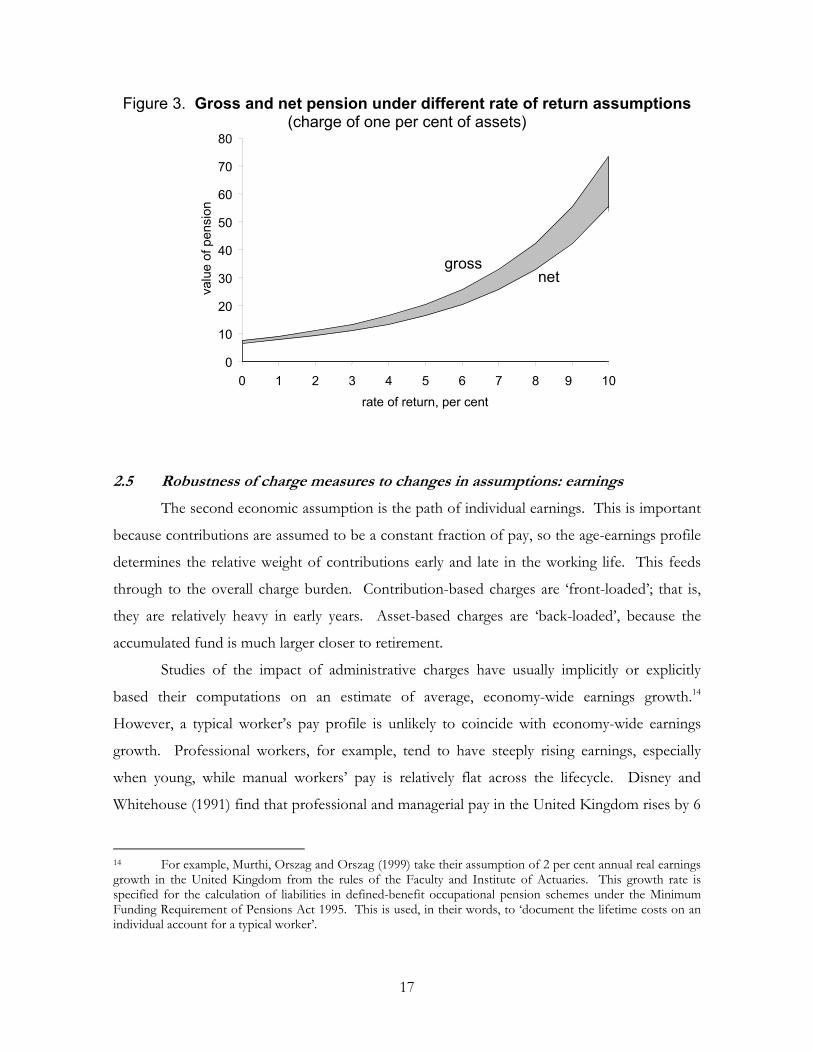
Is it desirable that the measure of charges should vary with the rate of return? Figure 3
illustrates the issue. It shows the value of the pension before charges and net of charges (again
assumed to be one per cent of assets) for different rates of return. The gray area in between is
the absolute value of the charges. Total fees paid increase more rapidly than the gross
accumulated pension: the gray area gets wider as the rate of return increases. This favors a
charge measure, such as the charge ratio or reduction in premium, which varies with the rate of
return.
However, the increased rate of return obviously increases both gross and net pension.
An increase from the baseline assumption of five per cent rate investment returns to six per
cent would raise the gross pension by 26 per cent and the net pension by 24½ per cent. The
extra pension from the higher return is more than the whole of the charge ratio. Yet the
charge ratio increases by one percentage point as the rate of return increases by one point.
And a higher charge ratio, of course, implies that the pension member is worse off, when in
fact they are substantially better off. This is a significant disadvantage of the charge ratio (or
reduction in premium) as a measure of the price of financial services.
17
Figure 3. Gross and net pension under different rate of return assumptions (charge of one per cent of assets)
0
10
20
30
40
50
60
70
80
0 1 2 3 4 5 6 7 8 9 10rate of return, per cent
valu
e of
pen
sion
grossnet
2.5 Robustness of charge measures to changes in assumptions: earnings
The second economic assumption is the path of individual earnings. This is important
because contributions are assumed to be a constant fraction of pay, so the age-earnings profile
determines the relative weight of contributions early and late in the working life. This feeds
through to the overall charge burden. Contribution-based charges are ‘front-loaded’; that is,
they are relatively heavy in early years. Asset-based charges are ‘back-loaded’, because the
accumulated fund is much larger closer to retirement.
Studies of the impact of administrative charges have usually implicitly or explicitly
based their computations on an estimate of average, economy-wide earnings growth.14
However, a typical worker’s pay profile is unlikely to coincide with economy-wide earnings
growth. Professional workers, for example, tend to have steeply rising earnings, especially
when young, while manual workers’ pay is relatively flat across the lifecycle. Disney and
Whitehouse (1991) find that professional and managerial pay in the United Kingdom rises by 6
14 For example, Murthi, Orszag and Orszag (1999) take their assumption of 2 per cent annual real earnings growth in the United Kingdom from the rules of the Faculty and Institute of Actuaries. This growth rate is specified for the calculation of liabilities in defined-benefit occupational pension schemes under the Minimum Funding Requirement of Pensions Act 1995. This is used, in their words, to ‘document the lifetime costs on an individual account for a typical worker’.

18
per cent a year and manual workers’, by around 2 per cent a year. (Based on hourly wage rates
using Family Expenditure Survey data for 1978-86.) The more complex pseudo-cohort
analysis of Meghir and Whitehouse (1996) confirms this earlier result using an eighteen-year
time series of data. Wage differentials have been increasing recently, suggesting that the
difference between manual and professional earnings profiles is now probably larger.15
Economy-wide earnings growth averages across a range of cohorts of different sizes. So there
is no reason why the mean of any given cohort’s lifecycle pay should coincide with aggregate
changes in wages across the same period. The actuaries’ assumptions, applied to defined-
benefit plans, also average across a range of different cohorts. Their assumption is appropriate
for this purpose, but not for computing an individual’s pay profile.
Age-earnings profiles vary between countries as well as between occupational groups.
For example, cross-section data show a sharp decline in earnings at older ages in Australia,
Canada and the United Kingdom. In France, Germany and Italy, the older workers tend to be
paid the same or more than people of prime age are.16
Figure 4 shows how the charge ratio measure varies with the assumed rate of earnings
growth. Each one-point increase in earnings growth reduces the charge ratio by around one
percentage point (when fees are one per cent of assets). With two-per-cent pay increases, the
charge ratio is 20 per cent, but only 16 per cent with increases of six per cent a year. This
higher growth rate, I argued, is more typical of workers in white-collar jobs.
15 See Meghir and Whitehouse (1996) on the United Kingdom. 16 See OECD (1998b) and Disney and Whitehouse (1999), section 8.2.2 for detailed data.

19
Figure 4. Charge ratio under different earnings growth assumptions (charge of one per cent of assets)
0
5
10
15
20
25
0 2 4 6 8 10individual earnings growth rate, per cent
char
ge, p
er c
ent o
f co
ntrib
utio
ns/a
ccum
ulat
ion
2.6 Robustness of reduction in yield measure with contribution-based levies
Asset based charges are a common form of charge for many financial products. As
section 2 illustrated, however, the managers of mandatory funded pensions in Latin America
tend to levy fees on contributions. With asset-based charges, the reduction in yield is, by
definition, unaffected by model assumptions, such as rate of return and individual earnings
growth. The charge ratio or reduction in premium is, in contrast, sensitive to changes in these
variables.
With contribution based levies, the reverse is true. Since the charge ratio is equal to the
levy as a proportion of contributions, this is by definition constant as other variables are
changed. The reduction in yield, however, is not. Figure 5 begins by looking at the effect on
this charge measure of varying the rate of return, assuming that the levy is ten per cent of
contributions. (This chart can be compared with Figure 2.) A higher rate of return reduces
the reduction in yield measure, even though total charges paid remain the same. The absolute
magnitude of the effect of a one-point change in the return is broadly similar to the impact on
the charge ratio when levies are based on assets, although the effect is in the opposite
direction.

20
Figure 5. Reduction in yield under different rate of return assumptions (charge of 10 per cent of contributions)
0
0.25
0.5
0.75
1
0 2 4 6 8 10rate of return, per cent
char
ge, p
er c
ent o
f ass
ets
Figure 6 shows a similar result for variations in the assumption of individual earnings
growth. Again, the magnitude of the change in the measure is similar but the direction
different from the effect of changes in earnings growth on the charge ratio with an asset-based
levy.

21
Figure 6. Reduction in yield under different earnings growth assumptions (charge of 10 per cent of contributions)
0
0.25
0.5
0.75
1
0 2 4 6 8 10earnings growth, per cent
char
ge, p
er c
ent o
f ass
ets
2.7 Charge measures and duration of the pension policy
The analysis so far has assumed a full 40 years of contributions to the pension plan.
Yet many people do not have such as consistent contribution profile. Many of the issues
raised in measuring charges when policy terms vary will be considered in more detail in section
4, which looks at which types of charge are optimal.
Figures 7 and 8 look at the impact on charges of a shorter period of contributions,
assuming that the individual withdraws the benefit when contributions cease. This can be
thought of as the cost of taking out a pension for someone already in the labor market (or,
perhaps, someone who will retire early). As before, the reduction in premium measure is
unaffected if charges (in practice) are levied on contributions and the reduction in yield is
insensitive to the policy term if charges are asset-based.
Figure 7 shows the charge-ratio or reduction-in-premium measure for a range of
durations of pension membership, assuming that the charge in practice is one per cent of
assets. The reduction in yield measure is, of course, constant, while the charge ratio increases
linearly with the length of investments by 0.5 percentage points for each extra year. This is
because a one-year policy is charged just once, while the first year’s contributions for a two-
year policy are in effect charged twice. For short-term policies, much of the pension benefit is

22
made up solely of the contributions, while investment returns have a relatively small effect.
When a pension is held for a long period, most of the accumulated value comes from the
investment returns rather than the nominal value of contributions.
The relationship between net and gross pension for different policy periods and the
charge ratio is very similar to the relationship with the rate of return illustrated in Figures 2 and
3. A pension held for a long period is larger because of the impact of compound interest. So
the charge ratio increases, but by much less than the increase in the net pension. This is an
undesirable feature, because pensions are supposed to be long-term investments. By showing
that shorter-term pensions are ‘cheaper’, this is not only counter-intuitive but also, if used by
consumers or their advisors, could be misleading.
Figure 7. Pension policy duration and the charge ratio (charge of one per cent of assets)
0
5
10
15
20
25
0 10 20 30 40 50term, years
char
ge, p
er c
ent o
f co
ntrib
utio
n/ac
cum
ulat
ion
Figure 8 shows the opposite case to Figure 7. It shows the effect on the reduction in
yield of differing policy terms when the charge in practice is ten per cent of contributions. The
relationship is now in the opposite direction, with longer-term policies appearing to be
cheaper. It is also non-linear. This is simply the inverse of the effect explaining the pattern in
Figure 7. Contribution-based charges are spread over many more years as duration lengthens,
reducing their impact when measured against assets. This might also be construed as a

23
misleading picture of pension costs. The absolute value of charges paid increases with a longer
term and, in this simulation, the charge as a percentage of contribution is constant while the
reduction in yield shows a decline.
Figure 8. Pension policy duration and the reduction in yield (charge of 10 per cent of contributions)
0
1
2
3
4
5
0 10 20 30 40 50term, years
char
ge, p
er c
ent o
f ass
ets
2.8 Gaps in contribution profiles
The previous section showed the effect of a shorter period of contributions than the
40-year baseline assumption, but still one that terminated with the withdrawal of funds.
People’s contribution profiles in practice are likely to be a good deal more complicated, with
gaps arising from periods of unemployment, working in the informal sector of the economy,
caring for relatives etc.
During a gap in contributions, charges on the assets in the fund continue to be levied,
but contribution-based fees are obviously zero. For simplicity, assume that the worker
contributes for an initial period (0…N) and then stops contributing, but the funds remain
invested as before to time T (when the pension is withdrawn).

24
At the point when contributions are stopped, the accumulated fund, net of
contribution and asset based levies (a1 and a2 respectively) is given by equation 4, substituting
N for T
rageewac
NragNar
−+−
−−+
−
2
)()(
011)1(
22
(9)
After N, when contributions are stopped, the fund continues to grow by the rate of return, net
of charges, giving the total accumulation as
rageewac
NragTar
−+−
−−+
−
2
)()(
011)1(
22
(10)
Figure 9 shows how contribution gaps affect charges as a percentage of contributions
or the total pension fund accumulation. At 40 years, the result is the same as for a full lifetime
contribution: the charge ratio is around 20 per cent. At the midpoint of the curve, the worker
is assumed to contribute for 20 years, and then leave the fund for another 20 years. With the
rate of return invested by the fund reduced by the assets-based charge over this period, the
charge ratio is now 26 per cent.
In these cases, the reduction in yield measure is no longer simply equal to the asset-
based charge. With 20 years of contributions and 20 years without, the reduction in yield is
around 1.4 per cent. The effect on this measure of varying the period without contributions is
very similar to the impact on the charge ratio.

25
Figure 9. Gaps in pension contributions and the charge ratio (charge of one per cent of assets)
0
5
10
15
20
25
30
35
0 10 20 30 40period of contributions
char
ges,
per
cen
t of
cont
ribut
ions
/acc
umul
atio
n
2.9 Conclusion: which is the appropriate measure of charges?
No measure of charges can summarize simply and accurately the many different kinds
of fees that are levied on financial products. Our concern should therefore be to minimize the
loss of precision in this process of simplification.
All measures — reduction in premium, reduction in yield, MP1 — deliver sensible
answers much of the time. An increase in a levy of any possible type increases the measure
and, in general, the measured increase is proportionate. MP1 has the drawback that it is not
mathematically robust when net returns are negative zero or even small and positive.
Murthi, Orszag and Orszag (1999) contend: ‘Although expressing fees in terms of
annual basis points may be most familiar to investors, that form is not necessarily the most
insightful’. However, the sensitivity of both charge ratio and reduction in yield to assumptions
about the rate of return and individual earnings growth means that any single measure could be
misleading. A first preference must be for both measures, along with an analysis of the
sensitivity of the results to the underlying economic assumptions.
If a single measure of charges is required, the analysis above shows that the most
appropriate choice depends on the type of levies used in practice and their relative importance.
If, for example, most of the cost of a typical policy is due to levies on assets, then the
26
reduction in yield measure gives the most robust results. Similarly, if charges on contributions
(or exit charges) are a more important burden on the pension fund, then the reduction in
premium will be more robust.
In the United Kingdom, for example, around 70 per cent of the total charge (on either
measure) derives from the annual asset-management fee of 0.9 per cent. The remainder comes
mainly from the contribution-based levy. The annual management charge would only be
significant for a very small absolute value of contributions. This suggests that the reduction in
yield would be a less distortionary measure of the impact of fees than the reduction in
premium or charge ratio. It is more robust to changes in assumptions of the term the pension
policy is held, the rate of return and the rate of earnings growth. The reverse is true in most of
Latin America, where contribution-based levies predominate. There, the charge ratio would be
a more robust measure.
When comparing funds or systems which rely on different types of charge, reliance on
a single measure can be misleading, and the best approach is to use both the charge ratio and
the charge as a proportion of assets.
3. International comparison of charge levels
This section presents estimates of charges, drawn from a variety of sources, in thirteen
different countries.17 It begins with eight Latin American countries, followed by three OECD
countries and two economies in transition.
3.1 Latin America
Excluding Bolivia, which is discussed separately below, there are three basic structures
of charges in Latin American countries.
17 Note that the paper deliberately avoids discussion of the United States for three reasons. First, because a good deal has been written elsewhere; secondly, because the United States does not currently have a mandatory funded pension system; and finally, because the reform debate has become extremely heated. With social security reform already an important issue in the presidential election campaign, the issue of charges has become a particular contention. The NBER will shortly publish the proceedings of a conference on administrative costs (Shoven, 2000). The Employee Benefits Research Institute (Olsen, 1998; Olsen and Salisbury, 1998) and the General Accounting Office (1999a,b) have also produced relatively balanced analyses.

27
First, pension funds in four countries — Colombia, El Salvador, Peru and Uruguay —
levy a charge only on contributions. Secondly, in Argentina and Chile, funds levy a mix of a
fixed administrative fee and a charge on contributions. In Argentina, five funds do not levy a
fixed fee, while the other eight levy an average of $3.85 a month. In Chile, all but one of the
funds have a fixed charge, averaging just $1 a month. Finally, Mexico’s charges are the most
complex in Latin America. There are five different structures. Three funds levy a fee just on
contributions. Nine firms make charges both on contributions and on the value of assets in
the fund and one company levies a fee only on the investment returns. Eight firms also offer
discounts to long-term members of their funds.
There are two complications with comparing charges between these seven Latin
American countries. First, in four countries — Chile, Colombia, El Salvador and Peru —
charges are levied on top of the mandatory contribution. In Chile, for example, the
compulsory contribution is 10 per cent of pay. With the average charge level on top, the total
contribution is 11.6 per cent. Elsewhere, the charge is taken out of the gross contribution. In
Argentina, for example, the compulsory contribution is also 10 per cent of earnings, but a
charge averaging 2.3 per cent is deducted from this, giving a net inflow to pension funds of 7.7
per cent of pay.
Secondly, all of these systems also include mandatory private disability insurance. The
insurance premia are collected as part of the charge, even though pension managers usually
pass this straight on to separate insurance companies. The disability premium has been
deducted from charges.
Table 2 shows the results. There is considerable variation in the mean level of charges,
ranging from a charge ratio of 13.5 per cent in Colombia to 26 per cent in Mexico. These are
equivalent to reductions in yield of 0.65 and 1.4 per cent respectively.
There are also large differences between countries in the variability of charges. The
relatively small number of funds in Peru, El Salvador and Uruguay levy very similar fees. In
Mexico and Argentina, in contrast, there is much greater variation. In the former, for example,
three funds charge the equivalent of 19 per cent of contributions while four funds levy 30 per
cent or more.

28
Table 2. Pension charges in Latin America per cent Unweighted mean
charge Weighted mean
charge Range of charges
Number of funds
Reduction in yield
Charge ratio
By assets
By members
Lowest Highest
Colombia 8 0.65 13.5 14.0 14.1 11.9 16.7 Uruguay 6 0.72 14.7 14.4 14.6 13.2 15.8 El Salvador 5 0.85 17.1 17.0 17.0 16.1 18.4 Chile 8 0.88 17.7 16.2 16.1 14.5 20.4 Peru 5 0.96 19.1 19.0 19.1 18.6 20.0 Argentina 13 1.20 23.1 24.4 24.6 17.4 27.9 Mexico 13 1.39 26.0 24.5 26.2 19.3 35.4
Source: author’s calculations based on Federación Internacional de Administradoras de Fondos de Pensiones (2000). Data for December 1999
The columns showing the weighted mean charge provide some evidence on the
relationship between fund size and the level of charges. One might expect a negative
correlation between these two variables. First, if fees reflect costs and there are economies of
scale in managing pension funds, then larger funds would levy lower charges. Secondly, if
consumers shop around for lower charges, then cheaper funds would attract more members.
If there were a negative relationship between charges and fund size, then the weighted
mean charge would be below the unweighted mean. This is rarely the case in practice. In
Argentina, for example, the weighted mean charge ratio is 1 to 1.5 percentage points higher
than the unweighted average. There is a positive rather than a negative correlation between
charges and fund size: the correlation coefficients are 0.54 and 0.62 weighted by value of assets
and number of members respectively. Note that this does not rule out a negative relationship
in practice because the measure of charges is based on an example worker. High earners will
be attracted to funds with relatively high fixed charges and low variable charges. If this
‘streaming’ of workers into different funds operates in practice, actual charges will be lower
than measured. Unfortunately, the micro data on individuals in particular funds necessary to
examine this effect is not available.
In Chile, the reverse relationship to Argentina holds, with a weighted mean charge ratio
1.5 percentage points lower than its unweighted value. The correlation coefficients are –0.95
and –0.82 respectively. This suggests that larger funds are cheaper. Among the other
countries, Colombia exhibits a fairly strong positive relationship between charges and fund
size, with similar correlation coefficients to Argentina. In El Salvador, Peru and Uruguay,
there is a weak negative relationship. In Mexico, the results are more complex. There is no

29
relationship between the charge level and the number of members in a fund, but there is a
positive correlation between charges and the value of assets under management. There are
two potential explanations for this pattern. First, there are economies of scale with respect to
assets under managed and not to the number of members. Secondly, members with larger
funds are more responsive to price. Both of these explanations are, of course, speculative.
A related study, mainly of Argentina (FIEL, 1999), looked at the relationship between
charges and the inflow and outflow of members in particular pension funds. The authors
regressed for 1994-97 the numbers moving into a fund, the numbers moving out and the net
overall flow on charges, loyalty bonuses awarded by the funds and relative fund performance.
There appeared to be no effect of charges on flows of new members into funds in either
direction, but higher charges are associated with a larger loss of existing members. The
relationship with marketing, sales and advertising expenditure was the other way round.
Higher promotional spending seemed to result in higher inflows, but had no significant effect
on outflows. Considering these two effects together, the authors conclude that it pays more to
increase spending on advertising etc., even if this means higher charges, because the elasticity of
net flows of members is approximately twice as large relative to marketing spending as it is to
charges. However, the paper also finds that the competitive effect of charges has grown over
time.
The results in Table 2 make the very strong assumption that charges remain unchanged
throughout the lifetime of the pension contract. But the schemes differ in their maturity: El
Salvador’s was introduced in 1998, Mexico’s in 1997, Uruguay’s in 1996, Argentina and
Colombia’s in 1994 and Peru’s in 1993. Chile’s funded pension system has been operating the
longest: since 1981. This offers an opportunity to look at the development of charges as the
pension system matures. Table 3 shows how the structure evolved in the late 1980s and early
1990s.
Three different types of charges were permitted initially: a monthly lump-sum payment,
an additional payment as a percentage of salary and an annual levy of a percentage of the
outstanding balance in the fund. In 1988, the last of these charges was prohibited.

30
Table 3. Pension charges in Chile Fixed charge (US$
per year) Variable charge
(per cent of earnings)
Annual charge (per cent of fund)
Charge ratio (per cent)
1987 10 3.4 0.33 30.3 1988 11 3.6 — 26.4 1989 8 3.3 — 24.8 1990 6 3.0 — 23.1 1992 4 2.9 — 22.5
Source: author’s calculations based on Valdés-Prieto (1994)
The most striking feature of the charging structure in Chile is the declining importance
of the fixed monthly payment. Since 1988, this has fallen by two-thirds, while the average
overall charge has fallen by a quarter. The short-term response to the prohibition of asset-
based fees was a rise in the other charges. But within two years, the pension fund managers
themselves had absorbed the loss of revenues, and both fixed and contribution-based levies
were below their 1987 level.
This suggests caution is required in comparing charges between countries. All
measures of charges are based on the strong assumption that their value does not vary over
time, which the Chilean example refutes.
3.1.1 Bolivia
Bolivia’s system is very different from the other Latin American countries. The
government chose to auction the rights to manage two pension funds internationally. Of the
73 companies expressing an initial interest, twelve applied. These were whittled down to short
list of nine. Regulations and guarantees were then specified, which resulted in only three
applicants at the final stage. The government picked two firms based on their asset-
management fee.18
The successful bidders have a five-year guarantee of their duopoly, and a guarantee of
initial market share. People will be assigned at random to the two funds, and will be only
18 See Von Gersdorff (1997), Ballivian (1997), Ewing and Goldmark (1994) and World Bank (1995) for discussion of the Bolivian reform.

31
permitted to transfer from 2000, three years after the new regime was introduced. New firms
can enter the market after 2002.
This process has kept charges low: 5 per cent of contributions and 0.23 per cent of
assets. This translates into a charge ratio of 9.8 per cent and a reduction in yield of 0.46 per
cent.
In part, this results from the structure of the market. With just 300,000 pension
members, contributing under $100 million a year, having only two managers allows them to
take advantage of (limited) economies of scale. The initial guarantee of market share allows
the companies to spread their set-up costs over a period and the absence of member choice
limits the need for marketing. However, the successful firms were also given $1.7 billion of
privatization proceeds to manage, equivalent to 15 or more years of contributions to the
mandatory pension system.19 There is likely to be a significant cross-subsidy from the fee paid
to manage these assets to the charges on pension accounts.
3.2 OECD countries
3.2.1 Australia
Australia’s superannuation-guarantee system was established in 1992. In 2002, the
phased increase in contribution rate will be complete, and employers will then be required to
contribute 9 per cent of employees’ pay. Low-income workers — earning less than A$5,400 a
year — are specifically excluded on the grounds that fees would eat up their contributions.
Charges for superannuation funds are typically a combination of a fund-management
fee as a percentage of assets plus flat-rate administrative fees per account and/or a charge as a
percentage of contributions. Neither the structure nor the level of charges is regulated.20
Moreover, although fees must be set out in a ‘key-features’ statement before purchase, it is
often difficult to work out how much has been paid until an annual benefits statement arrives.
The superannuation mandate encompasses a wide range of different funds. In
practice, most workers are members either of collective schemes known as industry funds or
19 These assets will finance the ‘Bonosol/Bolivida’ program, which will pay a flat-rate benefit to all Bolivians over 65 separately from the funded scheme. 20 The only exception is the protection of small accounts: charges are not permitted to reduce the account balance below A$1,000.

32
so-called master trusts, which are individual pension accounts. There are over 100 industry
funds and 350 master trusts.21 Table 4 shows typical charges for these two types of plan.
Table 4. Pension charges in Australia by fund type Industry fund
(collective plan) Master trust
(individual plan) Flat-rate A$45 per annum A$70 per annum
Proportion of contributions — 4.5%
Proportion of assets 0.45% 1.3% (administration) 0.6% (fund management) less bonus for large funds
Reduction in yield 0.51% 1.9% Charge ratio 11.2% 35.5% Source: Bateman and Valdés-Prieto (1999). See also Bateman, Doyle and Piggott (1999) Note: assumes 9 per cent contribution rate, real return of 5 per cent a year and earnings growth of 1 per cent a year. Industry funds are not required to disclose asset-management fees (usually paid to a subcontractor): anecdotal evidence suggests 0.4-0.5 per cent is typical. Data are for 1999
The last two rows of Table 4 show how these fees translate into the standard measures
of charges. The difference between the two types of plan is now stark. Investment in an
industry fund reduces the return by 0.5 per cent a year, compared with 1.9 per cent a year for
master trusts.
It is easy to see from Table 4 why the government chose to exclude low-income
workers. In a master trust, the fixed fee and the contribution-based levy would total over 19
per cent of contributions for a worker earning the A$5,400 minimum. This would translate
into a total charge ratio of 46 per cent. Indeed, the government is considering making
contributions optional for employees earning between A$5,400 and A$10,800.
The large difference in charges between the two types of scheme — by a factor of
three or more — could have many potential explanations. Bateman, Doyle and Piggott (1999)
propose ‘a combination of differences in governance, historical ethos, institutional practices
and industry structure’. Industry funds were established as part of a national industrial-
relations agreement. Trades unions pushed for a low-cost form of pension provision. These
funds have a mutual structure, with trustees drawn from participating employers and
21 See Australian Prudential Regulatory Authority (1999).

33
employees. They have essentially a captive membership, so there is little need for marketing
and no need for a sales network.
Master trusts, in contrast, are offered by traditional (generally profit-making) financial-
services companies. Although the board that runs the schemes includes some independent
trustees, the latter have no direct relationship with the plan’s members. There is a substantial
degree of marketing and a broad sales and distribution network. Service levels, including
communication, information and choice of portfolio, tend to be better than in the industry-
fund sector. Master trusts are also often sold as part of a complete package of financial
services by financial conglomerates and they offer tailored insurance options that are not
available from industry schemes.
The government introduced a new instrument in July 1997, known as retirement
savings accounts (RSAs). These accounts, provided by banks, building societies and other
financial institutions, are designed to be a simple, low-cost, low-risk way of saving small
amounts for retirement. The funds are invested in deposits and taxed in the same way as
superannuation. Investors are warned that they should graduate to more diversified
investments once their assets exceed A$10,000. RSAs therefore remain a small part of the
Australian pension sector, with just 1½ per cent of total pension assets.22
3.2.2 Sweden
The issue of charges is particularly important in Sweden because the contribution rate
to pension funds — 2½ per cent of earnings — is lower than in any other country with
mandatory funded pensions.23 The Swedish government therefore took a number of steps to
avoid charges eating up all the contributions.
Rather than establishing separate pension funds, the new regime builds on the existing
infrastructure of collective investment institutions. All mutual funds can participate, subject to
levying fees set by the public pension agency. There is a complicated formula to determine
charges, which depends on the price charged for voluntary savings in the mutual fund, the
22 See Australian Prudential Regulatory Authority (1998c). 23 The guaranteed minimum contribution (the mandatory minimum) in the United Kingdom is less than 2½ per cent for workers under 30. But it currently averages around 4½ per cent across all ages: workers now in their 20s will make a higher mandatory minimum as they get older. See Whitehouse (1998) for an explanation.

34
value of mandatory contributions attracted and the total value of mandatory pension assets
managed. The marginal fee as a proportion of assets, for example, is given by
)( sss v αβα −+ (11)
where α and β are parameters set by the agency that depend on the size class of the fund (s)
and v is the charge levied in the voluntary sector. Table 5 shows the schedule.
Table 5. Regulated marginal charges as a percentage of assets for mandatory funded pensions by fund size class in Sweden
Value of assets (US$ million) α β Full formula for charge (per cent of assets) 0-10 0.40 0.75 0.4+0.75(v-0.4) 10-40 0.35 0.35 0.35+0.35(v-0.35) 40-60 0.30 0.15 0.3+0.15(v-0.3) 60-350 0.25 0.05 0.25+0.05(v-0.25) 250-850 0.15 0.05 0.15+0.05(v-0.15) 850- 0.12 0.04 0.12+0.04(v-0.12)
Source: Swedish public pension agency. See also James, Smalhout and Vittas (1999) Note: translations to US$ from SKr rounded for clarity. Limits of the bands (in millions) are SKr70, 300, 500, 3000 and 7000 respectively
The implication of this schedule for the ceiling on fees is shown in Figure 10. With a
one-per-cent charge on assets in the voluntary sector, the funds in the smallest class of assets
of mandatory members can charge 0.85 per cent at the margin, while the largest funds can
charge just 0.15 per cent.
The Figure covers the range of charges in the voluntary sector: Dahlquist, Engström
and Söderlind (1999) find fees vary between 0.4 and 2 per cent of assets, with an average of 1.5
per cent. The net result is that the most popular funds will be able to charge less than 0.2 per
cent at the margin and 0.2-0.3 per cent on average, somewhat less than the lowest fees in the
voluntary sector. On top, 0.2 per cent of assets or so can be levied to cover trading
commissions etc. The public pension agency will also charge for contribution collection and
record keeping. The agency will spread the fixed costs of establishing the new system over s
15-year period. The charge for these services will be around 0.3 per cent of assets. So the total
fee for investment in a large fund will be about 0.75 per cent, about half the average in the
mutual-fund market.

35
Figure 10. Regulated marginal charges by size class of fund and by voluntary sector charge in Sweden
0
0.2
0.4
0.6
0.8
1
1.2
1.4
1.6
0-10 10-40 40-60 60-350 350-850 850-fund size class (US$ million)
regu
late
d ch
arge
, per
cen
t of a
sset
s
voluntary sector fee, per cent of assets
2%
1.5%
1%
0.5%
Source: calculated from data in Table 5
The reasoning behind this complexity is as follows. First, the ceiling should be low
enough to discourage excessive marketing. Secondly, the ceiling should allow firms to recover
their marginal costs, but provide at maximum a small subsidy to their fixed costs. Thirdly, the
regime should not rule out particular portfolios. Emerging markets, smaller companies funds
etc. imply higher costs. By relating the ceiling to the fund’s charge in the voluntary sector, the
government does not rule out these more expensive investments. But they are subject to some
price limitation that, at the same time, does not allow leeway for cheaper funds (e.g., those
investing domestically in large-capitalization equities) to charge excessive prices. Finally, the
variation with fund size is designed to ensure that any benefits from economies of scale accrue
to members rather than providers. Funds that do not attract much of the flow of mandatory
contributions will be cushioned. This reduces the risk for funds deciding whether to enter the
new market or not.
The low level of these mandatory fees will leave little if any room for marketing
expenditures. The public pension agency will collect contributions and keep records of them.
Indeed, the agency will aggregate individuals’ contributions and make a single transfer to each
fund. The funds will not keep records of individual contributions and will not even know who
their contributors are. This is designed to reduce marketing opportunities still further.

36
Sweden also has a system of occupational pension schemes.24 The four main programs
together cover 90 per cent of employees. Recent reforms have shifted the benefits in the
scheme for blue-collar workers in the private sector from a defined benefit formula to a
defined contribution scheme. Employers contribute 2 per cent of employees’ salaries up to a
ceiling to the new SAF-LO scheme, which accounts for 35 per cent of total occupational
pension coverage. The smaller ITP scheme for white-collar workers is more complex. Since
1999, it has been a combination of defined benefit and defined contribution elements. This
division of mandatory pension contributions into three different programs — the public, pay-
as-you-go pension scheme, individual accounts and occupational plans — is unlikely to result
in efficient administration.
3.2.3 United Kingdom
The United Kingdom has a variety of pension options. Employees can comply with
the mandate for a second pension beyond the flat-rate basic state pension in many different
ways. These include a personal pension (provided on an individual or a group basis), a
defined-benefit occupational scheme, a defined-contribution occupational plan or the state
earnings-related pension scheme, known by its acronym, Serps. Reforms to the system,
announced at the end of 1998 (Department of Social Security, 1998), will introduce another
option, called a ‘stakeholder’ pension. This new plan is described in more detail below.
Analysis of personal-pension charges is complicated by the bewildering array of
different types of levy.25
• Policy, plan or administration fees are a regular flat-rate charge, usually payable monthly
or annually. A typical levy is £30 a year, usually uprated in line with average economy-wide
earnings or prices
• Bid-offer spreads act as an entry and/or exit charge from the fund. Units in the pension
fund are sold at a higher price than the fund will pay to buy them back. This usually adds
up to a charge of 5 per cent or so, and acts as a levy on contributions
24 See Whitehouse (2000d). 25 These data are from Walford (1998).

37
• Unit allocations work in a similar way. The provider credits the personal pension
account with only a proportion of the units bought. Unallocated units are usually up to 10
per cent, and often depend on the number of years spent in the scheme. Again, this
operates as a levy on contributions. Often the allocation rate depends on a range of
variables, such as the size and frequency of contributions (with discounts for larger and
less frequent payments) and the term to retirement (higher charges for shorter terms)
• Fund-management charges, as a percentage of assets, are the most familiar kind of levy.
The range of typical charges is 0.5-1.0 per cent
• Initial charges and capital levies are one-off, up-front charges payable in the first one or
two years. They tend either to be a fixed fee (£60, for example) or a percentage of
contributions (5 per cent)
The middle column of Table 6 shows the ‘average’ charging structure used by the
Government Actuary to advise on the adjustment to the social security contribution rebate to
compensate for average fees paid. These levies translates into a charge ratio (reduction in
premium) of around 25 per cent and an equivalent charge as a proportion of assets of 1.3 per
cent (the reduction in yield).26
Table 6. Personal pension charges in the United Kingdom Levy Government Actuary Money Management Flat-rate £30 a year £12 a year On contributions 8% 6% On assets 0.9% 0.9%
Charge ratio 25 23 Reduction in yield 1.3 1.2
Source: Government Actuary (1999), Walford (1998)
Analysis of detailed charging data — the final column of Table 6 — reveals lower
charges than the Government Actuary’s figures.27 The charge ratio, for example, is 2
26 Murthi, Orszag and Orszag (1999) also report a charge ratio of 25 per cent. 27 Data from Walford (1998). This ignores some complications. A small proportion of firms (15 per cent) levy one-off, up-front fees, but averaging across all plans (including the zeros) gives just £8. Three-quarters of firms also offer ‘loyalty’ bonuses. These can be a proportion of the fund at retirement, a reduction in the charge or an increase in unit allocations once a minimum number of years’ contributions have been made. These

38
percentage points lower, equivalent to a reduction in yield of 1.2 per cent. Furthermore, nine
companies offer ‘level-commission’ plans, with a charge ratio 1.4 percentage points lower on
average than full commission schemes. Commission-free plans, available from seven firms,
have a charge ratio over 8 percentage points lower on average. The overall (unweighted) mean
charge ratio including all these plan types is 22 per cent, which is three percentage points lower
than the results of Murthi, Orszag and Orszag (1999) and the Government Actuary’s
assumptions.
This average charge disguises a very broad distribution. Table 7 summarizes the
charges levied at three different points of the pension contract. More than two out of five
funds levy no fixed fee while more than one in ten levies in excess of £30 a year. The most
common levy on contributions is 5 per cent, but a few funds make no charge while some
extract more than 10 per cent. Charges on assets are typically either 0.75 or 1 per cent a year,
but the range is 0.36 to 1.5 per cent.
Table 7. Frequency distribution of personal pension charges in the United Kingdom
Fixed annual fee Charges on contributions Charge on assets charge, £ per cent
of funds charge,
per cent per cent of funds
charge, per cent
per cent of funds
zero 42 0 4 <0.5 2 1-5 4 1 0 0.5 7 6-10 9 2 2 0.51-0.74 4 11-15 20 3 2 0.75 27 16-20 4 4 2 0.76-0.99 5 21-25 5 5 51 1.0 32 26-30 5 6 9 1.01-1.25 9 31-35 4 7 5 1.26-1.5 12 >35 7 8 9 9 7 10 9 11 0 12 2 Source: author’s calculations based on Walford (1998)
The distributions in Table 7 translate into a very broad range of charge ratios, as
illustrated in Figure 11, because there is no clear trade-off between the level of charges at
bonuses could reduce the overall charge ratio by about 10 percentage points, but the information on eligibility
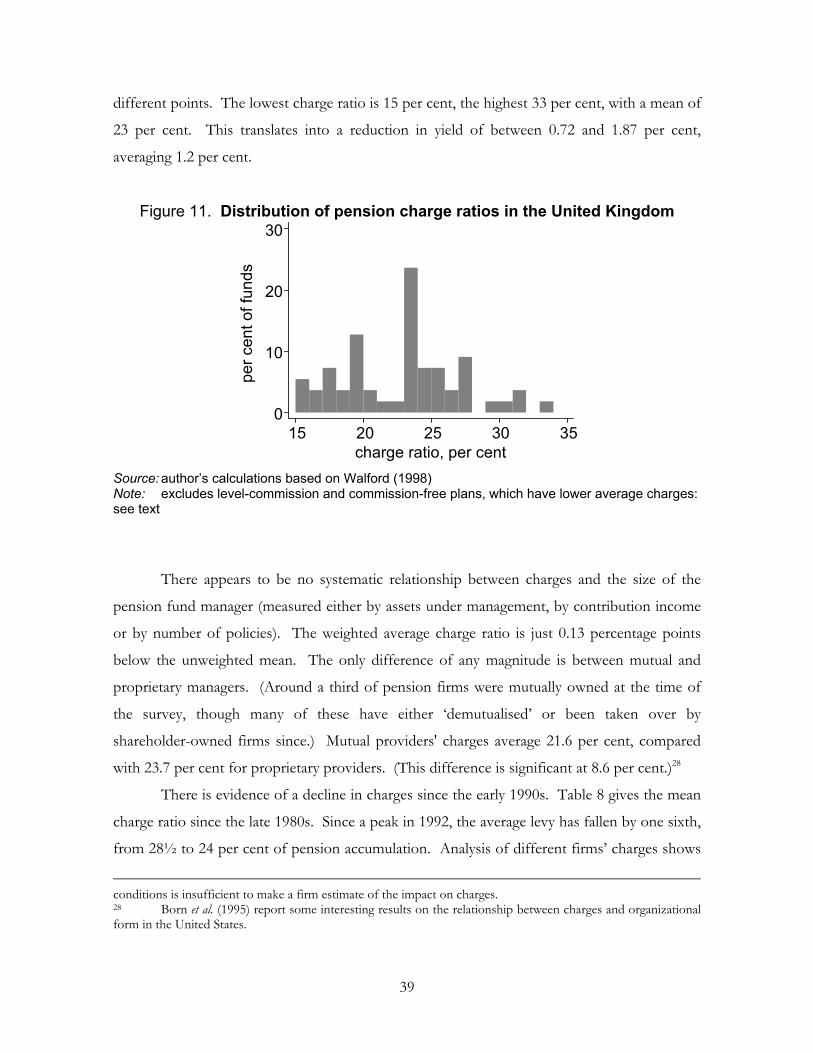
39
different points. The lowest charge ratio is 15 per cent, the highest 33 per cent, with a mean of
23 per cent. This translates into a reduction in yield of between 0.72 and 1.87 per cent,
averaging 1.2 per cent.
Figure 11. Distribution of pension charge ratios in the United Kingdom
per c
ent o
f fun
ds
charge ratio, per cent15 20 25 30 35
0
10
20
30
Source: author’s calculations based on Walford (1998) Note: excludes level-commission and commission-free plans, which have lower average charges: see text
There appears to be no systematic relationship between charges and the size of the
pension fund manager (measured either by assets under management, by contribution income
or by number of policies). The weighted average charge ratio is just 0.13 percentage points
below the unweighted mean. The only difference of any magnitude is between mutual and
proprietary managers. (Around a third of pension firms were mutually owned at the time of
the survey, though many of these have either ‘demutualised’ or been taken over by
shareholder-owned firms since.) Mutual providers' charges average 21.6 per cent, compared
with 23.7 per cent for proprietary providers. (This difference is significant at 8.6 per cent.)28
There is evidence of a decline in charges since the early 1990s. Table 8 gives the mean
charge ratio since the late 1980s. Since a peak in 1992, the average levy has fallen by one sixth,
from 28½ to 24 per cent of pension accumulation. Analysis of different firms’ charges shows
conditions is insufficient to make a firm estimate of the impact on charges. 28 Born et al. (1995) report some interesting results on the relationship between charges and organizational form in the United States.

40
that this is mainly due to cuts in some of the very highest charges. The charge ratio of the
lowest quartile of funds has fallen by only one percentage point, while the upper quartile has
declined by more than five points.
Table 8. Average pension charge ratio in the United Kingdom, 1989-98 per cent of accumulated fund
1989 1990 1991 1992 1993 1994 1995 1996 1997 1998 27.6 27.9 28.0 28.5 27.5 27.3 25.9 24.8 24.3 23.7
Source: author’s calculations based on Money Management magazine’s surveys
People can and frequently do shift between the different types of second pensions in
the United Kingdom. For example, occupational pensions are required by law to accept
transfers into the scheme and to provide transfers out. It is also possible to change between
different personal plans or different occupational schemes. This complicates the measurement
of personal-pension charges.29 Moreover, transfers of funds within the personal pensions
sector are more complex than in Latin American countries, for example. In the latter, any
transfer involves both accumulated funds with the original provider and any new
contributions. But in the United Kingdom, people are able to leave their accumulated fund
with the original provider and pay only new contributions to the new provider.
The Personal Investment Authority (1999) collects data on the length of time people
continue contributing to a personal pension after taking out the contract. The PIA data show
that two out of five personal pension policies bought directly from a pension provider lapse
within four years of the contract. However, persistency rates are 12 percentage points higher
for pensions bought through an independent financial advisor and 17 points higher for
FSAVC or transfer contracts. For single-premium pensions, usually bought with the transfer
value from another kind of pension, the lapse rate over four years is close to zero.
Unfortunately, these data are inappropriate for analyzing pension transfers and their
effect on the burden of charges.30 First, the data only include personal pensions that receive
29 A more detailed analysis of the impact of pension transfers on the burden of charges can be found in Whitehouse (2000e). 30 The data were collected for a different purpose: low short-term persistency rates are an indicator of poor selling practices that is easy for regulators to collect. Note that the PIA has now been subsumed into the Financial Services Authority, the new unified regulator.

41
contributions in addition to the mandatory minimum, that is only 45 per cent of the 5½
million personal pensions used to contract out of Serps.31 Secondly, voluntary personal
pensions — mainly taken out by the self-employed or to top-up occupational pension benefits
— account for around half of the 10½ million personal pensions. So the types of personal
pension relevant to this paper account for only a third of the data. Thirdly, the data only cover
the first four years of a pension contract. Finally, the data treat a policy as lapsed even for
people who stop contributing temporarily and subsequently re-start.
Murthi, Orszag and Orszag (1999) extrapolate from the four years of PIA data (for
regular-premium policies bought from a pensioner provider) to a full-career 40 years. The
result of the extrapolation is that people would typically join five or six different personal
pensions in a career. The precise effect on the burden of charges depends on whether people
leave existing contributions in the old personal pension or transfer them to a new scheme.
Murthi, Orszag and Orszag estimate that charges are between 17 and 32 per cent higher for
someone transferring a personal pension than for someone who remained with a single
scheme for a full career. However, this substantially overstates the average charge burden
resulting from transfers.
First, a complementary data source on pension scheme tenures — the British
Household Panel Survey, BHPS — shows a very different pattern. Unlike the PIA analysis,
these data are not truncated at four years, they include rebate-only personal pensions and they
can be used to identify transfers from gaps in contributions. The four-year persistency rate in
the BHPS is 88 per cent, compared with less than 60 per cent in the PIA data. The 25-year
persistency rate is 29 per cent, compared with 7 per cent in the extrapolation of the PIA data.
Secondly, the BHPS indicates that switching between different personal pensions is
very rare. There are only 60 or so instances in the dataset, accounting for just 2 per cent of
personal pensions taken out. Furthermore, the majority of these switches are from plans taken
out before 1988. Many are likely to be people exchanging an old pension policy for a new-
style personal pension that they could use to contract out of Serps. This is therefore a one-off
effect reflecting the institutional change. Only 25 people switched a post-1988 personal
pension for another policy. Indeed, this is confirmed by the PIA’s result that just one per cent
of single-premium lapse within four years.
31 Inland Revenue (1999).

42
The new stakeholder pension schemes, announced in 1998, aim to fix many of the
problems of personal pensions. In particular, there are four main strategies to control the level
of costs and charges.
First, all employers who do not offer an occupational pension plan or a group personal
pension will have to ‘identify a stakeholder pension scheme and facilitate access to it’.32 Since
there are fewer employers than employees, this should reduce marketing expenses. Also,
employers should have greater bargaining power than individual employees, allowing them to
secure a better deal. (Assuming, of course, that they have their employees’ interests at heart.)
Collective provision might also reduce the cost of supplying information and advice. The
government has said: ‘We see scope for schemes to make arrangements to offer general advice
to members and potential members…by having advisors visit the workplace’ (Department of
Social Security, 1998).
The comparison between master trusts and industry schemes within Australia’s
superannuation-guarantee system shows how collective schemes can have lower costs than
individual-based plans. The reductions that 28 personal-pension providers offer for group
schemes in the United Kingdom are a second illustration. The most common concessions are
lower charges (18 firms), reduced minimum premia (seven) and free life insurance (five).33
Stakeholder schemes are designed to reap the same cost advantages as group personal
pensions.
Secondly, some aspects of the regulatory regime will be simplified. The most
important change is the streamlining of the taxation rules, which should reduce compliance
costs substantially.34
Thirdly, stakeholder pension providers will be restricted to just one type of charge — a
percentage of fund assets — rather than the multiplicity used now. This will facilitate
comparison of charges between different providers. It will also eliminate costs, such as fixed
management charges, that bear particularly heavy on low contributions.
A related government initiative is the consumer-education remit enshrined in the
legislation establishing the new unified regulator, the Financial Services Authority (FSA). This,
32 Department of Social Security (1999b). See Axia Economics (1999b) for detailed comments. Note, however, that employees need not necessarily join the plan offered by their employer. 33 Data from Walford (1998). 34 Department of Social Security (1999c).

43
along with league tables of providers’ costs etc., should increase the transparency of charges and
empower consumers to shop around for lower-cost providers.35
However, the government does not appear to believe that transparency of charges
(compared with the Byzantine schedules of personal pensions) will alone be enough to
facilitate competitive pressure to reduce administrative costs. It has also proposed final a
ceiling on charges of one per cent of fund assets.36 This is equivalent to a charge ratio of 19.7
per cent. It compares with an average of 1.2 per cent of assets and a charge ratio of 23 per
cent for someone who remains in a personal pension throughout their career. Of course, the
main benefit from stakeholder schemes will accrue to people who stop and start contributing
at different points in their career. The reduction in charges will be larger than the saving for a
full-career pension contributor.
The charge limit could also feed through to lower costs. The government argues: ‘The
reassurance provided by minimum standards will reduce the need for detailed financial advice
when people join schemes’. Since the one-per-cent ceiling is rather lower than the median
personal-pension charge, it will also tend to reduce the very high variance in charges observed
now. Ernst & Young, the accountants, agree with the government — ‘In theory, this could
make tied salesmen and independent financial advisors redundant and strip out most up-front,
advice-related costs’ — as does the Institute for Fiscal Studies.37
It is also worth mentioning briefly the rather different approach to administrative costs
embodied in the previous, Conservative government’s proposals for pension reform. Under
basic pension plus, as the plan was called, the government would continue to collect social-
security contributions under the same schedule.38 At the end of each year, the government
would transfer £470 plus five per cent of earnings between the contribution floor and ceiling
into individuals’ pension accounts. This payment would be made even if it exceeded the
social-security-contribution liability, so the transfer would be greater than employee
contributions for people earning less than £11,400.
35 Consumers are least confident when buying pensions out of any of eight different financial products according to the National Consumer Council (1994). See also Whitehouse (2000a), section 4.11. 36 Department of Social Security (1999a). See Whitehouse (2000a) and Axia Economics (1999a) for an assessment. 37 Financial Times (1999a) and Disney, Emmerson and Tanner (1999). 38 See Whitehouse and Wolf (1997), Department of Social Security (1997) and Whitehouse (1998), section VI for a detailed discussion of the basic-pension-plus proposal.
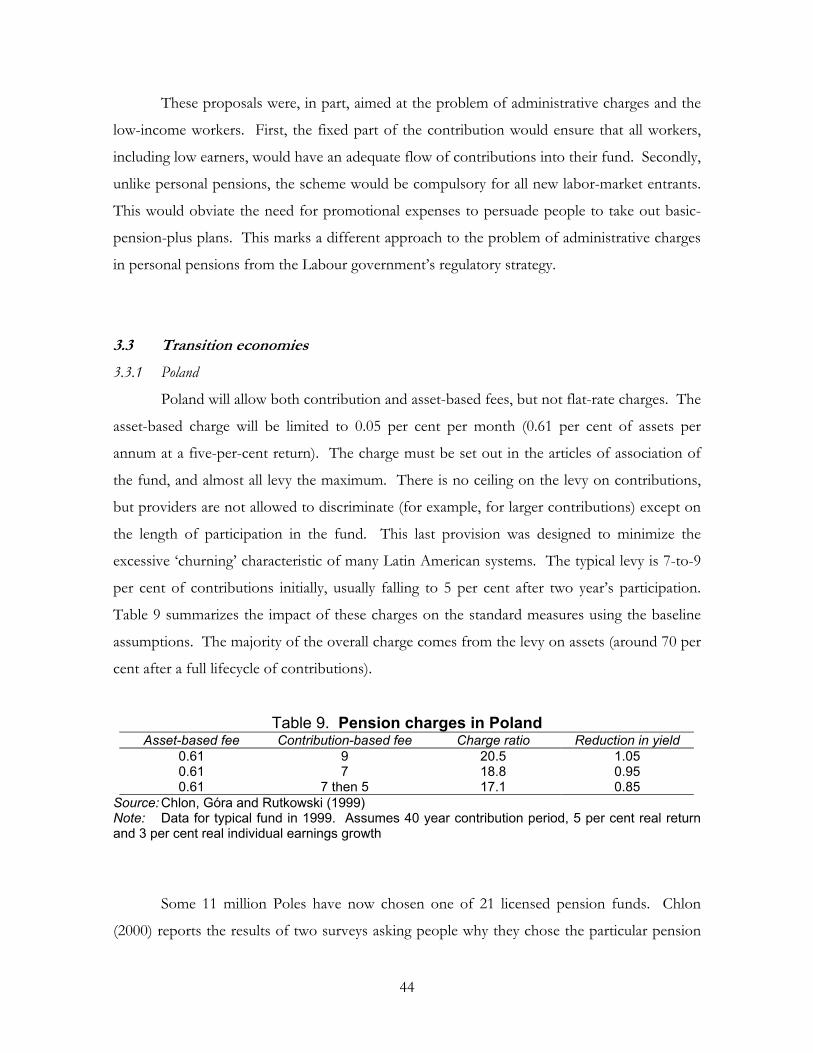
44
These proposals were, in part, aimed at the problem of administrative charges and the
low-income workers. First, the fixed part of the contribution would ensure that all workers,
including low earners, would have an adequate flow of contributions into their fund. Secondly,
unlike personal pensions, the scheme would be compulsory for all new labor-market entrants.
This would obviate the need for promotional expenses to persuade people to take out basic-
pension-plus plans. This marks a different approach to the problem of administrative charges
in personal pensions from the Labour government’s regulatory strategy.
3.3 Transition economies
3.3.1 Poland
Poland will allow both contribution and asset-based fees, but not flat-rate charges. The
asset-based charge will be limited to 0.05 per cent per month (0.61 per cent of assets per
annum at a five-per-cent return). The charge must be set out in the articles of association of
the fund, and almost all levy the maximum. There is no ceiling on the levy on contributions,
but providers are not allowed to discriminate (for example, for larger contributions) except on
the length of participation in the fund. This last provision was designed to minimize the
excessive ‘churning’ characteristic of many Latin American systems. The typical levy is 7-to-9
per cent of contributions initially, usually falling to 5 per cent after two year’s participation.
Table 9 summarizes the impact of these charges on the standard measures using the baseline
assumptions. The majority of the overall charge comes from the levy on assets (around 70 per
cent after a full lifecycle of contributions).
Table 9. Pension charges in Poland Asset-based fee Contribution-based fee Charge ratio Reduction in yield
0.61 9 20.5 1.05 0.61 7 18.8 0.95 0.61 7 then 5 17.1 0.85
Source: Chlon, Góra and Rutkowski (1999) Note: Data for typical fund in 1999. Assumes 40 year contribution period, 5 per cent real return and 3 per cent real individual earnings growth
Some 11 million Poles have now chosen one of 21 licensed pension funds. Chlon
(2000) reports the results of two surveys asking people why they chose the particular pension

45
fund they did. In the first study, charges were cited as the ninth most important issue out of a
total of 14, behind the size of the pension fund, the experience of its shareholders, information
provision and service. Just 4 per cent mentioned fees to the second survey, behind 11 other
factors. Consumers rarely choose between competing pension funds on price.
3.3.2 Kazakhstan
Kazakhstan took the most ambitious approach to pension reform of the countries
assessed here. All new retirement income rights for all workers will accrue in individual
pension accounts. The contribution rate to the new system is 10 per cent, with a 15 per cent
payroll tax used to finance existing pay-as-you-go pension liabilities. This tax will be phased
out as pay-as-you-go liabilities decline.39
People can choose from one of eleven private pension companies and a state pension
manager, which also operates as the default for workers who make no nomination. These
companies contract out investment to an asset management company, of which there are just
three: ABN-Amro, the Dutch investment bank, Zhetisu and Narodny Bank, the largest
Kazakh bank.40
Regulations require that fees cannot exceed 1 per cent of contributions plus 10 per
cent of the investment returns of the fund. The latter levy, for a given rate of return, works
like a charge on assets (the charge is 0.5 per cent of assets with a five-per-cent real return).
Of the total charge, the asset-management company receives 0.15 per cent of
contributions and 5 per cent of investment income. The rest goes to the pension manager,
who is responsible for collecting contributions, record keeping and marketing the fund to
potential members.
These charges are low compared with most other countries: a charge ratio of 11.45 and
a reduction in yield of 0.55 per cent at the baseline assumptions. There has been an intense
debate between the government, pension funds and others about the level of the limits on
fees. The funds indicate that they need 100,000-150,000 members to break even, and only one
(Narodny Bank) has so far reached that level.
39 Data are from Andrews (2000). See also World Bank (1998) and Anderson et al. (1997). 40 Another fund had its license suspended following an inspection by the supervisory authority.

46
3.4 Summary
Figure 12 summarizes the analyses of this chapter, comparing the charges in different
countries. In most cases, the gray bars show the mean charge while the black dots show the
range of charges. Sweden is one exception. The gray bar shows the minimum of the range of
permitted charges, which depends inter alia on the size of the fund. As noted above, most
people are expected to pay charges close to this minimum level. The gray diamond shows the
theoretical maximum charge. The gray bar for Australia shows the charge in an industry fund,
the gray diamond, in a master trust. Finally, note that the data for stakeholder pensions in the
United Kingdom are the maximum: some providers have already announced lower charges
than this level. Also, the main beneficial effect of stakeholder schemes on the burden of
charges relative to personal pensions — flexibility in stopping, starting and varying
contributions — is not captured in this picture.
Figure 12. Charge ratio in funded pension schemes in thirteen countries
0 5 10 15 20 25 30 35Bolivia
AustraliaKazakhstan
ColombiaSwedenUruguay
El Salvador
PolandChile
PeruUK: stakeholder
UK: personalArgentina
Mexico
charge, per cent of contributions/accumulation
minimummaximum
master trust
maximum permitted
Source: see discussion in previous sections
The mean burden of charges in different countries varies over a substantial range. It is
also interesting to note that the countries with the highest average level of charges — Mexico,
Argentina and the United Kingdom — also exhibit the greatest variability.

47
The results in the chart are somewhat sensitive to changes in assumptions. The charge
ratio measure does not vary with the rate of return if fees are levied on contributions. But
pension managers in all the countries outside Latin America — Australia, Kazakhstan, Poland,
Sweden, and the United Kingdom — and in some in Latin America levy some or all of their
charges on assets. The charge ratio measure in these cases is higher with a higher rate of
return. However, the distribution of charging levels in Figure 12 is broad enough to ensure
that re-rankings with varying assumed returns are limited to two places.
4. Strategies to control charges in funded pension systems
Measuring the impact of administrative charges for pension funds is very complex. So
it is essential, at the minimum, that governments set out a standard presentation of charges to
ensure that consumers can make reasonably accurate comparisons between different providers.
Unfortunately, transparency alone may not be enough to ensure healthy competitive pressures
to keep charges low, as illustrated by the example of the United Kingdom.
Supervisory agencies tightened the so-called ‘disclosure’ requirements in the mid-1990s,
so that charges have to be presented in a standardized way, illustrating, for example, the cost of
stopping contributions prematurely.41 There is a standard assumption of investment returns,
but the impact of charges has to be shown for the individual customer’s characteristics, such as
age and expected retirement age. However, these data are a part of the final quotation, so
obtaining comparable information from a number of providers could be time consuming.
League tables of charges published in the media tend only to cover one or two example
individual. Given the huge variety of charging structures in the United Kingdom, fees depend
critically on individual characteristics and so the examples may not be relevant.
Many consumers turn to an independent financial advisor to make comparisons for
them. This saves time but can be costly. Moreover, the independence of ‘independent’
financial advisors is moot: in the terminology of economics, there is an agency problem. The
majority of advisors’ income comes from commission on selling financial products. It is
reasonable to conjecture that pension providers levy higher charges to cover at least some of a
higher commission paid to the recommending advisor. Advisors’ and consumers’ incentives

48
do not coincide and the government has admitted that advice given at the moment ‘is of
variable quality’.42
The IFA Association, the collective voice of independent financial advisors naturally
disputes this analysis. The association argues: ‘The commission paid by providers to this
sector [tied agents] is generally at a higher level than would be paid on the same business if
introduced by an IFA. This increase can be as high as 25 per cent.’43 Despite this defense of
commissions, the IFA Association has proposed a move to fee-based charging to underline
their independence.44 Currently, only one third of the sector will do any business on a fee
basis, and the share of advice given in this way is much smaller.
4.1 Improving transparency
One way of ensuring the transparency of charges, in addition to their structure, is to
levy charges on top of rather than out of mandatory contributions. This brings charges very
clearly to consumers’ attention because they reduce current net income rather than future
pension income. Chile, Colombia, El Salvador and Peru all levy charges on top of the
mandatory contribution, while in Argentina charges are deducted from the 10-per-cent
contribution. The latter is also the practice in countries with mandatory funded pensions in
other regions, including Australia, Hungary, Poland Sweden, the United Kingdom.
4.2 Restricting charge structures
A common solution to the lack of transparency of charges in complex fee structures is
to limit the types of charges that can be levied.45 If only one type of fee is allowed, then there
is a single ‘price’ for taking out a pension that consumers can easily compare. It also removes
many of the complexities of the variability of charges with different consumer characteristics.
41 See, for example, Personal Investment Authority (1995) and Office of Fair Trading (1992). 42 Department of Social Security (1998). See also Whitehouse (2000a), section 4.4, National Consumer Council (1994) and Office of Fair Trading (1999). 43 Original emphasis. IFA Association (1998). The Personal Investment Authority (1995) found an average differential in commissions between IFAs and tied agents of 23 per cent. 44 Financial Times (1999b).
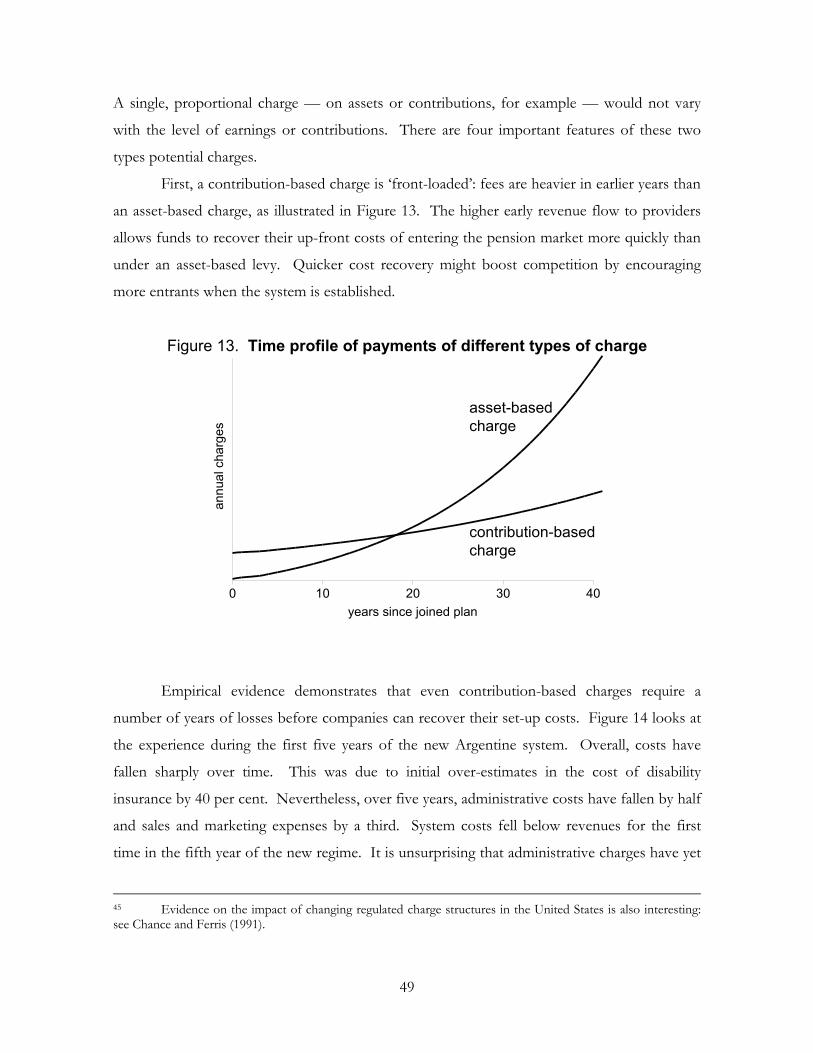
49
A single, proportional charge — on assets or contributions, for example — would not vary
with the level of earnings or contributions. There are four important features of these two
types potential charges.
First, a contribution-based charge is ‘front-loaded’: fees are heavier in earlier years than
an asset-based charge, as illustrated in Figure 13. The higher early revenue flow to providers
allows funds to recover their up-front costs of entering the pension market more quickly than
under an asset-based levy. Quicker cost recovery might boost competition by encouraging
more entrants when the system is established.
Figure 13. Time profile of payments of different types of charge
0 10 20 30 40years since joined plan
annu
al c
harg
es
asset-basedcharge
contribution-basedcharge
Empirical evidence demonstrates that even contribution-based charges require a
number of years of losses before companies can recover their set-up costs. Figure 14 looks at
the experience during the first five years of the new Argentine system. Overall, costs have
fallen sharply over time. This was due to initial over-estimates in the cost of disability
insurance by 40 per cent. Nevertheless, over five years, administrative costs have fallen by half
and sales and marketing expenses by a third. System costs fell below revenues for the first
time in the fifth year of the new regime. It is unsurprising that administrative charges have yet
45 Evidence on the impact of changing regulated charge structures in the United States is also interesting: see Chance and Ferris (1991).

50
to decline. Now that the funds are profitable at the operating level, we might expect price
competition to emerge in the next few years as the fund managers recover the cost of their
initial capital. The pattern in Hungary has been more marked than Argentina. Fund charges
have averaged about 8 per cent of contributions in the first year of the new system, while costs
have averaged 24 per cent.
Figure 14. Costs and revenues in the Argentine funded pension system, 1994-99
0
5
10
15
20
25
30
35
40
45
1 2 3 4 5 averageyears since reform
per c
ent o
f con
tribu
tions
marketing/sales
disability
administration
revenues
Source: SAFJP
Returning to the comparison of contribution- and asset-based charges, a second issue
is the different incidence of levies. In the presence of fixed costs per member, an asset-based
charge redistributes from people with large funds to people with small funds. So older
workers, who will tend to have larger funds, will cross-subsidize younger, for example.
Contribution-based levies redistribute from people with large contributions to people with
small contributions.
Indeed, revenues would be zero for people who suspended contributions. People
might lose their job, withdraw from the labor market because of caring responsibilities or work
in the informal sector of the economy. Providers would receive no revenues from these
people, but would still bear the cost of administering their fund. Asset-based fees ensure a
revenue flow even from inactive accounts, but, of course, it means that these fees bear more
heavily on people who withdraw from work early.

51
Finally, there is the issue of fund managers’ incentives. A charge on fund value
encourages managers to maximize assets, both by attracting funds from other providers and,
more importantly, by maximizing investment returns. Contribution-based levies, in contrast,
have no direct link between revenues and investment returns. Fund managers’ basic
maximand is obviously the value of contributions.
The choice between the two is finely balanced, and countries have taken different
routes. Many governments in Latin America have opted primarily for contribution-based
levies. The United Kingdom chose asset-based fees for the new stakeholder pensions, which
the great majority of responses to its consultation supported.46 The government’s main
arguments were funds’ incentive to maximize investment returns and the fact that people who
suspend contributions do not impose an excessive burden on other scheme members. This
last argument is more significant in the United Kingdom than elsewhere: multiple choices of
mandatory pension options mean that many people switch between funds, leaving inactive
accounts.
4.3 Restricting charge levels
Restricting charge levels is a surprisingly rare approach. Table 1 showed that only
Kazakhstan, Poland, Sweden and the United Kingdom (with its new stakeholder schemes)
have restricted the level of fees. The obvious risk with this approach is that the government
sets the ‘wrong’ ceiling on charges. This may not be too much of a problem in well-developed
capital markets, because the government can observe the costs and charges of providers of
very similar financial products. Governments of emerging economies, however, often have
little to go on domestically. Even in this case, however, international evidence, of the sort
presented in this paper, can be useful information.
Still, charges might be set at a ‘wrong’ level, either too high or too low. Too low and
providers might be unable to cover their costs. This will substantially reduce the number of
entrants to the pension market, restricting individual choice of provider and competition
between different providers. It may even be low enough to result in failure of a pension fund
manager, which will undermine public confidence in the pension system. There is also

52
evidence that charge ceilings can become de facto charge minima as well. In Poland, for
example, virtually all funds will charge the 0.61-per-cent-per-annum maximum on assets. This
implies that price competition, beyond reaching the regulatory standard, might be limited, at
least in the short term. In the longer-term, price competition might become more intense, as
firms compete to attract relatively large amounts of assets that have built up in people’s funds.
A low charge ceiling might restrict consumer choice in a number of ways. There may
be fewer providers. Analysts expect stakeholder pensions to lead to a radical restructuring of
the pensions industry in the United Kingdom. Ernst & Young, the accountants, have said:
‘Most UK life assurance companies will be unable to make money from stakeholder pensions
without radically changing their current business model. Their expense base is too high to
support the proposed charges.’ Only around a fifth of providers are below the proposed
charge ceiling. OSI, a management consultancy, expects ‘a tidal wave of mergers’ in the
industry. The firm estimates a minimum of 500,000 contributors is necessary to reach the cost
target.47 This would imply just five-to-ten providers in the medium-term, compared with
roughly 90 currently offering personal pensions. The effect, then, will be to limit choice of
pension provider substantially.
Providers might also be forced to offer a very limited choice of investments to keep
costs low, further reducing individual choice of portfolio (see below). Nevertheless,
consumers might be willing to pay more, for example, for better information or service. But
the ceiling prevents firms from offering these broader choices. There is also some evidence of
a relationship between personal-pension charges and investment performance in the United
Kingdom. For a sample of companies, Figure 15 plots the charge-ratio measure against the
gross accumulated value of a standard pension product. If there were no relationship, the
fitted curve would be flat. In fact, the fitted curve shows a positive relationship between
charges and performance, although the extra return from a higher-charging fund is not
sufficient to offset the effect of the charge on net returns. The other curve on the Figure
shows the break-even relationship. However, the coefficient on the charge in the performance
equation is not significantly different from zero.
46 Department of Social Security (1999a), paragraph 23. 47 Timmins (1999) and Brown-Humes (1999).
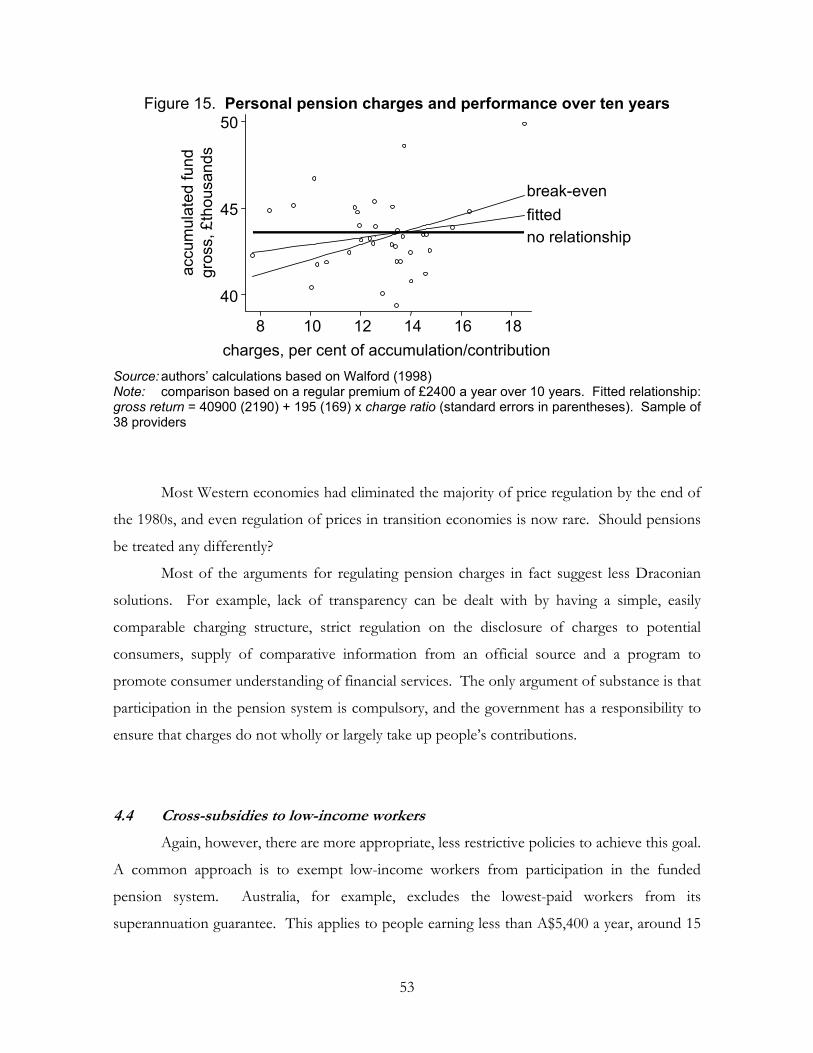
53
Figure 15. Personal pension charges and performance over ten years
accu
mul
ated
fund
gros
s, £
thou
sand
s
charges, per cent of accumulation/contribution8 10 12 14 16 18
40
45
50
no relationship
break-evenfitted
Source: authors’ calculations based on Walford (1998) Note: comparison based on a regular premium of £2400 a year over 10 years. Fitted relationship: gross return = 40900 (2190) + 195 (169) x charge ratio (standard errors in parentheses). Sample of 38 providers
Most Western economies had eliminated the majority of price regulation by the end of
the 1980s, and even regulation of prices in transition economies is now rare. Should pensions
be treated any differently?
Most of the arguments for regulating pension charges in fact suggest less Draconian
solutions. For example, lack of transparency can be dealt with by having a simple, easily
comparable charging structure, strict regulation on the disclosure of charges to potential
consumers, supply of comparative information from an official source and a program to
promote consumer understanding of financial services. The only argument of substance is that
participation in the pension system is compulsory, and the government has a responsibility to
ensure that charges do not wholly or largely take up people’s contributions.
4.4 Cross-subsidies to low-income workers
Again, however, there are more appropriate, less restrictive policies to achieve this goal.
A common approach is to exempt low-income workers from participation in the funded
pension system. Australia, for example, excludes the lowest-paid workers from its
superannuation guarantee. This applies to people earning less than A$5,400 a year, around 15

54
per cent of the average. (This is the same level as the starting point for paying income tax.) In
addition, there are plans to make participation voluntary for people earning between 15 and 30
per cent of average pay.
All countries provide either a social-assistance income in retirement, a minimum
pension guarantee or a universal flat-rate pension. People with persistently low earnings are
unlikely to generate a pension above the de facto minimum inherent in any of these three
programs. This is equally true of most public defined-benefit pension systems as it is of
defined-contribution plans.48 It is better that safety-net programs provide pensioners for
persistent low earners than any defined-contribution or earnings-related defined-benefit
scheme.
A second method is to cross-subsidize lower-income workers through the charging
structure. Many of the costs of operating pension accounts are fixed. Collecting contributions
and transferring them to accounts, for example, has the same cost regardless of the size of the
contribution. Other activities, such as providing statements to members, also have fixed costs.
So any regulations that prohibit fixed charges or allow only variable charges (on assets or
contributions) imply a cross-subsidy from higher-income to lower-income members.
A third approach is to cross-subsidize low-income workers’ pensions directly. The
Mexican government, for example, ensures a minimum contribution of 5½ per cent of the
minimum wage to pension accounts, coincidentally equal to one peso per day. Mexico also has
a tax-credit system to boost incomes of low-paid workers, similar to the earned income tax
credit in the United States and the new working families tax credit in the United Kingdom.
Both of these policies encourage lower-income workers into the formal sector.
A similar policy to Mexico’s in spirit was the previous Conservative government’s
basic-pension-plus proposal in the United Kingdom. This government would have paid £9 a
week into all workers’ pension accounts.
There are two key advantages of the direct-subsidy approach. First, the cross-subsidy
is transparent. If firms can only charge proportional fees, then the revenues will be insufficient
to cover costs for lower-paid workers and will exceed costs for higher paid. A direct subsidy
48 For example, see Disney, Emmerson and Tanner (1999) on the long-run impact of the new minimum income guarantee in the United Kingdom.

55
from the government makes this redistribution clear. Secondly, as noted in the Mexican case,
this can encourage low-income workers into the formal system.
5. Strategies to control costs of funded pension systems
The previous section explored four different approaches to regulating the charges in
pension systems. This section looks, first, at the costs of alternative institutional structures to
the systems considered above. Most of the countries discussed in this paper have what are
called in American parlance ‘individual accounts’. These regimes are decentralized, with a
number of competing fund managers and worker choice between the different funds.
5.1 Alternative institutional arrangements for funded pension systems
An alternative to this model is to move to some kind of collective provision.
Proponents point to the low charges in Australia’s industry funds as an example of the cost
savings that are possible. The United States’ 401(k) plan has a similar structure. These
schemes, which have spread very rapidly over the past two decades, are, however, not
mandatory. The new stakeholder plans in the United Kingdom try to control costs in a similar
way, by requiring employers to nominate a scheme rather than having employees choose.
Some analysts have gone further than this model of collective but decentralized
provision and have proposed public management of pension fund assets. Their rationale is in
a large part to reduce administrative costs, but also because they believe that defined-benefit
pension formulae are in some way superior to defined-contribution schemes.49 Heller (1998)
concludes that ‘the principal source of old age support should derive from a well-formulated,
public DB [defined-benefit] pillar, with a significant amount of pre-funding’.50 And Orszag
49 This issue has spawned a large literature, which mainly concludes that the purported advantages of defined-benefit plans are illusory. See Bodie, Marcus and Merton (1988) and the comments on their paper by Kotlikoff. Other studies include Disney and Whitehouse (1994, 1996) and Samwick and Skinner (1993). 50 Heller has two main concerns with defined contribution pension provision. First, the possibility of contingent or conjectural public-sector liabilities in the event that pension funds perform poorly because of systemic long-term declines in asset prices or short-term market turmoil. Secondly, the potential for complicating fiscal-policy management. For example, he worries that comparisons of relative tax burdens or public spending ratios between countries ‘may be increasingly problematic’.

56
and Stiglitz (1999) argue for ‘a more expansive view of the optimal second pillar — which
should incorporate well-designed, public defined-benefit plans.’
Others are skeptical of this solution, because public management of pension funds has,
in practice, delivered poor returns. James (1998) concludes: ‘publicly managed pension
reserves fare poorly and in many cases lost money because public managers were required to
invest in government securities or loans to failing state enterprises at low nominal interest rates
that became negative real rates during inflationary periods’. This argument is confirmed by the
detailed analysis of 22 countries’ public pension funds in Iglesias and Palacios (2000).
Heller (1998) ignores the problems inherent in having governments as fund managers
entirely in his argument for a public, partially pre-funded defined-benefit plan. Orszag and
Stiglitz (1999) do address the issue. They are sanguine about the prospects for public
management.
First, they argue: ‘If capital markets were perfect, then it would simply not be possible
for funds to be badly invested…as long as the portfolio is sufficiently diversified’. Returns on
different assets in this world of perfect markets are merely commensurate with their risk, and
so risk-adjusted returns are the same for all investments. Empirical studies, however, find
evidence of excess returns on equities over less risky assets (such as bonds and deposits), even
adjusting for the difference in risk.51 Capital markets, then, are not perfect and Orszag and
Stiglitz (1999) concede that ‘the assumption of perfect capital markets is not entirely
convincing, especially in many developing countries.’
Secondly, Orszag and Stiglitz (1999) argue that ‘how the government invests its trust
funds is irrelevant’ if ‘individuals can “undo” the public fund portfolio by adjusting their own
portfolio’. Again, this is well established in theory,52 but in practice most workers, even in
richer countries, have few assets and are unable to borrow enough to reverse the effects of
public financial policy.53
51 The classic paper is Mehra and Prescott (1985). The literature attempting to explain the ‘equity premium puzzle’ is large. Constantinides, Donaldson and Mehra (1998), for example, suggest that liquidity constraints prevent younger workers from investing as much as they should in equities. Other relevant papers include Blanchard (1993) and Kotcherlakota (1996) and Jagannathan and Kotcherlakota. (1996). 52 Stiglitz (1983, 1988). 53 Banks and Tanner (1999), for example, find that median financial wealth in the United Kingdom is just £750.

57
5.2 Economies of scale: some evidence
Proponents of public management of pension funds base their arguments mainly on
grounds of costs. For example, Murthi, Orszag and Orszag (1999) favor a ‘centralized’
approach that ‘would aggressively take account of potential economies of scale through
centralized provision’.
Here is a sample of different studies’ conclusions about economies of scale in financial
markets.54
• The evidence above showed no significant relationship in Latin America or the United
Kingdom between charges and the size of funds, though that, of course, does not preclude a
relationship between costs and fund size
• Turner and Beller’s (1989) study of pension funds in the United States found economies of
scale until funds reach $75 million in assets; thereafter, administrative costs as a proportion
of assets remain constant
• James, Vittas and Smalhout (1999) look at mutual funds in the United States. Their
regression analysis suggests that the fall in costs comes to a halt between $20 billion and
$40 billion of assets under management. Collins and Mack (1997), in contrast, find a rather
lower minimum efficient size
• Dermine and Roller (1992) suggest a minimum efficient size in the French mutual fund
market of only $0.5 billion
• OSI, the management consultants, concluded that 0.5 million members would be sufficient
to achieve available scale economies in the provision of stakeholder pensions in the United
Kingdom (Timmins, 1999). With 10½ million personal pensions in the United Kingdom,
even a minimum efficient size of 0.5 million members leaves room for a dozen or so
providers.
• The Australian Prudential Regulatory Authority (1998b) finds evidence of economies of
scale in the administration of the superannuation guarantee. Figure 16 shows that this
effect is stronger for funds using external rather than in-house investment managers.
External administration costs about 1½ times per member for the smallest funds, but is
markedly cheaper for funds with more than 1,000 members. This is surprising, because

58
external managers can achieve economies of scale even by pooling together several small
firms’ funds. Perhaps this result reflects greater competition among external managers for
larger accounts.
Figure 16. Annual administrative expenses per member by external or internal management, Australia, 1996-97
0
100
200
300
400
500
600
700
< 100 100-500
500-1,000
1,000-5,000
5,000-10,000
>10,000
number of members
externally managed
internally managed
Source: Australian Prudential Regulatory Authority (1998b), Figure 3
The evidence on economies of scale is therefore inconclusive if not conflicting. Given
its significance for the optimum structure of the funded pension industry, this is an important
area for future research.
5.3 Constraining portfolios
Public management and collective provision share the characteristic that they restrict
individual portfolio choice. In Bolivia, for example, people are currently allocated to a fund,
and when choice is introduced, it will initially only be between the two present funds. Sweden
54 Indro et al. (1999) provide some interesting evidence that there are diseconomies of scale in active management of funds in the United States. Funds perform more poorly once they reach a certain size.

59
restricts choice indirectly, by encouraging people to move to cheaper funds in its complex
system of cross-subsidies.
The new stakeholder schemes in the United Kingdom are also likely to restrict member
choice of investments to reduce costs within the government’s charge ceiling. The
government has said: ‘We expect some schemes to offer individual members no separate
choice in the way their money is invested…In general, we do not expect members will want to
make complex investment choices’.55
In defined-contribution schemes, it is prudent for people to shift from a riskier (but
higher return), equity-dominated portfolio when young to less risky investments when they
near retirement. (Similar arguments apply if they choose to draw down their fund rather than
convert to an annuity during retirement.) Such a strategy is both standard investment advice
and shown to be optimal by a range of economic studies.56 However, this sensible shift in
investments with age would not be possible with a ‘one-size-fits-all’ investment fund.
Individuals might well wish to avoid complex investment choices, but they can be
expected to make simple choices from a short menu of investment options with different risk-
return properties (e.g. equity or bond-dominated or balanced funds). This would enable people
to reduce the volatility of the value of their pension fund as they neared retirement.
The main counter-argument is one of cost and complexity. Dividing individual
pension contributions between different funds and transferring investments between funds on
members’ request adds to the administrative burden. Providing information on different
investment options and educating people about their investment choices would also be costly.
There is also the risk that workers make the ‘wrong’ choices, investing either too riskily or too
prudently (dubbed ‘reckless conservatism’).
Experience with defined-contribution plans offered by employers in the United States,
mainly 401(k)s, is useful evidence. In 1978, only 16 per cent of plans offered members a
choice of investments, but now 94 per cent have more than one fund, and 58 per cent have
five or more.57 Surveys of members’ investment choices in defined-contribution plans in the
55 Department of Social Security (1999a). See Shah (1999) for a general discussion of individual choice of pension portfolios. 56 See, inter alia, Jagannathan and Kotcherlakota (1996) and Samuelson (1989a,b) and King and Dicks-Mireaux (1982). 57 Regulations protect plans and sponsoring employers from fiduciary responsibilities if members are allowed a sufficiently broad choice of investments with different risk and return characteristics. The vast majority

60
United States show little sign of recklessness, of the prudent or imprudent sort.58 They take
advantage of the flexibility schemes offer to adjust portfolios to suit individual circumstances,
most importantly, how close they are to retirement.
Australia is also moving in the direction of greater member direction of investments.
Over half of superannuation guarantee members had some kind of investment choice by 1996-
97.59
6. Conclusions
It is easy to lose sight of the important issues in pensions policy in the detail of the
analysis of administrative charges, which is necessarily complex and involved. The most
important issues in pension reform relate to financial markets. How large is the equity
premium? How volatile are long-term equity investments? Are stock-markets currently over-
valued? Compared with these questions, administrative charges are a second-order, purely
operational issue.
This paper has tried to set out the options and the arguments in controlling the size of
administrative charges and costs. The spectrum of policies is very broad. At the minimum,
regulations allow any charge level or structure, but impose some disclosure requirements.
Some countries have chosen to regulate charge structures. Simpler fee schedules make it easier
to compare different managers’ charges. A smaller group of countries has gone further and
imposed ceilings on charge levels. Another approach to is to use alternative institutional
structures, including competitive bidding to manage a small number of portfolios or even
public management of a single fund.
Some analysts treat lowering administrative charges as the only goal of designing a
pension system. I have tried to spell out the important trade-offs involved. Lower
administrative charges can involve substantial constraints on individual choice of pension
provider and of pension-fund portfolio and limits on competition. This conflicts with other
goals of pension reforms and might adversely affect pension funds’ net rate of return.
of plans intend to comply with these regulations, allowing members to choose investments (94 per cent of schemes covering 92 per cent of members according to survey data: KPMG Peat Marwick, 1998). 58 See, for example, VanDerhei et al. (1999). Whitehouse (2000b) surveys this and other studies. 59 Australian Prudential Regulatory Authority (1998a).

61
Bibliography
Anderson, J.M., Kolberg, J.E., Vroman, W. and Evans-Young, T. (1997), ‘The pension system of Kazazkhstan: policy, structure, operations and reform’, report to the Ministry of Labour and Social Protection.
Andrews, E.S. (2000), ‘Kazakhstan: an ambitious approach to pension reform’, Pension Reform Primer series, Social Protection Discussion Paper, World Bank, Washington, D.C., forthcoming.
Arrau, P. and Schmidt-Hebbel, K. (1994), ‘Pension systems and reforms: country experiences and research issues’, Revista de Analisis Economico, vol. 9, no. 1, pp. 3-20.
—, Valdés Prieto, S. and Schmidt-Hebbel, K. (1993), ‘Privately managed pension systems: design issues and the Chilean experience’, Policy Research Working Paper, World Bank, Washington, D.C.
Australian Prudential Regulatory Authority (1998a), ‘Member investment choice: analysis update’, Insurance and Superannuation Bulletin, March.
— (1998b), ‘Superannuation funds administration — latest analysis’, Insurance and Superannuation Bulletin, June.
— (1998c), ‘Update on retirement savings accounts’, Insurance and Superannuation Bulletin, June. — (1998d), ‘Investment management expenses’, Insurance and Superannuation Bulletin, September. — (1999), Superannuation Trends, June Quarter 1999, Sydney. Axia Economics (1999a), ‘Comments on minimum standards for stakeholder pensions’,
London. — (1999b), ‘Comments on employer access for stakeholder pensions’, London. Bacon and Woodrow (1999), Comparative Tables: Proposals for Discussion, report prepared for the
Financial Services Authority, London. Ballivian, A.. (1997), ‘Pension reform in Bolivia: fiscal and social impacts’, mimeo., World Bank,
Washington, D.C. Banks, J. and Tanner, S. (1999), Household Saving in the UK, Institute for Fiscal Studies, London. Bateman, H., Doyle, S. and Piggott, J. (1999), ‘Private mandatory retirement provision: design
and implementation challenges’, presented to the 21st annual research conference of the Association for Public Policy Analysis and Management, 4-6 November, Washington, D.C.
Bateman, H. and Piggott, J. (1997), Private Pensions in OECD Countries – Australia, Labour Market and Social Policy Occasional Papers, No. 23, OECD, Paris.
— and — (1999), ‘Mandating retirement provision: the Australian experience’, Geneva Papers on Risk and Insurance, vol. 24, no. 1, pp. 93-113.
— and Valdés Prieto, S. (1999), ‘The mandatory private old age income schemes of Australia and Chile: a comparison’, mimeo., University of New South Wales.
Blanchard, O.J. (1993), ‘The vanishing equity premium’, in O’Brien, R. (ed.), Finance and the International Economy 7, Oxford University Press.
Bodie, Z., Marcus, A.J. and Merton, R.C. (1988), ‘‘Defined benefit versus defined contribution pension plans: what are the real trade offs?’, in Bodie, Z., Shoven, J.B. and Wise, D.A. (eds), Pensions in the US Economy, University of Chicago Press for National Bureau of Economic Research.
Born, P., Gentry, W.M., Viscusi, W.K and Zechauser, R.J. (1995), ‘Organizational form and insurance company performance: stocks versus mutuals’, Working Paper no. 5246, National Bureau of Economic Research, Cambridge, Mass.

62
Brown-Humes, C. (1999), ‘Death of a salesman: the stakeholder pension may put many financial advisors out of business as they are forced to accept lower commissions’, Financial Times, 22 April.
Chapman, J. (1998), ‘Pension plans made easy’, Money Management, November. Chlon, A. (2000), ‘Pension reform and public information in Poland’, Pension Reform Primer
series, Social Protection Discussion Paper, World Bank, Washington, D.C., forthcoming.
—, Góra, M. and Rutkowski, M. (1999), ‘Shaping pension reform in Poland: Security through Diversity’, Pension Reform Primer series, Social Protection Discussion Paper no. 9923, World Bank, Washington, D.C.
Collins, S. and Mack, P. (1997), ‘The optimal amount of assets under management in the mutual fund industry’, Financial Analysts Journal, vol. 51, pp. 70-79.
Constantinides, G., Donaldson, J. and Mehra, R. (1998), “‘Junior can’t borrow.” A new perspective on the equity premium puzzle’, Working Paper no. 6617, National Bureau of Economic Research, Cambridge, Mass.
Dahlquist, M. Engström, S. and Söderlind, P. (1999), ‘Performance and characteristics of Swedish mutual funds, 1993-97’, Discussion Paper no. 2166, Centre for Economic Policy Research, London.
Department of Social Security (1997), ‘Guaranteed secure pensions for all, says Peter Lilley’, DSS Press Notice no. 97/044, London.
— (1998), A New Contract for Welfare: Partnership in Pensions, London. — (1999a), ‘Stakeholder pensions: minimum standards — the government’s proposals’,
Consultation Brief no. 1, London. — (1999b), ‘Stakeholder pensions: employer access — the government’s proposals’,
Consultation Brief no. 2, London. — (1999c), ‘Stakeholder pensions: the tax regime — the government’s proposals’, Consultation
Brief no. 6, London. — (2000), ‘The pensioners’ income series 1997-98’, London. Diamond, P. (1994), ‘Privatization of social security: lessons from Chile’, Revista de Analisis
Economico, vol. 9, no. 1, pp. 21-34. — (1998), ‘Administrative costs and equilibrium charges with individual accounts’, Working
Paper no. 7050, National Bureau of Economic Research, Cambridge, Mass. Dilnot, A.W., Disney, R.F., Johnson, P.G. and Whitehouse, E.R. (1994), Pensions Policy in the
UK: An Economic Analysis, Institute for Fiscal Studies, London. Disney, R.F., Emmerson, C. and Tanner, S. (1999), Partnership in Pensions: An Assessment,
Institute for Fiscal Studies, London. —, Meghir, C.H.D and Whitehouse, E.R. (1994), ‘Retirement behaviour in Britain’, Fiscal
Studies, vol. 15, no. 1, pp. 24-43. —, Palacios, R.J. and Whitehouse, E.R. (1999), ‘Individual choice of pension arrangement as a
pension reform strategy’, Working Paper no. 99/18, Institute for Fiscal Studies, London.
— and Whitehouse, E.R. (1991), ‘Occupational and industrial earnings over time: the use of pooled cross-section data’, Working Paper no. 91/7, Institute for Fiscal Studies, London.
— and — (1992a), The Personal Pension Stampede, Institute for Fiscal Studies, London. — and — (1992b), ‘Personal pensions and the review of the contracting out terms’, Fiscal
Studies, vol. 13, no. 1, pp. 38-53.

63
— and — (1994), ‘Choice of private pension and pension benefits in Britain’, Working Paper no. 94/2, Institute for Fiscal Studies, London.
— and — (1996), ‘What are occupational pension entitlements worth in Britain?’, Economica, vol. 63, pp. 213-238.
— and — (1999), ‘Pension plans and retirement incentives’, Pension Reform Primer series, Social Protection Discussion Paper no. 9924, World Bank, Washington, D.C.
Edwards, S. (1998), ‘The Chilean pension reform: a pioneering program’, in Feldstein, M. (ed.), Privatizing Social Security, University of Chicago Press for the National Bureau of Economic Research.
Ewing, A. and Goldmark, S. (1994), ‘Privatization by capitalization: the case of Bolivia — a popular participation recipe for cash-starved SOEs’,. Finance and Private Sector Development Note no. 31, World Bank, Washington, D.C.
Federación Internacional de Administradoras de Fondos de Pensiones (2000), Boletin Estadístico, no. 7.
Financial Services Authority (1999), Comparative Information for Financial Services, Consultation Paper no. 28, London.
Financial Times (1999a), ‘Warning on stakeholder costs: Life assurers unlikely to make money from proposed scheme’, 12 April.
— (1999b), ‘Pay-by-fee plan for independent financial advisors’, 15 April. — (1999c), ‘With-profits funds “facing extinction”. Financial services actuaries warn against
complexity and high charges’, 25 November. Fundacion de Investigaciones Economicas Latinoamericanas (FIEL) (1999), La Regulacion de la
Competencia y de los Servicios Publicos: Teoria y Experiencia Argentina Reciente, Buenos Aires. General Accounting Office (1999a), ‘Social security reform: implementation issues for
individual accounts’, HEHS-99-122, Washington, D.C. — (1999b), ‘Social security reform: administrative costs for individual accounts depend on
system design’, HEHS-99-131, Washington, D.C. Government Actuary (1999), ‘Occupational and personal pension schemes in the UK: terms
for contracting out of Serps’, London. Heller, P. (1998), ‘Rethinking public pension initiatives’, Working Paper no. 98/61,
International Monetary Fund, Washington, D.C. IFA Association (1998), A Report on the Distribution Channels for Financial Services in the UK and the
Case for the Retention of Polarisation Prepared for the Office of Fair Trading, London. Iglesias, A. and Palacios, R.J. (2000), ‘Managing public pension reserves: evidence from the
international experience’, Pension Reform Primer series, Social Protection Discussion Paper no. 0003, World Bank, Washington, D.C.
Indro, D.C., Jiang, C.X., Hu, M.Y. and Lee, W.Y. (1999), ‘Mutual fund performance: does fund size matter?’ Financial Analysts Journal, pp. 74-87.
Inland Revenue (1999), Inland Revenue Statistics 1999, Government Statistical Service, London. Jagannathan, R. and Kotcherlakota, N.R. (1996), ‘Why should older people invest less in stocks
than younger people?’ Federal Reserve Bank of Minneapolis Quarterly Review, vol. 20, no. 3, Summer.
James, E., Ferrier, G., Smalhout, J. and Vittas, D. (1999), ‘Mutual funds and institutional investments: what is the most efficient way to set up individual accounts in a social security system’, Working Paper no. 7049, National Bureau of Economic Research, Cambridge, Mass.
— and Palacios, R.J. (1995), ‘The cost of administering publicly managed pensions’, Finance and Development, vol. 32, no. 2, pp. 12-15.

64
—, Smalhout, J. and Vittas, D. (1999), ‘Administrative costs and the organization of individual account systems: a comparative perspective’, presented to the conference ‘New ideas about old-age security’, World Bank, Washington, D.C., 14-15 September.
James, K.R. (2000), ‘The price of retail investing in the UK’, Occasional Paper no. 6, Financial Services Authority, London.
King, M.A. and Dicks-Mireaux, L. (1982), ‘Asset holdings and the life cycle’, Economic Journal, vol. 92, pp. 247-267.
Kotcherlakota, N.R. (1996), ‘The equity premium: it’s still a puzzle’, Journal of Economic Literature, vol. 34, pp. 42-71.
KPMG Peat Marwick (1998), Retirement Benefits in the 1990s: 1998 Survey Data, Washington, D.C. Meghir, C.H.D. and Whitehouse, E.R. (1996), ‘The evolution of wages in the United Kingdom:
evidence from micro data’, Journal of Labor Economics, vol. 14, no. 1, pp. 1-25. — and — (1997), ‘Labour market transitions and the retirement of men in the UK’, Journal of
Econometrics, vol. 79, pp. 327-354. Mehra, R. and Prescott, E.C. (1985), ‘The equity premium: a puzzle’, Journal of Monetary
Economics, vol. 15, pp. 145-161. Mitchell, O.S. (1998), ‘Administrative costs in public and private retirement systems’, in
Feldstein, M. (ed.), Privatizing Social Security, University of Chicago Press for National Bureau of Economic Research.
— (1999), ‘Administrative costs in Mexico’s AFORES pension system’, Working Paper no. 99-1, Pension Research Council, Wharton School, University of Pennsylvania.
Murthi, M., Orszag, J.M. and Orszag, P.R. (1999), ‘Administrative costs under a decentralized approach to individual accounts: lessons from the United Kingdom’, Discussion Paper, Birkbeck College, London.
National Consumer Council (1994), Consumer Concerns: A Consumer View of Personal Financial Services: The Report of a Mori Survey, London.
Office of Fair Trading (1992), Independent Financial Advisors and the Impact of Commission Disclosure, a research report by London Economics for the Office of Fair Trading, London.
— (1997), Report of the Director General’s Inquiry into Pensions, London. — (1999), The Rules on the Polarisation of Investment Advice: A Report by the Director General of Fair
Trading, London. Olsen, K.A. (1998), ‘Individual social security accounts and employers: potential consequences
for administration, taxes, and employment-based pensions’, submitted for the written record, House of Representatives, Committee on Ways and Means, Subcommittee on Social Security.
— and Salisbury, D.L. (1998), ‘Individual social security accounts: issues in assessing administrative feasibility and costs’, Special Report no. 34 and issue Brief no. 203, Employee Benefits Research Institute, Washington, D.C.
Organisation for Economic Co-operation and Development (OECD) (1998a), Maintaining Prosperity in an Ageing Society, Paris.
— (1998b), ‘Work-force ageing in OECD countries’, Employment Outlook, pp. 123-151, Paris. (Also available as Ageing Working Paper no. 4.1)
Orszag, P.R. and Stiglitz, J.E. (1999), ‘Rethinking pension reform: ten myths about social security systems’, presented to the conference ‘New ideas about old-age security’, World Bank, Washington, D.C., 14-15 September.
Palacios, R.J. and Rocha, R. (1998), ‘The Hungarian pension system in transition’, Pension Reform Primer series, Social Protection Discussion Paper no. 9805, World Bank, Washington, D.C.

65
— and Whitehouse, E.R. (1998), ‘The role of choice in the transition to a funded pension system’, Social Protection Discussion Paper no. 9812, World Bank, Washington, D.C.
Palmer, E. (2000), ‘The Swedish pension reform — framework and issues’, mimeo., National Social Insurance Board, Stockholm.
Pennachi, G. (1998), ‘Government guarantees on funded pension returns’, Pension Reform Primer series, Social Protection Discussion Paper no. 9806, World Bank, Washington, D.C.
Personal Investment Authority (1995), Life Assurance Disclosure: One Year On, London. — (1999), Fifth Survey of the Persistency of Life and Pensions Policies, London. Queisser, M. (1998), ‘The second generation pension reforms in Latin America’, Ageing
Working Paper no. 5.4, OECD, Paris. Rea, J.D. and Reid, B.K. (1998), ‘Trends in the ownership cost of equity mutual funds’,
Perspective, vol. 4, no. 3, Investment Company Institute, Washington, D.C. Samuelson, P.A. (1989a), ‘The judgement of economic science on rational portfolio
management: indexing, timing and long-horizon effects’, Journal of Portfolio Management, pp. 4-12, Fall.
— (1989b), ‘A case at last for age-phased reduction in equity’, Proceedings of the National Academy of Sciences, vol. 86, pp. 9048-9051.
Samwick, AA. and Skinner, J. (1993), ‘How will defined-contribution pension plans affect retirement income?’, Working Paper, National Bureau of Economic Research, Cambridge, Mass.
Scherman, K.G. (1999), ‘The Swedish pension reform’, Issues in Social Protection Discussion Paper no. 7, International Labour Office, Geneva.
Shah, A. and Fernandes, K. (1999), ‘The relevance of index funds for pension investment in equities’, presented to the conference ‘New ideas about old-age security’, World Bank, Washington, D.C., 14-15 September.
Shah, H. (1997), ‘Towards better regulation of private pension funds’, Policy Research Working Paper no. 1791, World Bank, Washington, D.C.
— (1999), ‘Pension fund investments: individual choice versus control’, mimeo., World Bank, Washington, D.C.
Shoven, J.B. (2000), Administrative Costs and Social Security Privatization, National Bureau of Economic Research, Cambridge, Mass., forthcoming.
Siegel, J. (1992), ‘The equity premium: stock and bond returns since 1802’, Financial Analysts Journal, pp. 28-38.
Sinha, T., Martínez, F.and Barrios-Muñoz, C. (1998), ‘Performance of publicly mandated private pension funds in Mexico: simulations with transactions costs’, mimeo., Instituto Tecnologico Autonomo de Mexico City.
Srinivas, P.S., Whitehouse, E.R. and Yermo, J. (2000), ‘Regulating pension funds’ structure, investments and performance: cross-country evidence’, Pension Reform Primer series, Social Protection Discussion Paper, World Bank, Washington, D.C., forthcoming.
Stilgitz, J.E. (1983), ‘On the relevance or irrelevance of public financial policy: indexation, price rigidities and optimal monetary policy’, in Dornbusch, R. and Simonsen, M (eds), Inflation, Debt and Indexation, MIT Press, Cambridge, Mass.
— (1988), ‘On the relevance or irrelevance of public financial policy’, in Proceedings of the 1986 International Economics Association Meeting.
Sundén, A. (1998), ‘The Swedish pension reform’, mimeo., Federal Reserve Board.

66
Taylor, M.F., with Brice, J., Buck, N and Prentice-Lane, E. (1999), ‘British Household Panel Survey: user manual: introduction, technical report and appendices’, University of Essex, Colchester.
Timmins, N. (1999), ‘Pension move “to hit life companies”: Providers could fall from 60 to six in a decade says OSI’, Financial Times, 29 March.
Tuner, J.A. and Rajnes, D.M. (2000), ‘Limiting workers’ financial risk through risk sharing: minimum rate of return guarantees for mandatory defined contribution plans’, International Labour Office, Geneva.
Turner, R. and Beller, D. (1989), Trends in Pensions, Department of Labor, Washington, D.C. Valdés Prieto, S. (1994), ‘Administrative charges in pensions in Chile, Malaysia, Zambia and
the United States’, Policy Research Working Paper no. 1372, World Bank, Washington, D.C.
— (1995), ‘Vendedores de AFPs: producto del mercado o de regulaciones ineficientes?’ Working Paper no. 178, Institute of Economics, Catholic University of Chile.
— (1999a), ‘Las comisiones de las AFPs: caras o baratos?’ Estudios Publicos, vol. 73, pp. 255-291.
— (1999b), ‘Costos administrativos en un sistema pensiones privatizado’, Development Discussion Paper no. 677, Harvard Institute for International Development, Cambridge, Mass.
VanDerhei, J.L., Galer, R., Quick, C. and Rea, J. (1999), 401(k) Plan Asset Allocation, Account Balances and Loan Activity, Employee Benefit Research Institute, Washington, D.C.
Von Gersdorff, H. (1997), ‘The Bolivian pension reform: innovative solutions to common problems’, Policy Research Working Paper no. 1832, World Bank, Washington, D.C.
Walford, J. (1998), Personal Pensions 1998, Financial Times Magazines, London. Whitehouse, E.R. (1998), ‘Pension reform in Britain’, Pension Reform Primer series, Social
Protection Discussion Paper no. 9810, World Bank, Washington, D.C. — (2000a), ‘Consumer financial literacy, public information and pension reform: a case study
of the United Kingdom’, Pension Reform Primer series, Social Protection Discussion Paper no. 0004, World Bank, Washington, D.C.
— (2000b), ‘Consumer financial literacy and pension information: a case study of the United States’, Pension Reform Primer series, Social Protection Discussion Paper, World Bank, Washington, D.C., forthcoming.
— (2000c), ‘Corporate governance and funded pensions’, Pension Reform Primer series, Social Protection Discussion Paper, World Bank, Washington, D.C., forthcoming.
— (2000d), ‘The value of pension entitlements: an illustrative model of nine OECD countries’, mimeo., OECD, Paris.
— (2000e), ‘Paying for pensions: an international comparison of administrative charges in funded retirement-income systems’, Occasional Paper, Financial Services Authority, London, forthcoming.
— and Wolf, M. (1997), ‘State retirement plans’, Financial Times, 3 March. World Bank (1994), Averting the Old Age Crisis: Policies to Protect the Old and Promote Growth,
Oxford University Press. — (1995), Bolivia: Financial Markets and Pension Reform Technical Assistance Project, Report no. P
6142, Washington, D.C. — (1998), Report and Recommendations of the IBRD to the Executive Directors on a Proposed Pension
Reform Adjustment Loan of US$300 million to Kazakhstan, Report no. P 7242 KZ, Washington, D.C.