administration and financing the plan - seattle.gov …spu/... · 6.3.3 projected monetary needs...
TRANSCRIPT

6
Administration and Financing the Plan

Ross Palmer BeecherCandy Cobweb Quilt, 2003Wire-stitched metal, paint wood, costume jewelry and found objects35 x 35.5 x 3 inches
Contents
Chapter 6 Administration and Financing the Plan ............ 3
6.1 Organization and Mission of Seattle Public Utilities ..................................... 3 6.1.1 Organization Structure ...............................................................................................................4 6.1.2 Decision-Making in SPU ..............................................................................................................5
6.2 Education ........................................................................................................... 5 6.2.1 Customer Service Infrastructure ..............................................................................................6 6.2.2 Commercial Education ................................................................................................................7 6.2.3 Residential Education ...................................................................................................................7 6.2.4 Community Outreach .................................................................................................................8 6.2.5 Putting Practice into Play ............................................................................................................8
6.3 Financing the Plan ........................................................................................... 10 6.3.1 Financial Management ............................................................................................................... 10 6.3.2 Funding Sources ......................................................................................................................... 12 6.3.3 Projected Monetary Needs and Financing Strategy .......................................................... 17
List of Figures Figure 6-1 SPU Organization ............................................................................................................................4Figure 6-2 Seattle Solid Waste Revenue Sources 2010 .......................................................................... 13Figure 6-3 SPU Single-Family Monthly Solid Waste Bills 1994 -2011 .................................................. 14Figure 6-4 SPU Capital Spending and Debt Financing 2001– 2010 ...................................................... 16Figure 6-5 SPU Projected Capital Financing (in $1000s) ........................................................................ 19Figure 6-6 Projected SPU Solid Waste O&M Spending .......................................................................... 22Figure 6-7 Status Quo and Preferred Scenarios ....................................................................................... 22Figure 6-8 Average Rates for Status Quo and Preferred Scenarios* .................................................. 23Figure 6-9 Status Quo and Preferred Scenarios Revenue and Rate Projections .............................. 24 List of Tables Table 6-1 SPU Financial Results 2006-2010 (in millions of dollars) ..................................................... 12Table 6-2 SPU Monthly Residential Can Rates 2011 ............................................................................... 14Table 6-3 SPU Monthly Residential Dumpster Rates 2011 .................................................................... 14Table 6-4 SPU Food and Yard Waste Collection Rates 2011 ............................................................... 15Table 6-5 SPU Commercial Rates 2011 ...................................................................................................... 15Table 6-6 SPU Self-Haul Rates 2011 ............................................................................................................ 16Table 6-7 SPU Solid Waste Capital Improvement Plan for 2011 – 2016 (in $1000s) .................... 17Table 6-8 SPU Solid Waste Capital Facilities Plan through 2030 (in $1000s) ................................... 18

Chapter 6 Administration & Financing Plan
6-2 Seattle Solid Waste Plan 2011 Revision
Table 6-9 SPU Adopted Solid Waste Operations & Maintenance Budget by Branch and by Function 2011 ................................................................................................................................................... 20

Chapter 6 Administration & Financing Plan
Final Approved June 2013 6-3
Chapter 6 ADMINISTRATION AND FINANCING THE PLAN
6.1 ORGANIZATION AND MISSION OF SEATTLE PUBLIC UTILITIES
Seattle Public Utilities (SPU) is a department in the City of Seattle. It is composed of three major direct-service providing utilities:
• Water Utility provides more than 1.3 million people with a reliable supply of clean and safe water for drinking and other uses.
• Drainage and Wastewater Utility collects and conveys the city's sewage and stormwater.
• Solid Waste Utility functions are described throughout this Plan
SPU Mission
We provide reliable, efficient and environmentally conscious utility services to enhance the quality of life and livability in all communities we serve.

Chapter 6 Administration & Financing Plan
6-4 Seattle Solid Waste Plan 2011 Revision
6.1.1 ORGANIZATION STRUCTURE SPU consists of seven branches. Each branch and the Director’s office have a role in carrying out solid waste management functions (Figure 6-1).
Figure 6-1 SPU Organization
Seattle Public Utilities Director's Office Corporate
Strategies & Communications
Office
Asset Management & Economics
Services
Corporate Communications
Corporate Policy & Performance
Customer Service Branch
Administration CS
Customer Billing Services
Customer Programs &
Contracts Mngmt
Customer Response
Utility Service Teams
Field Operations & Maintenance
Branch
Asset Data Systems
Crew Scheduling & Project Delivery
Drainage & Wastewater
Maintenance Division
Solid Waste Operations
Utility Support Division
Water Distribution and Transmission
Finance & Administration
Branch
Administration F&A
Facilities & Real Property
Finance
Fleets & Warehousing
Information Technology
Risk and Quality Assurance
Technology Program Office
Human Resources & Service Equity
Branch
Environmental Justice & Service
Equity
Human Resource Operations & Data
Mgmt
Human Resources
Safety
Project Delivery Branch
Administration PDB
Construction Management
Project Management and
Engineering
Project Support
Utility Systems Management
Branch
Administration USM
Drainage & Wastewater Quality
Drainage & Wastewater
Systems Mgmt
Drinking Water
Laboratory Services
Solid Waste
Watershed Services
Director's Office The Director of SPU leads the organization following policies set by the Mayor and the Seattle City Council. The Corporate Strategies and Communications Office assists the Director in designing and carrying out policy, strategy, analyses, community relations, and internal and external communications. The office focuses on issues, initiatives, and agreements involving all SPU's lines of business, other departments and governments, and the public.
Finance and Administration Branch The Finance and Administration Branch houses the financial functions of SPU, including, accounting, budget, and rates. This branch also takes care of information technology, real property, risk management, and fleets and warehousing for all of SPU.
Human Resources and Service Equity Branch In addition to carrying out SPU's human resource functions, this branch also includes the department's Environmental Justice and Service Equity division (EJSE). EJSE makes sure that SPU's projects, programs, and services do not disproportionately affect human health and economies in communities of color, low-incomes, immigrants, and refugees. EJSE also ensures
Chapter 6 Administration & Financing Plan
Final Approved June 2013 6-5
that SPU programs, projects, and services are done in ways that fairly spread benefits across all communities.
Customer Service Branch The Customer Service Branch is responsible for most of SPU's regular customer contact. Specifically, for solid waste this branch does the following:
• Customer Billing Services manages all SPU's bills to customers.
• Customer Response includes the call center, where customers call with questions and requests about their service.
• Utility Service Teams is the division that includes the solid waste inspection team.
• Customer Programs and Contracts Management is responsible for carrying out many of SPU's programs, such as materials market development, and implementing programs.
Project Delivery Branch The Project Delivery Branch carries out approved capital projects. The branch provides SPU's engineering design and support services, construction inspection, and project management services.
Utility Systems Management Branch This branch is the main planning arm of SPU. Within it, the Solid Waste division ensures that the solid waste system and its assets are properly planned, developed, operated, and maintained. The Solid Waste division further ensures that asset management principles and practices are applied to achieve customer and environmental service levels at the lowest life-cycle cost.
Field Operations and Maintenance Branch Solid waste field operations and maintenance are located in this branch. It includes the day-to-day functions of the transfer stations, the historic landfills, and the household hazardous waste facilities.
6.1.2 DECISION-MAKING IN SPU In 2002, SPU began implementing a comprehensive asset management program. Asset management aims to ensure that a "triple bottom line" is fully considered when SPU makes decisions about its programs and assets. The triple bottom line includes financial, environmental, and social impacts.
Asset management in SPU has focused mainly on capital (infrastructure) assets and projects. As success grows with the asset management approach, we will apply it to more non-capital (programmatic) decisions.
6.2 EDUCATION SPU places high priority on customer education in recycling and waste reduction. We provide solid waste services for more than 390,000 multi-family units, single-family households and
Chapter 6 Administration & Financing Plan
6-6 Seattle Solid Waste Plan 2011 Revision
businesses, who generate more than one million tons of MSW and C&D waste each year. Educating our customers about the impacts of their behavior and highlighting the programs available to them has helped develop the city’s identity as one of the greenest in the nation.
6.2.1 CUSTOMER SERVICE INFRASTRUCTURE Many of Seattle’s solid waste education efforts are built into SPU's customer service and overall communications. Overall communication provides utility information to all drainage, wastewater, water, and solid waste customers.
Call Center In terms of sheer numbers, the chief means by which SPU interacts with its customers is through its 206-684-3000 phone number. Customers can get information about all SPU’s programs and services, and access their own billing and service information.
Call center staff receive regular training on solid waste programs to help them provide quality customer assistance.
Newsletters & Calendars SPU’s most effective customer education tool is regular newsletters:
CurbWaste & Conserve ─ CurbWaste & Conserve is a 6-page newsletter published two to four times a year and sent to all 320,000 single- and multi-family residents who receive SPU services. The newsletter highlights SPU’s environmental programs and offers tips to residents on how they can help the environment. A monthly email version of the newsletter is also available.
@ Your Service ─ @ Your Service is a 2-page newsletter that is inserted with the SPU’s 160,000 bi-monthly residential customer bills. The newsletter mainly focuses on service and billing changes.
Collection Calendars ─ SPU's single-family, multi-family, and small business recycling customers receive annual collection calendars that outline their collection and billing services. It gives tips on how to reduce and reuse, including pointers on what materials can be put in the recycling and composting.
The Web SPU’s website is the main information portal to all SPU programs and services. In 2010, the website generated 2,677,635 visits and 10,762,688 page views. The solid waste collection calendar is one of the most often accessed pages on the website.
In addition to summary descriptions of Seattle’s solid waste services, the SPU website hosts planning documents, reports, informational brochures, and instructional videos and video games to help educate businesses and residents. The website also hosts a blog, Facebook, MySpace and Twitter pages for social networking.
Inspectors SPU has a team of inspectors whose key role is to ensure that solid waste collection goes smoothly for all of Seattle’s commercial and residential customers. In addition to following up
Chapter 6 Administration & Financing Plan
Final Approved June 2013 6-7
on customer complaints and troubleshooting collection issues, the inspection team also works with the city’s collection contractors to enforce customer compliance with Seattle’s solid waste regulations.
Transfer Stations The city’s two recycling and disposal transfer stations offer education to their commercial and residential customers, mainly through talking to customers in person. The transfer stations also use their customer billing system, a low-power radio broadcast at each station, and brochures and signs on site to inform customers.
6.2.2 COMMERCIAL EDUCATION Commercial customers receive billing and service information through their private collection service contractors. SPU staff, collection contractors, and non-profit agencies also develop and promote new programs.
Resource Venture Most commercial solid waste education programs for Seattle are channeled through Resource Venture. Resource Venture is a contracted consulting service that specializes in providing free waste reduction, recycling, and composting audits to Seattle-area businesses.
Additional commercial education partners include Waste Management, CleanScapes, Cedar Grove, and many community-based organizations (SeaDruNar and Allied Waste), who are vital in helping SPU reach populations that speak languages other than English.
Key Accounts SPU offers additional customer support to its largest 100 commercial customers through a key billing accounts team. Key accounts team members work to inform large commercial customers about upcoming impacts to their billing or services. They also help educate large commercial customers about the utility’s environmental programs that are available to them.
6.2.3 RESIDENTIAL EDUCATION
Single-Family With several programs that promote recycling and composting to its single-family customers, SPU relies on market research to develop messages that connect with and motivate its customers. We conduct several customer surveys a year. Feedback from customers has helped define which tactics are most effective when promoting solid waste programs. Direct mail and television news stories and advertising rank highest in terms of effective message delivery to single-family customers.
Multi-Family SPU’s multi-family education strategy hinges on empowering these property owners and managers so that they act as educators to their tenants.

Chapter 6 Administration & Financing Plan
6-8 Seattle Solid Waste Plan 2011 Revision
SPU provides apartment and condo managers with an educational tool kit that allows them to order educational information in multiple languages for their tenants. The program also offers a one-time $100 credit on their utility bill if they sign up for a Friend of Recycling and Composting (FORC) stewardships. FORC stewards are a tenant or manager who, once trained, acts as an onsite solid waste educator to the building’s tenants.
6.2.4 COMMUNITY OUTREACH Engaging and partnering with public organizations is a key strategy in promoting SPU's solid waste programs. We partner with other city departments, school districts, local government, state and non-profit agencies to better serve our customers. Our customers include children, immigrants, and populations that speak languages other than English.
SPU also invites input from the public through its Solid Waste Advisory Committee, which provides opinion and analysis on solid waste issues, programs and services.
6.2.5 PUTTING PRACTICE INTO PLAY In 2009, SPU improved its curbside residential recycling services to include more materials and to make recycling more convenient. Changes included the following:
• New collection dates
• No more sorting of glass
• Ability to recycle more items
• Weekly food and yard waste collection
• Increased food scrap recycling to include meat and fish
In addition, SPU established food and yard waste collection as a mandatory service for single-family homes, meaning that many people would be recycling food for the very first time.
The new solid waste services resulted in monthly rate increases for many customers. The new changes required Seattle residents to rethink the way that they handled their garbage, recycling, and yard waste. SPU expected that some customers would resist the changes, and especially the rate increase. All Seattle customers, particularly minority and underserved populations, needed equitable levels of service and attention.
Forming an interdisciplinary outreach team, SPU developed and implemented a communications plan to raise customer awareness and support for the service changes. The resulting "Better Recycling Starts March 30" Outreach Campaign was extremely successful. The campaign was highly visible and exceeded behavior change and awareness objectives set before program launch. Outreach tactics consisted of customer research, focus groups, mailers, community meetings, speakers bureau presentations, advertising, and media relations.
SPU addressed the challenge of providing information to English as Second Language (ESL) communities and other minority populations through a comprehensive media relations campaign targeted at minority radio, TV, and print publications. The campaign put special focus on food composting, because research showed food composting was hard for these groups to embrace.
Chapter 6 Administration & Financing Plan
Final Approved June 2013 6-9
Result: To analyze the success of the outreach campaign, SPU surveyed Seattle residents by phone in May 2009. Of those surveyed, 82.6% were aware of the changes in garbage and recycling services. And 72.9% knew how to use the new services. Some 79% reported knowing their new collection day. A mini-survey conducted before service launch during the marketing campaign found that 94% surveyed recalled hearing messaging about the new recycling services.
Result: SPU reported 120,232 page views for its website in March 2009, an increase of 116% from March 2008. SPU’s “Where Does it Go” recycling flyer received 33,000 page views in March and April, the highest-viewed SPU webpage during the same period.
Result: Campaign research indicated that not only was satisfaction with SPU maintained during the service change and rate increase, but customers were also more satisfied with SPU services after the change. Some 62.4% reported being satisfied with SPU services after the changes were introduced, up from 57.4% before changes.
Result: Curbside food recycling among Seattle residents increased 43% from March 2009 through August 2009. It peaked in April, May and June, the months following the campaign launch.
The Washington State Recycling Association recognized the City of Seattle with a Recycler of the Year Award for the Better Recycling Starts March 30 Campaign. The campaign also received a Silver Award of Excellence from the Solid Waste Association of North America.
Objective #1: Customers reflect an understanding of new service changes and are aware of their new collection day.
Objective #2: Increase visits to the SPU website by at least 50% during March 2009 to provide residents detailed information about service changes and their new collection date.
Objective #3: SPU maintains satisfaction levels among residents during the service launch in March 2009.
Objective #4: Increase amount of food waste recycled by at least 25% in the first 4 months following the March 30 service launch.

Chapter 6 Administration & Financing Plan
6-10 Seattle Solid Waste Plan 2011 Revision
6.3 FINANCING THE PLAN This section describes Seattle’s framework for managing solid waste system finances. It discusses methods of financing the solid waste system. It also projects the costs of operating the solid waste system and meeting City of Seattle waste reduction and recycling objectives.
6.3.1 FINANCIAL MANAGEMENT
Financial Policies Financial management of Seattle’s solid waste system is directed by two forces. One is through formal financial policies the City Council adopts. The other is by informal guidelines evolved over time in response to specific issues. SPU uses these policies and guidelines to decide how to finance solid waste system operations and capital projects. The goals of these policies are:
• To ensure the financial integrity of the solid waste utility
• To moderate rate increases for solid waste customers over the near and medium term
• To ensure an equitable allocation of capital costs between current and future ratepayers
The City Council adopted these financial policies in 2004:
1. Net Income ─ Net income should be generally positive.
2. Cash Target ─ Target for year-end operating fund cash balance is 20 days of contract payments for collection and disposal services.
3. Cash Funding of the Capital Improvement Program ─ A minimum of $2.5 million (in constant 2003 dollars) of the annual CIP should be funded with cash. SPU has adopted an informal policy of funding the greater of $2.5 million (in 2003 dollars) or 10% of the CIP in years of higher spending.
4. Debt Service Coverage ─ Debt service coverage on first-lien debt should be at least 1.7 times debt service cost in each year.
5. Maintenance of Capital Assets ─ For the benefit of both current and future ratepayers, the solid waste system will seek to maintain its capital assets in sound working condition.
6. Variable Rate Debt ─ Variable rate debt should not exceed 15% of total outstanding debt.
7. Debt Structure ─ As a general practice, the solid waste system will have level nominal debt service and will not defer the repayment of principal.
Financial policies help determine how much revenue SPU must collect from its customers each year to meet the cost of operations, maintenance and repair, and capital improvements. Accordingly, rates are generally set to meet the financial policies as well as to meet projected systemwide solid waste needs. Rate impacts stemming from specific courses of action recommended in this plan cannot be determined without first considering financial policies.

Chapter 6 Administration & Financing Plan
Final Approved June 2013 6-11
Financial Results Financially healthy organizations have the flexibility to respond to unexpected circumstances. Such circumstances may include new, unexpected-but-essential tasks or a shortfall in earnings. Flexibility can mean redirecting expenditures, borrowing money to meet an unexpected need, or other approaches.
Debt service coverage is a key indicator used by the financial community that provides a measure of SPU’s financial health. Debt service coverage is an annual measure of the revenue an organization has available to repay debt, divided by debt payments. SPU’s debt-service coverage policy target is 1.70. SPU has well surpassed this target in the past, and we expect to meet the target in the period covered by this Plan.
Credit ratings also reflect the financial health of an organization. They are an informed assessment of the long-term security of bond investments. Rating agencies take account of a variety of factors including:
• Financial policies
• Strength of the local economy
• Legal security
• Risk factors
• Comparative rate levels
• Management capability and performance
• Willingness of elected officials to raise rates
The City of Seattle solid waste system has excellent bond ratings.1
SPU has made a major commitment to using the
asset management approach described in section 6.1.2 in its capital planning and budgeting. By adopting an asset management approach, SPU is better able to ensure cost effectiveness in service delivery in the long run. This cost effectiveness is reflected in SPU's financial results over the past 5 years (Table 6-1). With the exception of 2009 when the 2007 – 2012 Global Recession caused significant revenue losses, SPU has consistently met its financial targets.
1AA by Standard and Poor’s and Aa3 by Moody’s

Chapter 6 Administration & Financing Plan
6-12 Seattle Solid Waste Plan 2011 Revision
Table 6-1 SPU Financial Results 2006-2010 (in millions of dollars)
Revenues and Expenditures 2006 2007 2008 2009 2010 Revenues Operating Revenues 112,474 121,930 124,343 135,641 150,906 Total Revenues 112,474 121,930 124,343 135,641 150,906 Expenses Operations and Maintenance (O&M) 88,035 91,207 91,169 116,812 120,904 Taxes 17,018 18,934 18,883 19,477 16,643 Interest Expense 1,531 1,471 3.051 2,613 2,512 Depreciation and Amortization 7,217 7,093 8,188 7,789 6,916 Total Expenses 113,081 118,704 121,291 146,691 146,975 Other Income (Expense) 115 196 3,589 2,490 2,055 Net Income (1,212) 3,421 6,641 (8,560) 5,986 Financial Indicators Debt Service Coverage Target
4.21 1.70
5.28 1.70
4.36 1.70
1.80 1.70
5.05 1.70
Cash Balance Target
5,621 3,500
10,058 3,500
14,122 3,500
3,889 4,200
10,271 4,800
Cash Funding of the CIP Target
2,600 2,700
3,300 2,800
3,600 2,900
2,700 2,950
6,600 3,000
6.3.2 FUNDING SOURCES Solid waste services are funded through the Solid Waste Fund, an enterprise fund established in 1961 by city ordinance. The primary source of funding for SPU’s solid waste operational costs are revenues derived from commercial and residential solid waste collection and disposal. To finance capital spending, SPU relies primarily on borrowing and to a lesser extent on rate revenues. The solid waste system is in a period of large capital improvements, with projects under way to upgrade both of Seattle’s recycling and disposal stations. Accordingly, SPU will rely heavily on borrowing over the next few years.
Solid Waste Revenue There are four primary sources of operating revenue that fund Seattle’s solid waste programs. These programs cost $151 million to finance in 2010 (Figure 6-2):
• Residential collection rates charged to single-and multi-family accounts
• Commercial collection rates charged to business accounts
• Self-haul tipping fees charged to self-haul customers at the city’s recycling and disposal stations
• Solid waste tonnage fees charged to all entities, including SPU, that are engaged in, or carrying on, the business of collecting and transferring non-recyclable solid waste
The fund also receives other miscellaneous revenues, including grants.

Chapter 6 Administration & Financing Plan
Final Approved June 2013 6-13
Figure 6-2 Seattle Solid Waste Revenue Sources 2010
Solid Waste Rates Solid waste rates are developed by SPU and proposed by the Mayor for the City Council’s approval. Rates are developed based on the following objectives:
• Provide financial soundness
• Advance economic efficiency
• Promote customer equity
• Encourage customer conservation
• Contribute to transparency and customer understanding
• Reduce impacts on low-income customers
Affordability is also an issue considered during rate setting. In 2007 to 2008, SPU conducted an analysis that recommended ways to measure and improve rate affordability. SPU has already adopted the recommended changes to our low-income rate assistance program. See this chapter’s discussion of low-income rate assistance.
Rates are set by customer class. All rates reflect a pay-as-you-throw structure in which rates increase as service levels increase. These variable rates are designed to encourage waste reduction and recycling.
The largest component of solid waste costs is operations and maintenance expense, including collection, processing and disposal contract costs, and transfer station operations costs. From 1994 until 2007, rate increases were relatively minor as those costs stayed relatively flat. However, since 2007 a series of rate increases have helped pay for significant cost increases in new contracts that started in 2009. Rate increases have also helped finance significant capital investments in transfer stations. The typical single-family monthly bill includes a 32-gallon garbage can, a 96-gallon food and yard waste can, and a 96-gallon recycling cart (Figure 6-3).
Single- and Multi-Family,
48%
Commercial, 30%
Self-haul and Disposal, 10%
Food and Yard Waste, 9%
Tonnage Fees and Other, 3%

Chapter 6 Administration & Financing Plan
6-14 Seattle Solid Waste Plan 2011 Revision
The typical single-family monthly bill did not rise from about $20 per month for more than 10 years. The typical single-family monthly bill is now about $35.
Figure 6-3 SPU Single-Family Monthly Solid Waste Bills 1994 -2011
Residential Rates All Seattle residents are required to subscribe to garbage collection service. However, customers may choose the level of service they need. Residential customers receive every-other-week recycling service at no charge.
Can Customers Most single-family and multiplex customers (“can customers”) have curb or alley service. For an additional fee, can customers can elect back-yard-collection (Table 6-2).
Table 6-2 SPU Monthly Residential Can Rates 2011
Service Level Monthly Rate Micro Can $16.55 Mini Can $20.30 32-Gallon Can (and each additional) $26.40 Extra Bundle/Bag Each $8.10
Dumpster Customers Residential dumpster service is available to apartment buildings with five or more residential units. Rates are set per container pick-up and vary with container size. Table 6-3 shows typical residential dumpster service levels and their monthly rates.
Table 6-3 SPU Monthly Residential Dumpster Rates 2011
Service Level per Container Weekly Pick-Up (Uncompacted)
Monthly Rate
1 Yard $195.34 2 Yards $267.87 3 Yards $340.39
$0.00
$10.00
$20.00
$30.00
$40.0019
94
1996
1998
2000
2002
2004
2006
2008
2010
Typi
cal M
onth
ly B
ill

Chapter 6 Administration & Financing Plan
Final Approved June 2013 6-15
Food and Yard Waste Service
Residential customers also have curbside food and yard waste collection (Table 6-4). Before 2009, the service was voluntary with a flat monthly fee. In 2009, the service became mandatory for can customers, and two additional can sizes were added. Residential dumpster customers may also elect to subscribe to this service.
Table 6-4 SPU Food and Yard Waste Collection Rates 2011
Service Level Monthly Rate Mini Can $4.35 32 Gallon Can $6.50 96 Gallon Can $8.35 Extra Bundle $4.15
Other Services
SPU also provides a special collection service for bulky items such as furniture and refrigerators. The rate is $30 per item, with an additional $8 charge for items containing chlorofluorocarbons (CFCs)—like refrigerators. SPU also offers curbside electronics recycling pickup with a $20 charge for each pickup of up to three items.
Low-Income Assistance
The city offers rate assistance to qualified low-income customers. Qualified low-income customers receive a 50% discount on their solid waste bill. Customers who live in apartment buildings and do not receive a SPU bill directly receive a fixed credit on their Seattle City Light bill.
Commercial Rates
Seattle has set commercial garbage rates since April 2001, when the City of Seattle entered into contracts with private haulers. At that time, Seattle rolled back some commercial rates to their 1994 levels. Unlike residential customers, businesses can choose to sign up for garbage collection service or self-haul their wastes to the recycling and disposal stations. Table 6-5 shows 2011 rates for some typical commercial service levels.
Table 6-5 SPU Commercial Rates 2011
Service Level per Container Weekly Pick-Up (Uncompacted)
Monthly Rate
1 Yard $178.41 2 Yards $277.57 3 Yards $376.73

Chapter 6 Administration & Financing Plan
6-16 Seattle Solid Waste Plan 2011 Revision
Self-Haul Rates Rates at the recycling and disposal stations vary depending on the kind or type of material (Table 6-6). To help move customers through the stations efficiently, vehicles that typically have small loads (sedans, station wagons, and SUVs) pay a flat rate. All other vehicles are weighed on their way in and out of the stations and charged based on the weight of their load.
Table 6-6 SPU Self-Haul Rates 2011
Type of Waste Flat Rate Per-Ton Garbage $30.00 $145.00 Yard Waste $20.00 $110.00 Appliances $30.00 N/A Recyclables No Charge No Charge
Debt Financing SPU finances its capital program primarily with debt from the issuance of revenue bonds. A minimum of the greater of $2.5 million2
Before 2008, the solid waste fund’s capital program was relatively small. SPU issued bonds in 1999 to fund landfill closure and miscellaneous transfer station improvements, but a large portion of the capital program was financed with rate revenues. From 2003 to 2007, SPU drew on a line of credit to fund land purchases and other capital investments. In 2007 and 2011, bonds were issued to begin funding the transfer station rebuilding project. Figure 6-4 shows capital spending and debt financing from 2001 through 2010. Future capital spending and debt financing are discussed in the next section.
or 10% of the capital program is financed with rate revenues or cash.
Figure 6-4 SPU Capital Spending and Debt Financing 2001– 2010
2 In $2003
0
5,000
10,000
15,000
20,000
25,000
2001
2002
2003
2004
2005
2006
2007
2008
2009
2010
Capi
tal P
rogr
am ($
1,00
0s)
Debt Cash

Chapter 6 Administration & Financing Plan
Final Approved June 2013 6-17
6.3.3 PROJECTED MONETARY NEEDS AND FINANCING STRATEGY
This section highlights the costs of operating SPU’s solid waste system and meeting its waste reduction and recycling objectives. First, we discuss the 6-year capital improvement plan and longer-term capital facilities and O&M plan. We then outline likely methods of financing those activities and compare the status quo with SPU’s recommended package of programs and policies.
Capital Improvement Program Plan In 2010, the City Council adopted a Capital Improvement Program (CIP) plan for 2011 to 2016. The CIP is broken down into four major programs as shown in Table 6-7.
Table 6-7 SPU Solid Waste Capital Improvement Plan for 2011 – 2016 (in $1000s)
Program 2011 2012 2013 2014 2015 2016 Total
New Facilities 25,710 35,411 32,368 36,725 21,464 3,975 155,653
Rehabilitation and Heavy Equipment 262 271 58 49 50 51 741
Shared Cost Projects 1,860 2,295 2,098 2,088 2,150 2,318 12,809
Technology 1,415 2,138 4,808 5,512 2,916 2,302 19,091
Total 29,247 40,115 39,332 44,374 26,580 8,646 188,294
New Facilities Program The New Facilities program includes projects that plan, design, and construct new facilities to enhance solid waste operations. In 2011, SPU continues the implementation of its Solid Waste Facilities Master Plan, which features a two-station configuration. Major projects include rebuilds of the south and north transfer stations, as well as the South Park Development project.
South Transfer Station Rebuild Project. This project replaces the existing solid waste transfer station built in 1966. The design and construction of replacement facilities include several items. Among these are demolition of existing structures, excavation and removal of contaminated soil, and backfill with clean soil. Others are clean-up of the bus yard and re-alignment of a subsurface storm drain pipe to the perimeter of the site. The final items are construction of new recycling and reuse facilities, a household hazardous waste facility, and other utility facilities.
North Transfer Station Rebuild. This project rebuilds the existing North Recycling and Disposal Station built in 1967. The design and construction of the new facility includes demolition of the existing transfer station and a warehouse building. New construction includes an administrative building and employee, recycling and other utility facilities. The two transfer station rebuild projects provide essential structures for solid waste management in Seattle and enhance our recycling capability. They also provide citizens with sufficient recycling and solid waste services.

Chapter 6 Administration & Financing Plan
6-18 Seattle Solid Waste Plan 2011 Revision
South Park Development Project. This project complies with a Washington State Department of Ecology Agreed Order to conduct a Remedial Investigation and Feasibility Study of the historic South Park Landfill site and covers investigation and eventual remediation of the landfill site to protect human health and the environment. SPU owns a portion of the site on which the landfill once operated, and was an historic operator of the landfill. Final cost allocation among potentially liable parties will occur at a later stage.
Rehabilitation and Heavy Equipment Program The Rehabilitation and Heavy Equipment program designs and constructs projects to repair and upgrade solid waste facilities.
Shared Cost Projects Program The Shared Cost Projects program includes capital costs that typically benefit multiple lines of business (for example, the Water and the Drainage and Wastewater lines of business). The costs are "shared," or paid for, by more than one of SPU's utility funds.
Technology Program The Technology program makes use of recent technology advances to increase efficiency and productivity. It replaces vital systems not supported past 2011. The program includes a planned upgrade to the Consolidated Customer Service System and new technology solutions for enhanced customer contact management.
Long-Term Capital Facilities Budget In addition to the 6-year CIP, SPU has developed its best estimate of a capital facilities budget through 2030, given what is known and anticipated at this time (Table 6-8). The long-term capital budget is expected to be the same for the status quo and the recommended package of programs.
Table 6-8 SPU Solid Waste Capital Facilities Plan through 2030 (in $1000s)
Business Area 2017-2020 2021-2025 2026-2030
New Facilities 492 5,252 5,825
Rehabilitation and Heavy Equipment 5,749 118
Shared Cost Projects 8,206 11,439 12,942
Technology 11,798 15,476 17,509
Total 26,246 32,285 36,276
Once the north and south transfer station replacement projects are complete, the solid waste CIP is expected to drop to about $5 million annually. This amount includes regular equipment replacement, intermittent station improvements and ongoing shared and technology projects.

Chapter 6 Administration & Financing Plan
Final Approved June 2013 6-19
Projected Capital Financing SPU plans to finance most of the CIP with debt during the period of significant capital spending associated with rebuilding the transfer stations (Figure 6-5). After that time, we expect to finance all of the SPU solid waste CIP with cash.
Figure 6-5 SPU Projected Capital Financing (in $1000s)
O&M Outlook The solid waste fund's 2011 adopted O&M budget by branch and functional area is in Table 6-9. Contracted collection processing, and disposal costs made up about 60% of solid waste system costs. Other significant costs included city and state taxes (11%) and transfer station operations (5%).
Under the status quo, solid waste system O&M expenses3
Projected O&M costs are lower under the recommended package of programs than under the status quo. Variable collection, processing, and disposal costs for each recycled ton are generally lower for recycled tons than for disposed tons. Since the recommended package has more recycled tons than the status quo, variable costs are lower. Also, while SPU recycling program
through 2030 are expected to grow mainly due to inflation. Contract terms include escalators based on inflation indices. SPU labor costs will follow cost of living trends. The proportion of costs in each branch and function is expected to remain about the same.
3 Operations and Maintenance (O&M) not including debt service or taxes
0
5,000
10,000
15,000
20,000
25,000
30,000
35,000
40,000
45,000
50,000
2011
2016
2021
2026
Capi
tal P
rogr
am ($
1,00
0s) Cash Debt

Chapter 6 Administration & Financing Plan
6-20 Seattle Solid Waste Plan 2011 Revision
Table 6-9 SPU Adopted Solid Waste Operations & Maintenance Budget by Branch and by Function 2011
SPU Branch Accounting Organization
Major Cost Centers
Customer Service
Field Operations
Utility Systems Mgmt
Finance & Admin
HR & Service Equity
Director's Office
Project Delivery1
Pre-Capital
Planning & Develop.
General & Admin Credit
General Expense Total
Collect, Process, Disposal Contracts
$93,216,952 $93,216,952
LHWMP2 payment $2,874,072 $2,874,072
Phones and billing $3,684,157 $3,684,157
Recycling & waste reduction programs, inspections
$3,188,747 $3,188,747
Transfer station ops $8,275,51 $8,275,515
Landfill Maintenance $ 86,172 $ 986,172
Solid Waste Planning & Contract Management
2,333,937 $ 2,333,937
Rates, budget, accounting, contracts, IT, fleets, facilities
$3,129,260 $3,129,260
Personnel, safety, service equity
$1,601,295 $1,601,295
Economists, communications, community relations, legislative liaison, dept leadership
$1,740,916 $1,740,916
Non-project general2 $2,036,692 $808,344 $412,423 $463,425 $463,700 $77,025 $4,261,609
Allocated city costs $4,310,328 $4,310,328
Taxes $18,123,440 $18,123,440

Chapter 6 Administration & Financing Plan
Final Approved June 2013 6-21
SPU Branch Accounting Organization
Major Cost Centers
Customer Service
Field Operations
Utility Systems Mgmt
Finance & Admin
HR & Service Equity
Director's Office
Project Delivery1
Pre-Capital
Planning & Develop.
General & Admin Credit
General Expense Total
Debt Service $7,338,581 $7,338,581
G&A Credit $(1,531,563) $(1,531,563)
Solid Waste Tax funded via General Fund
Clean City Programs $3,668,419 $92,273 $3,760,692
Reimbursements = Expenditures
LHWMP3 $ 293,083 $1,640,985 $331,541 $223,498 $ 2,489,107
Total $ 12,871,098 $11,711,016 $3,170,174 $3,129,260 $1,824,793 $1,740,916 $ 463,425 $463,700 $(1,531,563) $125,940,398 $159,783,217
1Capital Project planning moves out of the O&M budget to the CIP budget after projects are approved. 2Solid waste general functions and the solid waste fund share of the department-wide overhead 3 LHWMP = Local Hazardous Waste Management Program

6-22 Seattle Solid Waste Plan 2011 Revision
implementation costs are higher in the recommended package, the increase is more than offset by the savings on the variable contract costs.
Figure 6-6 compares O&M projections for the status quo and recommended package.
Figure 6-6 Projected SPU Solid Waste O&M Spending
Revenue and Rate Projections Rate increases are required under the status quo and recommended scenarios to meet the financial policies discussed in section 6.3.1 (Figure 6-7). Revenues are higher under the status quo than under the recommended scenario. They rise from about $150 million in 2011 to about $260 million by 2030. Costs are lower under the recommended scenario (see O&M Outlook section) than under the status quo, resulting in a lower revenue requirement.
Figure 6-7 Status Quo and Preferred Scenarios
0
50,000
100,000
150,000
200,000
250,00020
11
2013
2015
2017
2019
2021
2023
2025
2027
2029
Ann
ual O
&M
Cos
ts ($
1,0
00s)
Status Quo
Recommended Package
$0.00
$10.00
$20.00
$30.00
$40.00
$50.00
$60.00
0
50,000
100,000
150,000
200,000
250,000
300,000
2011
2015
2020
2025
2030
Mon
thly
Rat
e fo
r 32
Gal
lon
Gar
bage
Can
Reve
nue
Requ
irem
ent
($1,
000s
)
Status Quo Revenue Recommeded Package Revenue
Status Quo Rate Recommeded Package Rate

Final Approved June 2013 6-23
Rates will need to go up more in the recommended package than in the status quo scenario. This difference comes from the impact of waste reduction and recycling on customer subscription levels. As customers decrease their garbage, they need less service and reduce their container size, number of containers, or pick-up frequency. In turn, this reduces the number of service units from which SPU can collect rates. Therefore, the rate per unit rises.
On the other hand, SPU offers many subscription level options. Many customers who reduce their volume of garbage will also decrease their garbage can size. Therefore, those customers’ actual bills will not go up by as much as Figure 6-7 suggests. It shows the increase for the same subscription level (can size) over time.
The garbage rate for the average customer reflects changes in customer can sizes. The average rate for the recommended scenario actually increases more slowly than for the status quo (Figure 6-8). The reason for the slower increase is that customers tend to switch to a smaller can size as they reduce waste and recycle more.
Figure 6-8 Average Rates for Status Quo and Preferred Scenarios*
*Assumptions are based on historical customer demand patterns
$0.00
$5.00
$10.00
$15.00
$20.00
$25.00
$30.00
$35.00
$40.00
$45.00
$50.00
2011
2013
2015
2017
2019
2021
2023
2025
2027
2029
Aver
age
Mon
thly
Rat
e
Status QuoRecommended
6-24 Seattle Solid Waste Plan 2011 Revision
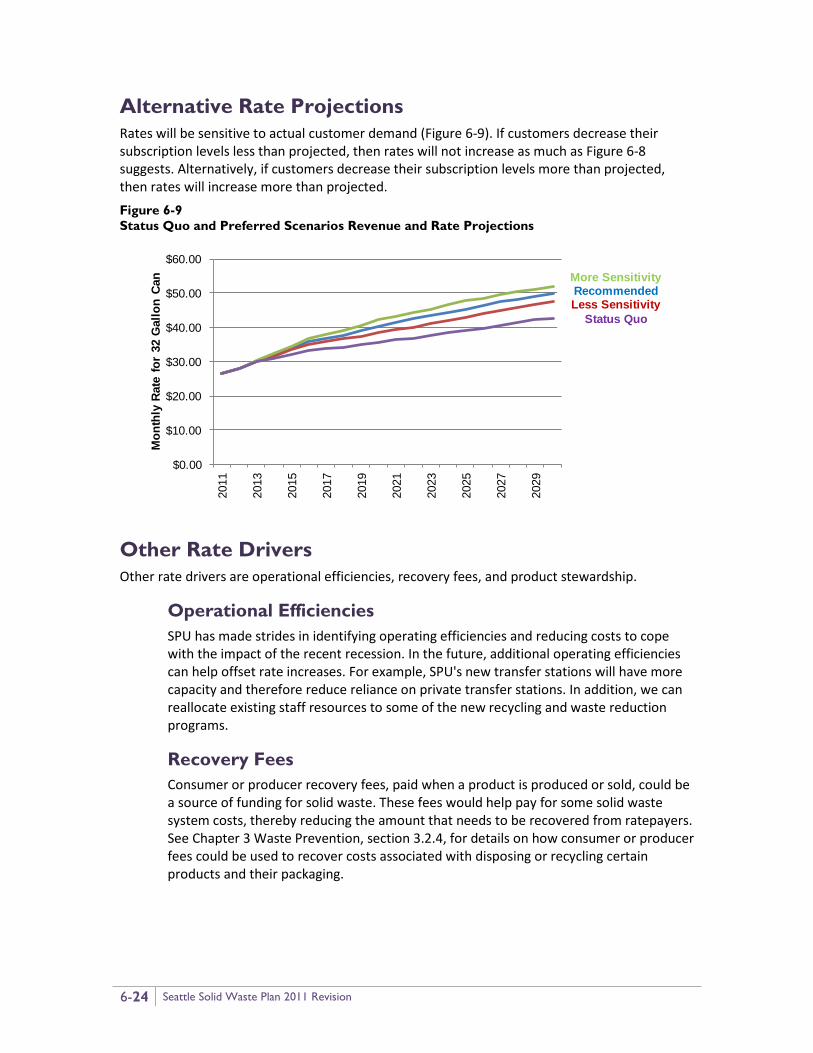
Alternative Rate Projections Rates will be sensitive to actual customer demand (Figure 6-9). If customers decrease their subscription levels less than projected, then rates will not increase as much as Figure 6-8 suggests. Alternatively, if customers decrease their subscription levels more than projected, then rates will increase more than projected.
Figure 6-9 Status Quo and Preferred Scenarios Revenue and Rate Projections
Other Rate Drivers Other rate drivers are operational efficiencies, recovery fees, and product stewardship.
Operational Efficiencies SPU has made strides in identifying operating efficiencies and reducing costs to cope with the impact of the recent recession. In the future, additional operating efficiencies can help offset rate increases. For example, SPU's new transfer stations will have more capacity and therefore reduce reliance on private transfer stations. In addition, we can reallocate existing staff resources to some of the new recycling and waste reduction programs.
Recovery Fees Consumer or producer recovery fees, paid when a product is produced or sold, could be a source of funding for solid waste. These fees would help pay for some solid waste system costs, thereby reducing the amount that needs to be recovered from ratepayers. See Chapter 3 Waste Prevention, section 3.2.4, for details on how consumer or producer fees could be used to recover costs associated with disposing or recycling certain products and their packaging.
$0.00
$10.00
$20.00
$30.00
$40.00
$50.00
$60.00
2011
2013
2015
2017
2019
2021
2023
2025
2027
2029
Mon
thly
Rat
e fo
r 32
Gal
lon
Can More Sensitivity
RecommendedLess Sensitivity
Status Quo

Final Approved June 2013 6-25
Cost Internalization and Other Product Stewardship Initiatives SPU's costs will be lowered and rate increases mitigated by programs that encourage consumers to choose products with fewer environmental effects or that remove materials from the solid waste stream (producer take-back initiatives).
Conclusion Rates will rise whether SPU stays with the status quo or proceeds with this Plan’s recommendations. Under the status quo, rates will rise to cover inflation and any new capital investments.
The recommended programs reduce garbage tons moving through the system. The new programs also have implementation costs. However, cost savings from less garbage more than offset new program costs, thus reducing the overall revenue requirement. The effect on rates is that they need to increase more than under the status quo. Rates will need to rise to make up for revenue losses as customers reduce their service levels (lost subscription units) in response to new programs.