adm542 - performance and tuning - sap system with sybase ase
DESCRIPTION
ADM542 - Performance and Tuning - SAP System with Sybase ASETRANSCRIPT

© SAP AG ADM542 1
ADM542 Performance and Tuning – SAP System with Sybase ASEADM542
Performance and Tuning –SAP System with Sybase ASE
Material number: 50116025

© SAP AG ADM542 2
SAP AG
Course Prerequisites
Required Knowledge:
SAPTEC, ADM100 & ADM540
Recommended Knowledge:
EDB116, EDB358 & EDB553
This course presents tools, offered within SAP system for assessment and optimization of SQL processing in Sybase ASE database.
It is intended to enable any experienced ASE performance expert to perform following tasks with SAP system tools:
Recognize database-related performance issues
Perform SQL analysis
Verify overall database performance and setup

© SAP AG ADM542 3
SAP AG
Target Groups
The course is intended for following groups:
SAP Technology Consultant (carrying in Sybase ASE database optimization and
monitoring for SAP systems)
System Administrator
Database Administrator (in SAP environment)
Duration: 1 day

© SAP AG ADM542 4
Course Goals
This course will prepare you to use tools offered by SAP system to:
Recognize database-related performance issues
Perform SQL analysis
Verify overall database performance and setup

© SAP AG ADM542 5
Agenda
Architecture of SAP system from the database perspective
Assessment of system performance with respect to database performance
Analysis of single-transaction issues
Analysis of overall database performance issues
Exercises

© SAP AG ADM542 6
Architecture of an SAP System
SAP NetWeaver Application Server ABAP
ABAP-Dispatcher
WP WP
SAP GUI
SAP NetWeaver Application Server ABAP
ABAP-Dispatcher
WP WP
SAP GUI
Database of the SAP system
SAP ABAP system consists of one or several instances. Each instance contains several Work Processes (WP)
The Work Processes are independent processes on operating system level. They are communicating with users’ GUI processes and database, and processing data for dialog on-line users.
Each WP open individual client connection to database. The connection usually persists during lifetime of the WP process. Under certain circumstances a WP may terminate its connection and open new one, or open additional connection (also to another database).
Each WP may process requests from different users in a sequence, or perform other data processing (interface processing, internal processing). There are also WPs used for batch processing of larger amount of data, without user interaction and over longer time.

© SAP AG ADM542 7
How to Recognize Database Related Performance Issues
Assessment of system performance is usually based on Total Response Time for on-line users (dialog Total Response Time, Total Response Time in dialog task)
Total Response Time is the time measured between two moments:
When WP receives request from a user’s GUI process
When the WP returns response to the user’s GUI process
Total Response Time in a dialog task should remain below 1 second.
Total Response Time contains time when WP sends queries to database and waits for data
returned from database. This fraction of the Total Response Time is called Database
Response Time.
If the Total Response Time is above the 1-second threshold, and the Database Response
Time comprises significant fraction of the total response time, the database performance
tuning may be beneficial.
If the average Total Response Time, calculated for all users and dialog steps over certain
period of time is long, then the overall system performance issues may be suspected.
The threshold of 1 second for dialog response time has been widely accepted as KPI for system performance. It is confortable for humans working on-line. Dialog applications are usually developed with this threshold in focus.
For certain systems, different task types should be used for assessment. Sometimes major applications are accessed by HTTP services. Certain systems may be used for supplying data through interfaces, for dialog applications (RFC tasks). It should e clarified with users and administrators, which tasks may be used for assessment.
If average response time is good, then probably there is no general performance issues, which affect all system processes. There may be, however, problem with certain transactions, or at some shorter periods of time. Those particular issues should be analyzed.

© SAP AG ADM542 8
Assessment of System Performance: Momentary State of a System (1)
Transaction SM50 shows actual state of work processes of a single instance. Also processes, which are not occupied.
Display of transaction SM50 differs for different SAP releases. However it always shows list of processes, and their current state.

© SAP AG ADM542 9
Assessment of System Performance: Momentary State of a System (2)
Transaction SM66 status of work processes for all instances in the system. Standard selection shows only busy work processes
The system above is busy with processing of some dialog tasks.
However no one of those tasks has yet taken more than 1 second since start of processing in its current work process. If refreshing of display shows always a picture like this, there are probably no severe performance issues.
Seconds elapsed since start of processing in the WP
© SAP AG ADM542 10
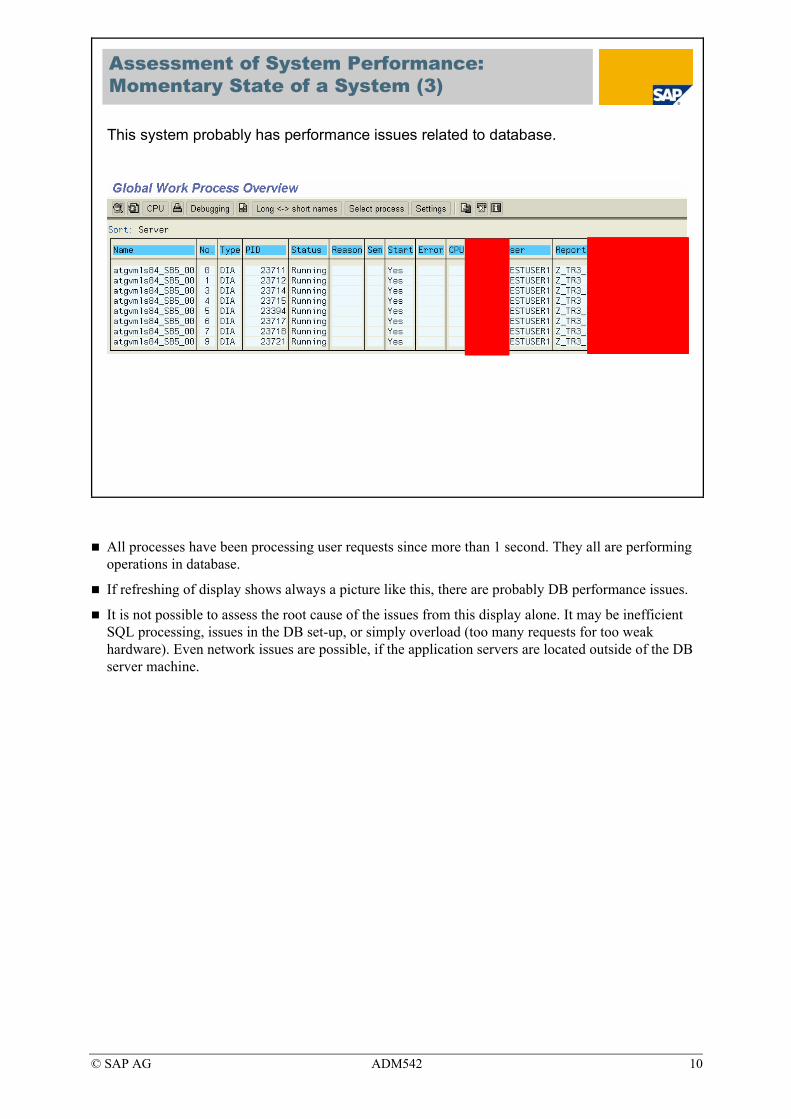
Assessment of System Performance: Momentary State of a System (3)
This system probably has performance issues related to database.
All processes have been processing user requests since more than 1 second. They all are performing operations in database.
If refreshing of display shows always a picture like this, there are probably DB performance issues.
It is not possible to assess the root cause of the issues from this display alone. It may be inefficient SQL processing, issues in the DB set-up, or simply overload (too many requests for too weak hardware). Even network issues are possible, if the application servers are located outside of the DB server machine.

© SAP AG ADM542 11
Assessment of System Performance: Performance Statistics (1)
SAP systems are equipped with powerful collector of performance statistics
Transaction ST03 displays collected data
The following SAP Notes assist in setup of the performance collector: SAP Note 12103 [SAP BASIS releases < 640]
SAP Note 970449 SAP_BASIS 640
SAP Note 966631 SAP_BASIS 710
SAP Note 966309 SAP_BASIS 700
Further information on service relevant settings can also be found in SAP Note 144864

© SAP AG ADM542 12
Assessment of System Performance: Performance Statistics (2)
Expert mode offers most analysis options
Results can be shows for each SAP application server or for the whole system
Aggregated statistics is available for 24-hours (day), week and month. Number retained periods of each kind can be set in ST03

© SAP AG ADM542 13
Assessment of System Performance: Performance Statistics (3)
Double-click in desired period, and ‘Workload Overview’, shows response time statistics for different task types. Definitions of response time components can be found in SAP Library:http://help.sap.com/saphelp_nw04/Helpdata/EN/21/2c8f38c7215428e10000009b38f8cf/content.htm
Average response time is shown with its components. The database response time can be assessed for the period, according to already mentioned rules.
The picture shows period with good database response time, on average.
This does not exclude particular transactions, of shorter periods of bad database performance.

© SAP AG ADM542 14
Assessment of System Performance: Performance Statistics (4)
Analysis view ‘Time Profile’ allows for assessment of time-dependencies.
Task type can be selected.
Granularity of this profile depends on collector setup. Usually, it is one hour, between 06 AM and midnight, and one slot from midnight till 06 AM.
The screenshot presents overall bad DB response times.
Period from 13-14 is particularly bad, however. Despite, the number of dialog steps is significantly lower than during e.g. 12-13! This suggests that either dialog transactions, executed during this hour, were especially slow in the database, or there was other general database issue during this time.

© SAP AG ADM542 15
Assessment of System Performance: Performance Statistics (5)
Detailed Analysis menu offers possibility of ad-hoc statistics collection for exactly selected period and server (or totally for the system).
Granularity of the time profile during this period, can be determined more exactly. Very many time-profile periods require longer collection time.
Longer analysis periods on heavily loaded systems may end-up in time-out.
Statistical records, which are basis for this ad-hoc analysis, are deleted after some time. Usually, they are retained 24 hours.
The ‘Analysis Views’ created by this analysis are very similar to the ones generated daily by the standard collector. If any view is absent, this usualy means, that there was no data for it, during the analyzed period.
© SAP AG ADM542 16
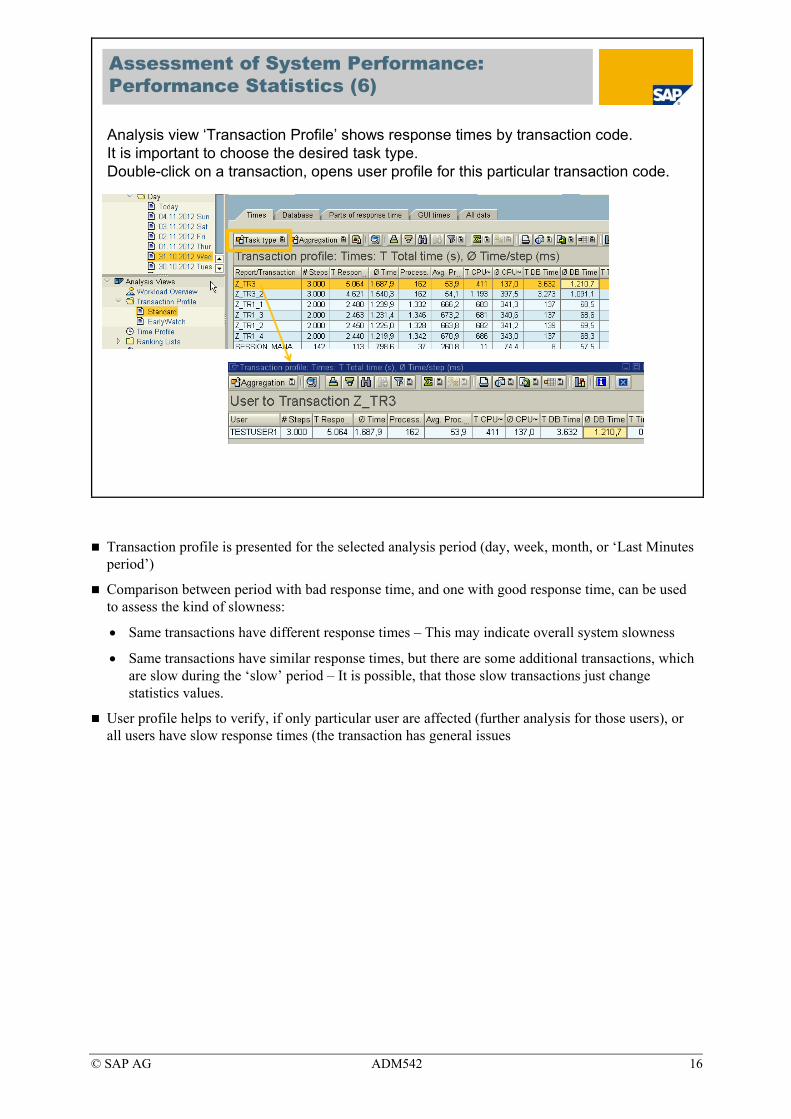
Assessment of System Performance: Performance Statistics (6)
Analysis view ‘Transaction Profile’ shows response times by transaction code.It is important to choose the desired task type.Double-click on a transaction, opens user profile for this particular transaction code.
Transaction profile is presented for the selected analysis period (day, week, month, or ‘Last Minutes period’)
Comparison between period with bad response time, and one with good response time, can be used to assess the kind of slowness:
Same transactions have different response times – This may indicate overall system slowness
Same transactions have similar response times, but there are some additional transactions, which are slow during the ‘slow’ period – It is possible, that those slow transactions just change statistics values.
User profile helps to verify, if only particular user are affected (further analysis for those users), or all users have slow response times (the transaction has general issues
© SAP AG ADM542 17
Assessment of System Performance
The presented assessment tools should allow for assessment, which type of performance problems need to be treated: Overall system issues, or slowness of particular transactions.
Database performance issues may be involved in both cases. Especially, overall database slowness affects the whole SAP system, because there is hardly any transaction without involvement of database selections.
SAP system offers tools for analysis of both types of performance issues, also with respect to the database performance.

© SAP AG ADM542 18
Analysis of Single-Transaction Issues: Statistical Records (1)
SAP transactions store information about their execution in so-called statistical records. They are sometimes called STAD-records, because transaction STAD is used to display content of those records.The transaction offers several selection possibilities of the records. Most relevant for DB performance analysis are:
Interval to analyze
Client, User, Transaction, Program, Task
Response time: Total, DB, CPUNumber of requested bytes, number of DB changes
Application Server selection
Start with this button, or press Enter
These are the records, which are used for the ‘Last Minute’ analysis in ST03.
Attention: Analysis period is defined by start and length, here, and not by start and stop.
Too long periods in heavily loaded systems can lead to timeouts.
This transaction starts RFC tasks (remote tasks vie interface) on all selected application servers.
© SAP AG ADM542 19
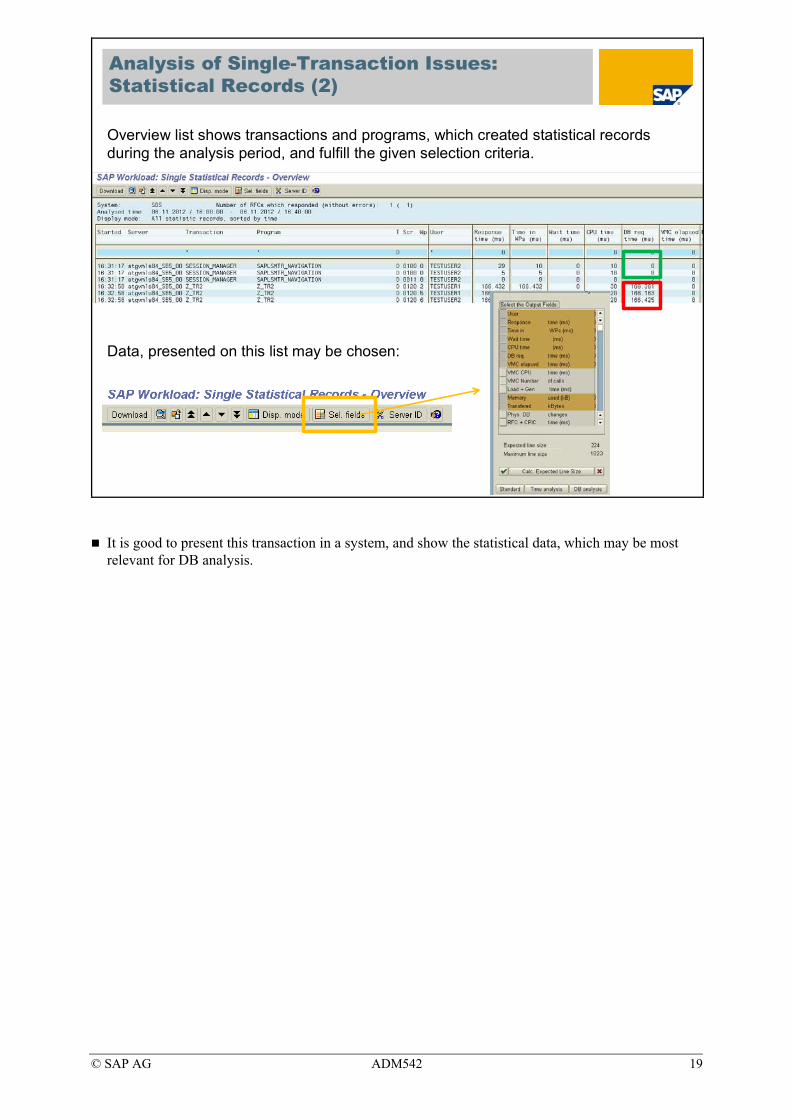
Analysis of Single-Transaction Issues: Statistical Records (2)
Overview list shows transactions and programs, which created statistical records during the analysis period, and fulfill the given selection criteria.
Data, presented on this list may be chosen:
It is good to present this transaction in a system, and show the statistical data, which may be most relevant for DB analysis.
© SAP AG ADM542 20
Analysis of Single-Transaction Issues: Statistical Records (3)
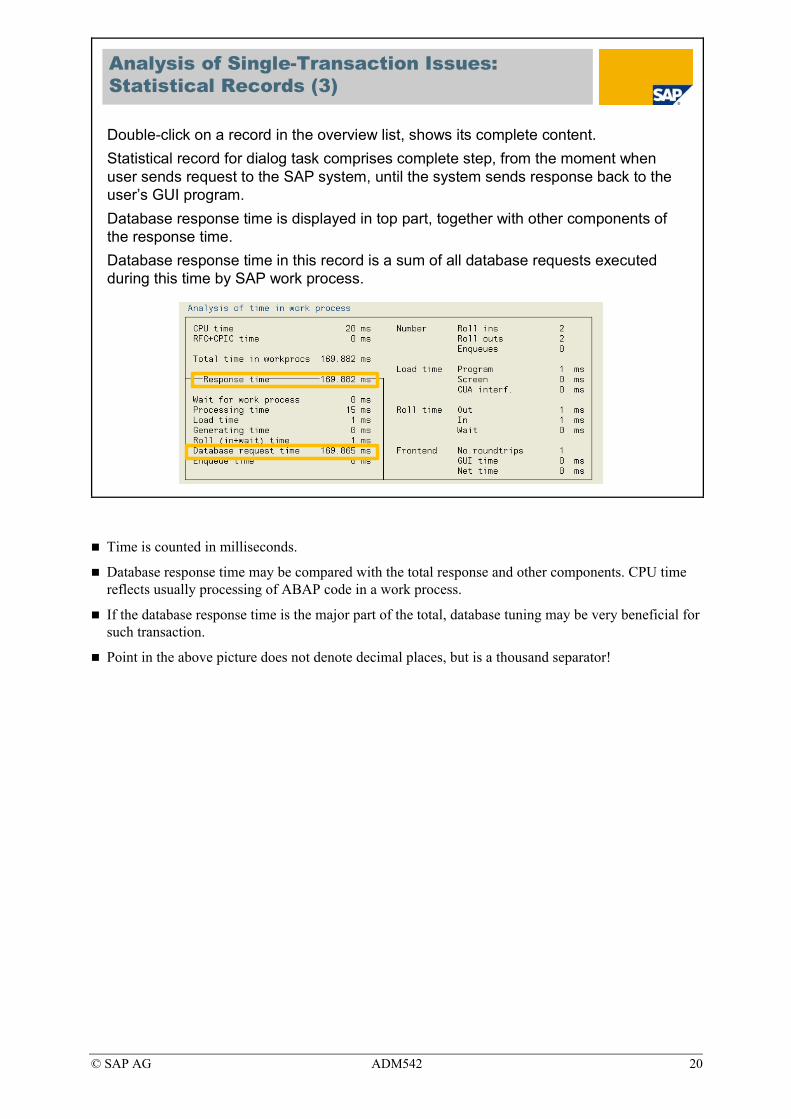
Double-click on a record in the overview list, shows its complete content.
Statistical record for dialog task comprises complete step, from the moment when user sends request to the SAP system, until the system sends response back to the user’s GUI program.
Database response time is displayed in top part, together with other components of the response time.
Database response time in this record is a sum of all database requests executed during this time by SAP work process.
Time is counted in milliseconds.
Database response time may be compared with the total response and other components. CPU time reflects usually processing of ABAP code in a work process.
If the database response time is the major part of the total, database tuning may be very beneficial for such transaction.
Point in the above picture does not denote decimal places, but is a thousand separator!
© SAP AG ADM542 21
Analysis of Single-Transaction Issues: Statistical Records (4)
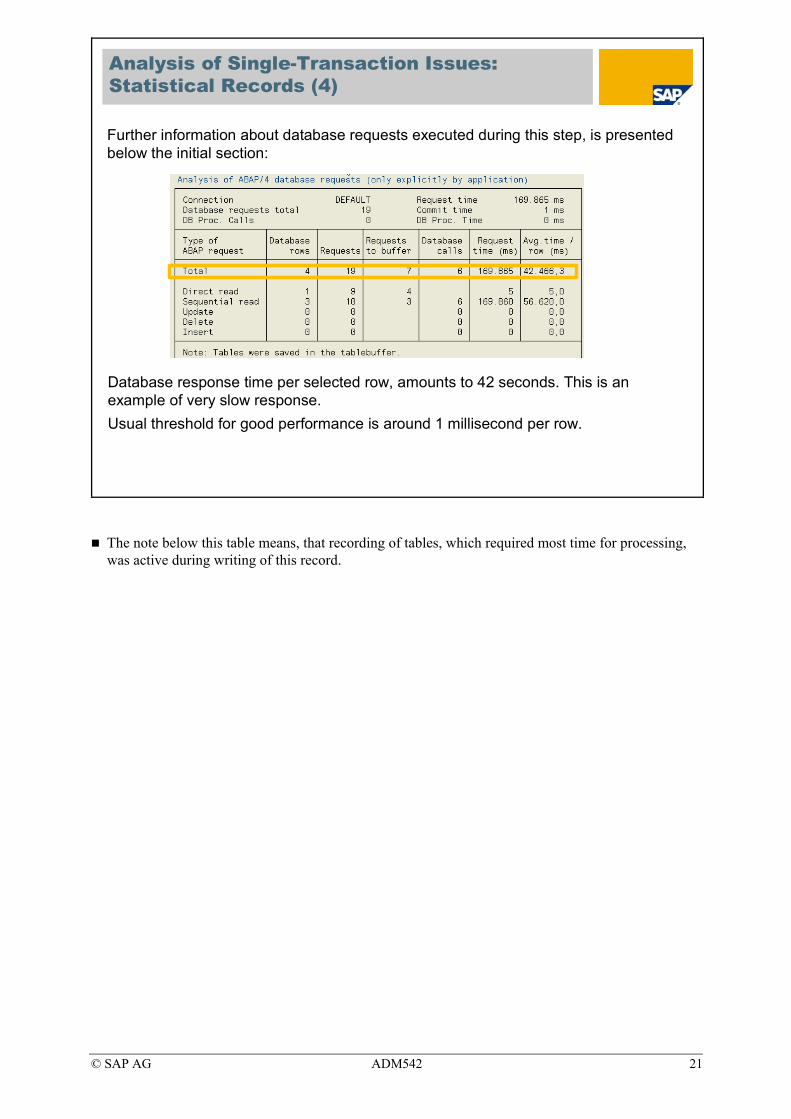
Further information about database requests executed during this step, is presented below the initial section:
Database response time per selected row, amounts to 42 seconds. This is an example of very slow response.
Usual threshold for good performance is around 1 millisecond per row.
The note below this table means, that recording of tables, which required most time for processing, was active during writing of this record.

© SAP AG ADM542 22
Analysis of Single-Transaction Issues: Statistical Records (5)
In order to obtain information, which tables needed most time for processing, recording of their names can be activated:Transaction ST03 Collector and Performance DB Statistics Records and File Online Parameters Dialog Step Statistics.
stat/tabrec is the parameter which activates this recording. Value of this parameter determines how many table names will be stored.The parameter must be set for each server, and activated with button below. It can be activated during normal operations, but this recording of tables may affect performance of system (in order of 8% of average response time)!
The parameter stat/tabrec is used only for necessary analysis.
It should not be set to high values. Usually 4 – 8 is enough.
Recording of tables in statistical records should not be used during longer time in production operations.

© SAP AG ADM542 23
Analysis of Single-Transaction Issues: Statistical Records (6)
If recording of tables have been activated, the relevant list can be found in the record display in transaction STAD.
Table names can further be used to perform precise trace.
Most time-consuming operations were performed with table ZTAB2. Zeros in all columns in this row may be caused by selection, which delivers no result after long processing time.
Two pictures show two very opposite cases:
Upper one shows selection delivering no result after 169 seconds.
Lower one presents selection delivering 234434 data sets within 1,9 seconds. This means 8 microseconds per row. This probably cannot be improved further with database means. The response time is caused by excessively large amount of data requested by the application program.

© SAP AG ADM542 24
Analysis of Single-Transaction Issues:SQL Trace (1)
SQL trace means recording of all SQL statements executed during processing.
The recording is realized by database interface of the SAP work processes, not by database. Trace functionality is independent, to large extent, on database.
Transaction ST05 is the entry to the SQL trace. Its screen is different for older SAP releases, but functionality is the same.
Transaction ST05 must be executed on the same application server, where the analyzed process will run
The trace must be activated before execution of statements, which should be recorded.
SQL trace should be marked. Button ‘Activate Trace with Filter’ opens pop-up with selections for the trace.
In case change of application server is necessary, transaction SM51 can be used.

© SAP AG ADM542 25
Analysis of Single-Transaction Issues:SQL Trace (2)
Trace can be activated for: Selected user (all activities on this application
server will be recorded) and transaction code (all execution of this transaction will be recorded)
or
Work process number (ref. e.g. transaction SM50) and program name.
Specific tables can be included or excluded from the trace.
It is good to use the selection criteria, whenever possible. Trace has limited capacity, and can be overwritten. Also analysis of large amount of trace entries may not be feasible due to timeout.
Selecting trace for own user without additional criteria will cause recording of all activities, also ST05 itself.

© SAP AG ADM542 26
Analysis of Single-Transaction Issues:SQL Trace (3)
In order to display collected trace, it should be deactivated first.
It is also possible to display currently collected trace records, without deactivation it: Menue ‘Performance Trace’ ‘Display Trace Without First Deactivating’
In this case, only the SQL commands, which have already finished, are displayed.
Current status of the trace is displayed in the lower part of ST05 entry screen.
It is not possible to activate two parallel traces with different selection criteria.

© SAP AG ADM542 27
Analysis of Single-Transaction Issues:SQL Trace (4)
Selection criteria, for the trace records to be displayed, can be set on the subsequent screen.
One of most popular criteria is the time of analysis.
Older traces may be displayed, as long as they are not overwritten.
Obviously, ‘SQL Trace’ needs to be selected for DB analysis.
Number of trace records on this screen causes system to generate pop-up, when more records can still be collected. The pop-up allows for interrupting the analysis, and displaing only the selected number of records.

© SAP AG ADM542 28
Analysis of Single-Transaction Issues:SQL Trace (5)
Standard display of SQL trace contains time, and duration of execution, program executing the statement, database object accessed (table, view, …), interface cursor data, number of records transferred, return code, connection name and abbreviated SQL command.

© SAP AG ADM542 29
Analysis of Single-Transaction Issues:SQL Trace (6)
After marking a statement, useful information may be displayed: SQL statement, as transferred to database
Information from SAP Data Dictionary about the accesses object
Explain of the statement
ABAP code, where the statement originates from
Call stack of the SQL command (subsequent nested functions and procedures)
The SQL statement, with parameter values, instead of placeholders
It is necessary to mark proper line for the entire database to be available. Especially, OPEN, REOPEN, or (RE) EXEC statements are necessary to obtain parameter values.
The non-marked button can be used to edit an arbitrary SQL statement, and explain it.
Functions of the buttons should be presented in a system.

© SAP AG ADM542 30
Analysis of Single-Transaction Issues:SQL Trace (7)
Depending on selection criteria, SQL trace may contain records from different transactions, or users. Additional record fields may be used to distinguish them.
Button ‘Choose Layout’ allows to select one of available layouts with more information, or to change the current layout, including additional columns.
Demonstration of layouts and columns in the system is desired, if time allows.

© SAP AG ADM542 31
Analysis of Single-Transaction Issues:SQL Trace (8)
Button ‘Explain’ opens a separate browser window, which contains graphical presentation of cached access plan.
Click on a plan node, displays details, as delivered by the database.
Button ‘Detailed Graph’ (hidden on the picture below) switches additional details for each node.
SQL explain requires working HTTP connection. Sometimes, a separate logon in browser or multiple attempts to explain are necessary.
Identification of nodes, which is included in the details window, is the same as delivered by the Sybase ASE tools.

© SAP AG ADM542 32
Analysis of Single-Transaction Issues:SQL Trace (9)
Identification of critical SQL statements in a transaction may be difficult, if many statements are recorded.
Aggregation by SQL statement ma be helpful (Menu ‘Trace List’ ’Summarize by SQL Statement’
The resulting list allows to identify the statements which comprise most of response time, and those which are good candidates for tuning.
Total sum of execution time amounts to 3181 seconds, whereas the first statement takes 3152 seconds. Additionally, this selection does not deliver any records after this long time.
78 milliseconds per delivered record may indicate potential for tuning. However this SQL statement does not influence the total response significantly.

© SAP AG ADM542 33
Analysis of Single-Transaction Issues:SQL Trace (10)
Transaction ST12 offers very convenient way to perform SQL trace.It allows to start trace on several servers simultaneously. Different selection possibilities are offered for ‘User’, ‘Tasks & HTTP’, ‘Workprocess’.‘Tasks & HTTP’ allows tracing of several processing threads.
‘Current mode’ allows for subsequent execution of the analyzed transaction, and then collecting of traces.
Selecting of ABAP trace is not obligatory for SQL analysis. It allows however, for assessment whether the SQL processing in database is the major contributor to response time.
Live demonstration of this trace is desired.
© SAP AG ADM542 34
Analysis of Single-Transaction Issues:SQL Trace (11)
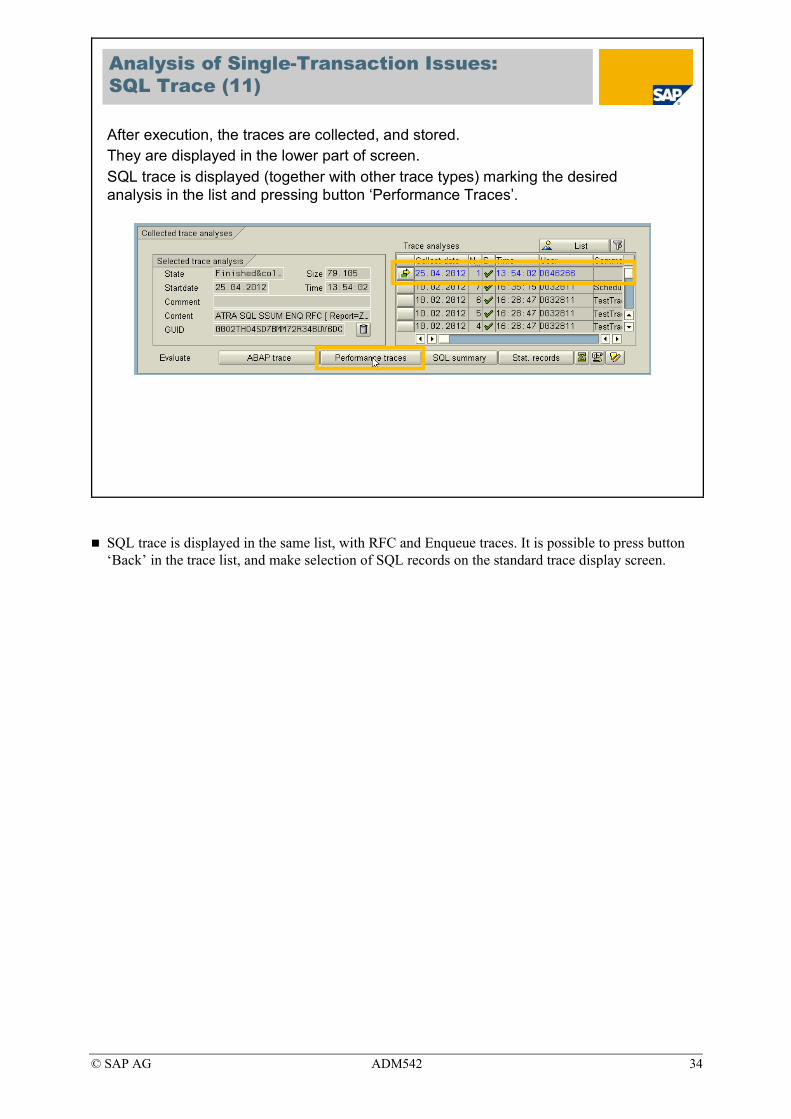
After execution, the traces are collected, and stored.They are displayed in the lower part of screen. SQL trace is displayed (together with other trace types) marking the desired analysis in the list and pressing button ‘Performance Traces’.
SQL trace is displayed in the same list, with RFC and Enqueue traces. It is possible to press button ‘Back’ in the trace list, and make selection of SQL records on the standard trace display screen.

© SAP AG ADM542 35
Analysis of Single-Transaction Issues:SAP Data Dictionary (1)
Information about database tables and views may be retrieved from SAP Data Dictionary, using transaction SE12.
Transaction SE12 offers display of objects.
Transaction SE11 allows for changes, e.g. definition of additional indexes. The changes must undergo the standard SAP procedure of software change management, as applied at the customer.
© SAP AG ADM542 36
Analysis of Single-Transaction Issues:SAP Data Dictionary (2)
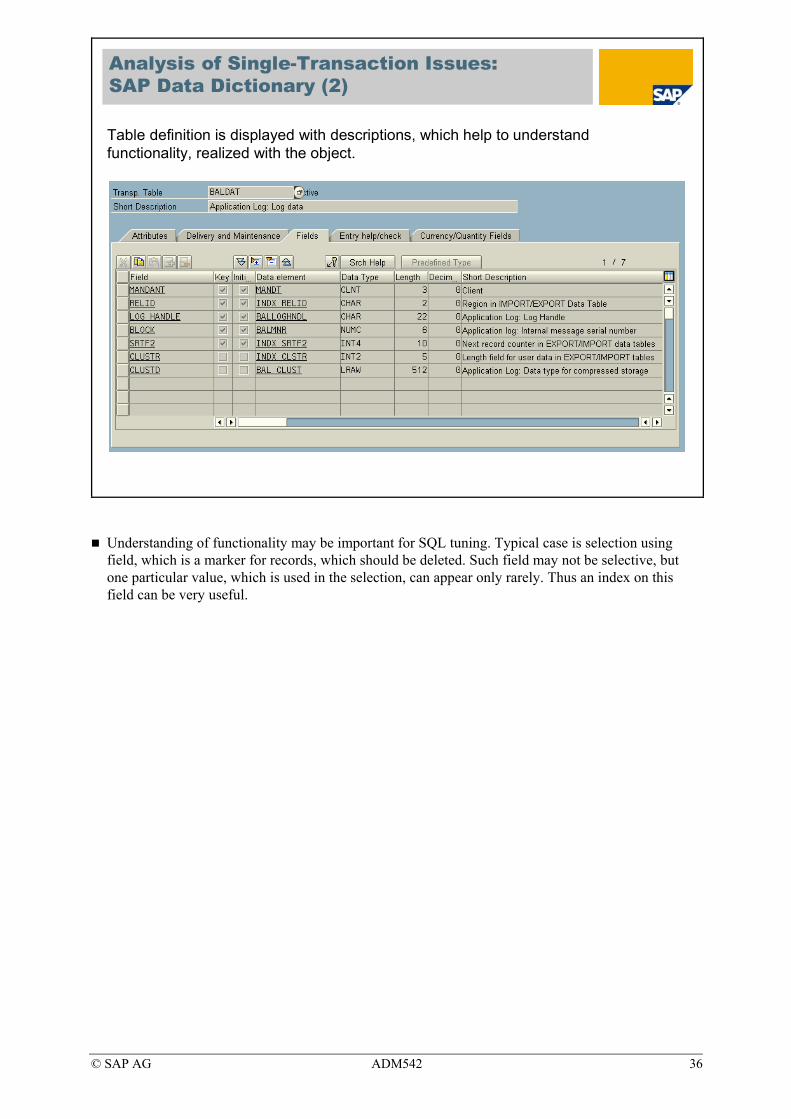
Table definition is displayed with descriptions, which help to understand functionality, realized with the object.
Understanding of functionality may be important for SQL tuning. Typical case is selection using field, which is a marker for records, which should be deleted. Such field may not be selective, but one particular value, which is used in the selection, can appear only rarely. Thus an index on this field can be very useful.

© SAP AG ADM542 37
Analysis of Single-Transaction Issues:SAP Data Dictionary (3)
SAP system does not store table relations in database.Instead, SAP Data Dictionary contains ‘Check tables’, if foreign key relations are defined for a table.
Analysis of foreign keys may help to find sources of information, which can be queried more efficiently.

© SAP AG ADM542 38
Analysis of Single-Transaction Issues:DB05: Data Distribution in a Table (1)
Performance analysis of SQL statements often requires information about selectivity of particular table fields. Transaction DB05 can be used to obtain this information.
It can be used for analysis primary key, or specified fields.
The analysis may be very time-consuming, so it is good to send it in background to avoid timeout.
Attention: For large tables, it may generate significant load on database

© SAP AG ADM542 39
Analysis of Single-Transaction Issues:DB05: Data Distribution in a Table (2)
Output of the transaction gives general information about the table, and about data distribution of the selected fields.
In the case below, field P11 has 500 different values in the table. Each of 276 values is present in less than 11 records. There are 224 values, which are present in groups containing between 11 and 100 records.
The fields P11 and STRS1, together form a key, which has 5075 different values. Each combined key value is present in less than 11 table records.
Transaction DB05 gives good assessment of potential selectivity of field combination. It cannot assess selectivity of a particular value combination of the fields.
© SAP AG ADM542 40
Analysis of Single-Transaction Issues
The analysis tools should allow for identification and efficient SQL tuning of a transaction of a report.
The tools are also useful for cases of overall system performance issues, in case the issues are caused by overload by particular transaction or job.
Details of tuning of SQL statements are covered by dedicated trainings for Sybase ASE.

© SAP AG ADM542 41
Overall System Performance Issues
SAP system database is a single critical resource for the whole system. Thus issues in area of database may affect performance of the whole system.
Overload is very frequent reason of overall system performance issues.
Another popular problem is created by slow IO operations on database storage volumes.
Looking from SAP system perspective, it is difficult to properly assess causes of overall database slowness. It is necessary to access the database in such cases.
SAP systems contain set of tools for such assessment. They are collected in transaction DBACOCKPIT.
© SAP AG ADM542 42
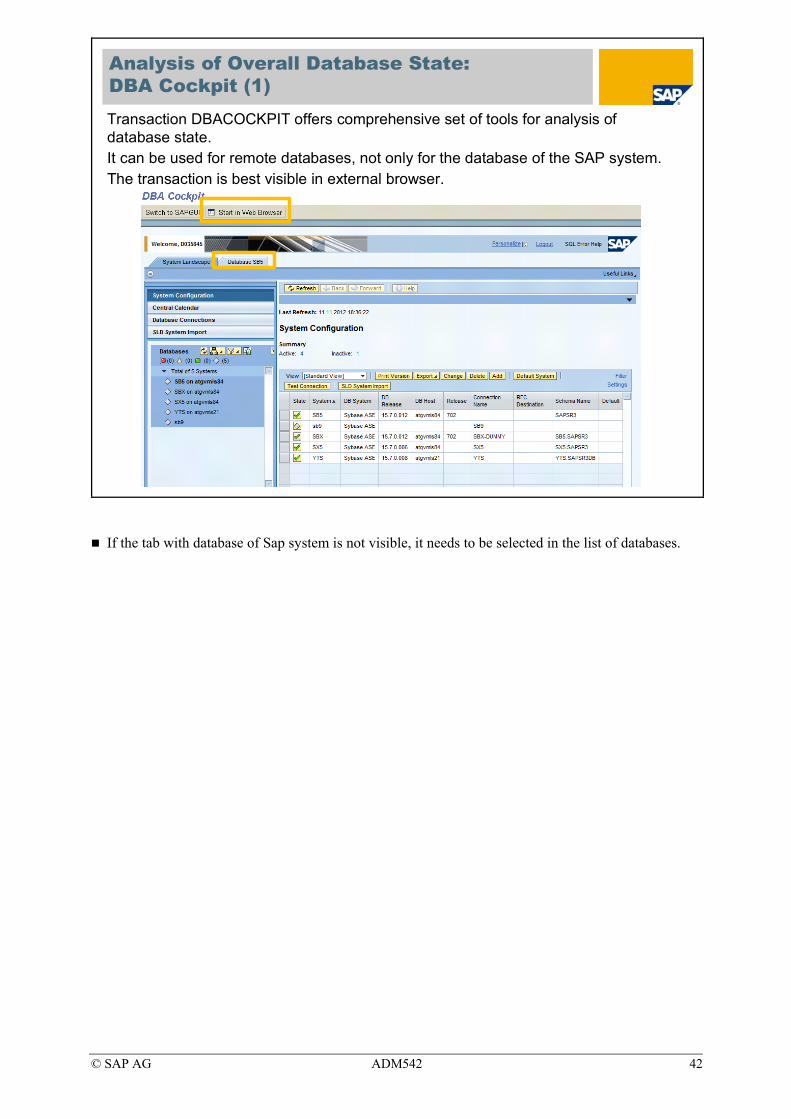
Analysis of Overall Database State:DBA Cockpit (1)Transaction DBACOCKPIT offers comprehensive set of tools for analysis of database state.It can be used for remote databases, not only for the database of the SAP system.The transaction is best visible in external browser.
If the tab with database of Sap system is not visible, it needs to be selected in the list of databases.
© SAP AG ADM542 43
Analysis of Overall Database State:DBA Cockpit (2)
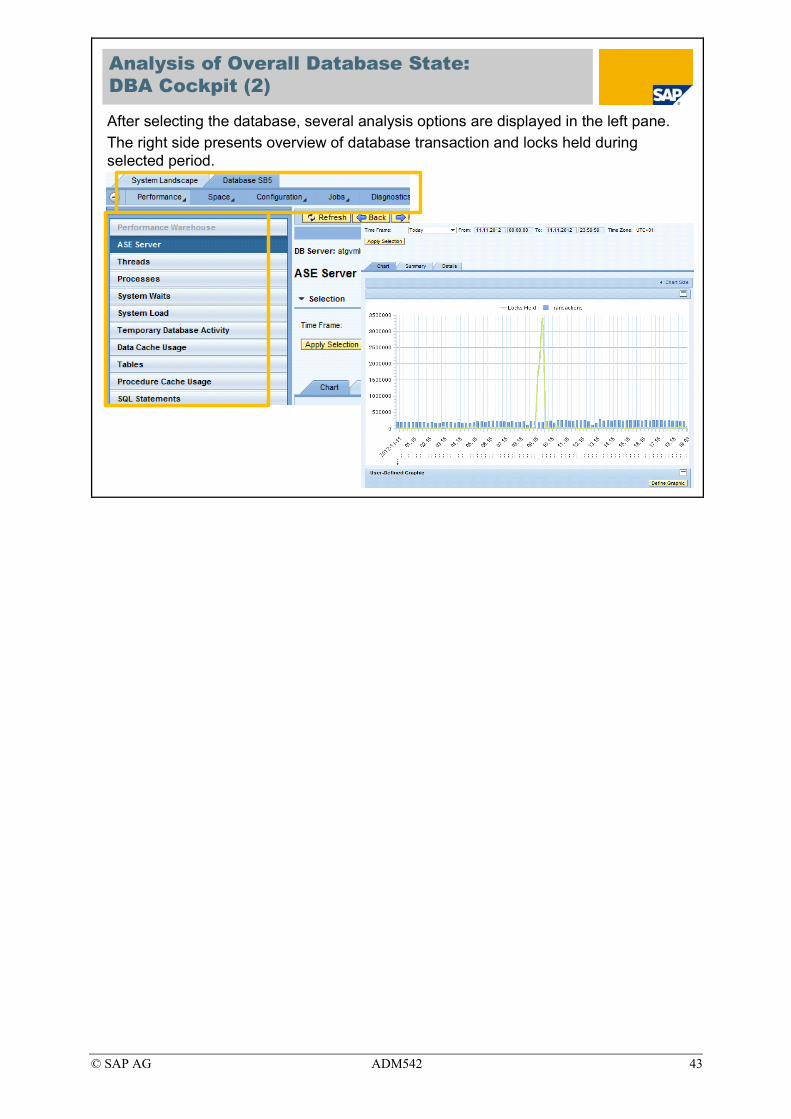
After selecting the database, several analysis options are displayed in the left pane.
The right side presents overview of database transaction and locks held during selected period.

© SAP AG ADM542 44
Analysis of Overall Database State:DBA Cockpit – SQL Cache
Analysis of SQL cache allows for identification of statements causing the highest load.
Several selections of statements are possible.Very useful for analysis of overall load are: Total Logical I/O, Total elapsed time, Total CPU time
Many logical IO operations means that the statement probably uses a lot of data cache space, this pushing out other data, and causing less effective data caching.
High total elapsed time is an aggregated indicator, pointing that the statement represents high load on database. Inefficient processing may be the reason for high total elapsed time, however it is possible, that the statement is simply frequently executed, or requests a lot of data. Both such cases can be hardly addressed by DB technical means. Still they need to be addressed in some way, if the statements are the cause of overall system slowness. In the ultimate case, if the statements cannot be avoided, nor made more efficient, the database hardware capacities (memory cache, CPU power, IO throughput) must be adjusted.

© SAP AG ADM542 45
Analysis of Overall Database State:DBA Cockpit (1)
Button ‘Settings’ allows for selection of displayed columnsStatements performing excessively lot of logical I/O may cause overall database slowness.If they also have high average logical I/O, they may be good candidates for SQL tuning.
Low average logical IO indicates, that a single statement reads only limited amount of data. The total number is made by frequent executions.
High average and high total logical IO may be caused by large amount of data requested by application. In this case the only way is to improve or avoid this application. It may be also caused by inefficient processing in database. E.g. lack of proper index may cause whole table to scan at each execution.
© SAP AG ADM542 46
Analysis of Overall Database State:DBA Cockpit (2)
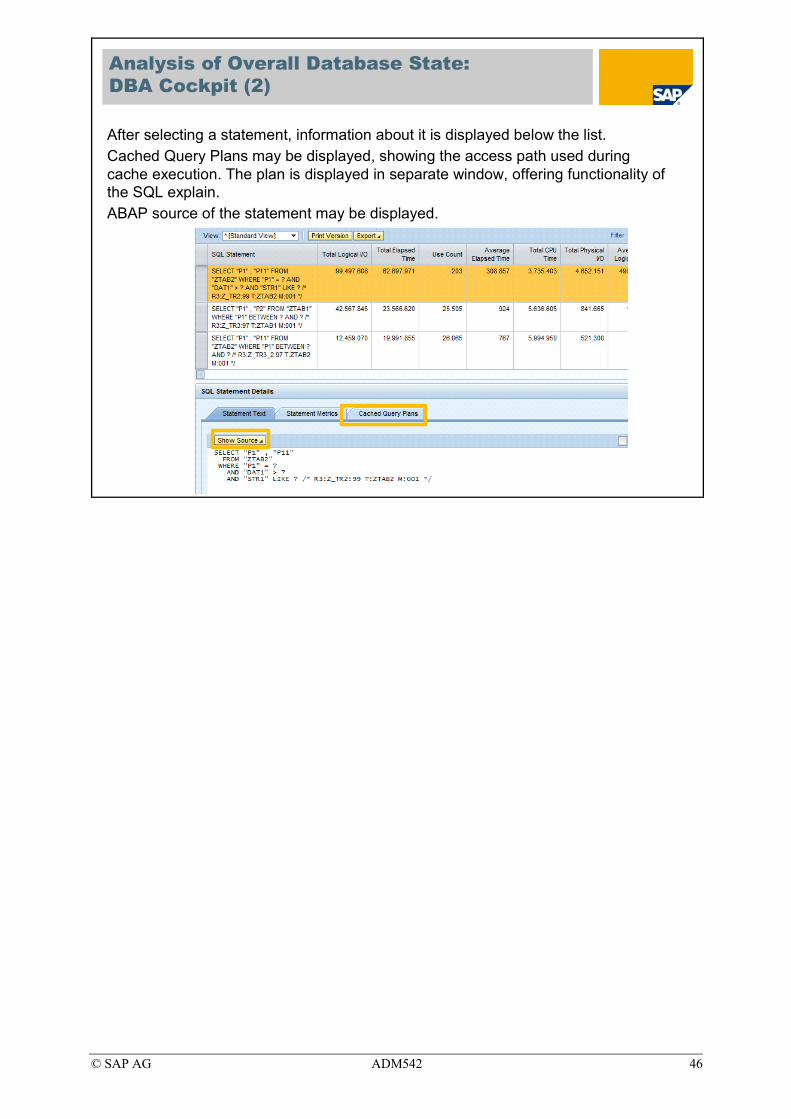
After selecting a statement, information about it is displayed below the list.Cached Query Plans may be displayed, showing the access path used during cache execution. The plan is displayed in separate window, offering functionality of the SQL explain.ABAP source of the statement may be displayed.
© SAP AG ADM542 47
Analysis of Overall Database StateDBA Cockpit (3)
DBA Cockpit allows for assessment, whether overall database slowness may be caused by particular SQL statements, affecting database performance.
In case of identification of such statements causing overload, their tuning proceeds in same way, as in case of single transaction problems.
DBA Cockpit offers also tools for analysis of other reasons of database slowness, like system wait events, thread and processes. Understanding of those analysis tools require ASE knowledge, and is covered in the relevant Sybase ASE courses.
© SAP AG ADM542 48
Exercises
1. Perform assessment of database performance in the system. Are there any general issues? Are there any particularly slow transactions? Do they affect the overall system performance? Which SQL statements may require tuning?
Current state
Between 9:00 and 11:00
Between 11:00 and 13:00
2. Analyze statements in SQL cache of database. May any of the statements cause overload?
3. Can any of statements identified in point 1. and 2. be improved by database technical means (additional indexes, hints, …)?