adjoint sensitivity study on idealized explosive cyclogenesis
TRANSCRIPT
NO.4 CHU Kekuan and ZHANG Yi 547
Adjoint Sensitivity Study on Idealized Explosive Cyclogenesis
CHU Kekuan (�����
) and ZHANG Yi∗ ( ��� )
Key Laboratory of Mesoscale Severe Weather/Ministry of Education, and School of Atmospheric Sciences,
Nanjing University, Nanjing 210093
(Received December 28, 2015; in final form April 28, 2016)
ABSTRACT
The adjoint sensitivity related to explosive cyclogenesis in a conditionally unstable atmosphere is inves-tigated in this study. The PSU/NCAR limited-area, nonhydrostatic primitive equation numerical modelMM5 and its adjoint system are employed for numerical simulation and adjoint computation, respectively.To ensure the explosive development of a baroclinic wave, the forecast model is initialized with an idealizedcondition including an idealized two-dimensional baroclinic jet with a balanced three-dimensional moderate-amplitude disturbance, derived from a potential vorticity inversion technique. Firstly, the validity periodof the tangent linear model for this idealized baroclinic wave case is discussed, considering different initialmoisture distributions and a dry condition. Secondly, the 48-h forecast surface pressure center and thevertical component of the relative vorticity of the cyclone are selected as the response functions for adjointcomputation in a dry and moist environment, respectively. The preliminary results show that the validity ofthe tangent linear assumption for this idealized baroclinic wave case can extend to 48 h with intense moistconvection, and the validity period can last even longer in the dry adjoint integration. Adjoint sensitivityanalysis indicates that the rapid development of the idealized baroclinic wave is sensitive to the initial windand temperature perturbations around the steering level in the upstream. Moreover, the moist adjoint sen-sitivity can capture a secondary high sensitivity center in the upper troposphere, which cannot be depictedin the dry adjoint run.
Key words: baroclinic wave, explosive midlatitude cyclone, adjoint sensitivity, potential vorticity inversion
Citation: Chu Kekuan and Zhang Yi, 2016: Adjoint sensitivity study on idealized explosive cyclogenesis.
J. Meteor. Res., 30(4), 547–558, doi: 10.1007/s13351-016-5261-5.
1. Introduction
Explosive midlatitude cyclones, also called
“bombs”, are rapidly developing midlatitude cyclones
whose minimum surface pressure falls at least 1 hPa
h−1 for 24 h on average (Sanders and Gyakum, 1980).
The development of a midlatitude cyclone is closely
related to frontogenesis, and often causes heavy rain-
fall or snowfall. However, the forecasting of explosive
cyclogenesis and the associated heavy rainfall/snowfall
still has many challenges, due to the misrepresentation
of diabatic processes in extratropical cyclones (Rod-
well et al., 2013), and the nonlinear rapid develop-
ment of initial errors caused mainly by moist insta-
bility (Zhang et al., 2002; Tan et al., 2004; Zhu and
Thorpe, 2006). Therefore, it is worthwhile studying
the sensitivity of explosive cyclogenesis to the initial
perturbations with a moist process included via the
adjoint method.
The adjoint method has been widely used in me-
teorology (e.g., Le Dimet and Talagrand, 1986), and
sensitivity analysis is one of its basic applications. It is
an efficient tool for studying the sensitivity of various
aspects of forecasting to the initial state. In compar-
ison to traditional sensitivity analysis, adjoint sensi-
tivity analysis can directly answer the question “How
sensitive is a model’s result to arbitrary input pertur-
bations?” (Errico, 1997), and the adjoint model can
obtain the sensitivity of certain special aspects of the
forecast to all the initial variables on the whole model
grid through only one model integration.
Many adjoint sensitivity studies have been con-
Supported by the National (Key) Basic Research and Development (973) Program of China (2012CB417201), China Meteo-rological Administration Special Public Welfare Research Fund (GYHY201006004), and National Natural Science Foundation ofChina (41275055 and 41275059).
∗Corresponding author: [email protected].
©The Chinese Meteorological Society and Springer-Verlag Berlin Heidelberg 2016
548 JOURNAL OF METEOROLOGICAL RESEARCH VOL.30
ducted for midlatitude cyclones. For example, Lang-
land et al. (1995) calculated the adjoint sensitivity of
an idealized midlatitude cyclone with only dry physics
included, and found high sensitivity regions located
in the baroclinic zone above the developing cyclone
and in the middle and lower troposphere. Their sub-
sequent work that included moist physics in the ad-
joint calculation showed that moist processes increased
the sensitivity magnitude, but did not alter the pri-
mary spatial pattern of sensitivity; additionally, the
cyclone intensity was sensitive to the vertical distri-
bution of temperature perturbations (Langland et al.,
1996). Recently, from an idealized cyclone study in
a three-dimensional quasigeostrophic model, Kim and
Beare (2011) found that the dynamical mechanism of
cyclone development by adjoint sensitivity coincided
with that of nonlinear sensitivity. Besides adjoint
studies on idealized cyclones, many more real cases
have also been examined to understand the dynam-
ical processes or improve the forecasting of midlati-
tude cyclones, e.g., Atlantic cyclogenesis (Vukicevic
and Raeder, 1995; Zou et al., 1998), Mediterranean
cyclone (Homar and Stensrud, 2004), and snowstorms
caused by midlatitude cyclones (Langland et al., 2002;
Kleist and Morgan, 2005a, b; Jung and Kim, 2009).
The main aim of this study is to understand,
through adjoint sensitivity analysis, the key processes
that affect the explosive development of midlatitude
cyclones, especially under the conditions of strong con-
vection and heavy precipitation. To simulate the ex-
plosive development of an idealized midlatitude cy-
clone, we use an idealized condition including an
idealized two-dimensional baroclinic jet with a bal-
anced three-dimensional moderate-amplitude distur-
bance, derived from a potential vorticity (PV) inver-
sion technique. In contrast to adding wind and tem-
perature perturbations directly in the upper tropo-
sphere as in Langland et al. (1995), the initial con-
dition generated from the PV inversion technique has
initially balanced wind and temperature fields and
high baroclinicity to ensure the explosive development
of the synoptic-scale baroclinic wave. Furthermore,
midlatitude cyclones are usually related to heavy rain-
fall and snowstorms; moist processes play an impor-
tant role in the genesis and development of cyclones.
In this idealized simulation, a special initial moisture
condition is added to generate the strong local insta-
bility for the convection initiation and precipitation.
Thus, we are able to evaluate the characteristics of
the adjoint sensitivity related to the explosive devel-
opment of this idealized midlatitude cyclone, as well
as the influence of moist processes.
However, when moist physics plays a leading role,
as well as the resolution increases, the tangent lin-
ear accuracy of the adjoint sensitivity will be greatly
affected (Park and Droegemeier, 1997; Errico and
Raeder, 1999; Ancell and Mass, 2006). Errico and
Vukicevic (1992) showed that a good tangent linear
approximation can remain valid for up to 1.5 days,
but less in regions of explosive cyclogenesis. More-
over, Gilmour et al. (2001) indicated that the tangent
linear approximation is usually valid for less than 1
day. Nevertheless, there are many applications of the
adjoint method for mesoscale systems with remark-
able moist processes, such as adjoint sensitivity stud-
ies on heavy rainfall (Soci et al., 2006; Chu and Tan,
2010), mesoscale vortex (Wang and Gao, 2006), and
even tropical cyclones (Kim and Jung, 2006; Wu et al.,
2007; Chu et al., 2011). Through changing the mois-
ture content and distribution in the initial conditions,
this paper discusses the valid duration of the tangent
linear approximation under conditions of heavy pre-
cipitation for this idealized case.
The rest of the paper is organized as follows. Sec-
tion 2 describes the numerical models, idealized ini-
tial conditions, and the experimental design. A brief
overview of the idealized explosive cyclone is given in
Section 3. Section 4 discusses the tangent linear as-
sumption test and the selection of the response func-
tions for the adjoint calculation. All the adjoint results
are investigated in Section 5, followed by a summary
in Section 6.
2. Numerical models, initial conditions, and
experimental design
In this study, the non-hydrostatic mesoscale
model MM5 (Grell et al., 1995; Dudhia et al., 1993) is
NO.4 CHU Kekuan and ZHANG Yi 549
employed to simulate the baroclinic wave-frontal sys-
tem, and the MM5 adjoint system (Zou et al., 1997)
is used to calculate the adjoint sensitivity.
As in Tan et al. (2004), the initial condi-
tion is generated by giving a zonally invariant two-
dimensional PV field and a three-dimensional PV per-
turbation; the boundary condition is specified as in
Rotunno et al. (1994). By inverting the PV fields
using the inversion technique, the baroclinic jet and
potential temperature fields are obtained. The wind
and potential temperature fields are therefore initially
balanced, which ensures the fast development of the
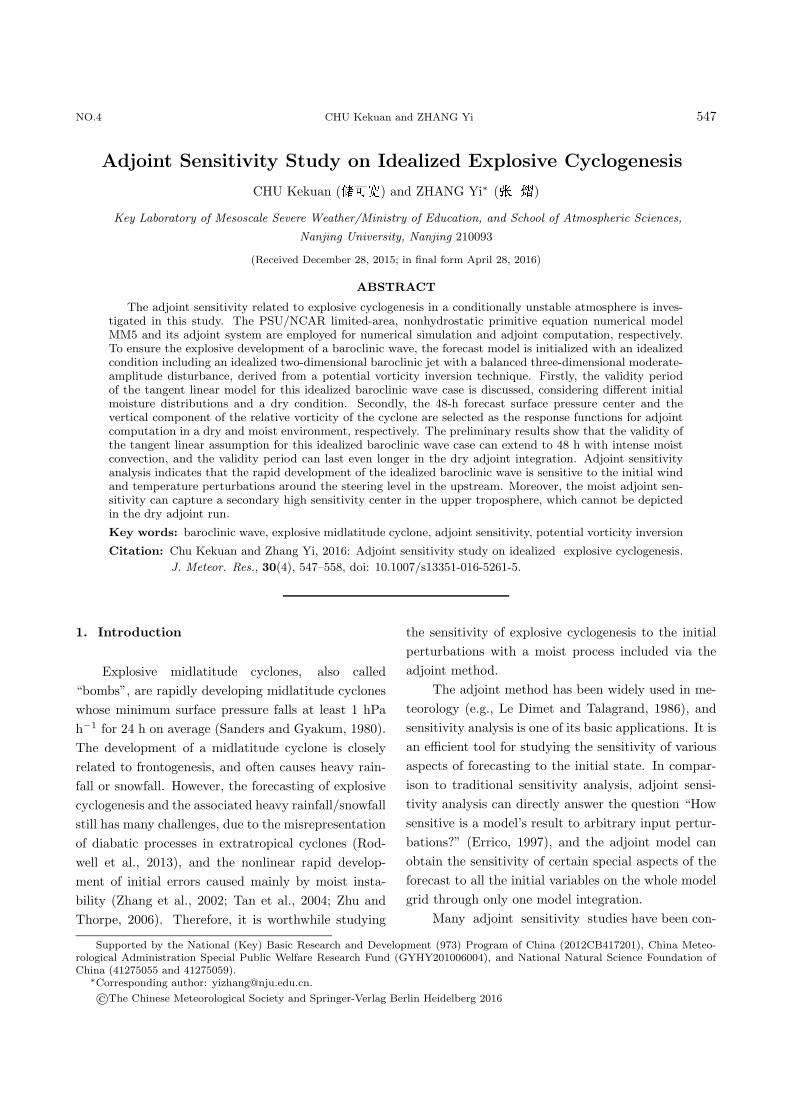
synoptic-scale baroclinic wave (Fig. 1a). The initial
moisture field is also designed the same as in Tan et
al. (2004). This initial distribution of moisture varies
from a moist condition at the lowest level to a dry
one above the height of 8 km (see Fig. 1b), produc-
ing a large horizontal moisture gradient in the lower
to middle troposphere within the south region of the
baroclinic zone. This distribution of moisture can gen-
erate large conditional instability, which is conducive
to the initiation of convection and precipitation.
The domain of integration is rectangular, config-
ured with 150 grid points in the x direction and 70 in
the y direction. The horizontal grid resolution is 60 km
and there are 20 vertical layers. The model is run with
Cartesian coordinates and a constant Coriolis parame-
ter. In the forecast model, the physical parameteriza-
tion schemes are the Kuo cumulus parameterization,
the Blackada planetary boundary layer scheme, and
the simple ice phase microphysics scheme. The adjoint
model uses the same parameterization schemes as the
forecast model. Although this paper uses an ideal-
ized initial condition, it also uses a primitive equation
model and complex parameterization schemes. There-
fore, compared with simulating the cyclogenesis pro-
cess with a simple dynamical model, this simulation is
more realistic in its reflection of the effect of physical
processes, such as diabatic heating.
Two numerical simulations are performed, i.e., a
control experiment (CNTL), in which the initial maxi-
mum relative humidity (RH0) is set to 70%; and a dry
experiment (DRY), which is performed in a totally dry
atmosphere with other configurations exactly the same
as in CNTL.
Before the adjoint sensitivity computation, the
accuracy of the tangent linear model (TLM) is evalu-
ated. Firstly, we follow the method of Zou et al. (1997;
Eqs. (3.15) and (3.16)) to verify the correctness of
the TLM and adjoint model. Secondly, we compare
the evolution of the initial perturbations in the non-
linear simulations and TLM integration. The initial
perturbations consist of random, zero-mean Gaussian
noise added in the temperature field with the standard
deviation being set to 0.2 K. To investigate the impact
of moist processes on the accuracy of the TLM, this
test is carried out in conditions of dry, fake-dry (no la-
tent heating), and different initial water content from
Fig. 1. (a) Vertical cross-section of initial zonal velocity (thick contours; interval: 10 m s−1; maximum: 51.59 m s−1)
and potential temperature (thin contours; interval: 4 K). (b) Vertical distribution of the initial relative humidity for the
control experiment (RH0 = 70%; interval: 10%).

550 JOURNAL OF METEOROLOGICAL RESEARCH VOL.30
RH0 = 70% to RH0 = 90%. Table 1 lists the names
and settings of each experiment.
Table 1. Experimental settings for the tangent lin-
ear assumption
Experiment name Moisture content
RH70 RH0 = 70%
RH80 RH0 = 80%
RH90 RH0 = 90%
DRY No moisture
FDRY RH0 = 70%, no latent heating
Note: standard deviation of initial temperature perturba-
tions is set to 0.2 K.
3. Explosive development of the simulated
baroclinic wave
The baroclinic initial perturbation experiences ex-
plosive growth both in the moist and dry simulations
(Fig. 2). During the first 7 h, the baroclinic wave be-
gins to intensify in both CNTL and DRY, and there
is almost no difference between these two simulations,
since convection has not yet imposed any notable ef-
fect on the development of the cyclone. Thereafter,
the minimum surface pressure in DRY maintains at
985 hPa for about 10 h, from hours 8 to 18 of the sim-
ulation. Meanwhile, the surface low in CNTL begins
to intensify, causing a large difference in surface pres-
sure simulations. At hour 33, the difference reaches a
peak of 11 hPa, and then reduces to about 9 hPa. At
hour 48, the minimum surface pressure in DRY and
CNTL is 954 and 946 hPa, respectively. It is obvious
that the moist processes help the explosive growth of
the idealized midlatitude cyclone.
The evolution of the pressure and surface poten-
tial temperature fields in DRY and CNTL are also
quite different, as shown in Figs. 3 and 4, respec-
tively. The surface cyclone in CNTL moves and devel-
ops faster than that in DRY. Zhang and Tan (2007)
provided a detailed description of these features. Fig-
ure 3 shows the cyclone’s frontal structure during its
initial (Fig. 3a) and fast intensification (Figs. 3b and
3c) stages in DRY, which reveals the typical features
of the baroclinic wave-frontal system. For example,
the cyclone is located in a broad baroclinic zone, and
the cold front is roughly perpendicular to the warm
front forming a “T-bone” structure (Fig. 3b). As the
cyclone develops into its mature stage, the western
section of the warm front bends around the low cy-
clonically, forming a “bent-back” structure (Fig. 3c).
In CNTL, precipitation is produced in the early stage
(Fig. 4a); and with the development of the cyclone,
Fig. 2. Temporal evolution of minimum surface pressure
in CNTL (dashed line) and DRY (solid line).
Fig. 3. Evolution of the cyclone’s surface pressure (solid
contours; interval: 5 hPa) and surface potential tempera-
ture (dashed lines; interval: 4 K) in experiment DRY at
hours (a) 24, (b) 36, and (c) 48 of the simulation.
NO.4 CHU Kekuan and ZHANG Yi 551
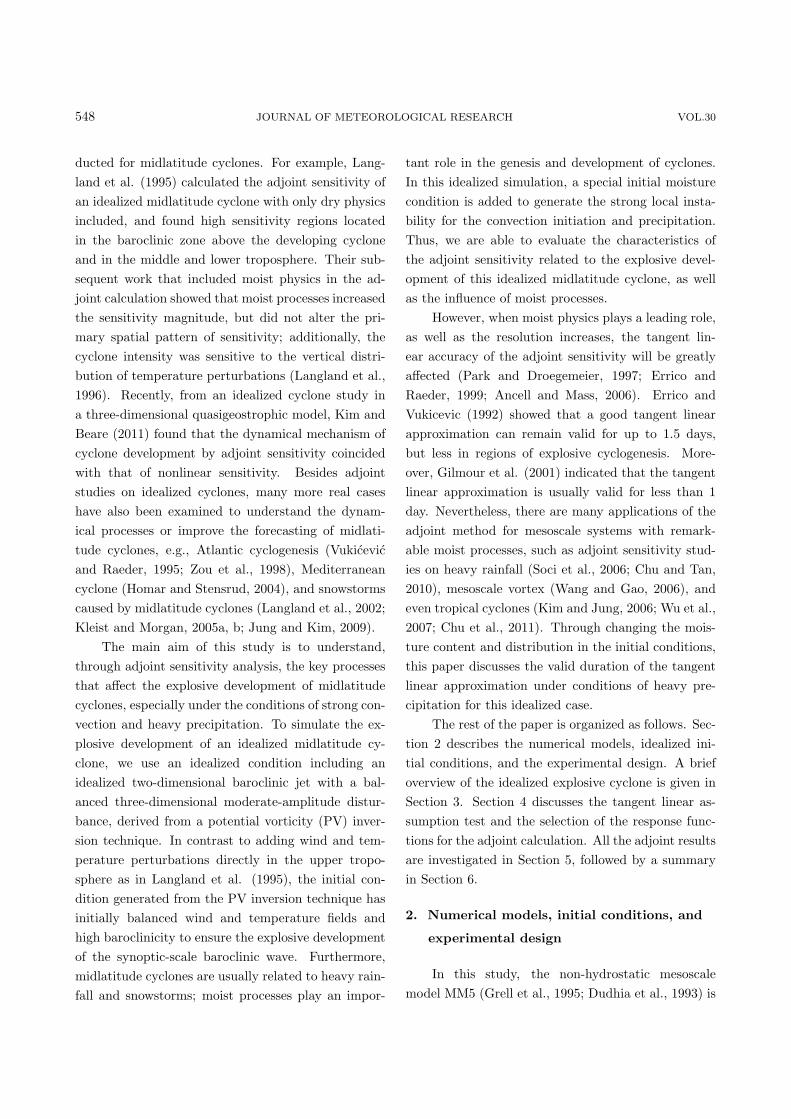
the intensity and range of the precipitation increase
(Figs. 4b and 4c), indicating the existence of strong
moist convection near the frontal zone. Up to hour
48 of the simulation, the surface low center and warm
front are both stronger in CNTL than in DRY. It is
clear that moist processes not only produce a large
amount of precipitation, but also influence the struc-
ture, intensification, and movement of this idealized
midlatitude cyclone.
4. Tangent linear assumption and the response
functions
4.1 Validation of the tangent linear assump-
tion
Before computing the adjoint sensitivity, an eva-
luation of the TLM and adjoint model correspondence
is carried out to make sure that the adjoint sensitivity
is a good approximation of the nonlinear sensitivity.
We compare the TLM solutions with the difference
between pairs of control and perturbed nonlinear fore-
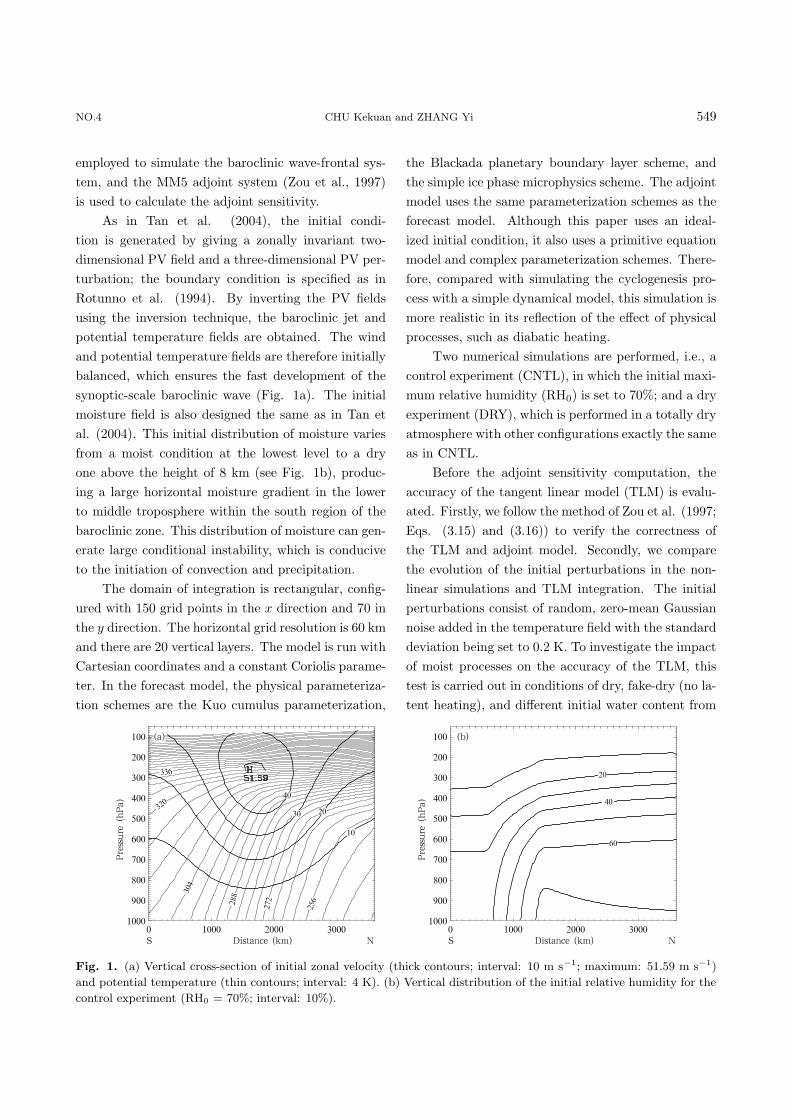
casts using the same settings. The correlation between
the nonlinear and tangent linear temperature pertur-
bations during the 48-h simulation at 6-h intervals is
shown in Fig. 5; all correlation coefficients are statisti-
cally significant at the 0.005 level by using a Student’s
t-test. In general, the correlation gradually decreases
with integration time in all the tests. However, the
dry and moist tests perform very differently. In the
dry test, the correlation decreases quite slowly, and
remains at a value of 0.965 even after 48 h of inte-
gration. On the contrary, the correlation decreases
rather rapidly when moist physics is included. The
correlation decreases with increased initial moisture,
with the coefficients falling below 0.8 after 47 and 37
h of integration in RH80 and RH90, respectively (Fig.
5). The results from the fake-dry test (RH = 70%)
are similar to that of the dry test, indicating that the
nonlinear effect is mainly due to the release of latent
heat from non-adiabatic processes. To qualitatively
describe the agreement between the nonlinear pertur-
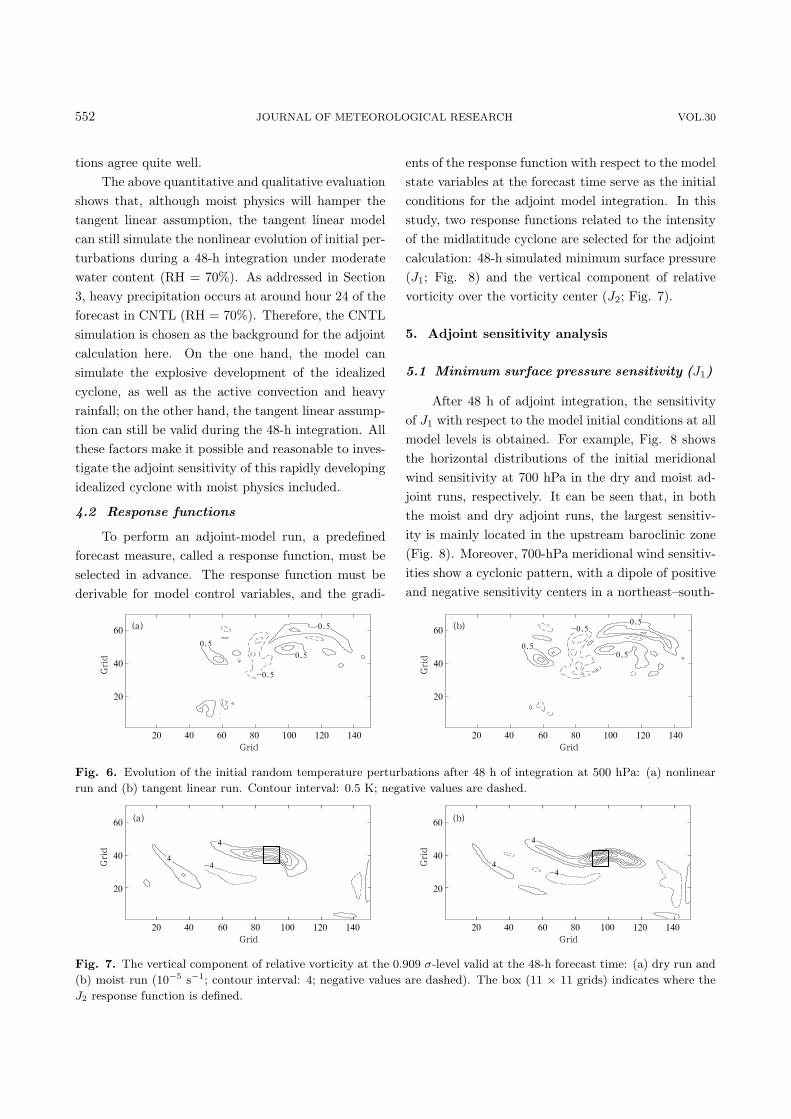
bations and tangent linear perturbations, Figs. 6a and
6b show the 48-h forecast of the perturbations from
experiment RH70. It can be seen that after 48 h of
integration, the distribution, spatial scale, and ampli-
tudes of the nonlinear and tangent linear perturba-
Fig. 4. As in Fig. 3, but for CNTL. Color-shading indi-
cates the 6-h accumulated precipitation.
Fig. 5. Evolution of the correlation (p < 0.005) between
nonlinear and tangent linear temperature perturbations for
dry adjoint integration (DRY); fake-dry adjoint integration
(FDRY; RH0 = 70%); moist adjoint integration with RH0
= 70% (RH70), 80% (RH80), and 90% (RH90).
552 JOURNAL OF METEOROLOGICAL RESEARCH VOL.30
tions agree quite well.
The above quantitative and qualitative evaluation
shows that, although moist physics will hamper the
tangent linear assumption, the tangent linear model
can still simulate the nonlinear evolution of initial per-
turbations during a 48-h integration under moderate
water content (RH = 70%). As addressed in Section
3, heavy precipitation occurs at around hour 24 of the
forecast in CNTL (RH = 70%). Therefore, the CNTL
simulation is chosen as the background for the adjoint
calculation here. On the one hand, the model can
simulate the explosive development of the idealized
cyclone, as well as the active convection and heavy
rainfall; on the other hand, the tangent linear assump-
tion can still be valid during the 48-h integration. All
these factors make it possible and reasonable to inves-
tigate the adjoint sensitivity of this rapidly developing
idealized cyclone with moist physics included.
4.2 Response functions
To perform an adjoint-model run, a predefined
forecast measure, called a response function, must be
selected in advance. The response function must be
derivable for model control variables, and the gradi-
ents of the response function with respect to the model
state variables at the forecast time serve as the initial
conditions for the adjoint model integration. In this
study, two response functions related to the intensity
of the midlatitude cyclone are selected for the adjoint
calculation: 48-h simulated minimum surface pressure
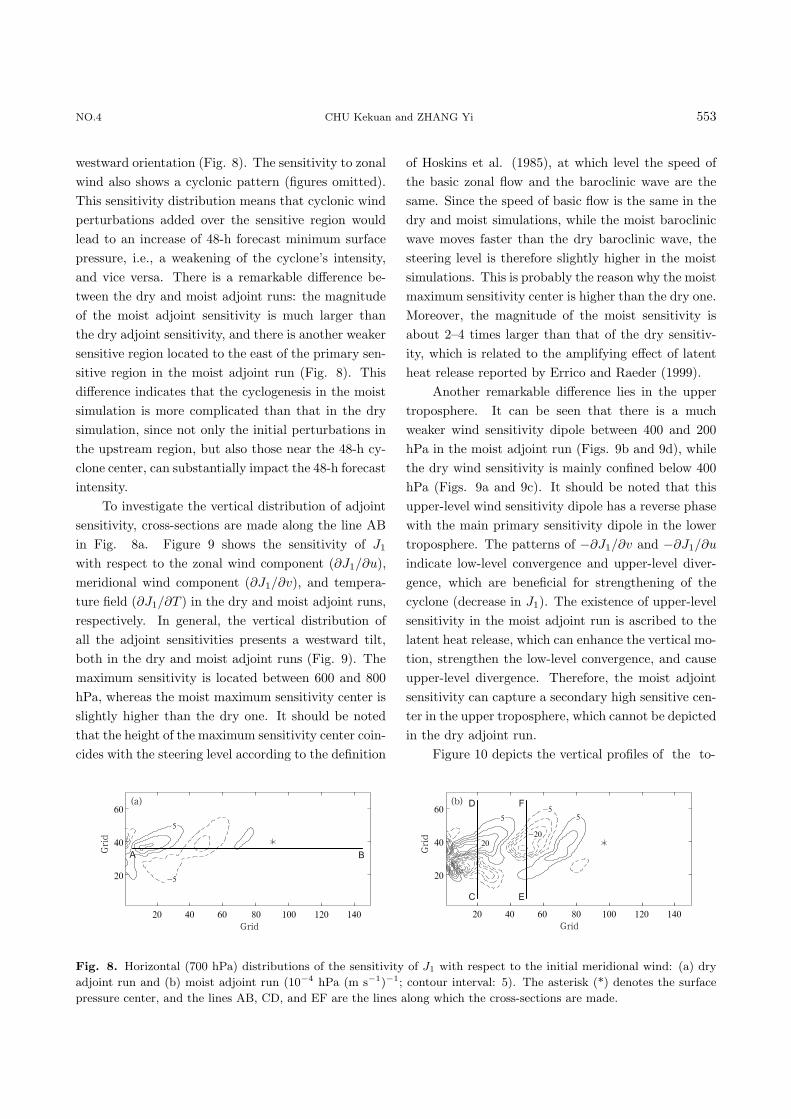
(J1; Fig. 8) and the vertical component of relative
vorticity over the vorticity center (J2; Fig. 7).
5. Adjoint sensitivity analysis
5.1 Minimum surface pressure sensitivity (J1)
After 48 h of adjoint integration, the sensitivity
of J1 with respect to the model initial conditions at all
model levels is obtained. For example, Fig. 8 shows
the horizontal distributions of the initial meridional
wind sensitivity at 700 hPa in the dry and moist ad-
joint runs, respectively. It can be seen that, in both
the moist and dry adjoint runs, the largest sensitiv-
ity is mainly located in the upstream baroclinic zone
(Fig. 8). Moreover, 700-hPa meridional wind sensitiv-
ities show a cyclonic pattern, with a dipole of positive
and negative sensitivity centers in a northeast–south-
Fig. 6. Evolution of the initial random temperature perturbations after 48 h of integration at 500 hPa: (a) nonlinear
run and (b) tangent linear run. Contour interval: 0.5 K; negative values are dashed.
Fig. 7. The vertical component of relative vorticity at the 0.909 σ-level valid at the 48-h forecast time: (a) dry run and
(b) moist run (10−5 s−1; contour interval: 4; negative values are dashed). The box (11 × 11 grids) indicates where the
J2 response function is defined.
NO.4 CHU Kekuan and ZHANG Yi 553
westward orientation (Fig. 8). The sensitivity to zonal
wind also shows a cyclonic pattern (figures omitted).
This sensitivity distribution means that cyclonic wind
perturbations added over the sensitive region would
lead to an increase of 48-h forecast minimum surface
pressure, i.e., a weakening of the cyclone’s intensity,
and vice versa. There is a remarkable difference be-
tween the dry and moist adjoint runs: the magnitude
of the moist adjoint sensitivity is much larger than
the dry adjoint sensitivity, and there is another weaker
sensitive region located to the east of the primary sen-
sitive region in the moist adjoint run (Fig. 8). This
difference indicates that the cyclogenesis in the moist
simulation is more complicated than that in the dry
simulation, since not only the initial perturbations in
the upstream region, but also those near the 48-h cy-
clone center, can substantially impact the 48-h forecast
intensity.
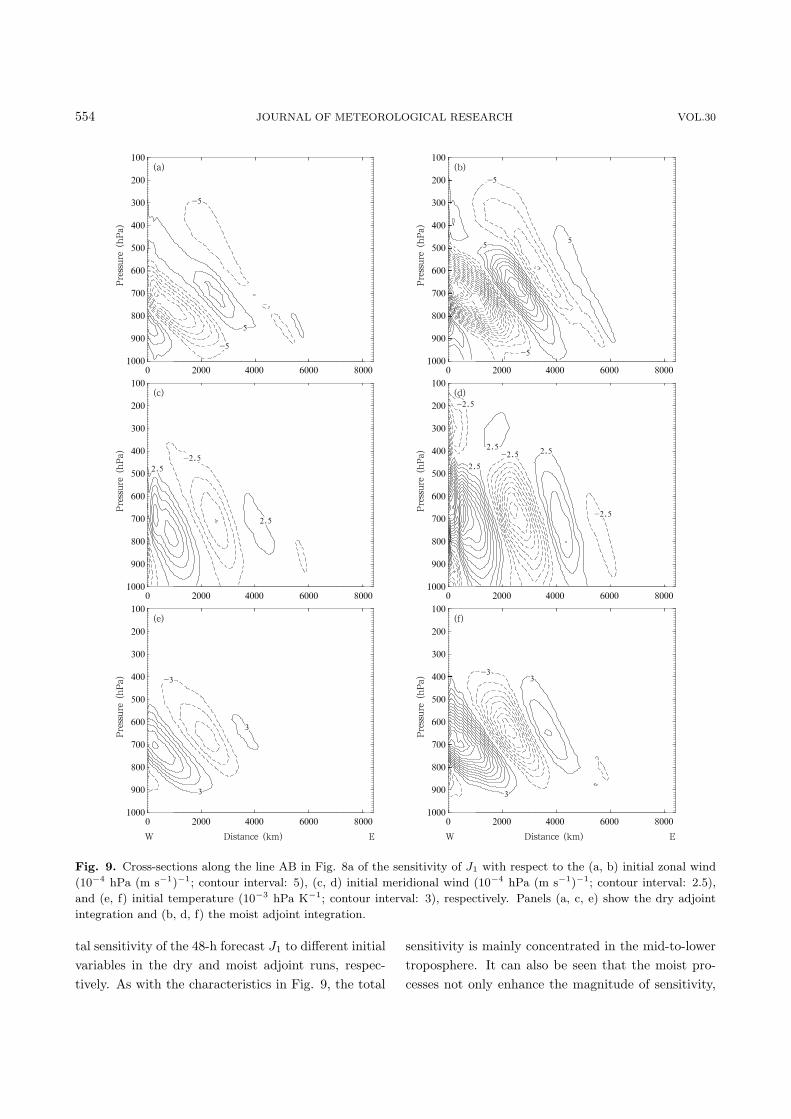
To investigate the vertical distribution of adjoint
sensitivity, cross-sections are made along the line AB
in Fig. 8a. Figure 9 shows the sensitivity of J1
with respect to the zonal wind component (∂J1/∂u),
meridional wind component (∂J1/∂v), and tempera-
ture field (∂J1/∂T ) in the dry and moist adjoint runs,
respectively. In general, the vertical distribution of
all the adjoint sensitivities presents a westward tilt,
both in the dry and moist adjoint runs (Fig. 9). The
maximum sensitivity is located between 600 and 800
hPa, whereas the moist maximum sensitivity center is
slightly higher than the dry one. It should be noted
that the height of the maximum sensitivity center coin-
cides with the steering level according to the definition
of Hoskins et al. (1985), at which level the speed of
the basic zonal flow and the baroclinic wave are the
same. Since the speed of basic flow is the same in the
dry and moist simulations, while the moist baroclinic
wave moves faster than the dry baroclinic wave, the
steering level is therefore slightly higher in the moist
simulations. This is probably the reason why the moist
maximum sensitivity center is higher than the dry one.
Moreover, the magnitude of the moist sensitivity is
about 2–4 times larger than that of the dry sensitiv-
ity, which is related to the amplifying effect of latent
heat release reported by Errico and Raeder (1999).
Another remarkable difference lies in the upper
troposphere. It can be seen that there is a much
weaker wind sensitivity dipole between 400 and 200
hPa in the moist adjoint run (Figs. 9b and 9d), while
the dry wind sensitivity is mainly confined below 400
hPa (Figs. 9a and 9c). It should be noted that this
upper-level wind sensitivity dipole has a reverse phase
with the main primary sensitivity dipole in the lower
troposphere. The patterns of −∂J1/∂v and −∂J1/∂u
indicate low-level convergence and upper-level diver-
gence, which are beneficial for strengthening of the
cyclone (decrease in J1). The existence of upper-level
sensitivity in the moist adjoint run is ascribed to the
latent heat release, which can enhance the vertical mo-
tion, strengthen the low-level convergence, and cause
upper-level divergence. Therefore, the moist adjoint
sensitivity can capture a secondary high sensitive cen-
ter in the upper troposphere, which cannot be depicted
in the dry adjoint run.
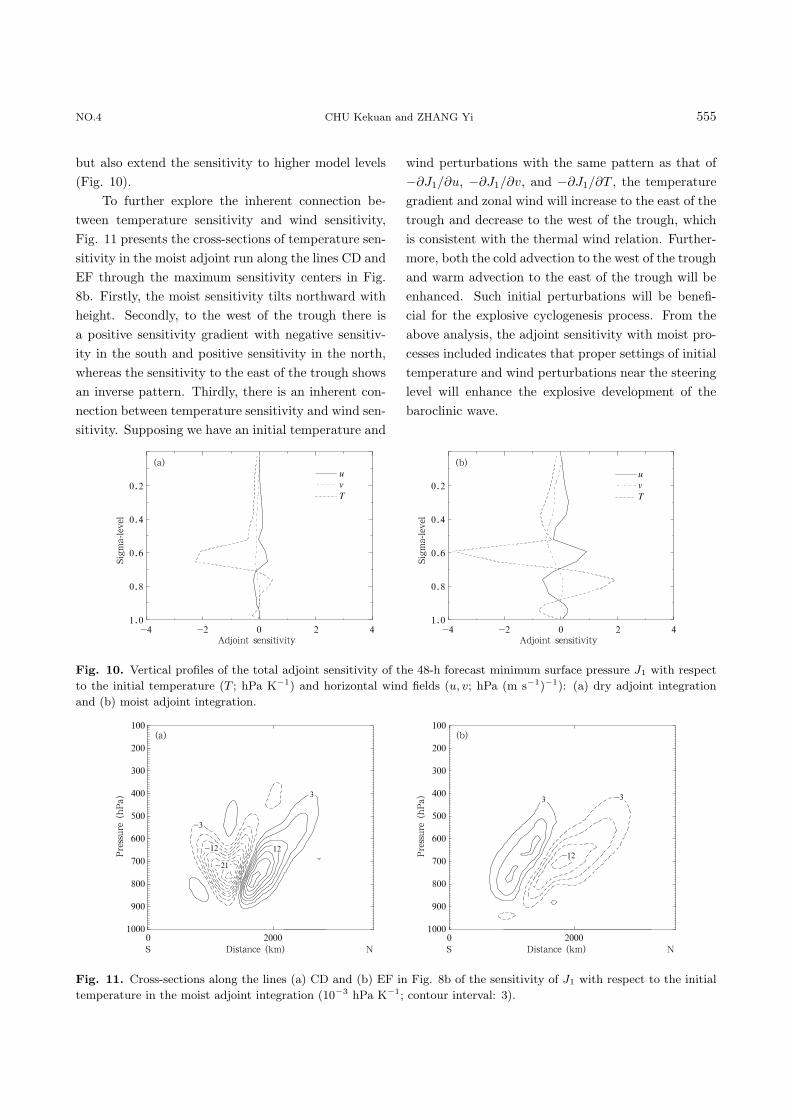
Figure 10 depicts the vertical profiles of the to-
Fig. 8. Horizontal (700 hPa) distributions of the sensitivity of J1 with respect to the initial meridional wind: (a) dry
adjoint run and (b) moist adjoint run (10−4 hPa (m s−1)−1; contour interval: 5). The asterisk (*) denotes the surface
pressure center, and the lines AB, CD, and EF are the lines along which the cross-sections are made.
554 JOURNAL OF METEOROLOGICAL RESEARCH VOL.30
Fig. 9. Cross-sections along the line AB in Fig. 8a of the sensitivity of J1 with respect to the (a, b) initial zonal wind
(10−4 hPa (m s−1)−1; contour interval: 5), (c, d) initial meridional wind (10−4 hPa (m s−1)−1; contour interval: 2.5),
and (e, f) initial temperature (10−3 hPa K−1; contour interval: 3), respectively. Panels (a, c, e) show the dry adjoint
integration and (b, d, f) the moist adjoint integration.
tal sensitivity of the 48-h forecast J1 to different initial
variables in the dry and moist adjoint runs, respec-
tively. As with the characteristics in Fig. 9, the total
sensitivity is mainly concentrated in the mid-to-lower
troposphere. It can also be seen that the moist pro-
cesses not only enhance the magnitude of sensitivity,
NO.4 CHU Kekuan and ZHANG Yi 555
but also extend the sensitivity to higher model levels
(Fig. 10).
To further explore the inherent connection be-
tween temperature sensitivity and wind sensitivity,
Fig. 11 presents the cross-sections of temperature sen-
sitivity in the moist adjoint run along the lines CD and
EF through the maximum sensitivity centers in Fig.
8b. Firstly, the moist sensitivity tilts northward with
height. Secondly, to the west of the trough there is
a positive sensitivity gradient with negative sensitiv-
ity in the south and positive sensitivity in the north,
whereas the sensitivity to the east of the trough shows
an inverse pattern. Thirdly, there is an inherent con-
nection between temperature sensitivity and wind sen-
sitivity. Supposing we have an initial temperature and
wind perturbations with the same pattern as that of
−∂J1/∂u, −∂J1/∂v, and −∂J1/∂T , the temperature
gradient and zonal wind will increase to the east of the
trough and decrease to the west of the trough, which
is consistent with the thermal wind relation. Further-
more, both the cold advection to the west of the trough
and warm advection to the east of the trough will be
enhanced. Such initial perturbations will be benefi-
cial for the explosive cyclogenesis process. From the
above analysis, the adjoint sensitivity with moist pro-
cesses included indicates that proper settings of initial
temperature and wind perturbations near the steering
level will enhance the explosive development of the
baroclinic wave.
Fig. 10. Vertical profiles of the total adjoint sensitivity of the 48-h forecast minimum surface pressure J1 with respect
to the initial temperature (T ; hPa K−1) and horizontal wind fields (u, v; hPa (m s−1)−1): (a) dry adjoint integration
and (b) moist adjoint integration.
Fig. 11. Cross-sections along the lines (a) CD and (b) EF in Fig. 8b of the sensitivity of J1 with respect to the initial
temperature in the moist adjoint integration (10−3 hPa K−1; contour interval: 3).
556 JOURNAL OF METEOROLOGICAL RESEARCH VOL.30
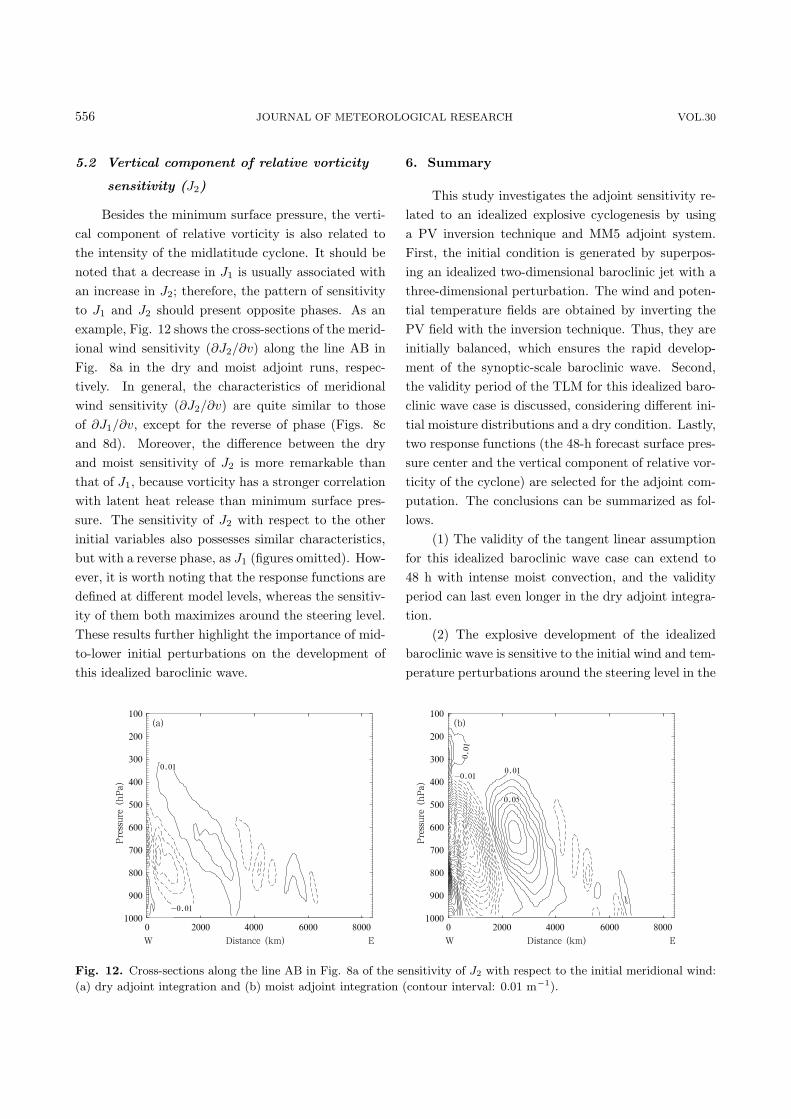
5.2 Vertical component of relative vorticity
sensitivity (J2)
Besides the minimum surface pressure, the verti-
cal component of relative vorticity is also related to
the intensity of the midlatitude cyclone. It should be
noted that a decrease in J1 is usually associated with
an increase in J2; therefore, the pattern of sensitivity
to J1 and J2 should present opposite phases. As an
example, Fig. 12 shows the cross-sections of the merid-
ional wind sensitivity (∂J2/∂v) along the line AB in
Fig. 8a in the dry and moist adjoint runs, respec-
tively. In general, the characteristics of meridional
wind sensitivity (∂J2/∂v) are quite similar to those
of ∂J1/∂v, except for the reverse of phase (Figs. 8c
and 8d). Moreover, the difference between the dry
and moist sensitivity of J2 is more remarkable than
that of J1, because vorticity has a stronger correlation
with latent heat release than minimum surface pres-
sure. The sensitivity of J2 with respect to the other
initial variables also possesses similar characteristics,
but with a reverse phase, as J1 (figures omitted). How-
ever, it is worth noting that the response functions are
defined at different model levels, whereas the sensitiv-
ity of them both maximizes around the steering level.
These results further highlight the importance of mid-
to-lower initial perturbations on the development of
this idealized baroclinic wave.
6. Summary
This study investigates the adjoint sensitivity re-
lated to an idealized explosive cyclogenesis by using
a PV inversion technique and MM5 adjoint system.
First, the initial condition is generated by superpos-
ing an idealized two-dimensional baroclinic jet with a
three-dimensional perturbation. The wind and poten-
tial temperature fields are obtained by inverting the
PV field with the inversion technique. Thus, they are
initially balanced, which ensures the rapid develop-
ment of the synoptic-scale baroclinic wave. Second,
the validity period of the TLM for this idealized baro-
clinic wave case is discussed, considering different ini-
tial moisture distributions and a dry condition. Lastly,
two response functions (the 48-h forecast surface pres-
sure center and the vertical component of relative vor-
ticity of the cyclone) are selected for the adjoint com-
putation. The conclusions can be summarized as fol-
lows.
(1) The validity of the tangent linear assumption
for this idealized baroclinic wave case can extend to
48 h with intense moist convection, and the validity
period can last even longer in the dry adjoint integra-
tion.
(2) The explosive development of the idealized
baroclinic wave is sensitive to the initial wind and tem-
perature perturbations around the steering level in the
Fig. 12. Cross-sections along the line AB in Fig. 8a of the sensitivity of J2 with respect to the initial meridional wind:
(a) dry adjoint integration and (b) moist adjoint integration (contour interval: 0.01 m−1).

NO.4 CHU Kekuan and ZHANG Yi 557
upstream baroclinic zone.
(3) The moist adjoint sensitivity can capture a
secondary high sensitivity center in the upper tropo-
sphere, which cannot be depicted in the dry adjoint
run.
Future work will focus on the rapid development
process of explosive midlatitude cyclones through a
real case study.
Acknowledgments. The authors thank Prof.
Zhemin Tan for providing the code for generating the
initial conditions for the idealized baroclinic wave sim-
ulation, and the three anonymous reviewers for their
valuable suggestions.
REFERENCES
Ancell, B. C., and C. F. Mass, 2006: Structure, growth
rates, and tangent linear accuracy of adjoint sen-
sitivities with respect to horizontal and vertical
resolution. Mon. Wea. Rev., 134, 2971–2988, doi:
10.1175/MWR3227.1.
Chu, K. K., and Z. M. Tan, 2010: Mesoscale moist
adjoint sensitivity study of a Meiyu heavy rain-
fall event. Adv. Atmos. Sci., 27, 1415–1424, doi:
10.1007/s00376-010-9213-1.
Chu, K. K., Q. N. Xiao, Z. M. Tan, et al., 2011: A
forecast sensitivity study on the intensity change of
Typhoon Sinlaku (2008). J. Geophys. Res., 116,
D22109, doi: 10.1029/2011JD016127.
Dudhia, J., 1993: A nonhydrostatic version of the Penn
State/NCAR mesoscale model: Validation tests and
simulation of an Atlantic cyclone and cold front.
Mon. Wea. Rev., 121, 1493–1513, 10.1175/1520-
0493(1993)121<1493:ANVOTP>2.0.CO;2.
Errico, R. M., and T. Vukicevic, 1992: Sensitivity anal-
ysis using an adjoint of the PSU–NCAR mesoscale
model. Mon. Wea. Rev., 120, 1644–1660, doi:
10.1175/1520-0493(1992)120<1644:SAUAAO>2.0.
CO;2.
Errico, R. M., 1997: What is an adjoint model? Bull.
Amer. Meteor. Soc., 78, 2577–2591, doi: 10.1175
/1520-0477(1997)078<2577:WIAAM>2.0.CO;2.
Errico, R. M., and K. D. Raeder, 1999: An examination
of the accuracy of the linearization of a mesoscale
model with moist physics. Quart. J. Roy. Meteor.
Soc., 125, 169–195, doi: 10.1002/qj.49712555310.
Gilmour, I., L. A. Smith, and R. Buizza, 2001: Lin-
ear regime duration: Is 24 hours a long time in
synoptic weather forecasting? J. Atmos. Sci., 58,
3525–3539, doi: 10.1175/1520-0469(2001)058<3525:
LRDIHA>2.0.CO;2.
Grell, G. A., J. Dudhia, and D. R. Stauffer, 1995: A de-
scription of the fifth-generation Penn State/NCAR
Mesoscale model (MM5). NCAR Tech. Note,
NCAR/TN-398+STR, 138 pp.
Homar, V., and D. J. Stensrud, 2004: Sensitivities of an
intense Mediterranean cyclone: Analysis and valida-
tion. Quart. J. Roy. Meteor. Soc., 130, 2519–2540,
doi: 10.1256/qj.03.85.
Hoskins, B. J., M. E. McIntyre, and A. W. Robertson,
1985: On the use and significance of isentropic po-
tential vorticity maps. Quart. J. Roy. Meteor. Soc.,
111, 877–946, doi: 10.1002/qj.49711147002.
Jung, B. J., and H. M. Kim, 2009: Moist adjoint-based
forecast sensitivities for a heavy snowfall event
over the Korean Peninsula on 4–5 March 2004. J.
Geophys. Res., 114, D15104, doi: 10.1029/2008
JD011370.
Kim, H. M., and B. J. Jung, 2006: Adjoint-based forecast
sensitivities of Typhoon Rusa. Geophys. Res. Lett.,
33, L21813, doi: 10.1029/2006GL027289.
Kim, H. M., and R. J. Beare, 2011: Characteristics of
adjoint sensitivity to potential vorticity. Meteor.
Atmos. Phys., 111, 91–102, doi: 10.1007/s00703-
010-0119-3.
Kleist, D. T., and M. C. Morgan, 2005a: Interpretation of
the structure and evolution of adjoint-derived fore-
cast sensitivity gradients. Mon. Wea. Rev., 133,
466–484, doi: 10.1175/MWR-2865.1.
Kleist, D. T., and M. C. Morgan, 2005b: Applica-
tion of adjoint-derived forecast sensitivities to the
24–25 January 2000 U.S. east coast snowstorm.
Mon. Wea. Rev., 133, 3148–3175, doi: 10.1175/
MWR3023.1.
Langland, R. H., R. L. Elsberry, and R. M. Errico,
1995: Evaluation of physical processes in an ideal-
ized extratropical cyclone using adjoint sensitivity.
Quart. J. Roy. Meteor. Soc., 121, 1349–1386, doi:
10.1002/qj.49712152608.
Langland, R. H., R. L. Elsberry, and R. M. Errico,
1996: Adjoint sensitivity of an idealized extra-
tropical cyclone with moist physical processes.
Quart. J. Roy. Meteor. Soc., 122, 1891–1920,
doi: 10.1002/qj.49712253608.
Langland, R. H., M. A. Shapiro, and R. Gelaro, 2002:
Initial condition sensitivity and error growth in fore-
casts of the 25 January 2000 east coast snowstorm.
558 JOURNAL OF METEOROLOGICAL RESEARCH VOL.30
Mon. Wea. Rev., 130, 957–974, 10.1175/1520-
0493(2002)130<0957:ICSAEG>2.0.CO;2.
Le Dimet, F. X., and O. Talagrand, 1986: Variational
algorithms for analysis and assimilation of meteoro-
logical observations: Theoretical aspects. Tellus A,
38A, 97–110.
Park, S. K., and K. K. Droegemeier, 1997: Validity of the
tangent linear approximation in a moist convective
cloud model. Mon. Wea. Rev., 125, 3320–3340,
doi: 10.1175/1520-0493(1997)125<3320:VOTTLA>
2.0.CO;2.
Rodwell, M. J., L. Magnusson, P. Bauer, et al., 2013:
Characteristics of occasional poor medium-range
weather forecasts for Europe. Bull. Amer. Me-
teor. Soc., 94, 1393–1405, doi: 10.1175/BAMS-D-
12-00099.1.
Rotunno, R., W. C. Skamarock, and C. Snyder, 1994:
An analysis of frontogenesis in numerical sim-
ulations of baroclinic waves. J. Atmos. Sci.,
51, 3373–3398, 10.1175/1520-0469(1994)051<3373:
AAOFIN>2.0.CO;2.
Sanders, F., and J. R. Gyakum, 1980: Synoptic-dynamic
climatology of the “bomb”. Mon. Wea. Rev.,
108, 1589–1606, doi: 10.1175/1520-0493(1980)108
<1589:SDCOT>2.0.CO;2.
Soci, C., C. Fischer, and A. Horanyi, 2006: Sensitivity of
high-resolution forecasts using the adjoint technique
on the 10-km scale. Mon. Wea. Rev., 134, 772–790,
doi: 10.1175/MWR3091.1.
Tan, Z.-M., F.-Q. Zhang, R. Rotunno, et al., 2004:
Mesoscale predictability of moist baroclinic waves:
Experiments with parameterized convection. J.
Atmos. Sci., 61, 1794–1804, doi: 10.1175/1520-
0469(2004)061<1794:MPOMBW>2.0.CO;2.
Vukicevic, T., and K. Raeder, 1995: Use of an adjoint
model for finding triggers for Alpine Lee cyclo-
genesis. Mon. Wea. Rev., 123, 800–816, doi:
10.1175/1520-0493(1995)123<0800:UOAAMF>2.0.
CO;2.
Wang, Z., and K. Gao, 2006: Adjoint sensitivity experi-
ments of a mesoscale vortex in the middle reaches of
the Yangtze River. Adv. Atmos. Sci., 23, 267–281,
doi: 10.1007/s00376-006-0267-z.
Wu, C. C., J. H. Chen, P. H. Lin, et al., 2007: Targeted
observations of tropical cyclone movement based on
the adjoint-derived sensitivity steering vector. J. At-
mos. Sci., 64, 2611–2626, doi: 10.1175/JAS3974.1.
Zhang, F., C. Snyder, and R. Rotunno, 2002: Mesoscale
predictability of the “surprise” snowstorm of 24–25
January 2000. Mon. Wea. Rev., 130, 1617–1632,
doi: 10.1175/1520-0493(2002)130<1617:MPOTSS>
2.0.CO;2.
Zhang, Y., and Z.-M. Tan, 2007: Effects of surface
drag on low-level frontogenesis within baroclinic
waves. Sci. China (Ser. D), 50, 306–319, doi:
10.1007/s11430-007-2007-3.
Zhu, H. Y., and A. Thorpe, 2006: Predictability of extra-
tropical cyclones: The influence of initial condition
and model uncertainties. J. Atmos. Sci., 63, 1483–
1497, doi: 10.1175/JAS3688.1.
Zou, X. L., F. Vandenberghe, M. Pondeca, et al., 1997:
Introduction to Adjoint Techniques and the MM5
Adjoint Modeling System. NCAR Technical Note,
NCAR/TN-435+STR, 107 pp.
Zou, X., Y. H. Kuo, and S. Low-Nam, 1998: Medium-
range prediction of an extratropical oceanic cy-
clone: Impact of initial state. Mon. Wea. Rev.,
126, 2737–2763, doi: 10.1175/1520-0493(1998)126
<2737:MRPOAE>2.0.CO;2.