ades international holding plc results for the six …...2019/09/26 · david simonson...
TRANSCRIPT
1 | ADES International Holding PLC
HALF-YEAR 2019 RESULTS London | 27 September 2019
For the purpose of the Transparency Directive the Home Member state of the issuer is the United Kingdom.
ADES International Holding PLC results for the six-month
period ended 30 June 2019
(London & Dubai, 27 September 2019) ADES International Holding PLC (“ADES” or “the Group”), a leading
oil & gas drilling and production services provider in the Middle East and North Africa (MENA), announces
its results for the six-month period ended 30 June 2019.
Summary of Key Financials
(US$ ‘000) 1H2019 1H2018 % change
Revenues 219,940 79,700 176.0%
EBITDA 90,064 37,778 138.4%
EBITDA Margin 40.9% 47.4%
Normalised Net Profit1 33,190 14,021 136.7%
Normalised Net Profit Margin 15.1% 17.6%
Net Profit 11,015 18,246 -39.6%
Net Profit Margin 5.0% 22.9%
Weighted Average No. of Shares 43,794 42,359
Normalised Earnings per Share (US$) 0.76 0.33
Reported Earnings per Share (US$) 0.25 0.43
Key Financial Highlights
Revenue increased significantly by 176.0% year-on-year to reach US$ 219.9 million in 1H 2019 driven
by:
o organic growth of the pre-acquisition business
o increasing contributions from the newly acquired rigs which contributed 62% of consolidated
revenue for the period
o steady ramp up of utilisation rates to 95% compared to 80% in 1H 2018
EBITDA increased by a strong 138.4% to US$ 90.1 million from US$ 37.8 million in 1H 2018, with margins
reflecting the increasing work in KSA and Kuwait.
Normalised net profit increased by 136.7 % year-on-year to US$ 33.2 million in 1H 2019 from US$ 14.0
million in 1H 2018. Normalised net profit margin was affected by higher finance charges
Net profit declined 39.6 % year-on-year to US$ 11.0 million in 1H 2019 due to significant non-recurring
charges during the period.
Cash from operating activities stood strong at US$ 61.5 million in 1H 2019, compared to US$ 0.9
million in 1H 2018, driven by a significant uplift in operating cash flow and improvements in working
capital. The Group expects working capital and free cash flow generation to improve further in 2H 2019,
driven by the deployment of further assets.
Successfully closed a bond offering of US$ 325 million in aggregate of senior secured notes due 2024,
with a B+ credit rating and a stable outlook from S&P and Fitch rating.
1 Normalised Net Profit –Net profit before non-controlling interest after excluding non-recurring charges from: a) non-cash amortized prepaid transaction costs written off due to debt refinancing; b) accounting adjustments related to IFRS 3 (Business Combinations) and a one-off bargain purchase gain; c) non-cash, equity-settled share-based payment compensation from the parent company; d) non-cash fair-value adjustments under financial instruments; and e) non-recurring transactions.

2 | ADES International Holding PLC
HALF-YEAR 2019 RESULTS London | 27 September 2019
Net debt increased to US$ 615.7 million as at 30 June 2019 (on a post-IFRS16 basis and US$ 600.7
million on a pre-IFRS 16 basis), reflecting the increase in our interest-bearing loans and borrowings to
finance the acquired rigs and capital expenditures. ADES’s net leverage (Net debt to LTM Proforma
EBITDA) stood at 2.7x (on a post-IFRS16 basis) and 2.6x (on a pre-IFRS16 basis) as at 30 June 2019.
Cash and bank balances stood at US$ 40.3 million in 1H2018.
Key Operational Highlights
Operating rig count of 36 during 1H 2019, up significantly from the 14 rigs operated in the prior year.
Utilisation rates climbed to 95% in 1H 2019 versus 80% in 1H 2018.
ADES recorded upwards of 6.4 million-man hours during the period, registering a Recordable Injury
Frequency Rate (“RIFR”) per 200,000 working hours of 0.34 as at 30 June 2019, below the International
Association of Drilling Contractors (“IADC”) worldwide standard rate of 0.73.
Substantial and long-dated backlog of c.US$ 1.5 billion as at 30 June 2019, compared to US$ 1.2
billion as at 31 December 2018, with average weighted maturity of 4.2 years.
New contracts for the onshore rigs ADES 2 and ADES 3 in Algeria and for ADES 13 and ADES 14 in
KSA.
Access to deep drilling market in Egypt with first deepwater drilling contract secured in the Egyptian
Mediterranean basin and significant in-country gas discoveries.
Current trading and outlook
Continued top line growth expected in the second half of the year supported by the Group’s strong
backlog, driving revenues through the optimal utilisation and growing contributions from the newly
acquired rigs, alongside deployment of the newly contracted rigs
Operational developments of material impact expected in the coming months include:
o Completion of refurbishment projects on two Kuwaiti rigs with deployment scheduled for
2H 2019;
o Commencement of scheduled operations under the newly secured onshore contracts for
ADES 2 in Algeria, and new build ADES 13 and ADES 14 in KSA;
o Cumulative contribution from operations at the newly acquired Weatherford rigs in Algeria
(February 2019) during 2H 2019.
Integration Project is progressing smoothly with the first phase successfully completed and further
synergies from acquisitions to be realised during 2020, including cost and working capital efficiencies.
Strong liquidity position on account of new facilities providing additional headroom and financial
flexibility to reinforce our resilient position and support growth.
Deleveraging expected to commence in 2020 driven by increasing operational cash flows with the full-year impact of the newly acquired assets, continued organic growth and the repayment of the KSA-based loans following the expiry of the grace period in June 2020.
Our focus will remain on organic growth based on our diversified regional presence and assets base and through leveraging of our unutilized rigs in the MENA region.

3 | ADES International Holding PLC
HALF-YEAR 2019 RESULTS London | 27 September 2019
Commenting on the results, Dr. Mohamed Farouk, Chief Executive Officer of ADES International
Holding said:
“The first half of 2019 saw Group revenue grow almost threefold and become increasingly diversified across
key regional markets with a good balance of off- and on-shore activities. ADES stands today with an asset
base of over 50 rigs, the majority of which were acquired with a contracted backlog and short payback
periods, and we are enjoying today a substantial and long-dated backlog of US$ 1.5 billion with an average
maturity of 4.2 years. This low-risk approach to acquisitions coupled with ADES’s lean cost structure, cultural
alignment and adherence to global best practices, provides a solid platform for organic growth and positions
the Group as a regional champion.”
“Following the completion of the Weatherford acquisitions we successfully finalised the first phase of our
Integration Programme, ensuring the smooth transfer of assets and businesses with minimal operational and
contractual disruptions. In the second half of 2019 our focus will be on the Implementation phase to help
maximize value. Management expects to realise the full benefits of the synergies by the end of 2020.”
“We have developed an optimised capital structure that is more aligned with our operational scale and that
provides ample liquidity for our future growth requirements. In the first half of 2019 ADES partially refinanced
its US$ 450 million syndication secured in 2018 through a US$ 325 million five-year senior secured bond due
2024. This allowed us to restructure our commitments and allowed us to secure a US$ 144 million top-up for
our KSA facility to fund operational growth, as well as a US$ 50 million revolving credit facility. Although
higher finance charges will have a modest impact on our overall return for the year, the Group’s optimised
capital structure is now securely in place with access to c.US$ 194 million to support further growth
requirements and capture any short-term opportunities. Overall, we expect our leverage ratios to gradually
improve as our interest-bearing loans are amortised, the contribution from our newly acquired assets is
annualised and as we continue to drive organic growth.”
“In summary, the Group is well-positioned with the asset base, cost structure and backlog across a diversified
regional presence to support long-term revenue visibility with a strong cash flow generating ability.
Meanwhile, our strong relationships with AA-rated regional clients and ability to secure contract renewals and
awards, renewed confidence by top-tier regional banks, and ample liquidity reinforces our resilient position
and will allow us to capture further growth opportunities. As a consequence, save for the modest impact of
higher finance charges previously disclosed, we expect our trading performance to be in line with the Board’s
expectations for the full year.”

4 | ADES International Holding PLC
HALF-YEAR 2019 RESULTS London | 27 September 2019
Conference Call ADES’s management team will present the 1H 2019 results and will be available for a Q&A session with
analysts and investors on Monday 30 September 2019 at 14:00 GMT. For conference call details, please
email [email protected].
Enquiries ADES International Holding
Hussein Badawy
Investor Relations Officer
+2 (0)2527 7111
Instinctif
David Simonson [email protected] +44 (0)20 7457 2020
Dinara Shikhametova [email protected] +44 (0)20 7457 2020
Sarah Hourahane [email protected] +44 (0)20 7457 2020
About ADES International Holding (ADES) ADES International Holding extends oil and gas drilling and production services through its subsidiaries and is a leading service
provider in the Middle East and North Africa, offering onshore and offshore contract drilling as well as workover and production
services. Its c.4,000 employees serve clients including major national oil companies (“NOCs”) such as Saudi Aramco and Kuwait Oil
Company as well as joint ventures of NOCs with global majors including BP and Eni. While maintaining a superior health, safety and
environmental record, the Group currently has a fleet of 13 jack-up offshore drilling rigs, 36 onshore drilling rigs, 1 jack-up barge, and
1 mobile offshore production unit (“MOPU”), which includes a floating storage and offloading unit. For more information,
visit investors.adihgroup.com.
Shareholder Information LSE: ADES INT.HDG
Bloomberg: ADES:LN
Listed: May 2017
Shares Outstanding: 43.8 million
Forward-Looking Statements This communication contains certain forward-looking statements. A forward-looking statement is any statement that does not relate to historical facts and events, and can be identified by the use of such words and phrases as “according to estimates”, “aims”, “anticipates”, “assumes”, “believes”, “could”, “estimates”, “expects”, “forecasts”, “intends”, “is of the opinion”, “may”, “p lans”, “potential”, “predicts”, “projects”, “should”, “to the knowledge of”, “will”, “would” or, in each case their negatives or other similar expressions, which are intended to identify a statement as forward-looking. This applies, in particular, to statements containing information on future financial results, plans, or expectations regarding business and management, future growth or profitabi lity and general economic and regulatory conditions and other matters affecting the Group. Forward-looking statements reflect the current views of the Group’s management (“Management”) on future events, which are based on the assumptions of the Management and involve known and unknown risks, uncertainties and other factors that may cause the Group’s actual results, performance or achievements to be materially different from any future results, performance or achievements expressed or implied by these forward-looking statements. The occurrence or non-occurrence of an assumption could cause the Group’s actual financial condition and results of operations to differ materially from, or fail to meet expectations expressed or implied by, such forward-looking statements.
The Group’s business is subject to a number of risks and uncertainties that could also cause a forward-looking statement, estimate or prediction to differ materially from those expressed or implied by the forward-looking statements contained in this prospectus. The information, opinions and forward-looking statements contained in this communication speak only as at its date and are subject to change without notice. The Group does not undertake any obligation to review, update, confirm or to release publicly any revisions to any forward-looking statements to reflect events that occur or circumstances that arise in relation to the content of this communication.
5 | ADES International Holding PLC
HALF-YEAR 2019 RESULTS London | 27 September 2019
Operational & Financial Review
Revenue
Consolidated revenue grew by 176.0% year-on-year to record US$ 219.9 million for 1H 2019. ADES’s rapid
growth during the period was supported by the increasing contribution from the newly acquired rigs as well
as a ramp up of utilisation rates. ADES operated 36 onshore and offshore rigs during 1H 2019, up significantly
from the 14 rigs operated one year previously on the back of the Group’s acquisitions during the period.
ADES was also able to operate at an average fleet utilisation rate of 95% in 1H 2019, up from 80% in 1H
2018.
The three offshore rigs acquired from Nabors in June 2018 and the 31 onshore drilling rigs acquired from
Weatherford in February 2019 (of which 22 were operational as at 30 June 2019) accounted for 62% of
ADES’s consolidated revenue in 1H 2019.
Revenue by Country
(US$ '000) 1H2019 1H2018 % change
KSA 121,008 29,663 308 %
Egypt 43,571 44,340 -2 %
Algeria 16,305 5,727 185 %
Kuwait 39,057 - -
Total 219,941 79,700 176%
Revenue Contribution by Country
(%) 1H2019 1H2018 % change
KSA 55% 37% 18 pts
Egypt 20% 56% -36 pts
Algeria 7% 7% 0 pts
Kuwait 18% - 18 pts
ADES’s Egyptian operations generated revenues of US$ 43.6 million during 1H 2019, broadly in line with
prior year. As a result of growing revenues from the Nabors and Weatherford acquisitions in KSA, Kuwait
and Algeria, revenues from Egypt declined as a percentage of the Group’s top line in 1H 2019, coming in at
20% against 56% one year previously. ADES continues to pursue opportunities for strengthening its presence
in Egypt, where it has renewed all its contracts that were up for expiry and was awarded a new two-year
contract for its Admarine IV jack-up rig by a leading energy company.
Operations in Saudi Arabia yielded revenues of US$ 121.0 million in 1H 2019, up 308% year-on-year. As
a percentage of ADES’s consolidated top line, Saudi revenues rose by 18 percentage points to reach 55%
during the period. ADES significantly deepened its operational presence in the Saudi market acquiring three
Nabors rigs and 11 Weatherford rigs. All three Nabors rigs contributed to ADES’s consolidated revenues in
1H 2019, while nine out of the 11 Weatherford rigs were contracted and operating at the time of purchase in
end of November 2018.
ADES is committed to expanding its presence in Saudi Arabia and Kuwait, with the Group’s ability to achieve
scale in these markets being the key driver for generating sustainable organic growth over the long run. The

6 | ADES International Holding PLC
HALF-YEAR 2019 RESULTS London | 27 September 2019
Group has secured two onshore drilling contracts in Saudi Arabia for which it has purchased two new-build
assets, ADES 13 and ADES 14. Operations on these contracts are due to commence during 4Q 2019.
Kuwaiti operations generated US$ 39.1 million in revenues during 1H 2019, forming 18% of ADES’s
consolidated top line for the period. The Group entered the Kuwaiti market after finalising the Kuwait segment
of the Weatherford transaction in November 2018, with 12 onshore rigs added to the Group’s fleet, out of
which eight were contracted. In 1H 2019, four out of the eight contracted rigs were undergoing upgrade
projects, with two reaching completion during the period and delivering a minor contribution to Group revenue.
Upgrade works on the third rig were completed 3Q 2019 while works on the fourth and final rig are scheduled
for completion during 4Q 2019.
Revenues from Algeria came in at US$ 16.3 million in 1H 2019, up by 185% year-on-year on the back of
ADES’s acquisition of three operational onshore rigs from Weatherford. The Group strengthened its position
in the Algerian market during 1H 2019, securing a new contract for its onshore rig ADES II that commenced
operations during the last week of 1H 2019. Algeria’s total contribution to revenue remained stable at 7% in
1H 2019.
Assets by Country & Type as at 30 June 2019
Onshore Rig Offshore Rig Jack-up Barge MOPU
KSA 15 6 - -
Egypt 1 7 1 1
Algeria 8 - - -
Kuwait 12 - -
Total Assets 36 13 1 1
Revenue by Segment
(US$ '000) 1H2019 1H2018 % change
Offshore Drilling & Workover 85,364 58,042 47%
Onshore Drilling & Workover 109,820 5,371 1945%
MOPU 12,810 12,737 1%
Jack-Up Barge & Projects 6,123 2,247 173%
Others 5,823 1,303 347%
Total 219,940 79,700 176%
Offshore Drilling & Workover (39% of revenues in 1H 2019)
ADES currently conducts its offshore drilling and workover services in Egypt and KSA, focusing on
shallow/ultra-shallow water and non-harsh environments.
Offshore Drilling & Workover booked revenues of US$ 85.4 million in 1H 2019, rising 47% year-on-year to
contribute 39% of ADES’ consolidated top line in 1H 2019 against 73% one year previously. ADES operated
a fleet of 12 offshore rigs as at 30 June 2019. The period’s improved performance was driven by the growing
contribution of three rigs purchased from Nabors in June 2018.

7 | ADES International Holding PLC
HALF-YEAR 2019 RESULTS London | 27 September 2019
Onshore Drilling & Workover (50% of revenues in 1H 2019)
Onshore Drilling & Workover activities generated revenues of US$ 109.8 million in 1H 2019, an increase of
194% year-on-year. As a percentage of consolidated revenues, the segment contributed 50% in 1H 2019
against 7% one year previously. ADES operated a fleet of 21 onshore rigs as at 30 June 2019. The bulk of
the rigs in ADES’s onshore fleet were acquired through the Group’s transaction with Weatherford, series of
closing by end of 2018 and finalized in February 2019. The acquisition included the purchase of 31 onshore
drilling rigs in Kuwait, Saudi Arabia, Algeria.
MOPU (6% of revenues in 1H 2019)
MOPU services, Admarine I, located in Egypt, is currently under contract to process, store and offload crude
oil, which provided revenues of US$ 12.8 million in 1H 2019. The contribution to total revenues from MOPU
services decreased to 6% in 1H 2019 from 16% in 1H 2018, reflecting the effect of asset acquisitions at
ADES’ Offshore and Onshore Drilling & Workover segments.
Jack-Up Barge & Projects (3% of revenues in 1H 2019)
As part of its offshore offering, ADES owns an offshore jack-up barge, Admarine II, which is currently
contracted to GUPCO in the Gulf of Suez area of Egypt. Project revenue is primarily generated from
contracting fees charged to clients for outsourcing various operating projects, such as maintenance,
construction and repair services, to third-party personnel.
Revenue from the Company’s Jack-Up Barge & Projects was US$ 6.1 million in 1H 2019, up 173% year-on-
year versus the US$ 2.2 million recorded in 1H 2018 and represented 3% to total revenue in 1H 2019 broadly
in line with prior year.
Others (2% of revenues in 1H 2019)
Other revenue, which includes catering revenue and the rental of essential operating equipment that the
client has not supplied, was US$ 5.8 million in 1H 2019, representing 2% of total revenue.
Operating Profit
Operating profit recorded US$ 58.2 million during the first half of 2019, an increase of 136.6% year-on-year
from US$ 24.6 million in 1H 2018.
ADES’s EBITDA reached US$ 90.1 million in 1H 2019, up by 138.4% year-on-year against the US$ 37.8
million booked one year previously. Broadly in line with management’s guidance, the Group’s EBITDA margin
was 40.9% in 1H 2019 compared to 47.4% during the same period last year. EBITDA margin contraction was
driven by ADES’s growing operational footprint in KSA and Kuwait, where drilling and workover operations
impose higher operational costs than in Egypt and Algeria, as well as the Group’s significantly expanded
onshore operations.
Finance Charges
Finance charges came in at US$ 52.7 million in 1H 2019, up 266.2% year-on-year from US$ 14.4 million
recorded in 1H 2018. Higher finance charges during the six-month period came as the Group secured new
banking facilities and issued a successful maiden 5-year bond which provided additional liquidity, headroom
and financial flexibility. Additionally, to support business growth post acquisition, ADES replaced the Letters
of Guarantee associated with the Weatherford rigs.
8 | ADES International Holding PLC
HALF-YEAR 2019 RESULTS London | 27 September 2019
Finance costs include a one-off transaction charge of US$ 25.1 million (US$ 4.4 million during 1H 2018)
relating to the unamortised and written-off portion of fees on a refinanced debt facility.
Recurring net finance charges for the Group were US$ 27.6 million in 1H 2019 and are expected, as
previously disclosed, to be higher than originally anticipated on a full-year basis.
Normalised and Statutory Net Profit
Normalised net profit came in at US$ 33.2 million in 1H 2019, which excludes the non-recurring charges
(mentioned below) amounting to US$ 21.1 million from the net profit of the period before the non-controlling
interest. This represents an increase of 136.7% year-on-year from a normalised net profit of US$ 14.0 million
in 1H 2018. Normalised net profit margin stood at 15.1% in 1H 2019 and was impacted by higher finance
charges linked to ADES’s optimisation of its capital structure.
ADES’ net profit after minority interest was US$ 11.0 million in 1H 2019, a decrease of 39.6% year-on-year
from the US$ 18.2 million in 1H 2018, with a net profit margin of 5.0%. The decrease was driven by significant
non-recurring charges, including
o One-off transaction charge of US$ 25.1 million (US$ 4.4 million during 1H 2018) relating to the
unamortised and written-off portion of fees on a refinanced debt facility;
o Accounting adjustments stemming from IFRS 3 (Business Combinations) and a bargain purchase
gain of US$ 20.3 million;
o Non-cash, equity-settled share-based payment compensation from the Parent Company of US$ 7.5
million;
o Non-cash fair-value adjustments under financial instruments of US$ 4.5 million; and
o Non-recurring transactions impacts of US$ 4.4 million.
Balance Sheet
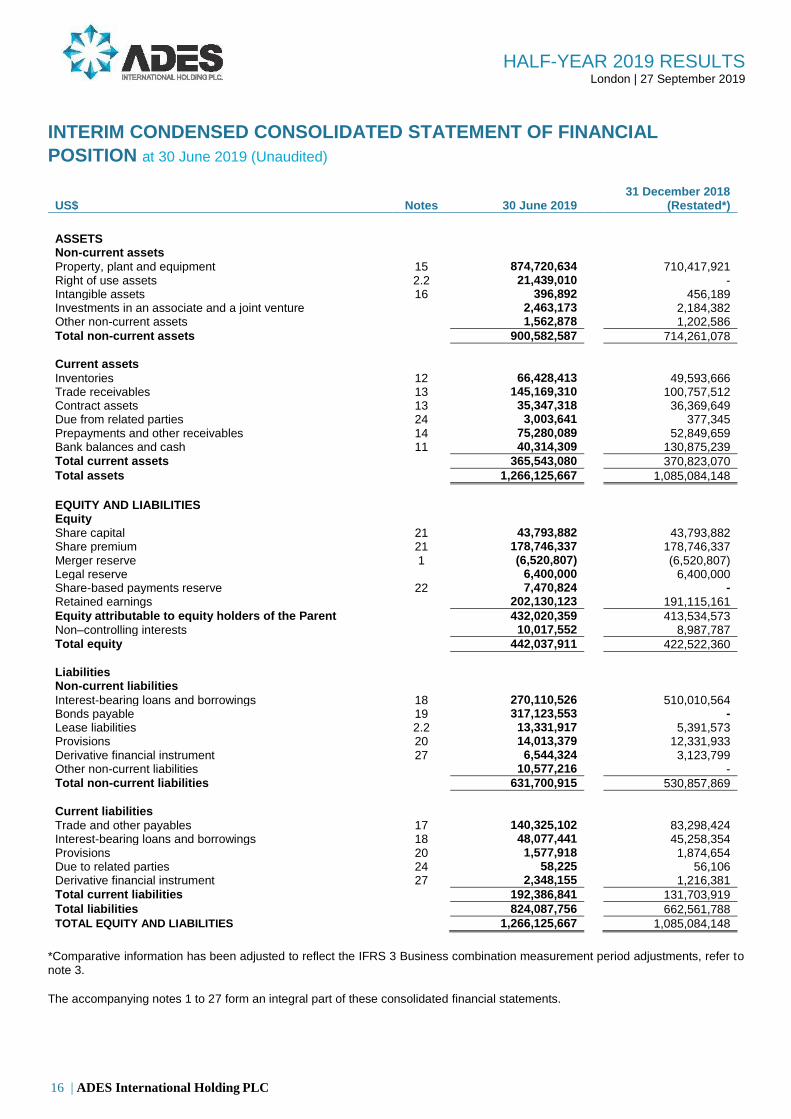
Assets
Total assets stood at US$ 1,266.1 million as at 30 June 2019, up from US$ 1,085.0 million as at 31 December
2018. The movement of US$ 181.0 million in total assets is mainly attributed to the growth in our net fixed
assets on account of the acquisition of the Algerian and South Iraqi land rigs from Weatherford; significant
investment to purchase two new-build land rigs in KSA; capital expenditures related to upgrade works on
ADES’ rigs; and accounting adjustments stemming from IFRS 3 (Business Combinations) on the fair value
of the rigs in 30 June 2019 and 31 December 2018.
Accounts receivable increased to US$ 145.2 million as at 30 June 2019 from US$ 100.8 million as at 31
December 2018, with the increase being driven by higher Group revenues. ADES’ days sales outstanding
(DSO) has improved, decreasing from 149 days in 31 December 2018 to 101 days in 30 June 2019, driven
by the Group’s focus on working capital and reflecting the impact of the Group’s growing business in Saudi
and Kuwait which traditionally support lower DSO when compared against the Group’s other markets.
Total Equity and Liabilities
Total Equity and Liabilities stood at US$ 1,266.1 million as at 30 June 2019, up from US$ 1,085.0 million as at 31 December 2018. The increase is mainly attributed to the Group’s equity base driven by the net profit; accounting adjustments incurred during the period; and an increase in interest-bearing loans and borrowings.
9 | ADES International Holding PLC
HALF-YEAR 2019 RESULTS London | 27 September 2019
The Group’s total interest-bearing loans and borrowings grew by US$ 80.0 million from US$ 555.4 million as at 31 December 2018 to US$ 635.3 million as at 30 June 2019. The increase came as ADES worked to optimise its capital structure, including the issuance of a maiden 5-year US$ 325 million bond utilised to refinance the US$ 450 million syndication facility secured in March 2018 of which US$ 337.9 million was drawn. During the period, ADES’s also secured a US$ 144 million top-up to its Alinma facility to fund operational growth, of which US$ 80 million were utilised at the close of the first half of 2019. Net debt increased to US$ 615.7 million (on a post-IFRS16 basis) as at 30 June 2019 reflecting the increase
in interest-bearing loans and borrowings to finance a period of significant investment, including the purchase
of two new-build land rigs in KSA, capital expenditures related to upgrade works on ADES’s rigs and
completion of the Weatherford acquisition. Net debt was US$ 600.7 million (On a pre-IFRS16 basis), not
considering the accounting adjustments for adopting IFRS 16, impacting on the statement of financial position
with increase to Finance lease liabilities of US$ 15.0 million as at 30 June 2019:
Accounts payable increased to US$ 80.8 million as at 30 June 2019 from US$ 37.4 million as at 31 December
2018. The increase was driven primarily by the growth in the Company’s operating expenses. ADES’s days
payable outstanding (DPO) has recorded decreased to 100 days in 30 June 2019 compared to 157 days in
31 December 2018.
Cash Flow
Cash Flow by Activity
(US$ '000) 1H2019 1H2018 % change
Cash Flow from Operating Activities 61,537 904 6,702%
Net Cash Flow Used in Investing Activities (176,759) (88,506) 100%
Net Cash Flows from Financing Activities 24,661 69,881 -65%
Cash Flow from Operating Activities
As of 30 June 2019, net cash flow from operating activities was US$ 61.5 million, up 6,702% compared to
US$ 0.9 million in 30 June 2018. The increase was primarily due to the Group’s operating 36 onshore and
offshore rigs by the end of 1H 2019, up significantly from the 14 rigs operated one year previously. During
1H 2019, ADES has recorded working capital improvements following its expanded presence in Saudi Arabia
and Kuwait which both support a shorter working capital cycle. The Group expects working capital and free
cash flow generation to improve further in 2H 2019, driven by the deployment of further assets.
Net Cash Flow Used in Investing Activities
As of 30 June 2019, net cash flow used in investing activities was US$ 176.8 million versus a negative US$
88.5 million in 30 June 2018. The increase in cash used was driven by the acquisition of the Algerian and
South Iraqi land rigs from Weatherford; significant investment to purchase two new-build land rigs in KSA;
capital expenditures related to upgrade works on ADES’s rigs. In 2H 2019, the Group expects its capital
expenditures to be significantly lower than 1H 2019.
Net Cash Flow from Financing Activities
10 | ADES International Holding PLC
HALF-YEAR 2019 RESULTS London | 27 September 2019
As of 30 June 2019, net cash flow from financing activities was US$ 24.7 million, down 65% compared to
US$ 69.9 million in 30 June 2018. The cash in during H1 2019 represents utilisation of overdraft facilities of
US$ 5.6 million; and the 5-year US$ 325 million bond issued which was utilised to refinance US$ 337.9 million
of the US$ 450 million syndication facility secured in March 2018; and US$ 80 million utilised from the secured
US$ 144 million top-up from KSA based Alinma facility to fund operational growth.
Interest and finance lease liabilities paid during the period amounted to US$ 35.1 million. As noted above,
finance charges (on a recurring basis) will be higher on a full year basis than expected, with a modest impact
on the Group’s normalized net profit for the full year. Deleveraging to commence in 2020 with the repayment
of loans following the expiry of the grace period in June 2020 for the KSA-based loans, and an expected
steady improvement in Net Debt / EBITDA with the full-year impact of the newly acquired assets combined
with our prudent financial policies.
11 | ADES International Holding PLC
HALF-YEAR 2019 RESULTS London | 27 September 2019
Principal Risks and Uncertainties
As in any corporation, ADES is exposed to risks and uncertainties that may adversely affect its performance.
The Board and senior management agree that the principal risks and uncertainties facing the Group include
political and economic situation in Egypt, Algeria, Kuwait and KSA and the rest of the Middle East and North
Africa region, foreign currency supply and associated risks, changes in regulation and regulatory actions,
environmental and occupational hazards, failure to maintain the Group's high quality standards and
accreditations, failure to retain or renew contracts with clients, failure to recruit and retain skilled personnel
and senior management, pricing pressures and decreased business activity in the oil and gas industry,
among others.
Going Concern
The Directors are satisfied that the Group has sufficient resources to continue in operation for the foreseeable
future, a period of not less than 12 months from the date of this report. Accordingly, the Directors continue to
adopt the going concern basis in preparing the condensed financial statements. The Group’s Financial
Statements for the half year ended 30 June 2019 are available on the Group’s website at
investors.adihgroup.com
Statement of Directors' Responsibilities
Each of the Directors confirms that, to the best of their knowledge:
The interim financial statements, which has been prepared in accordance with International
Financial Reporting Standards (“IFRS”), give a true and fair view of the assets, liabilities, financial
position and profit or loss of the Group as a whole as required by DTR 4.2.4; and
The interim management report includes a fair review of the information as required by:
o DTR 4.2.7R of the Disclosure and Transparency Rules, being an indication of the important
events that have occurred during the six months of the current financial year and their impact
on the interim financial information and a description of the principal risks for the remaining
six months of the year; and
o DTR 4.2.8R of the Disclosure and Transparency Rules, being related party transactions that
have taken place in the first six months of the current financial year and that have materially
impacted the financial position or performance of the Group during the period and any
material changes in the related party transactions described in the Group's Annual Report
and Accounts for the year ended 31 December 2018.
After making enquiries, the Directors considered it appropriate to adopt the going concern basis in
preparing the consolidated financial statements.
A list of current directors of the Company is maintained on the Group’s website at investors.adihgroup.com.
On behalf of the Board
Dr. Mohamed Farouk
Chief Executive Officer

12 | ADES International Holding PLC
HALF-YEAR 2019 RESULTS London | 27 September 2019
Terms and Definitions
EBITDA - Operating profit for the year before depreciation and amortisation, employee benefit provision and
other provisions and impairment of assets under construction and share-based payments expense.
LTM Proforma EBITDA – actual last twelve-month (LTM) EBITDA for the existing business, that includes
the number of operating rigs for the last 12 months (16 rigs), plus the expected annualized EBITDA for the
newly contracted rigs (24 rigs).
Backlog - means the total amount payable to the Group during the remaining term of an existing contract
plus any optional client extension provided for in such contract, assuming the contracted rig will operate (and
thus receive an operating day rate) for all calendar days both in the remaining term and in the optional
extension period.
DSO – Days Sales Outstanding.
DSO ratio = Average net accounts receivable / (year-to-date sales / reporting period days)
DPO – Days Payable Outstanding.
DPO ratio = Average net trade and note payables / (year-to-date cost of revenue / reporting period days)
MENA – The Middle East and North Africa.
Parent Company – ADES Investments Holding.Ltd.
Normalised Net Profit – Net profit before non-controlling interest after excluding non-recurring charges from:
a) non-cash amortized prepaid transaction costs written off due to debt refinancing; b) accounting
adjustments related to IFRS 3 (Business Combinations) and a one-off bargain purchase gain; c) non-cash,
equity-settled share-based payment compensation from the parent company; d) non-cash fair-value
adjustments under financial instruments; and e) non-recurring transactions.
Recordable Injury Frequency Rate (RIFR) – The number of fatalities, lost time injuries, cases or substitute
work and other injuries requiring medical treatment by a medical professional per 200,000 working hours.
KSA –The Kingdom of Saudi Arabia.
Utilisation Rate –refers to our measure of the extent to which our assets under contract and available in the
operational area are generating revenue under client contracts. We calculate our utilisation rate for each rig
by dividing Utilisation Days by Potential Utilisation days under a contract. Utilisation rates are principally
dependent on our ability to maintain the relevant equipment in working order and our ability to obtain
replacement and other spare parts. Because our measure of utilisation does not include rigs that are stacked
or being refurbished or mobilised, our reported utilisation rate does not reflect the overall utilisation of our
fleet, only of our operational, contracted rigs.
Gross Debt – Total interest-bearing loans and borrowings and total finance lease liability.
Net Debt – Total gross debt minus cash and cash equivalents.
13 | ADES International Holding PLC
HALF-YEAR 2019 RESULTS London | 27 September 2019
ADES International Holding PLC
(formerly “ADES International
Holding Ltd”)
and its Subsidiaries
UNAUDITED INTERIM CONDENSED
CONSOLIDATED FINANCIAL STATEMENTS
30 June 2019

14 | ADES International Holding PLC
HALF-YEAR 2019 RESULTS London | 27 September 2019
REPORT ON REVIEW OF INTERIM CONDENSED CONSOLIDATED FINANCIAL STATEMENTS TO THE SHAREHOLDERS OF ADES INTERNATIONAL HOLDING PLC AND ITS SUBSIDIARIES
Introduction We have reviewed the accompanying interim condensed consolidated statement of financial position of ADES International Holding plc (the “Company”) and its subsidiaries (the “Group”) as of 30 June 2019 and the related interim condensed consolidated statements of comprehensive income, changes in equity and cash flows for the six-months period then ended, and explanatory notes. Management is responsible for the preparation and presentation of these interim condensed consolidated financial statements in accordance with International Accounting Standard 34 Interim Financial Reporting (“IAS 34”). Our responsibility is to express a conclusion on these interim condensed consolidated financial statements based on our review. Scope of Review We conducted our review in accordance with International Standard on Review Engagements 2410, “Review of Interim Financial Information Performed by the Independent Auditor of the Entity”. A review of interim financial information consists of making inquiries, primarily of persons responsible for financial and accounting matters, and applying analytical and other review procedures. A review is substantially less in scope than an audit conducted in accordance with International Standards on Auditing and consequently does not enable us to obtain assurance that we would become aware of all significant matters that might be identified in an audit. Accordingly, we do not express an audit opinion. Conclusion Based on our review, nothing has come to our attention that causes us to believe that the accompanying interim condensed consolidated financial statements are not prepared, in all material respects, in accordance with IAS 34. For Ernst & Young Signed by: Anthony O’Sullivan Partner 26 September 2019 Dubai, United Arab Emirates

15 | ADES International Holding PLC
HALF-YEAR 2019 RESULTS London | 27 September 2019
INTERIM CONDENSED CONSOLIDATED STATEMENT OF COMPREHENSIVE INCOME for the six months period ended 30 June 2019 (Unaudited)
US$ Notes 30 June 2019 30 June 2018
(Restated*)
Revenue from contract with customers 6 219,940,465 79,700,571
Cost of revenue 7 (128,511,093) (40,490,051)
GROSS PROFIT 91,429,372 39,210,520
General and administrative expenses 8 (23,992,501) (13,057,546)
End of service provision 20 (1,745,191) (290,320)
Share-based payment expense 22 (7,470,824) -
Provision for impairment of trade receivables 13 - (1,250,607)
OPERATING PROFIT 58,220,856 24,612,047
Finance costs 9 (52,676,090) (14,384,580)
Finance income 11 123,982 2,032,444
Bargain purchase gain 5 20,340,755 8,623,894
Business acquisition transaction costs (4,383,022) -
Other income 378,203 -
Other taxes (80,250) (661,893)
Other expenses (1,093,385) (1,108,551)
Fair value loss on derivative financial instrument 27 (4,552,297) -
PROFIT FOR THE YEAR BEFORE INCOME TAX 16,278,752 19,113,361
Income tax expense 10 (4,234,025) (867,641)
PROFIT FOR THE YEAR 12,044,727 18,245,720
OTHER COMPREHENSIVE INCOME - -
TOTAL COMPREHENSIVE INCOME 12,044,727 18,245,720
Attributable to:
Equity holders of the Parent 11,014,962 18,245,720
Non-controlling interests 1,029,765 -
12,044,727 18,245,720
Earnings per share - basic and diluted attributable to equity holders of the Parent (US$ per share)
23 0.25 0.43
*Comparative information has been adjusted to reflect the IFRS 3 Business combination measurement period adjustments, refer to note 3.
The accompanying notes 1 to 27 form an integral part of these consolidated financial statements.
16 | ADES International Holding PLC
HALF-YEAR 2019 RESULTS London | 27 September 2019
INTERIM CONDENSED CONSOLIDATED STATEMENT OF FINANCIAL
POSITION at 30 June 2019 (Unaudited)
US$ Notes 30 June 2019 31 December 2018
(Restated*)
ASSETS Non-current assets Property, plant and equipment 15 874,720,634 710,417,921 Right of use assets 2.2 21,439,010 - Intangible assets 16 396,892 456,189 Investments in an associate and a joint venture 2,463,173 2,184,382 Other non-current assets 1,562,878 1,202,586
Total non-current assets 900,582,587 714,261,078
Current assets Inventories 12 66,428,413 49,593,666 Trade receivables 13 145,169,310 100,757,512 Contract assets 13 35,347,318 36,369,649 Due from related parties 24 3,003,641 377,345 Prepayments and other receivables 14 75,280,089 52,849,659 Bank balances and cash 11 40,314,309 130,875,239
Total current assets 365,543,080 370,823,070
Total assets 1,266,125,667 1,085,084,148
EQUITY AND LIABILITIES Equity Share capital 21 43,793,882 43,793,882 Share premium 21 178,746,337 178,746,337 Merger reserve 1 (6,520,807) (6,520,807) Legal reserve 6,400,000 6,400,000 Share-based payments reserve 22 7,470,824 -
Retained earnings 202,130,123 191,115,161
Equity attributable to equity holders of the Parent 432,020,359 413,534,573 Non–controlling interests 10,017,552 8,987,787
Total equity 442,037,911 422,522,360
Liabilities Non-current liabilities Interest-bearing loans and borrowings 18 270,110,526 510,010,564 Bonds payable 19 317,123,553 -
Lease liabilities 2.2 13,331,917 5,391,573 Provisions 20 14,013,379 12,331,933 Derivative financial instrument 27 6,544,324 3,123,799 Other non-current liabilities 10,577,216 -
Total non-current liabilities 631,700,915 530,857,869
Current liabilities Trade and other payables 17 140,325,102 83,298,424 Interest-bearing loans and borrowings 18 48,077,441 45,258,354 Provisions 20 1,577,918 1,874,654 Due to related parties 24 58,225 56,106 Derivative financial instrument 27 2,348,155 1,216,381
Total current liabilities 192,386,841 131,703,919
Total liabilities 824,087,756 662,561,788
TOTAL EQUITY AND LIABILITIES 1,266,125,667 1,085,084,148
*Comparative information has been adjusted to reflect the IFRS 3 Business combination measurement period adjustments, refer to note 3.
The accompanying notes 1 to 27 form an integral part of these consolidated financial statements.

17 | ADES International Holding PLC
HALF-YEAR 2019 RESULTS London | 27 September 2019
INTERIM CONDENSED CONSOLIDATED STATEMENT OF CHANGES IN EQUITY For the six months period ended 30 June 2019 (Unaudited)
US$ Share
capital Share
premium Merger reserve
Legal reserve
Share-based
payment reserve
Retained earnings Total
Non-controlling
interests Total
Equity
Balance at 1 January 2019, restated*
43,793,882
178,746,337
(6,520,807)
6,400,000 -
191,115,161
413,534,573
8,987,787
422,522,360
Profit for the period - - - - -
11,014,962
11,014,962
1,029,765
12,044,727
Other comprehensive income for the period - - - - - - - - -
Total comprehensive income for the period - - - - -
11,014,962
11,014,962
1,029,765
12,044,727
Share-based payments - - - -
7,470,824 -
7,470,824
-
7,470,824
Balance at 30 June 2019
43,793,882
178,746,337
(6,520,807)
6,400,000
7,470,824
202,130,123
432,020,359
10,017,552
442,037,911
As at 1 January 2018
42,203,030
158,224,346
(6,520,807)
6,400,000 -
117,703,129
318,009,698
-
318,009,698
Profit for the period, restated* - - - - -
18,245,720
18,245,720 -
18,245,720
Other comprehensive income for the period - - - - - - - - -
Total comprehensive income for the period, restated* - - - - -
18,245,720
18,245,720 -
18,245,720
Share capital issued
1,590,852 - - - - -
1,590,852
-
1,590,852
Share premium received -
20,521,991 - - - -
20,521,991
-
20,521,991
Balance at 30 June 2018, restated*
43,793,882
178,746,337
(6,520,807)
6,400,000 -
135,948,849
358,368,261
-
358,368,261
*Comparative information has been adjusted to reflect the IFRS 3 Business combination measurement period adjustments, refer to note 3.
The accompanying notes 1 to 27 form an integral part of these consolidated financial statements.

18 | ADES International Holding PLC
HALF-YEAR 2019 RESULTS London | 27 September 2019
INTERIM CONDENSED CONSOLIDATED STATEMENT OF CASH FLOWS For the six months period ended 30 June 2019 (Unaudited)
US$ Notes
30 June 2019 30 June 2018
(Restated*)
OPERATING ACTIVITIES
Profit for the period before income tax 16,278,752 19,113,361 Adjustments for: Depreciation of property, plant and equipment 15 19,898,160 12,812,921 Amortisation of intangible assets 16 59,297 63,251 Depreciation of right of use assets 2.2 2,669,341 - Provision for impairment of trade receivables and contract assets
13 - 1,250,607
End of services provision 20 1,745,191 - Share-based payments expense 22 7,470,824 - Other provisions - 290,320 Finance costs 9 52,676,090 14,384,580 Finance income 11 (123,982) (2,032,444) Bargain purchase gain 5 (20,340,755) (8,623,894) Share of results of investment in a joint venture and an associate
211,209 -
Fair value loss on derivative financial instrument 27 4,552,299 -
Cash from operations before working capital changes 85,096,426 37,258,702
Inventories (1,380,625) 1,128,240 Trade receivables (44,411,798) (17,447,094) Contract assets 1,022,331 - Due from related parties (2,626,296) (1,786,601) Prepayments and other receivables (25,990,149) (1,358,942) Trade and other payables 52,464,763 (13,501,311) Due to related parties 2,119 (2,060,223)
Cash flows from operations 64,176,771 2,232,771
Income tax paid (2,279,508) (1,266,631) Provisions paid 20 (360,481) (61,498)
Net cash flows from operating activities 61,536,782 904,642
INVESTING ACTIVITIES
Purchase of intangible assets 16 - (12,497) Purchase of property, plant and equipment (100,155,423) (28,275,791) Acquisitions of subsidiaries and new rigs** (76,237,278) (62,250,000) Interest received 123,982 2,032,444 Investment in an associate (490,000) -
Net cash flows used in investing activities (176,758,719) (88,505,844)
FINANCING ACTIVITIES
Proceeds from interest-bearing loans and borrowings 85,585,672 127,007,706 Repayment of interest-bearing loans and borrowings (337,900,000) (27,252,059) Proceeds from bonds issuance 325,000,000 - Payments of loan/bonds transaction costs 19 (12,941,008) (19,806,682) Interest paid (31,688,558) (10,067,862) Payment of lease liabilities 2.2 (3,395,099) - Net cash flows from financing activities 24,661,007 69,881,103
NET DECREASE IN CASH AND CASH EQUIVALENTS (90,560,930) (17,720,099)
Cash and cash equivalents at the beginning of the period 11 130,875,239 136,964,417
CASH AND CASH EQUIVALENTS AT THE END OF THE PERIOD
11 40,314,309 119,244,318
The accompanying notes 1 to 27 form an integral part of these consolidated financial statements. *Comparative information has been adjusted to reflect the IFRS 3 Business combination measurement period adjustments, refer to note 3. **It includes net amounts of cash paid for Algeria, Iraq and Kuwait transactions amounting to USD 57,859,245, USD 12,000,000 and USD 6,378,033, respectively (30 June 2018: USD 62,250,000 for Nabors transaction).
19 | ADES International Holding PLC
HALF-YEAR 2019 RESULTS London | 27 September 2019
NOTES TO THE INTERIM CONDENSED CONSOLIDATED FINANCIAL STATEMENTS at 30 June 2019 (Unaudited)
1 BACKGROUND
Corporate information
ADES International Holding PLC (the “Company” or the “Parent”) was incorporated and registered in the Dubai
International Financial Centre (DIFC) on 22 May 2016 with registered number 2175 under the Companies Law – DIFC
Law No. 2 of 2009 (and any regulations thereunder) as a private company limited by shares. The Company’s shares
are listed on the Main Market of the London Stock Exchange. The Company’s name has changed from ADES
International Holding Ltd to ADES International Holding PLC during 2019. The Company’s registered office is at level 5,
Index tower, Dubai International Financial Centre, PO Box 507118, Dubai, United Arab Emirates. The principal business
activity of the Company is to act as a holding company and managing office. The Company and its subsidiaries (see
below) constitute the Group (the “Group”). The Company is owned by ADES Investments Holding Ltd., a company
incorporated on 22 May 2016 under the Companies Law, DIFC Law no. 2 of 2009.
The Group is a leading oil and gas drilling and production services provider in the Middle East and Africa. The Group
services primarily include offshore and onshore contract drilling and production services. The Group currently operates
in Egypt, Algeria, Kuwait and the Kingdom of Saudi Arabia. The Group’s offshore services include drilling and workover
services and Mobile Offshore Production Unit (MOPU) production services, as well as accommodation, catering and
other barge-based support services. The Group’s onshore services primarily encompass drilling and work over services.
The Group also provides projects services (outsourcing various operating projects for clients, such as maintenance and
repair services).
The interim condensed consolidated financial statements of the Group include activities of the following main
subsidiaries:
Name
Principal activities
Country of incorporation
% equity interest
2019 2018
Advanced Energy Systems (ADES) (S.A.E)*
Oil and gas drilling and production services
Egypt
100%
100%
Precision Drilling Company** Holding company Cyprus 100% 100% Kuwait Advanced Drilling Services
Leasing of rigs Cayman 100% 100%
Prime innovations for Trade S.A.E
Trading Egypt 100% 100%
ADES International for Drilling Leasing of rigs Cayman 100% 100% Advanced Transport Services Leasing of
transportation equipment
Cayman
100%
100%
Advanced Drilling Services Trading Cayman 100% 100%
* Advanced Energy Systems (ADES) (S.A.E) has branches in the Kingdom of Saudi Arabia and Algeria.
** Precision Drilling Company holds 47.5% interest in United Precision Drilling Company W.L.L, a Kuwait entity which handles the operations of the
rigs in Kuwait.
The Company holds investment in Egyptian Chinese Drilling Company (ECDC) (joint venture) and ADVantage for
Drilling Services Company (associate) which are accounted for using equity method of accounting in these interim
condensed consolidated financial statements.
In 2016, pursuant to a reorganisation plan (the “Reorganisation”) the ultimate shareholders of the Subsidiary:
(i) established the Company as a new holding company with share capital of USD 1,000,000 and made an
additional capital contribution of USD 30,900,000 for additional shares that were allotted on 23 March 2018. No such
reorganisations took place in 2019 and 2018.
20 | ADES International Holding PLC
HALF-YEAR 2019 RESULTS London | 27 September 2019
(ii) transferred their shareholdings in Advanced Energy System (ADES) (S.A.E.) to the Company for a total
consideration of USD 38,520,807 comprising of cash of USD 29,710,961 and the assumption of shareholder obligation
of USD 8,809,846.
2 SIGNIFICANT ACCOUNTING POLICIES
2.1 BASIS OF PREPARATION
The interim condensed consolidated financial statements of the Group for the six months period ended 30 June 2019 have been prepared in accordance with International Accounting Standard 34, Interim Financial Reporting. These interim condensed consolidated financial statements have been prepared on the historical cost basis. The consolidated financial statements are presented in United States Dollars (“USD”), which is the Company’s functional and presentation currency. The interim condensed consolidated financial statements do not contain all information and disclosures required for full financial statements prepared in accordance with International Financial Reporting Standards and should be read with the Group’s annual financial statements as at 31 December 2018. The results for the period ended 30 June 2019 are not necessarily indicative of the results that may be expected for the financial year ending 31 December 2019. Basis of consolidation The interim condensed consolidated financial statements comprise the financial statements of the Company and its subsidiaries as at 30 June 2019. Control is achieved when the Group is exposed, or has rights, to variable returns from its involvement with the investee and has the ability to affect those returns through its power over the investee. Specifically, the Group controls an investee if, and only if, the Group has:
(a) Power over the investee (i.e. existing rights that give it the current ability to direct the relevant activities of the investee)
(b) Exposure, or rights, to variable returns from its involvement with the investee, and (c) The ability to use its power over the investee to affect its returns
Generally, there is a presumption that a majority of voting rights results in control. To support this presumption and when the Group has less than a majority of the voting or similar rights of an investee, the Group considers all relevant facts and circumstances in assessing whether it has power over an investee, including:
(a) The contractual arrangement with the other vote holders of the investee (b) Rights arising from other contractual arrangements (c) The Group’s voting rights and potential voting rights
The Group re-assesses whether or not it controls an investee if facts and circumstances indicate that there are changes to one or more of the three elements of control. Consolidation of a subsidiary begins when the Group obtains control over the subsidiary and ceases when the Group loses control of the subsidiary. Assets, liabilities, income and expenses of a subsidiary acquired or disposed of during the year are included in the consolidated financial statements from the date the Group gains control until the date the Group ceases to control the subsidiary.
Profit or loss and each component of other comprehensive income (OCI) are attributed to the equity holders of the parent of the Group and to the non-controlling interests, even if this results in the non-controlling interests having a deficit balance. When necessary, adjustments are made to the consolidated financial statements of subsidiaries to bring their accounting policies into line with the Group’s accounting policies. All intra-group assets and liabilities, equity, income, expenses and cash flows relating to transactions between members of the Group are eliminated in full on consolidation. Subsidiaries are fully consolidated from the date of acquisition or incorporation, being the date on which the Group obtains control, and continue to be consolidated until the date when such control ceases. The Consolidated financial statements of the subsidiaries are prepared for the same reporting period as the Group, using consistent accounting policies.
A change in the ownership interest of a subsidiary, without a loss of control, is accounted for as an equity transaction. If the Group loses control over a subsidiary, it:
- Derecognises the assets (including goodwill) and liabilities of the subsidiary

21 | ADES International Holding PLC
HALF-YEAR 2019 RESULTS London | 27 September 2019
- Derecognises the carrying amount of any non-controlling interests - Derecognises the cumulative translation differences recorded in equity - Recognises the fair value of the consideration received - Recognises the fair value of any investment retained - Recognises any surplus or deficit in profit or loss - Reclassifies the parent’s share of components previously recognised in OCI to profit or loss or retained earnings,
as appropriate, as would be required if the Group had directly disposed of the related assets or liabilities. Business combinations and acquisition of non-controlling interests Business combinations are accounted for using the acquisition method. The cost of an acquisition is measured as the aggregate of the consideration transferred, which is measured at acquisition date fair value, and the amount of any non controlling interests in the acquiree. For each business combination, the Group elects whether to measure the non-controlling interests in the acquiree at fair value or at the proportionate share of the acquiree’s identifiable net assets. Acquisition-related costs are expensed as incurred and included in administrative expenses. When the Group acquires a business, it assesses the financial assets and liabilities assumed for appropriate classification and designation in accordance with the contractual terms, economic circumstances and pertinent conditions as at the acquisition date. This includes the separation of embedded derivatives in host contracts by the acquiree. Contingent consideration, resulting from business combinations, is valued at fair value at the acquisition date. Contingent consideration classified as equity is not remeasured and its subsequent settlement is accounted for within equity. Contingent consideration classified as an asset or liability that is a financial instrument and within the scope of IFRS 9 Financial Instruments, is measured at fair value with the changes in fair value recognised in the consolidated statement of profit or loss in accordance with IFRS 9. Other contingent consideration that is not within the scope of IFRS 9 is measured at fair value at each reporting date with changes in fair value recognised in profit or loss. Goodwill is initially measured at cost (being the excess of the aggregate of the consideration transferred and the amount recognised for non-controlling interests and any previous interest held over the net identifiable assets acquired and liabilities assumed). If the fair value of the net assets acquired is in excess of the aggregate consideration transferred, the Group re-assesses whether it has correctly identified all of the assets acquired and all of the liabilities assumed and reviews the procedures used to measure the amounts to be recognised at the acquisition date. If the reassessment still results in an excess of the fair value of net assets acquired over the aggregate consideration transferred, then the gain is recognised in profit or loss. After initial recognition, goodwill is measured at cost less any accumulated impairment losses. For the purpose of impairment testing, goodwill acquired in a business combination is, from the acquisition date, allocated to each of the Group’s cash-generating units that are expected to benefit from the combination, irrespective of whether other assets or liabilities of the acquiree are assigned to those units. Where goodwill has been allocated to a cash-generating unit (CGU) and part of the operation within that unit is disposed of, the goodwill associated with the disposed operation is included in the carrying amount of the operation when determining the gain or loss on disposal. Goodwill disposed in these circumstances is measured based on the relative values of the disposed operation and the portion of the cash-generating unit retained. A contingent liability recognised in a business combination is initially measured at its fair value. Subsequently, it is measured at the higher of the amount that would be recognised in accordance with the requirements for provisions in IAS 37 Provisions, Contingent Liabilities and Contingent Assets or the amount initially recognised less (when appropriate) cumulative amortisation recognised in accordance with the requirements for revenue recognition.
2.2 NEW STANDARDS AND INTERPRETATIONS
The accounting policies adopted in the preparation of the interim condensed consolidated financial statements are
consistent with those followed in the preparation of the Group’s annual financial statements for the year ended 31
December 2018, except for the adoption of new standards and interpretations as of 1 January 2019.
The Group did not early adopt any standard, interpretation or amendment that was issued but is not yet effective
22 | ADES International Holding PLC
HALF-YEAR 2019 RESULTS London | 27 September 2019
The Group applies, for the first time, IFRS 16 Leases that requires restatement of previous financial statements. As
required by IAS 34, the nature and effect of these changes are disclosed below.
Several other amendments and interpretations apply for the first time in 2019, but do not have an impact on the interim
condensed consolidated financial statements of the Group.
IFRS 16 Leases
IFRS 16 supersedes IAS 17 Leases, IFRIC 4 Determining whether an Arrangement contains a Lease, SIC-15 Operating
Leases-Incentives and SIC-27 Evaluating the Substance of Transactions Involving the Legal Form of a Lease. The
standard sets out the principles for the recognition, measurement, presentation and disclosure of leases and requires
lessees to account for most leases under a single on-balance sheet model.
Lessor accounting under IFRS 16 is substantially unchanged from IAS 17. Lessors will continue to classify leases as
either operating or finance leases using similar principles as in IAS 17. Therefore, IFRS 16 did not have an impact for
leases where the Group is the lessor.
The Group adopted IFRS 16 using a modified retrospective approach. There was no difference recognised in retained
earnings on date of initial application of the standard as the Group adopted the approach whereby the right of use assets
are initially measured equal to the lease liability. The Group elected to use the transition practical expedient allowing
the standard to be applied only to contracts that were previously identified as leases applying IAS 17 and IFRIC 4 at the
date of initial application. The Group also elected to use the recognition exemptions for lease contracts that, at the
commencement date, have a lease term of 12 months or less and do not contain a purchase option (‘short-term leases’),
and lease contracts for which the underlying asset is of low value (‘low-value assets’).
The effect of adoption IFRS 16 is as follows:
Impact on the statement of financial position (increase/(decrease)) as at 1 January 2019:
US$
Assets
Right-of-use assets 16,403,788
Liabilities
Finance Lease Liabilities 16,403,788
a) Nature of the effect of adoption of IFRS 16
The Group has lease contracts for various items of property, plant and equipment. Before the adoption of IFRS 16, the
Group classified each of its leases (as lessee) at the inception date as either a finance lease or an operating lease. A
lease was classified as a finance lease if it transferred substantially all of the risks and rewards incidental to ownership
of the leased asset to the Group; otherwise it was classified as an operating lease. Finance leases were capitalised at
the commencement of the lease at the inception date fair value of the leased property or, if lower, at the present value
of the minimum lease payments. Lease payments were apportioned between interest (recognised as finance costs) and
reduction of the lease liability. In an operating lease, the leased property was not capitalised and the lease payments
were recognised as rent expense in the statement of profit or loss on a straight-line basis over the lease term. Any
prepaid rent and accrued rent were recognised under Prepayments and Trade and other payables, respectively.
Upon adoption of IFRS 16, the Group applied a single recognition and measurement approach for all leases that it is
the lessee, except for short-term leases and leases of low-value assets. The Group recognised lease liabilities to make
lease payments and right-of-use assets representing the right to use the underlying assets.
Leases previously classified as finance leases
The Group did not change the initial carrying amounts of recognised assets and liabilities at the date of initial application
for leases previously classified as finance leases (i.e., the right-of-use assets and lease liabilities equal the lease assets
and liabilities recognised under IAS 17). The requirements of IFRS 16 was applied to these leases from 1 January 2019.
23 | ADES International Holding PLC
HALF-YEAR 2019 RESULTS London | 27 September 2019
Leases previously accounted for as operating leases The Group recognised right-of-use assets and lease liabilities for those leases previously classified as operating leases, except for short-term leases and leases of low-value assets. The right-of-use assets for most leases were recognised based on the carrying amount as if the standard had always been applied, apart from the use of incremental borrowing rate at the date of initial application. In some leases, the right-of-use assets were recognised based on the amount equal to the lease liabilities, adjusted for any related prepaid and accrued lease payments previously recognised. Lease liabilities were recognised based on the present value of the remaining lease payments, discounted using the incremental borrowing rate at the date of initial application. The Group also applied the available practical expedients wherein it:
Used a single discount rate to a portfolio of leases with reasonably similar characteristics
Relied on its assessment of whether leases are onerous immediately before the date of initial application
Applied the short-term leases exemptions to leases with lease term that ends within 12 months at the date of initial application
Excluded the initial direct costs from the measurement of the right-of-use asset at the date of initial application
Used hindsight in determining the lease term where the contract contains options to extend or terminate the lease
b) Summary of new accounting policies Set out below are the new accounting policies of the Group upon adoption of IFRS 16: Right-of-use assets The Group recognises right-of-use assets at the commencement date of the lease (i.e., the date the underlying asset is available for use). Right-of-use assets are measured at cost, less any accumulated depreciation and impairment losses, and adjusted for any remeasurement of lease liabilities. The cost of right-of-use assets includes the amount of lease liabilities recognised, initial direct costs incurred, and lease payments made at or before the commencement date less any lease incentives received. Unless the Group is reasonably certain to obtain ownership of the leased asset at the end of the lease term, the recognised right-of-use assets are depreciated on a straight-line basis over the shorter of its estimated useful life and the lease term. Right-of-use assets are subject to impairment. Lease liabilities At the commencement date of the lease, the Group recognises lease liabilities measured at the present value of lease payments to be made over the lease term. The lease payments include fixed payments (including in-substance fixed payments) less any lease incentives receivable, variable lease payments that depend on an index or a rate, and amounts expected to be paid under residual value guarantees. The lease payments also include the exercise price of a purchase option reasonably certain to be exercised by the Group and payments of penalties for terminating a lease, if the lease term reflects the Group exercising the option to terminate. The variable lease payments that do not depend on an index or a rate are recognised as expense in the period on which the event or condition that triggers the payment occurs. In calculating the present value of lease payments, the Group uses the incremental borrowing rate at the lease commencement date if the interest rate implicit in the lease is not readily determinable. After the commencement date, the amount of lease liabilities is increased to reflect the accretion of interest and reduced for the lease payments made. In addition, the carrying amount of lease liabilities is remeasured if there is a modification, a change in the lease term, a change in the in-substance fixed lease payments or a change in the assessment to purchase the underlying asset. Short-term leases and leases of low-value assets The Group applies the short-term lease recognition exemption to its short-term leases of machinery and equipment (i.e., those leases that have a lease term of 12 months or less from the commencement date and do not contain a purchase option). It also applies the lease of low-value assets recognition exemption to leases of office equipment that are considered of low value (i.e., below USD 5,000). Lease payments on short-term leases and leases of low-value assets are recognised as expense on a straight-line basis over the lease term.
24 | ADES International Holding PLC
HALF-YEAR 2019 RESULTS London | 27 September 2019
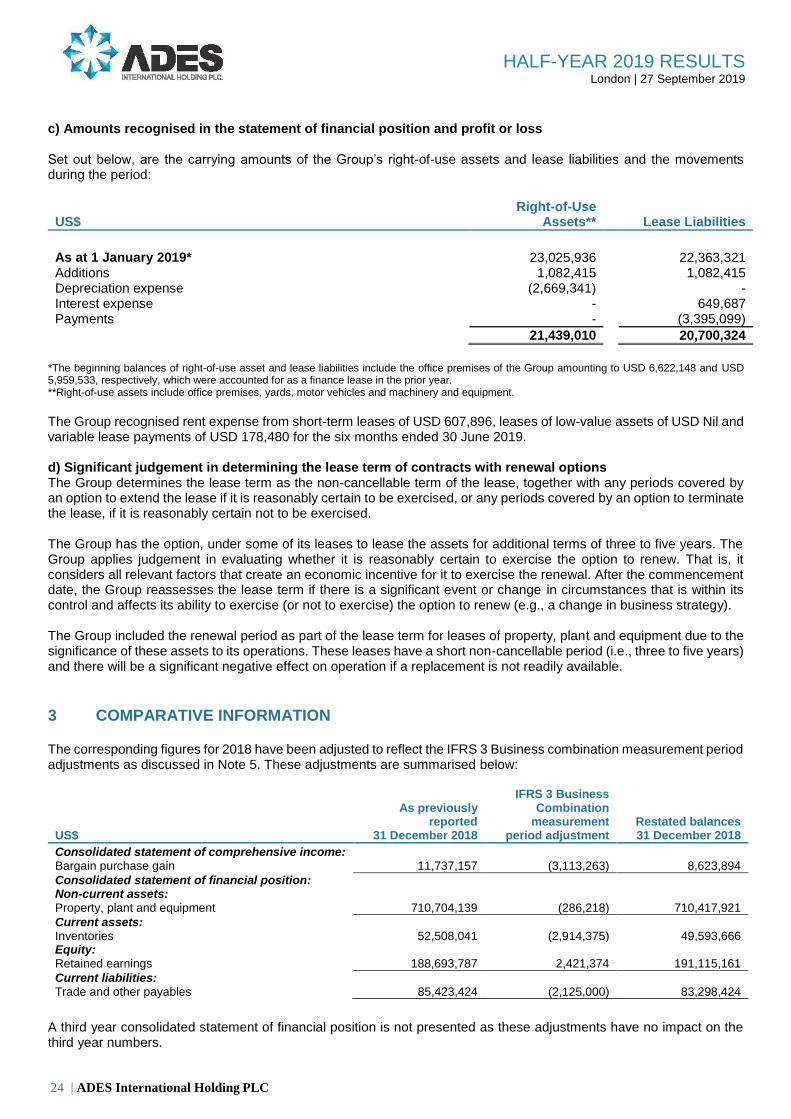
c) Amounts recognised in the statement of financial position and profit or loss Set out below, are the carrying amounts of the Group’s right-of-use assets and lease liabilities and the movements during the period:
US$ Right-of-Use
Assets**
Lease Liabilities
As at 1 January 2019* 23,025,936 22,363,321 Additions 1,082,415 1,082,415 Depreciation expense (2,669,341) - Interest expense - 649,687 Payments - (3,395,099)
21,439,010 20,700,324
*The beginning balances of right-of-use asset and lease liabilities include the office premises of the Group amounting to USD 6,622,148 and USD 5,959,533, respectively, which were accounted for as a finance lease in the prior year. **Right-of-use assets include office premises, yards, motor vehicles and machinery and equipment.
The Group recognised rent expense from short-term leases of USD 607,896, leases of low-value assets of USD Nil and variable lease payments of USD 178,480 for the six months ended 30 June 2019. d) Significant judgement in determining the lease term of contracts with renewal options The Group determines the lease term as the non-cancellable term of the lease, together with any periods covered by an option to extend the lease if it is reasonably certain to be exercised, or any periods covered by an option to terminate the lease, if it is reasonably certain not to be exercised. The Group has the option, under some of its leases to lease the assets for additional terms of three to five years. The Group applies judgement in evaluating whether it is reasonably certain to exercise the option to renew. That is, it considers all relevant factors that create an economic incentive for it to exercise the renewal. After the commencement date, the Group reassesses the lease term if there is a significant event or change in circumstances that is within its control and affects its ability to exercise (or not to exercise) the option to renew (e.g., a change in business strategy). The Group included the renewal period as part of the lease term for leases of property, plant and equipment due to the significance of these assets to its operations. These leases have a short non-cancellable period (i.e., three to five years) and there will be a significant negative effect on operation if a replacement is not readily available.
3 COMPARATIVE INFORMATION The corresponding figures for 2018 have been adjusted to reflect the IFRS 3 Business combination measurement period adjustments as discussed in Note 5. These adjustments are summarised below:
US$
As previously reported
31 December 2018
IFRS 3 Business Combination
measurement period adjustment
Restated balances 31 December 2018
Consolidated statement of comprehensive income: Bargain purchase gain 11,737,157 (3,113,263) 8,623,894
Consolidated statement of financial position: Non-current assets: Property, plant and equipment 710,704,139 (286,218) 710,417,921
Current assets: Inventories 52,508,041 (2,914,375) 49,593,666 Equity: Retained earnings 188,693,787 2,421,374 191,115,161
Current liabilities: Trade and other payables 85,423,424 (2,125,000) 83,298,424
A third year consolidated statement of financial position is not presented as these adjustments have no impact on the third year numbers.
25 | ADES International Holding PLC
HALF-YEAR 2019 RESULTS London | 27 September 2019
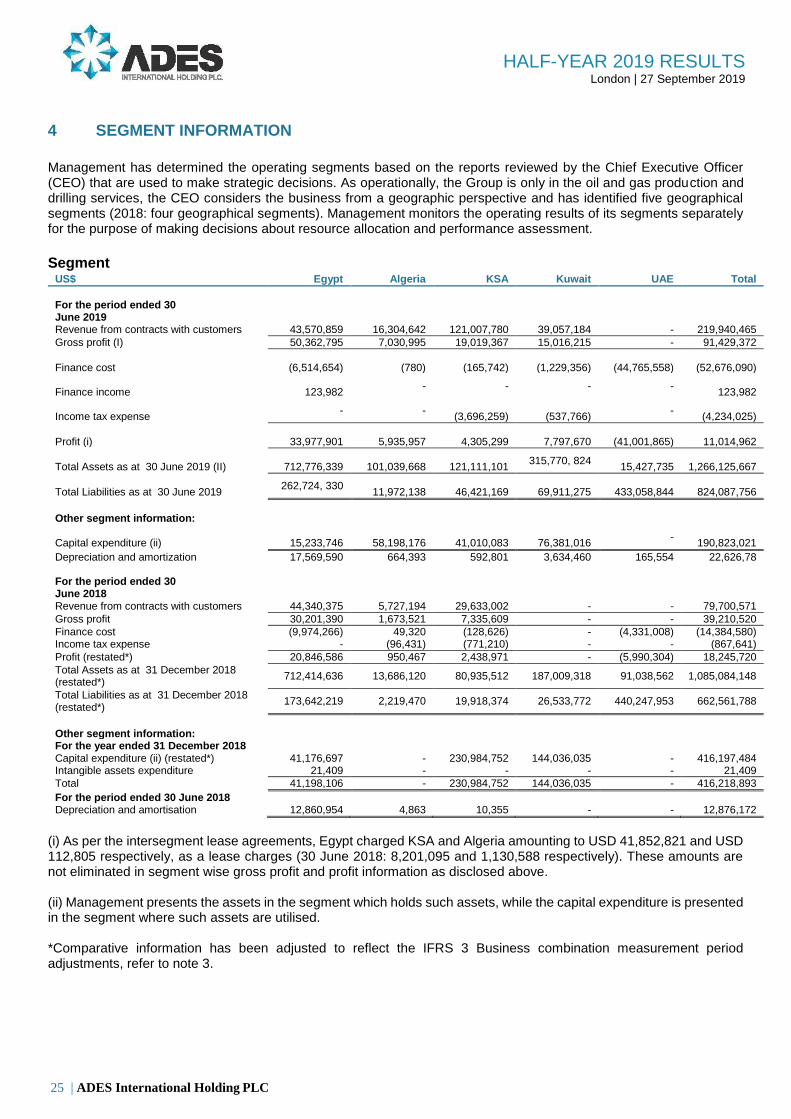
4 SEGMENT INFORMATION
Management has determined the operating segments based on the reports reviewed by the Chief Executive Officer (CEO) that are used to make strategic decisions. As operationally, the Group is only in the oil and gas production and drilling services, the CEO considers the business from a geographic perspective and has identified five geographical segments (2018: four geographical segments). Management monitors the operating results of its segments separately for the purpose of making decisions about resource allocation and performance assessment.
Segment US$ Egypt Algeria KSA Kuwait UAE Total
For the period ended 30 June 2019 Revenue from contracts with customers 43,570,859 16,304,642 121,007,780 39,057,184 - 219,940,465
Gross profit (I) 50,362,795 7,030,995 19,019,367 15,016,215 - 91,429,372
Finance cost
(6,514,654)
(780)
(165,742)
(1,229,356)
(44,765,558)
(52,676,090)
Finance income
123,982 - - - -
123,982
Income tax expense - -
(3,696,259)
(537,766)
-
(4,234,025)
Profit (i)
33,977,901
5,935,957
4,305,299
7,797,670
(41,001,865)
11,014,962
Total Assets as at 30 June 2019 (II)
712,776,339
101,039,668
121,111,101 315,770, 824
15,427,735
1,266,125,667
Total Liabilities as at 30 June 2019 262,724, 330
11,972,138
46,421,169
69,911,275
433,058,844
824,087,756
Other segment information:
Capital expenditure (ii)
15,233,746
58,198,176
41,010,083
76,381,016 -
190,823,021
Depreciation and amortization 17,569,590 664,393 592,801 3,634,460 165,554 22,626,78 For the period ended 30 June 2018
Revenue from contracts with customers 44,340,375 5,727,194 29,633,002 - - 79,700,571
Gross profit 30,201,390 1,673,521 7,335,609 - - 39,210,520
Finance cost (9,974,266) 49,320 (128,626) - (4,331,008) (14,384,580) Income tax expense - (96,431) (771,210) - - (867,641)
Profit (restated*) 20,846,586 950,467 2,438,971 - (5,990,304) 18,245,720
Total Assets as at 31 December 2018 (restated*)
712,414,636 13,686,120 80,935,512 187,009,318 91,038,562 1,085,084,148
Total Liabilities as at 31 December 2018 (restated*)
173,642,219 2,219,470 19,918,374 26,533,772 440,247,953 662,561,788
Other segment information: For the year ended 31 December 2018 Capital expenditure (ii) (restated*) 41,176,697 - 230,984,752 144,036,035 - 416,197,484 Intangible assets expenditure 21,409 - - - - 21,409
Total 41,198,106 - 230,984,752 144,036,035 - 416,218,893
For the period ended 30 June 2018 Depreciation and amortisation 12,860,954 4,863 10,355 - - 12,876,172
(i) As per the intersegment lease agreements, Egypt charged KSA and Algeria amounting to USD 41,852,821 and USD 112,805 respectively, as a lease charges (30 June 2018: 8,201,095 and 1,130,588 respectively). These amounts are not eliminated in segment wise gross profit and profit information as disclosed above. (ii) Management presents the assets in the segment which holds such assets, while the capital expenditure is presented in the segment where such assets are utilised. *Comparative information has been adjusted to reflect the IFRS 3 Business combination measurement period adjustments, refer to note 3.
26 | ADES International Holding PLC
HALF-YEAR 2019 RESULTS London | 27 September 2019
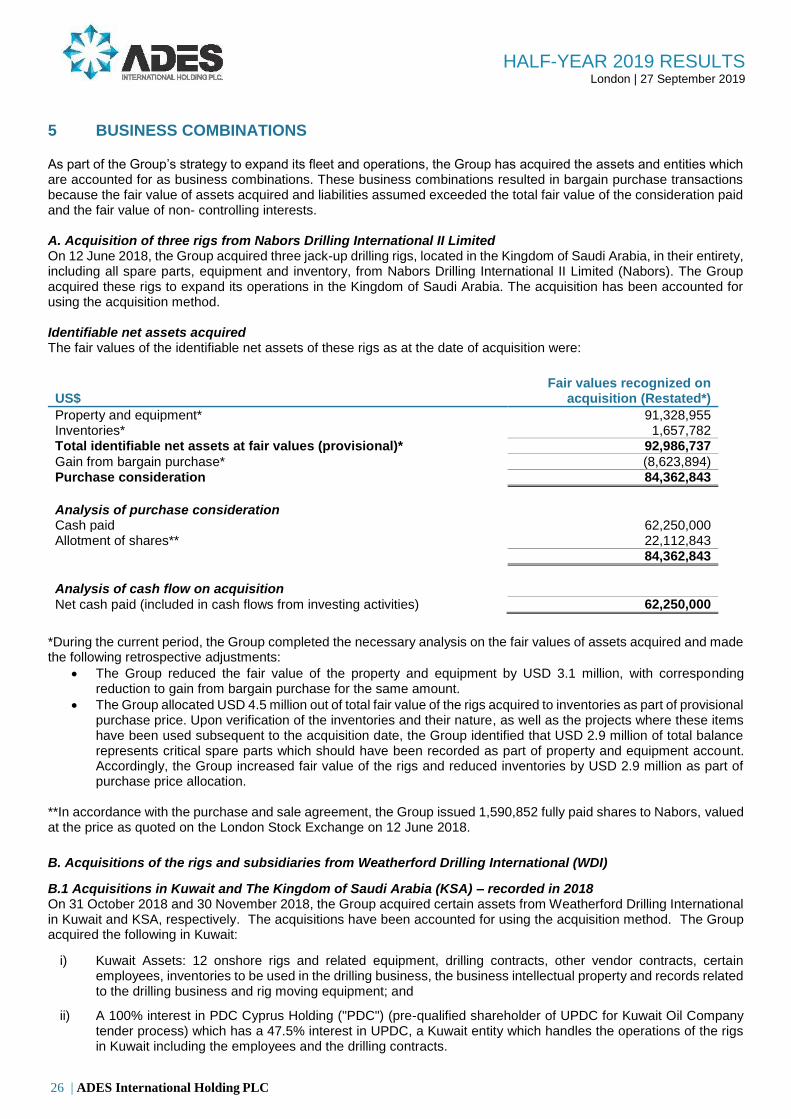
5 BUSINESS COMBINATIONS As part of the Group’s strategy to expand its fleet and operations, the Group has acquired the assets and entities which are accounted for as business combinations. These business combinations resulted in bargain purchase transactions because the fair value of assets acquired and liabilities assumed exceeded the total fair value of the consideration paid and the fair value of non- controlling interests. A. Acquisition of three rigs from Nabors Drilling International II Limited On 12 June 2018, the Group acquired three jack-up drilling rigs, located in the Kingdom of Saudi Arabia, in their entirety, including all spare parts, equipment and inventory, from Nabors Drilling International II Limited (Nabors). The Group acquired these rigs to expand its operations in the Kingdom of Saudi Arabia. The acquisition has been accounted for using the acquisition method. Identifiable net assets acquired The fair values of the identifiable net assets of these rigs as at the date of acquisition were:
US$ Fair values recognized on
acquisition (Restated*)
Property and equipment* 91,328,955 Inventories* 1,657,782 Total identifiable net assets at fair values (provisional)* 92,986,737
Gain from bargain purchase* (8,623,894) Purchase consideration 84,362,843
Analysis of purchase consideration Cash paid 62,250,000 Allotment of shares** 22,112,843
84,362,843
Analysis of cash flow on acquisition
Net cash paid (included in cash flows from investing activities) 62,250,000
*During the current period, the Group completed the necessary analysis on the fair values of assets acquired and made the following retrospective adjustments:
The Group reduced the fair value of the property and equipment by USD 3.1 million, with corresponding reduction to gain from bargain purchase for the same amount.
The Group allocated USD 4.5 million out of total fair value of the rigs acquired to inventories as part of provisional purchase price. Upon verification of the inventories and their nature, as well as the projects where these items have been used subsequent to the acquisition date, the Group identified that USD 2.9 million of total balance represents critical spare parts which should have been recorded as part of property and equipment account. Accordingly, the Group increased fair value of the rigs and reduced inventories by USD 2.9 million as part of purchase price allocation.
**In accordance with the purchase and sale agreement, the Group issued 1,590,852 fully paid shares to Nabors, valued at the price as quoted on the London Stock Exchange on 12 June 2018.
B. Acquisitions of the rigs and subsidiaries from Weatherford Drilling International (WDI)
B.1 Acquisitions in Kuwait and The Kingdom of Saudi Arabia (KSA) – recorded in 2018 On 31 October 2018 and 30 November 2018, the Group acquired certain assets from Weatherford Drilling International in Kuwait and KSA, respectively. The acquisitions have been accounted for using the acquisition method. The Group acquired the following in Kuwait:
i) Kuwait Assets: 12 onshore rigs and related equipment, drilling contracts, other vendor contracts, certain employees, inventories to be used in the drilling business, the business intellectual property and records related to the drilling business and rig moving equipment; and
ii) A 100% interest in PDC Cyprus Holding ("PDC") (pre-qualified shareholder of UPDC for Kuwait Oil Company tender process) which has a 47.5% interest in UPDC, a Kuwait entity which handles the operations of the rigs in Kuwait including the employees and the drilling contracts.

27 | ADES International Holding PLC
HALF-YEAR 2019 RESULTS London | 27 September 2019
The Group acquired 11 onshore rigs in KSA and related equipment, drilling contracts, other vendor contracts, certain employees, inventories to be used in the drilling business, the business intellectual property and records related to the drilling business.
Identifiable net assets acquired The provisional fair value of the identifiable assets and liabilities as at the acquisition were:
US$
Provisional fair values recognized on
acquisition (KSA)
Provisional fair values recognized on
acquisition (Kuwait)
Property and equipment 94,861,942 130,364,292 Inventories 20,313,058 8,139,747 Accounts receivable and prepayments - 36,925,705 Due from related parties - 6,699,193 Bank balances and cash - 110,528
Total assets (provisional)* 115,175,000 182,239,465
Employees’ end of service benefits - 10,505,611 Accounts payable and accruals - 11,335,812 Due to related parties - 6,699,193
Total liabilities (provisional)* - 28,540,616
Total identifiable net assets at fair value (provisional)* 115,175,000 153,698,849 Non-controlling interest (52.5% of net assets) ** - (8,733,565) Bargain purchase gain arising on acquisitions, restated*** (22,675,000) (15,587,251)
Purchase considerations, restated*** 92,500,000 129,378,033
The gross amount of trade receivables is USD 11,537,905 which approximates to its fair value. It is expected that the full contractual amounts can be collected, and management estimated that no allowance for ECL is required.
* The Group have not yet completed the additional analysis for the WDI transaction reports the components of the purchase price allocation on provisional basis in the interim condensed consolidated financial statements for the period ended 30 June 2019. Thus, the assets and liabilities may be subsequently adjusted, with a corresponding adjustment to gain from bargain purchase within one year after the respective acquisition dates.
**This represents share of non-controlling interests over the net assets of UPDC as of the acquisition date.
***During the period, management made retrospective adjustments to the amount of purchase consideration for Kuwait for the total amount of USD 5,621,967 as per the relevant clauses of the Sales and Purchase Agreement signed between WDI and the Group. B.2 Acquisitions in Algeria and Iraq – recorded in 2019 On 27 February 2019 and 25 March 2019, the Group acquired certain assets from Weatherford Drilling International in Algeria and Iraq, respectively. The acquisitions have been accounted for using the acquisition method. The Group acquired 6 onshore rigs in Algeria and related equipment, drilling contracts, other vendor contracts, certain employees, spare parts to be used in the drilling business, the business intellectual property and records related to the drilling business. While in Iraq, the Group acquired 2 onshore rigs and related equipment, certain employees, spare parts to be used in the drilling business, the business intellectual property and records related to the drilling business. Identifiable net assets acquired The provisional fair value of the identifiable assets and liabilities as at the acquisition were:
US$
Provisional fair values recognized on
acquisition (Algeria)
Provisional fair values recognized on
acquisition (Iraq)
Property and equipment 57,545,878 17,200,000 Inventories 15,454,122 -
Total identifiable net assets at fair value (provisional)* 73,000,000 17,200,000 Bargain purchase gain arising on acquisitions (15,140,755) (5,200,000)
Purchase considerations 57,859,245 12,000,000
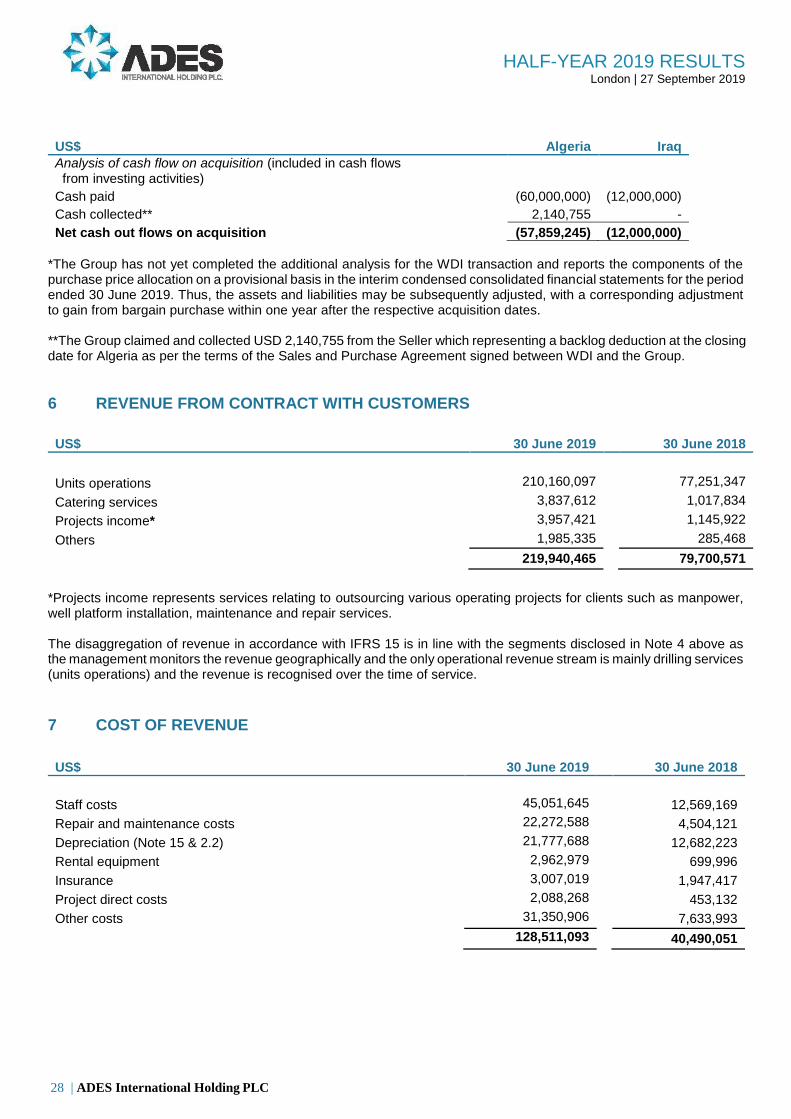
28 | ADES International Holding PLC
HALF-YEAR 2019 RESULTS London | 27 September 2019
US$ Algeria Iraq
Analysis of cash flow on acquisition (included in cash flows from investing activities)
Cash paid (60,000,000) (12,000,000)
Cash collected** 2,140,755 -
Net cash out flows on acquisition (57,859,245) (12,000,000)
*The Group has not yet completed the additional analysis for the WDI transaction and reports the components of the purchase price allocation on a provisional basis in the interim condensed consolidated financial statements for the period ended 30 June 2019. Thus, the assets and liabilities may be subsequently adjusted, with a corresponding adjustment to gain from bargain purchase within one year after the respective acquisition dates. **The Group claimed and collected USD 2,140,755 from the Seller which representing a backlog deduction at the closing date for Algeria as per the terms of the Sales and Purchase Agreement signed between WDI and the Group.
6 REVENUE FROM CONTRACT WITH CUSTOMERS
US$ 30 June 2019 30 June 2018
Units operations 210,160,097 77,251,347
Catering services 3,837,612 1,017,834
Projects income* 3,957,421 1,145,922
Others 1,985,335 285,468
219,940,465 79,700,571
*Projects income represents services relating to outsourcing various operating projects for clients such as manpower, well platform installation, maintenance and repair services. The disaggregation of revenue in accordance with IFRS 15 is in line with the segments disclosed in Note 4 above as the management monitors the revenue geographically and the only operational revenue stream is mainly drilling services (units operations) and the revenue is recognised over the time of service.
7 COST OF REVENUE
US$ 30 June 2019 30 June 2018
Staff costs 45,051,645 12,569,169
Repair and maintenance costs 22,272,588 4,504,121
Depreciation (Note 15 & 2.2) 21,777,688 12,682,223
Rental equipment 2,962,979 699,996
Insurance 3,007,019 1,947,417
Project direct costs 2,088,268 453,132
Other costs 31,350,906 7,633,993
128,511,093 40,490,051
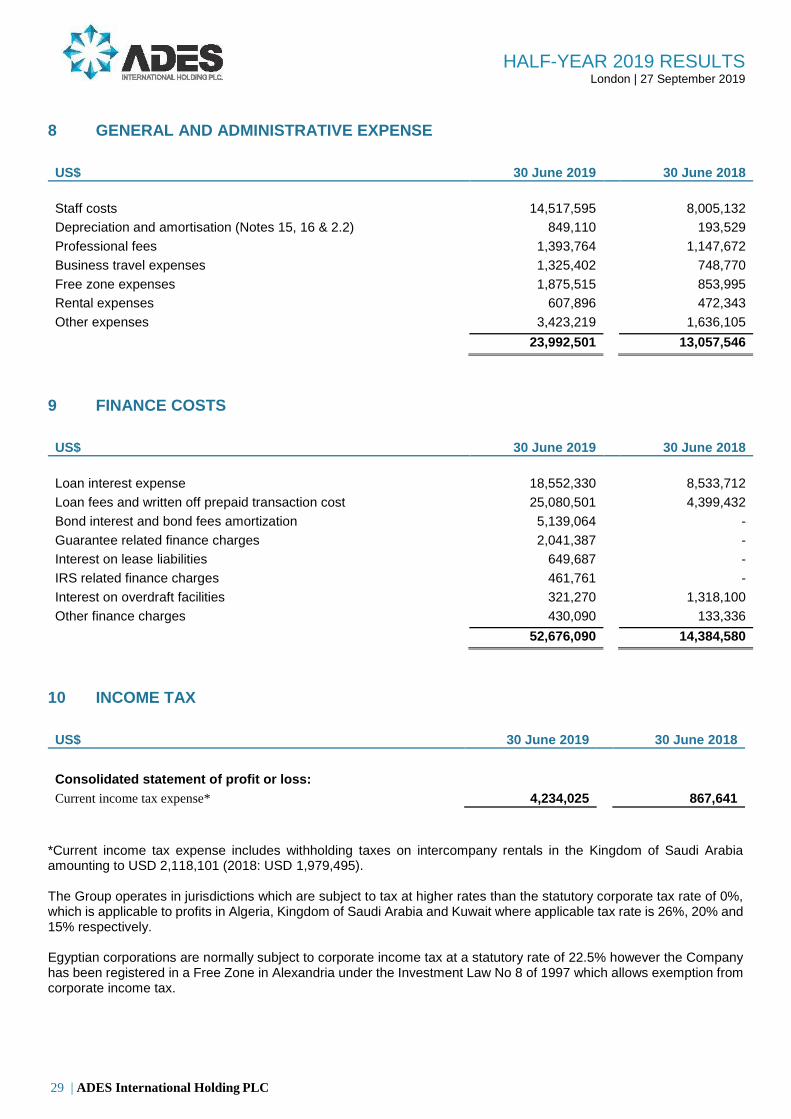
29 | ADES International Holding PLC
HALF-YEAR 2019 RESULTS London | 27 September 2019
8 GENERAL AND ADMINISTRATIVE EXPENSE
US$ 30 June 2019 30 June 2018
Staff costs 14,517,595 8,005,132
Depreciation and amortisation (Notes 15, 16 & 2.2) 849,110 193,529
Professional fees 1,393,764 1,147,672
Business travel expenses 1,325,402 748,770
Free zone expenses 1,875,515 853,995
Rental expenses 607,896 472,343
Other expenses 3,423,219 1,636,105
23,992,501 13,057,546
9 FINANCE COSTS
US$ 30 June 2019 30 June 2018
Loan interest expense 18,552,330 8,533,712
Loan fees and written off prepaid transaction cost 25,080,501 4,399,432
Bond interest and bond fees amortization 5,139,064 -
Guarantee related finance charges 2,041,387 -
Interest on lease liabilities 649,687 -
IRS related finance charges 461,761 -
Interest on overdraft facilities 321,270 1,318,100
Other finance charges 430,090 133,336
52,676,090 14,384,580
10 INCOME TAX
US$ 30 June 2019 30 June 2018
Consolidated statement of profit or loss:
Current income tax expense* 4,234,025 867,641
*Current income tax expense includes withholding taxes on intercompany rentals in the Kingdom of Saudi Arabia amounting to USD 2,118,101 (2018: USD 1,979,495). The Group operates in jurisdictions which are subject to tax at higher rates than the statutory corporate tax rate of 0%, which is applicable to profits in Algeria, Kingdom of Saudi Arabia and Kuwait where applicable tax rate is 26%, 20% and 15% respectively. Egyptian corporations are normally subject to corporate income tax at a statutory rate of 22.5% however the Company has been registered in a Free Zone in Alexandria under the Investment Law No 8 of 1997 which allows exemption from corporate income tax.

30 | ADES International Holding PLC
HALF-YEAR 2019 RESULTS London | 27 September 2019
11 BANK BALANCES AND CASH
US$ 30 June 2019 31 December 2018
Cash on hand 21,650 31,399
Bank balances 37,142,659 99,808,981
Time deposits 3,150,000 31,034,859
40,314,309 130,875,239
Escrow account held to acquire new assets - (10,800,000)
Cash and cash equivalents for the purpose of statement of cash flows
40,314,309 120,075,239
Bank balances and cash comprise of balances in the following currencies:
United States Dollar (USD) 26,185,986 90,062,113
Saudi Riyal (SAR) 7,299,586 6,610,718
Egyptian Pound (EGP) 3,450,853 2,417,859
United Arab Emirates Dirham (AED) 1,518 531
Great British Pound (GBP) 183 6,111
Euro (EUR) 72 247
Algerian Dinar (DZD) 217,868 254,620
Kuwaiti Dinar (KWD) 8,243 488,181
Time deposits (USD)* 3,150,000 31,034,859
40,314,309 130,875,239
*Time deposits represent short-term investment with a local bank in Egypt. Time deposits have original maturities of less than 90 days and earns average interest of 3.5% per annum. The finance income reported in the consolidated statement of comprehensive income for the period ended 30 June 2019 amounted to USD 123,982.
12 INVENTORIES
US$ 30 June 2019 31 December 2018
(restated*)
Offshore rigs 20,212,512 19,536,583
Onshore rigs 16,943,300 13,028,737
Warehouse and yards 29,272,601 17,028,346
66,428,413 49,593,666
*Comparative information has been adjusted to reflect the IFRS 3 Business combination measurement period adjustments, refer to note 3.
13 TRADE RECEIVABLES AND CONTRACT ASSETS
Trade receivables
US$ 30 June 2019 31 December 2018
Trade receivables 150,113,683 105,701,885
Provision for impairment in trade receivables (4,944,373) (4,944,373)
145,169,310 100,757,512
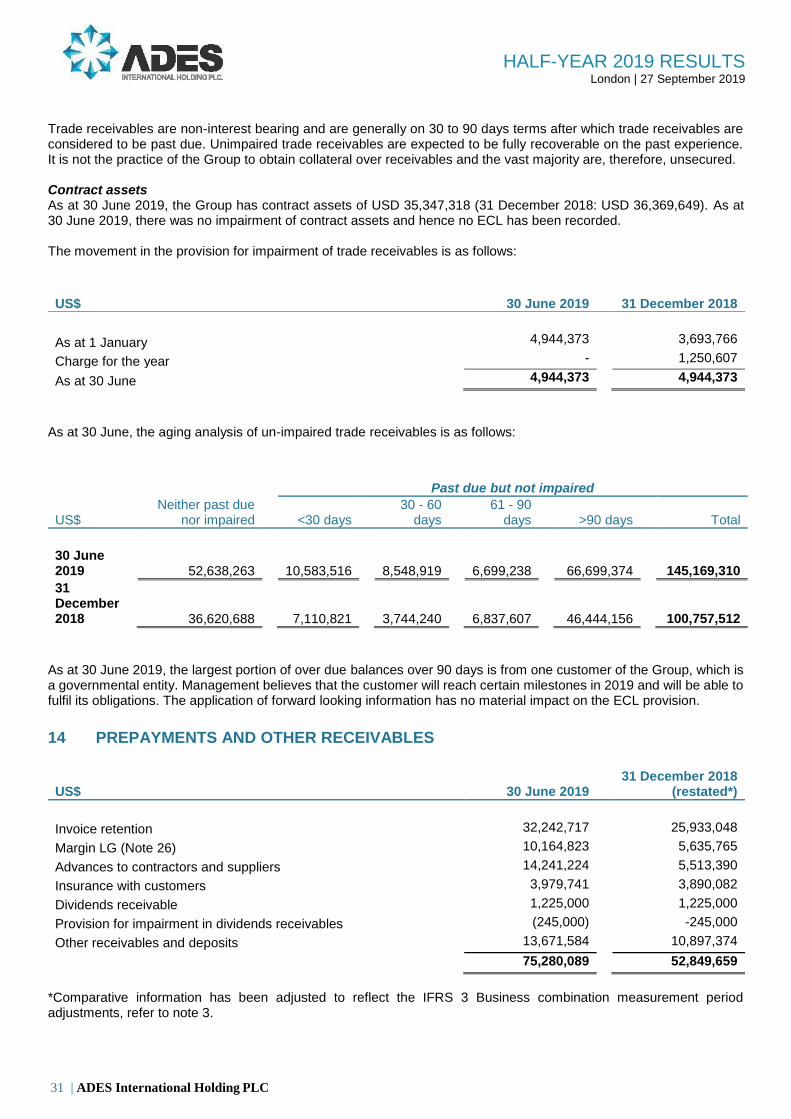
31 | ADES International Holding PLC
HALF-YEAR 2019 RESULTS London | 27 September 2019
Trade receivables are non-interest bearing and are generally on 30 to 90 days terms after which trade receivables are considered to be past due. Unimpaired trade receivables are expected to be fully recoverable on the past experience. It is not the practice of the Group to obtain collateral over receivables and the vast majority are, therefore, unsecured. Contract assets As at 30 June 2019, the Group has contract assets of USD 35,347,318 (31 December 2018: USD 36,369,649). As at 30 June 2019, there was no impairment of contract assets and hence no ECL has been recorded. The movement in the provision for impairment of trade receivables is as follows:
US$ 30 June 2019 31 December 2018
As at 1 January 4,944,373 3,693,766
Charge for the year - 1,250,607
As at 30 June 4,944,373 4,944,373
As at 30 June, the aging analysis of un-impaired trade receivables is as follows:
Past due but not impaired
US$ Neither past due
nor impaired
<30 days 30 - 60
days 61 - 90
days
>90 days
Total
30 June 2019 52,638,263
10,583,516
8,548,919
6,699,238
66,699,374
145,169,310
31 December 2018 36,620,688
7,110,821
3,744,240
6,837,607
46,444,156
100,757,512
As at 30 June 2019, the largest portion of over due balances over 90 days is from one customer of the Group, which is a governmental entity. Management believes that the customer will reach certain milestones in 2019 and will be able to fulfil its obligations. The application of forward looking information has no material impact on the ECL provision.
14 PREPAYMENTS AND OTHER RECEIVABLES
US$ 30 June 2019 31 December 2018
(restated*)
Invoice retention 32,242,717 25,933,048
Margin LG (Note 26) 10,164,823 5,635,765
Advances to contractors and suppliers 14,241,224 5,513,390
Insurance with customers 3,979,741 3,890,082
Dividends receivable 1,225,000 1,225,000
Provision for impairment in dividends receivables (245,000) -245,000
Other receivables and deposits 13,671,584 10,897,374
75,280,089 52,849,659
*Comparative information has been adjusted to reflect the IFRS 3 Business combination measurement period adjustments, refer to note 3.

32 | ADES International Holding PLC
HALF-YEAR 2019 RESULTS London | 27 September 2019
15 PROPERTY AND EQUIPMENT
US$ Rigs
Restated* Furniture & Fixtures
Drilling pipes
Tools Restated
Assets under
construction
IT Equipment
Motor Vehicles
Leasehold Improvements
Total
Cost
As of 1 January, 2019, Restated*
628,683,472 1,188,005
13,137,229 30,586,819 124,673,795
777,987
249,765
256,804 799,553,876
Additions 264,730 11,354 87,600 3,719,945 111,971,747 21,767 - - 116,077,143 Acquisitions through business combinations 35,239,183 - - - 39,506,695 - - - 74,745,878 Reclassification (5,062,203) (2,376,007) 7,438,210 - - - - Transfers 100,681,911 3,623 2,124,755 (103,204,209) - - 393,920 -
As of 30 June, 2019 764,869,296 1,202,982 8,162,626 34,055,512 180,386,238 799,754 249,765 650,724 990,376,897 Accumulated depreciation
As of 1 January, 2019, restated* (82,370,839)
(476,251)
(3,268,635)
(8,130,782)
(765,291)
(443,545)
(184,137)
(118,623)
(95,758,103)
Depreciation for the period (17,593,370) (54,839) (810,422) (1,343,286) - (59,183) (18,384) (18,676) (19,898,160)
As of 30 June, 2019 (99,964,209) (531,090) (4,079,057) (9,474,068) (765,291) (502,728) (202,521) (137,299) (115,656,263) Net book value At 30 June 2019 664,905,087 671,892 4,083,569 24,581,444 179,620,947 297,026 47,244 513,425 874,720,634
*Comparative information has been adjusted to reflect the IFRS 3 Business combination measurement period adjustments, refer to note 3.

33 | ADES International Holding PLC
HALF-YEAR 2019 RESULTS London | 27 September 2019
15 PROPERTY AND EQUIPMENT (cont’d)
US$ Rigs
Restated* Furniture &
Fixtures Drilling pipes
Tools Restated
Assets under construction
IT Equipment
Motor Vehicles
Leasehold Improvements
Building** Total
As of 1 January 2018 316,529,474 1,154,408 8,075,026 21,977,187 41,115,141 666,495 249,765 232,453 - 389,999,949 Additions 647,078 26,727 5,062,203 4,105,794 83,062,191 91,803 - 24,351 6,622,148 99,642,295 Acquisition through business combinations, restated* 207,415,957 - - 3,914,375 105,224,856 316,555,188 Transfers 104,090,963 6,870 - 589,463 (104,706,985) 19,689 - - - - Transfer to Intangible Assets - - - (21,408) - - - (21,408)
As of 31 Dec, 2018, restated* 628,683,472 1,188,005 13,137,229 30,586,819 124,673,795 777,987 249,765 256,804 6,622,148 806,176,024 Accumulated depreciation As of 1 January, 2018 (58,139,451) (367,329) (1,653,630) (6,071,696) (765,291) (333,381) (145,520) (81,676) - (67,557,974) Depreciation for the year, restated* (24,231,388) (108,922) (1,615,005) (2,059,086) - (110,164) (38,617) (36,947) - (28,200,129)
As of 31 Dec 2018, restated* (82,370,839) (476,251) (3,268,635) (8,130,782) (765,291) (443,545) (184,137) (118,623) - (95,758,103) Net book value At 31 Dec 2018, restated* 546,312,633 711,754 9,868,594 22,456,037 123,908,504 334,442 65,628 138,181 6,622,148 710,417,921
*Comparative information has been adjusted to reflect the IFRS 3 Business combination measurement period adjustments, refer to note 3. **The building reported as at 31 December 2018 pertains to the office premises of the Group under finance lease arrangement. The Group reclassified the balance on 1 January 2019 as right of use asset in accordance with the requirement of IFRS 16.
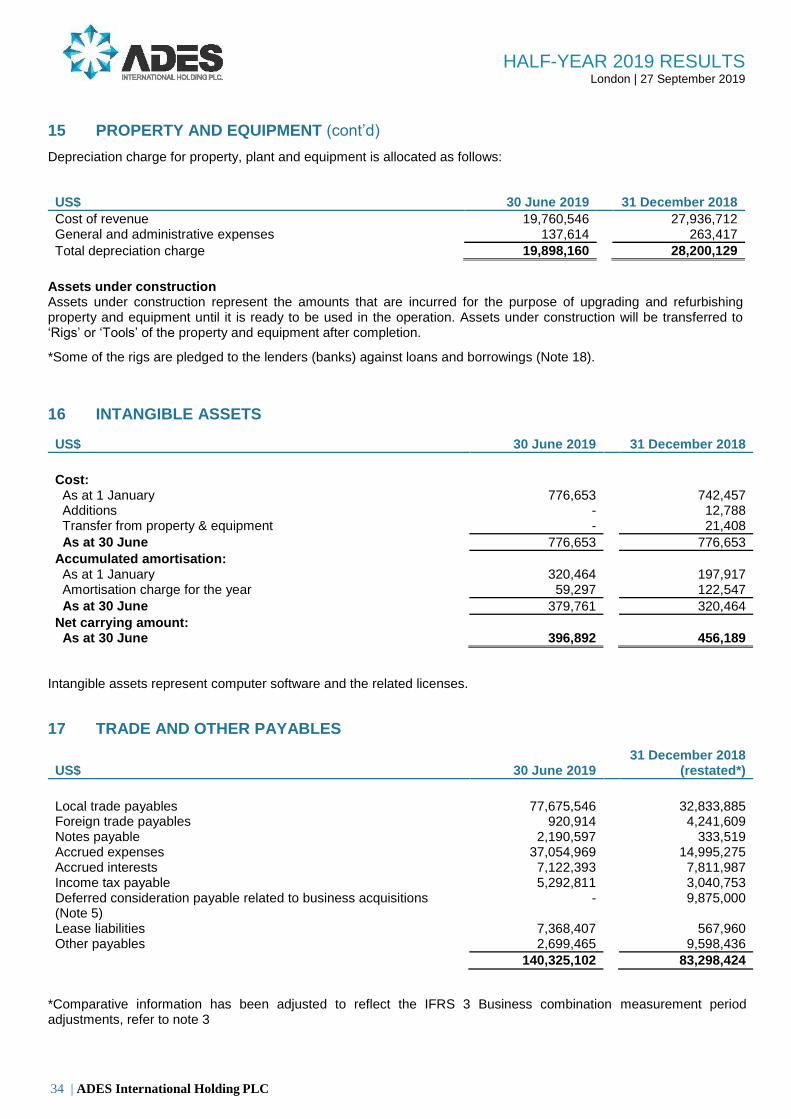
34 | ADES International Holding PLC
HALF-YEAR 2019 RESULTS London | 27 September 2019
15 PROPERTY AND EQUIPMENT (cont’d)
Depreciation charge for property, plant and equipment is allocated as follows:
US$ 30 June 2019 31 December 2018
Cost of revenue 19,760,546 27,936,712 General and administrative expenses 137,614 263,417
Total depreciation charge 19,898,160 28,200,129
Assets under construction Assets under construction represent the amounts that are incurred for the purpose of upgrading and refurbishing property and equipment until it is ready to be used in the operation. Assets under construction will be transferred to ‘Rigs’ or ‘Tools’ of the property and equipment after completion.
*Some of the rigs are pledged to the lenders (banks) against loans and borrowings (Note 18).
16 INTANGIBLE ASSETS
US$ 30 June 2019 31 December 2018
Cost: As at 1 January 776,653 742,457 Additions - 12,788 Transfer from property & equipment - 21,408
As at 30 June 776,653 776,653
Accumulated amortisation:
As at 1 January 320,464 197,917 Amortisation charge for the year 59,297 122,547
As at 30 June 379,761 320,464
Net carrying amount:
As at 30 June 396,892 456,189
Intangible assets represent computer software and the related licenses.
17 TRADE AND OTHER PAYABLES
US$ 30 June 2019 31 December 2018
(restated*)
Local trade payables 77,675,546 32,833,885 Foreign trade payables 920,914 4,241,609 Notes payable 2,190,597 333,519 Accrued expenses 37,054,969 14,995,275 Accrued interests 7,122,393 7,811,987 Income tax payable 5,292,811 3,040,753 Deferred consideration payable related to business acquisitions (Note 5)
- 9,875,000
Lease liabilities 7,368,407 567,960 Other payables 2,699,465 9,598,436
140,325,102 83,298,424
*Comparative information has been adjusted to reflect the IFRS 3 Business combination measurement period adjustments, refer to note 3

35 | ADES International Holding PLC
HALF-YEAR 2019 RESULTS London | 27 September 2019
18 INTEREST-BEARING LOANS AND BORROWINGS
US$ 30 June 2019 31 December 2018
Balance as at 1 January 555,268,918 212,489,035
Borrowings drawn during the year 85,585,672 569,304,756
Borrowings repaid during the year (342,964,562) (238,038,446)
Amortised arrangement fees 20,297,939 11,513,573
Balance as at 30 June 318,187,967 555,268,918
Maturing within 12 months 48,077,441 45,258,354
Maturing after 12 months 270,110,526 510,010,564
Balance as at 30 June 318,187,967 555,268,918
Type Interest rate % Latest
maturity
30 June 2019 USD
31 December 2018 USD
Current interest-bearing loans and borrowings
Loan 1 Syndication
Tranche A 5.0% + 6 Month LIBOR 3.5 years 15,050,000 - - Ijara Loan - Tranche A 3.25% + 6 Months SAIBOR 7 years 7,777,000 - Tranche B 3.25% + 6 Months SAIBOR 7 years 7,777,000 - Tranche C 3.25% + 6 Months SAIBOR 7 years 8,888,000
Credit facility 1 1.25% + Corridor Renewable (185) (186) Credit facility 2 1.25% + Corridor Renewable 2,658,754 - Credit facility 3 4.50% + 3 Month LIBOR Renewable 5,926,872 2,999,955 Loan 2 Syndication
Tranche A 5.0% + 6 Month LIBOR 5 years - 21,500,000 Tranche C 5.0% + 6 Month LIBOR 5 years - 17,568,851 Murabaha facility 5.0% + 6 Month LIBOR 5 years - 3,189,734
Total current interest-bearing loans and borrowings 48,077,441 45,258,354
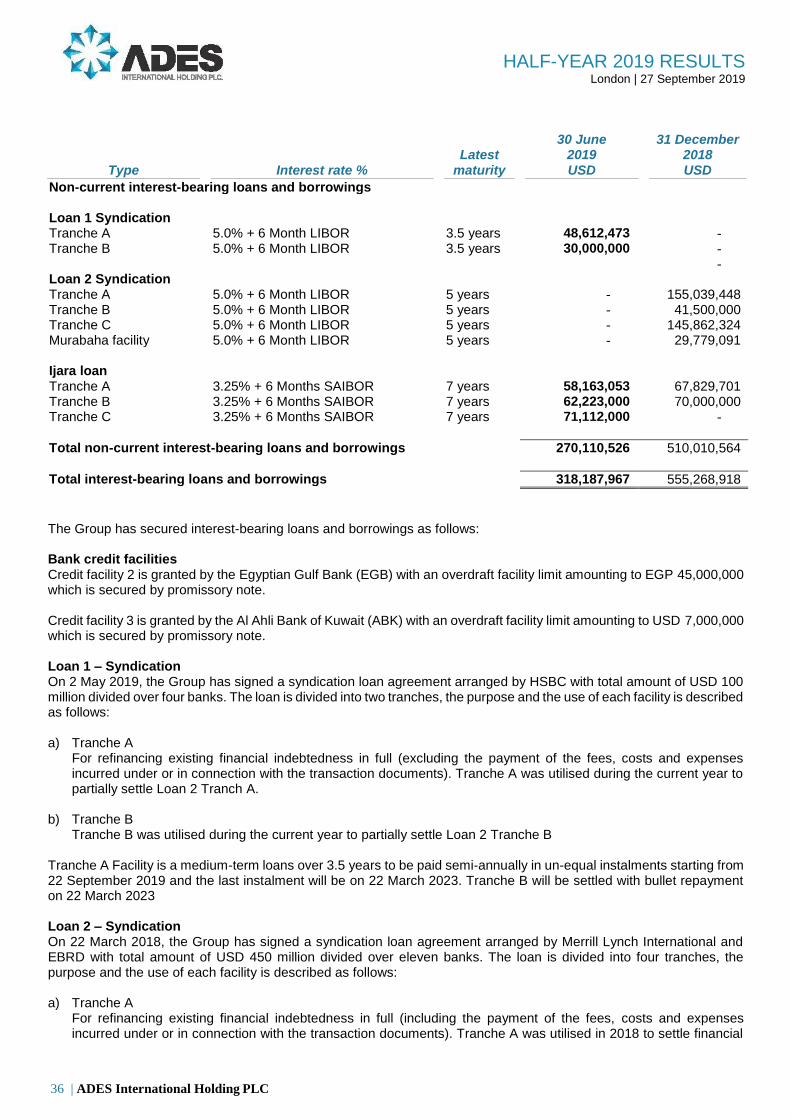
36 | ADES International Holding PLC
HALF-YEAR 2019 RESULTS London | 27 September 2019
Type Interest rate % Latest
maturity
30 June 2019 USD
31 December 2018 USD
Non-current interest-bearing loans and borrowings Loan 1 Syndication
Tranche A 5.0% + 6 Month LIBOR 3.5 years 48,612,473 - Tranche B 5.0% + 6 Month LIBOR 3.5 years 30,000,000 - Loan 2 Syndication
-
Tranche A 5.0% + 6 Month LIBOR 5 years - 155,039,448 Tranche B 5.0% + 6 Month LIBOR 5 years - 41,500,000 Tranche C 5.0% + 6 Month LIBOR 5 years - 145,862,324 Murabaha facility 5.0% + 6 Month LIBOR 5 years - 29,779,091 Ijara loan
Tranche A 3.25% + 6 Months SAIBOR 7 years 58,163,053 67,829,701 Tranche B 3.25% + 6 Months SAIBOR 7 years 62,223,000 70,000,000 Tranche C 3.25% + 6 Months SAIBOR 7 years 71,112,000 -
Total non-current interest-bearing loans and borrowings 270,110,526 510,010,564
Total interest-bearing loans and borrowings 318,187,967 555,268,918
The Group has secured interest-bearing loans and borrowings as follows: Bank credit facilities Credit facility 2 is granted by the Egyptian Gulf Bank (EGB) with an overdraft facility limit amounting to EGP 45,000,000 which is secured by promissory note. Credit facility 3 is granted by the Al Ahli Bank of Kuwait (ABK) with an overdraft facility limit amounting to USD 7,000,000 which is secured by promissory note. Loan 1 – Syndication On 2 May 2019, the Group has signed a syndication loan agreement arranged by HSBC with total amount of USD 100 million divided over four banks. The loan is divided into two tranches, the purpose and the use of each facility is described as follows: a) Tranche A
For refinancing existing financial indebtedness in full (excluding the payment of the fees, costs and expenses incurred under or in connection with the transaction documents). Tranche A was utilised during the current year to partially settle Loan 2 Tranch A.
b) Tranche B Tranche B was utilised during the current year to partially settle Loan 2 Tranche B Tranche A Facility is a medium-term loans over 3.5 years to be paid semi-annually in un-equal instalments starting from 22 September 2019 and the last instalment will be on 22 March 2023. Tranche B will be settled with bullet repayment on 22 March 2023 Loan 2 – Syndication On 22 March 2018, the Group has signed a syndication loan agreement arranged by Merrill Lynch International and EBRD with total amount of USD 450 million divided over eleven banks. The loan is divided into four tranches, the purpose and the use of each facility is described as follows: a) Tranche A
For refinancing existing financial indebtedness in full (including the payment of the fees, costs and expenses incurred under or in connection with the transaction documents). Tranche A was utilised in 2018 to settle financial
37 | ADES International Holding PLC
HALF-YEAR 2019 RESULTS London | 27 September 2019
indebtedness. On 2 May 2019, USD 130 million was settled in cash and USD 70 million was refinanced by Loan 1 Tranch A.
b) Tranche B New working capital purposes and to refinance certain existing working capital facilities. Tranche B was utilised in
2018. On 2 May 2019, USD 11.5 million was settled in cash and USD 30 million was refinanced as discussed by Loan 1 Tranch B.
c) Tranche C Capital expenditure for the acquisition of the new rigs and mobile offshore production units. Tranche C was partially
utilised in 2018. On 2 May 2019, Tranch C was fully settled in cash. d) “Murabaha Facility”
Capital expenditure for the acquisition of the new rigs and mobile offshore production units. Murabaha Facility was partially utilised in 2018. On 2 May 2019, Murabaha Facility was fully settled in cash.
Ijara Loan On 22 May 2018, the Group has signed “Musharakah” agreement and “Ijara” agreement with Alinma Bank to finance the acquisition of the new rigs and related capital expenditure. The Musharakah facility amount is USD 200 million, of which 70% is financed by Alinma Bank and 30% by the Group. On 11 June 2018, the Group obtained USD 70 million from Alinma Bank within the framework of “Musharakah” facility to finance the acquisition of three rigs from Nabors (Note 5) and subsequent capital expenditures. On 18 July 2018, the Group obtained USD 70 million from Alinma Bank within the framework of “Musharakah” facility to finance the acquisitions of three rigs from Weatherford Drilling International (Note 5). On 25 April 2019 , the Group has signed “Musharakah” agreement and “Ijara” agreement with Alinma Bank to increase the facility to USD 284 million .On 5 May 2019, the Group obtained additional USD 80 million from Alinma Bank within the framework of “Musharakah” facility to finance the purchase and maintenance of rigs ADM 657, Rig 40, Rig 158, Rig 174, Rig 799 and Rig 889 . All loans are medium-term loans over 7 years which includes 2 year grace period and is paid semi-annually in equal instalments starting from 10 June 2020 and the last instalment will be on 10 June 2024. Ijara loan is secured by the rigs purchased from Nabors Drilling International II Limited (Jackup rig Admarine 656, Jackup rig Admarine 656 and Jackup rig Admarine 657) and rigs purchased from Weatherford Drilling International (ADES 40, ADES 158, ADES 174, ADES 799 and ADES 889) (Note 5). Others On 14 May 2019, the group signed a Long Term Loan Facility from National Commercial Bank ("NCB") for a total limit of SAR 300 million (US$80 million). As of 30 June 2019, the Group has not utilized any amounts under this facility. On 6 May 2019, the group signed a multicurrency credit facility agreement with Mashreq Bank PJSC Dubai and subsequent amendments last of which being on 12 June 2019 for the total facility granted by Mashreq Bank PSC Dubai to reach $70,000,000. As of 30 June 2019, the Group has not utilized any amounts under this facility.
19 BONDS PAYABLE On 16 April 2019, the Group issued USD 325,000,000 senior secured notes at 8.625% interest due on 24 April 2024. Interest is payable semi-annually on 24 April and 24 October each year commencing on 24 October 2019. The Group paid USD 7,876,447 as transaction costs for the issuance of the bonds. The Group recognised interest expense of USD 4,884,338 for the six months period ended 30 June 2019. The bonds payable is recognised at amortised cost using the effective interest method.

38 | ADES International Holding PLC
HALF-YEAR 2019 RESULTS London | 27 September 2019
20 PROVISIONS
US$ As at
1 January
*Accrued / acquired during the period/year
Paid during the
period/year
As at
period/year end
30 June 2019 Provision for end of service benefits 12,331,933 1,745,191 (63,745) 14,013,379
Other tax provisions * 1,874,654 - (296,736) 1,577,918
14,206,587 1,745,191 (360,481) 15,591,297
31 December 2018 Provision for end of service benefits 620,083 11,814,647 (102,797) 12,331,933
Other tax provisions* 1,836,000 280,017 (241,363) 1,874,654
2,456,083 12,094,664 (344,160) 14,206,587
* Other tax provisions mainly represent provision made for employee’s taxes and withholding taxes which are borne by the Group. The total balance is presented as current in the statement of financial position.
21 SHARE CAPITAL Share capital of the Group comprise:
US$ 30 June 2019 31 December 2018
Authorised shares* 1,500,000,000 1,500,000,000 Issued shares 43,793,882 43,793,882 Shares par value 1.00 1.00
Issued and paid up capital* 43,793,882 43,793,882
Share premium*** 178,746,337 178,746,337
The shareholding structure as at 30 June 2019 is:
Shareholding % No. of Value
Shareholders shares US$
ADES Investment Holding Ltd 62 27,179,084 27,446,772 Individual shareholders 38 16,614,798 16,347,110
100 43,793,882 43,793,882
The shareholding structure as at 31 December 2018 was:
Shareholding % No. of Value
Shareholders shares US$
ADES Investment Holding Ltd 63 27,446,772 27,446,772 Individual shareholders 37 16,347,110 16,347,110
100 43,793,882 43,793,882
*As at 30 June 2019 and 31 December 2018, the authorised share capital of the Company was USD 1,500,000,000 comprising of 1,500,000,000 shares.
**In 2018, the Group issued 1,590,852 shares to Nabors as part of the consideration paid for the business acquisition (Note 5).
*** Share premium represents the excess of fair value received over the par value of shares issued as a result of business combinations (Note 5) and IPO (Note 1).

39 | ADES International Holding PLC
HALF-YEAR 2019 RESULTS London | 27 September 2019
22 EQUITY SETTLED SHARE-BASED PAYMENTS Pursuant to the rules of the Long Term Incentive Plan (“LTIP”) adopted by ADES Investments Holding Ltd., the awards over a total number of 1,136,451 ordinary shares of US$1.00 each in the capital of the Company have been granted to certain employees of the Company by ADES Investments Holding Ltd (the majority shareholder). The LTIP is equity settled and effective from 1 January 2019. According to the LTIP rules, the shares will be vested over a period of three years and not subject to performance conditions. These shares are currently held by ADES Investments Holding Ltd and the awards will not be satisfied by the new issue of any shares in the Company. Awards will normally lapse and cease to vest on termination of employment.
The fair value at grant date was determined based on the market price of the shares of the Company at grant date.
For the six months ended 30 June 2019, the Group has recognised USD 7,470,824 of share-based payment expense in the consolidated statement of profit or loss (30 June 2018: USD Nil, with a corresponding increase in equity (share-based payment reserve).
23 EARNINGS PER SHARE Basic earnings per share (EPS) amounts are calculated by dividing the profit for the year attributable to the ordinary equity holders of the Parent by the weighted average number of ordinary shares outstanding during the year.
Diluted EPS is calculated by adjusting the weighted average number of ordinary shares outstanding assuming conversion of all dilutive potential ordinary shares. As at 30 June 2019, there were no potential dilutive shares and hence the basic and diluted EPS is same.
The information necessary to calculate basic and diluted earnings per share is as follows:
US$ 30 June 2019 30 June 2018
(restated*)
Profit attributable to the ordinary equity holders of the Parent for basic and diluted EPS 11,014,962
18,245,720
Weighted average number of ordinary shares –
basic and diluted 43,793,882 42,358,725
Earnings per share – basic and diluted (US$ per share) 0.25 0.43
*Comparative information has been adjusted to reflect the IFRS 3 Business combination measurement period adjustments, refer to note 3
24 RELATED PARTIES TRANSACTIONS AND BALANCES
Related party transactions During the period, the following were the significant related party transactions recorded in the interim condensed consolidated statement of comprehensive income or consolidated statement of financial position: During the period, the Group transferred funds to and on behalf of a related party, AMAK for Drilling & Petroleum Services Co. (other related party), amounting to USD 1,935,394 (30 June 2018: USD 11,265,899), for expenses of the related party. Assets purchased from AMAK, a related party, amounted to USD Nil (2018: USD 7,400,000).
40 | ADES International Holding PLC
HALF-YEAR 2019 RESULTS London | 27 September 2019
Related party balances Significant related party balances included in the consolidated statement of financial position are as follows:
30 June 2019 31 December 2018
US$ Due from Due to Due from Due to
Ultimate Shareholders Sky Investment Holding Ltd. 60,000 - 60,000 - Intro Investment Holding Ltd. 90,503 - 90,502 -
Shareholder ADES Investment Holding Ltd 46,364 - 46,364
Joint venture Egyptian Chinese Drilling Co. (S.A.E.) 57,197 170,618 -
Other related parties TBS Holding 3,027 - 3,027 - Advansys Project 1,308 - 1,308 - Advansys Holding 5,299 - 5,299 - AMAK for Drilling & Petroleum Services Co. 1,880,095 - - 55,078 ADVANSYS FOR ENG.SERV. & CONS - 1,028 - 1,028 Intro for Trading & Contracting Co. 228 - 227 -
3,003,641 58,225 377,345 56,106
Compensation of key management personnel The remuneration of key management personnel during the period was as follows:
US$ 30 June 2019 30 June 2018
Short-term benefits* 2,020,000 2,565,000
25 FAIR VALUE OF FINANCIAL INSTRUMENTS Financial instruments comprise financial assets and financial liabilities. Financial assets of the Group include bank balances and cash, trade receivables and contract assets, due from related parties and other receivables. Financial liabilities of the Group include trade payables, due to related parties, loans and borrowings, other payables and derivative financial instrument. The fair values of the financial assets and liabilities are not materially different from their carrying value unless stated otherwise.
26 CONTINGENT LIABILITIES Contingent liabilities
US$ 30 June 2019 30 June 2018
Letter of guarantees 43,564,552 25,708,373
Contingent liabilities represent letters of guarantee issued in favour of General Authority for Investment, Petrobel Group, Egyptian General Petroleum Corporation, Petro Gulf of Suez, Suze Abu Zenima Petroleum Company (Petro Zenima) and Association Sonatrach - First Calgary Petroleum. The cover margin on such guarantees amounted to USD 10,164,823 (31 December 2018: USD 5,635,765).
41 | ADES International Holding PLC
HALF-YEAR 2019 RESULTS London | 27 September 2019
27 FINANCIAL INSTRUMENTS
US$ 30 June 2019 31 December 2018
Derivative financial Instrument
Interest rate swap 8,892,479 4,340,180
Balance as period/ year end 8,892,479 4,340,180
Total current 2,348,155 1,216,381 Total non-current 6,544,324 3,123,799
Derivative financial instrument at 30 June 2019 amounting to USD 8,892,479 represents the negative mark to market of the interest rate swap entered into by the Group during 2019. The interest rate swap is effective from 21 November 2018 and terminates on 22 March 2023. The notional amount of the interest rate swap as at 30 June 2019 was USD 241,500,000 which represents the loans withdrawn as Tranche A and B Loan under Loan 2 Syndication (note 18). Interest rate swaps relates to contracts taken out by the Group with other counterparties (mainly financial institutions) in which the Group either receives or pays a floating rate of interest, respectively, in return for paying or receiving a fixed rate of interest. The payment flows are usually netted against each other, with the difference being paid by one party to the other. The following table shows an analysis of financial instruments recorded at fair value by level of the fair value hierarchy:
US$ Total Level 1 Level 2 Level 3
30 June 2019
Derivative financial Instrument Interest rate swap (8,892,479) - (8,892,479) -
31 December 2018
Derivative financial Instrument Interest rate swap (4,340,180) - (4,340,180) -
During the period ended 30 June 2019, there were no transfers between Level 1 and Level 2 fair value measurements, and no transfers into and out of Level 3 at fair value measurements.