adequacy of education funding in...
TRANSCRIPT

Department of Legislative Services
Office of Policy Analysis
Annapolis, Maryland
January 9, 2017
Adequacy of Education Funding
in Maryland
Presentation to the Commission on
Innovation and Excellence in Education

Presentation Overview
• Adequacy Targets
• Adequacy in Fiscal 2002, 2008, and 2015
• Progress toward Adequate Funding
• Federal, State, and Local Funding
• Slowing Progress; Federal, State, and Local
• Comparing Actual Funding to Targets and Augenblick,
Palaich and Associates (APA) Proposal
1

Adequacy Targets
• Adequacy: Funding should be sufficient to acquire the totalresources needed to reasonably expect that all students canmeet academic performance standards
• The Department of Legislative Services’ calculation of adequacy targets:– Base per pupil cost of $5,969 in fiscal 2002 inflated by implicit price
deflator (IPD) for State and local government expenditures.
– Foundation program adjusted by regional cost index (GCEI)
– Additional costs for at-risk students
• Special education student: 1.17 x base per pupil cost
• Economically disadvantaged student: 1.10 x base per pupil cost
• Limited English proficient student: 1.00 x base per pupil cost
2

Fiscal 2002 Adequacy Analysis
3
($ in Millions) Per Pupil Percent of
Adequacy Adjusted Adequacy Adequacy Adjusted Adequacy Adequacy
County Target Revenue* Gap** Target Revenue* Gap Funded**
Allegany $100.6 $78.3 $22.3 $10,171 $7,913 $2,258 77.8%
Anne Arundel 607.2 563.6 43.6 8,198 7,610 589 92.8%
Baltimore City 1,141.4 871.0 270.4 12,087 9,224 2,864 76.3%
Baltimore 924.0 858.8 65.2 8,879 8,252 627 92.9%
Calvert 128.5 117.7 10.8 7,876 7,214 662 91.6%
Caroline 53.3 36.3 17.0 9,885 6,737 3,149 68.1%
Carroll 210.9 191.0 19.9 7,554 6,839 715 90.5%
Cecil 133.7 109.6 24.1 8,562 7,017 1,545 82.0%
Charles 194.9 164.8 30.1 8,387 7,092 1,295 84.6%
Dorchester 47.0 36.1 10.9 10,138 7,792 2,346 76.9%
Frederick 294.6 262.0 32.6 7,891 7,017 874 88.9%
Garrett 45.5 36.3 9.2 9,601 7,659 1,942 79.8%
Harford 316.2 264.8 51.4 8,095 6,779 1,316 83.7%
Howard 348.7 376.3 0.0 7,639 8,243 0 107.9%
Kent 25.0 24.1 0.9 9,697 9,361 336 96.5%
Montgomery 1,203.4 1,288.7 0.0 8,953 9,587 0 107.1%
Prince George's 1,352.1 968.3 383.8 10,236 7,330 2,906 71.6%
Queen Anne's 57.2 52.3 4.9 8,163 7,468 696 91.5%
St. Mary's 126.4 107.8 18.6 8,528 7,270 1,258 85.3%
Somerset 30.1 24.8 5.3 10,365 8,524 1,842 82.2%
Talbot 38.3 32.7 5.6 8,784 7,510 1,274 85.5%
Washington 173.7 143.2 30.5 8,880 7,323 1,557 82.5%
Wicomico 128.9 101.2 27.7 9,198 7,224 1,974 78.5%
Worcester 59.6 57.1 2.5 8,949 8,569 380 95.7%
State Total $7,741.2 $6,766.7 $1,087.4 $9,207 $8,048 $1,293 86.0%
*Selected Financial Data, Fiscal 2002, Maryland State Department of Education. Figures exclude unallocated revenues and revenues spent on student
transportation and other revenues not linked to adequacy.
**State total excludes funding that exceeds adequacy targets.
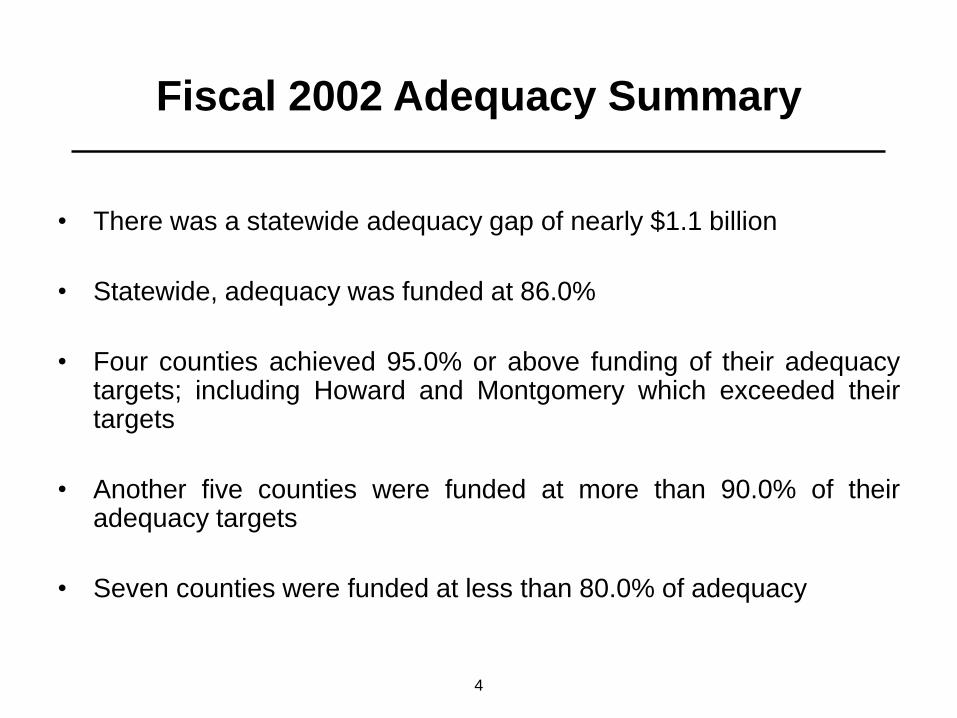
Fiscal 2002 Adequacy Summary
• There was a statewide adequacy gap of nearly $1.1 billion
• Statewide, adequacy was funded at 86.0%
• Four counties achieved 95.0% or above funding of their adequacytargets; including Howard and Montgomery which exceeded theirtargets
• Another five counties were funded at more than 90.0% of theiradequacy targets
• Seven counties were funded at less than 80.0% of adequacy
4
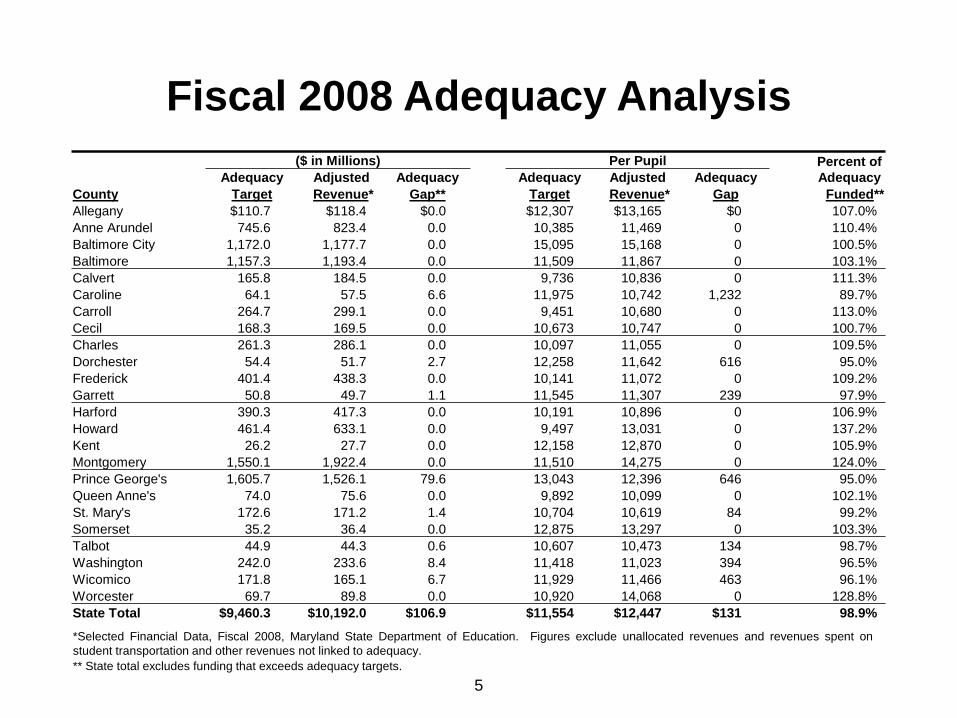
Fiscal 2008 Adequacy Analysis
5
($ in Millions) Per Pupil Percent of
AdequacyAdequacy Adjusted Adequacy Adequacy Adjusted Adequacy
County Target Revenue* Gap** Target Revenue* Gap Funded**
Allegany $110.7 $118.4 $0.0 $12,307 $13,165 $0 107.0%
Anne Arundel 745.6 823.4 0.0 10,385 11,469 0 110.4%
Baltimore City 1,172.0 1,177.7 0.0 15,095 15,168 0 100.5%
Baltimore 1,157.3 1,193.4 0.0 11,509 11,867 0 103.1%
Calvert 165.8 184.5 0.0 9,736 10,836 0 111.3%
Caroline 64.1 57.5 6.6 11,975 10,742 1,232 89.7%
Carroll 264.7 299.1 0.0 9,451 10,680 0 113.0%
Cecil 168.3 169.5 0.0 10,673 10,747 0 100.7%
Charles 261.3 286.1 0.0 10,097 11,055 0 109.5%
Dorchester 54.4 51.7 2.7 12,258 11,642 616 95.0%
Frederick 401.4 438.3 0.0 10,141 11,072 0 109.2%
Garrett 50.8 49.7 1.1 11,545 11,307 239 97.9%
Harford 390.3 417.3 0.0 10,191 10,896 0 106.9%
Howard 461.4 633.1 0.0 9,497 13,031 0 137.2%
Kent 26.2 27.7 0.0 12,158 12,870 0 105.9%
Montgomery 1,550.1 1,922.4 0.0 11,510 14,275 0 124.0%
Prince George's 1,605.7 1,526.1 79.6 13,043 12,396 646 95.0%
Queen Anne's 74.0 75.6 0.0 9,892 10,099 0 102.1%
St. Mary's 172.6 171.2 1.4 10,704 10,619 84 99.2%
Somerset 35.2 36.4 0.0 12,875 13,297 0 103.3%
Talbot 44.9 44.3 0.6 10,607 10,473 134 98.7%
Washington 242.0 233.6 8.4 11,418 11,023 394 96.5%
Wicomico 171.8 165.1 6.7 11,929 11,466 463 96.1%
Worcester 69.7 89.8 0.0 10,920 14,068 0 128.8%
State Total $9,460.3 $10,192.0 $106.9 $11,554 $12,447 $131 98.9%
*Selected Financial Data, Fiscal 2008, Maryland State Department of Education. Figures exclude unallocated revenues and revenues spent on
student transportation and other revenues not linked to adequacy.
** State total excludes funding that exceeds adequacy targets.

Fiscal 2008 Adequacy Summary
• There was a statewide adequacy gap of $106.9 million.
• Statewide, adequacy was funded at 98.9%.
• All but one county (Caroline) achieved 95.0% or more of their
adequacy targets; including 16 that exceeded their targets.
6

Fiscal 2015 Adequacy Analysis
7
($ in Millions) Per Pupil Percent of
Adequacy Adjusted Adequacy Adequacy Adjusted Adequacy Adequacy
County Target Revenue* Gap** Target Revenue* Gap Funded**
Allegany $131.5 $117.6 $13.9 $15,735 $14,066 $1,669 89.4%
Anne Arundel 1,075.3 983.1 92.2 13,882 12,692 1,190 91.4%
Baltimore City 1,587.1 1,297.0 290.1 19,755 16,144 3,611 81.7%
Baltimore 1,634.3 1,400.9 233.4 15,396 13,197 2,199 85.7%
Calvert 194.9 205.7 0.0 12,466 13,155 0 105.5%
Caroline 85.4 66.2 19.2 16,135 12,514 3,621 77.6%
Carroll 313.8 315.6 0.0 12,298 12,368 0 100.6%
Cecil 218.7 188.9 29.8 14,641 12,648 1,993 86.4%
Charles 348.8 332.0 16.8 13,721 13,062 660 95.2%
Dorchester 75.6 61.4 14.2 16,496 13,401 3,094 81.2%
Frederick 525.9 490.1 35.8 13,253 12,350 902 93.2%
Garrett 53.1 50.0 3.1 14,313 13,468 845 94.1%
Harford 493.8 438.7 55.1 13,431 11,932 1,499 88.8%
Howard 651.1 790.8 0.0 12,390 15,047 0 121.4%
Kent 30.5 28.9 1.6 15,482 14,680 802 94.8%
Montgomery 2,274.3 2,199.1 75.2 15,129 14,629 500 96.7%
Prince George's 2,230.9 1,678.8 552.1 18,301 13,772 4,529 75.3%
Queen Anne's 97.9 88.4 9.5 13,088 11,820 1,269 90.3%
St. Mary's 226.5 201.7 24.8 13,349 11,887 1,462 89.0%
Somerset 47.7 41.1 6.6 17,453 15,047 2,407 86.2%
Talbot 64.0 52.0 12.0 14,639 11,884 2,755 81.2%
Washington 323.0 279.2 43.8 14,834 12,822 2,012 86.4%
Wicomico 230.9 184.1 46.8 15,868 12,654 3,214 79.7%
Worcester 90.9 104.7 0.0 14,488 16,693 0 115.2%
State Total $13,005.9 $11,595.9 $1,576.0 $15,396 $13,727 $1,866 87.9%
*Selected Financial Data, Fiscal 2015, Maryland State Department of Education. Figures exclude unallocated revenues and revenues spent on
student transportation and other revenues not linked to adequacy.
**State total excludes funding that exceeds adequacy targets.

Fiscal 2015 Adequacy Summary
• There was a statewide adequacy gap of $1.6 billion.
• Statewide, adequacy was funded at 87.9%.
• Six counties achieved 95.0% or above funding of their adequacy
targets; including four that exceeded their targets.
• Another five counties were funded at more than 90.0% of their
adequacy targets.
• Three counties were funded at less than 80.0% of adequacy.
8
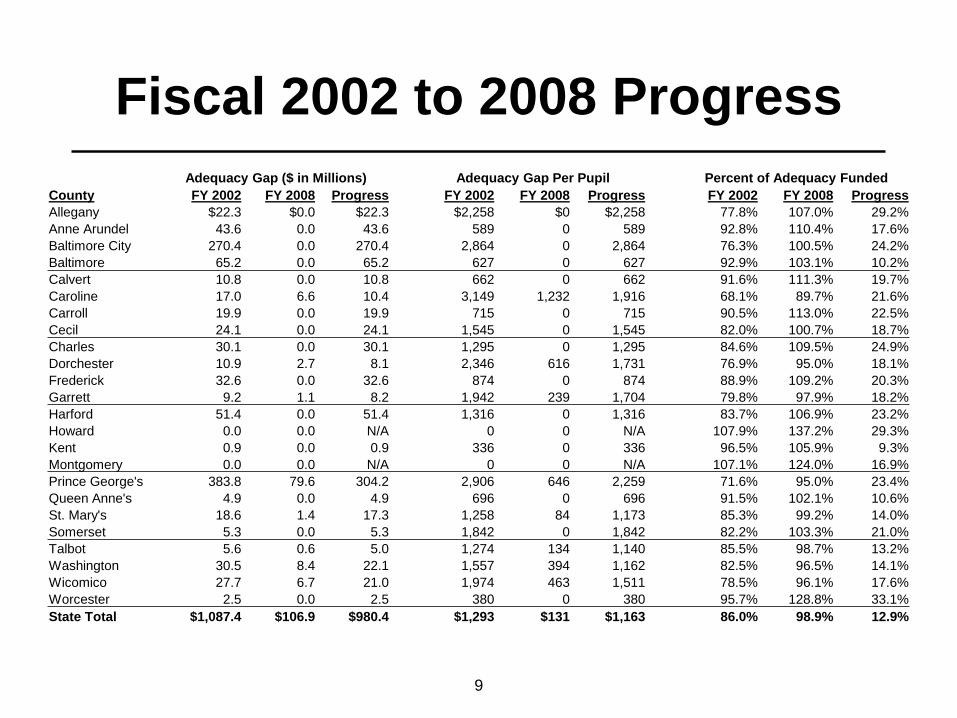
Fiscal 2002 to 2008 Progress
Adequacy Gap ($ in Millions) Adequacy Gap Per Pupil Percent of Adequacy Funded
County FY 2002 FY 2008 Progress FY 2002 FY 2008 Progress FY 2002 FY 2008 Progress
Allegany $22.3 $0.0 $22.3 $2,258 $0 $2,258 77.8% 107.0% 29.2%
Anne Arundel 43.6 0.0 43.6 589 0 589 92.8% 110.4% 17.6%
Baltimore City 270.4 0.0 270.4 2,864 0 2,864 76.3% 100.5% 24.2%
Baltimore 65.2 0.0 65.2 627 0 627 92.9% 103.1% 10.2%
Calvert 10.8 0.0 10.8 662 0 662 91.6% 111.3% 19.7%
Caroline 17.0 6.6 10.4 3,149 1,232 1,916 68.1% 89.7% 21.6%
Carroll 19.9 0.0 19.9 715 0 715 90.5% 113.0% 22.5%
Cecil 24.1 0.0 24.1 1,545 0 1,545 82.0% 100.7% 18.7%
Charles 30.1 0.0 30.1 1,295 0 1,295 84.6% 109.5% 24.9%
Dorchester 10.9 2.7 8.1 2,346 616 1,731 76.9% 95.0% 18.1%
Frederick 32.6 0.0 32.6 874 0 874 88.9% 109.2% 20.3%
Garrett 9.2 1.1 8.2 1,942 239 1,704 79.8% 97.9% 18.2%
Harford 51.4 0.0 51.4 1,316 0 1,316 83.7% 106.9% 23.2%
Howard 0.0 0.0 N/A 0 0 N/A 107.9% 137.2% 29.3%
Kent 0.9 0.0 0.9 336 0 336 96.5% 105.9% 9.3%
Montgomery 0.0 0.0 N/A 0 0 N/A 107.1% 124.0% 16.9%
Prince George's 383.8 79.6 304.2 2,906 646 2,259 71.6% 95.0% 23.4%
Queen Anne's 4.9 0.0 4.9 696 0 696 91.5% 102.1% 10.6%
St. Mary's 18.6 1.4 17.3 1,258 84 1,173 85.3% 99.2% 14.0%
Somerset 5.3 0.0 5.3 1,842 0 1,842 82.2% 103.3% 21.0%
Talbot 5.6 0.6 5.0 1,274 134 1,140 85.5% 98.7% 13.2%
Washington 30.5 8.4 22.1 1,557 394 1,162 82.5% 96.5% 14.1%
Wicomico 27.7 6.7 21.0 1,974 463 1,511 78.5% 96.1% 17.6%
Worcester 2.5 0.0 2.5 380 0 380 95.7% 128.8% 33.1%
State Total $1,087.4 $106.9 $980.4 $1,293 $131 $1,163 86.0% 98.9% 12.9%
9

Fiscal 2002 to 2008 Progress
• Statewide, the adequacy gap was narrowed by $980.4 million in fiscal 2008;
nearly all of the gap since 2002.
• The adequacy gap was eliminated in 14 counties.
• In 14 other counties, the per pupil gap was reduced by more than $1,000.
• In another six counties, the per pupil gap was reduced by more than $500.
• The percentage of adequacy funded increased to almost 100%.
10

Fiscal 2002 to 2015 Progress
Adequacy Gap ($ in Millions) Adequacy Gap Per Pupil Percent of Adequacy Funded
County FY 2002 FY 2015 Progress FY 2002 FY 2015 Progress FY 2002 FY 2015 Progress
Allegany $22.3 $13.9 $8.4 $2,258 $1,669 $589 77.8% 89.4% 11.6%
Anne Arundel 43.6 92.2 -48.6 589 1,190 -602 92.8% 91.4% -1.4%
Baltimore City 270.4 290.1 -19.7 2,864 3,611 -748 76.3% 81.7% 5.4%
Baltimore 65.2 233.4 -168.2 627 2,199 -1,572 92.9% 85.7% -7.2%
Calvert 10.8 0.0 10.8 662 0 662 91.6% 105.5% 13.9%
Caroline 17.0 19.2 -2.2 3,149 3,621 -472 68.1% 77.6% 9.4%
Carroll 19.9 0.0 19.9 715 0 715 90.5% 100.6% 10.0%
Cecil 24.1 29.8 -5.6 1,545 1,993 -447 82.0% 86.4% 4.4%
Charles 30.1 16.8 13.3 1,295 660 636 84.6% 95.2% 10.6%
Dorchester 10.9 14.2 -3.3 2,346 3,094 -748 76.9% 81.2% 4.4%
Frederick 32.6 35.8 -3.2 874 902 -28 88.9% 93.2% 4.3%
Garrett 9.2 3.1 6.1 1,942 845 1,097 79.8% 94.1% 14.3%
Harford 51.4 55.1 -3.7 1,316 1,499 -183 83.7% 88.8% 5.1%
Howard 0.0 0.0 N/A 0 0 N/A 107.9% 121.4% 13.5%
Kent 0.9 1.6 -0.7 336 802 -466 96.5% 94.8% -1.7%
Montgomery 0.0 75.2 -75.2 0 500 -500 107.1% 96.7% -10.4%
Prince George's 383.8 552.1 -168.3 2,906 4,529 -1,623 71.6% 75.3% 3.6%
Queen Anne's 4.9 9.5 -4.6 696 1,269 -573 91.5% 90.3% -1.2%
St. Mary's 18.6 24.8 -6.2 1,258 1,462 -205 85.3% 89.0% 3.8%
Somerset 5.3 6.6 -1.2 1,842 2,407 -565 82.2% 86.2% 4.0%
Talbot 5.6 12.0 -6.5 1,274 2,755 -1,481 85.5% 81.2% -4.3%
Washington 30.5 43.8 -13.4 1,557 2,012 -455 82.5% 86.4% 4.0%
Wicomico 27.7 46.8 -19.1 1,974 3,214 -1,240 78.5% 79.7% 1.2%
Worcester 2.5 0.0 2.5 380 0 380 95.7% 115.2% 19.5%
State Total $1,087.4 $1,576.0 -$488.6 $1,293 $1,866 -$572 86.0% 87.9% 1.9%
11

Fiscal 2002 to 2015 Progress
• Statewide, the adequacy gap increased by $488.6 million in fiscal 2015;
nearly half since fiscal 2002.
• In four counties, the per pupil gap increased by more than $1,000.
• In another six counties, the per pupil gap increased by $500 or more.
• On a per pupil basis, six counties gained ground toward filling the gap.
• The percentage of adequacy funded increased by 1.9 percentage points.
12

School System Funding Trends by Source
13
* Not including food service.
** Not including unallocated State aid.
6.0%
40.2%53.8%
Fiscal 2002
5.3%
47.4%
47.3%
Fiscal 2008
4.6%
49.1%
46.3%
Fiscal 2015
Local State Federal
Source: Selected Financial Data
FY 2002 to 2008 FY 2008 to 2015 Fiscal 2002 to 2015
Revenue Source Annual % Change Annual % Change Annual % Change
Federal Aid* 4.9% -0.1% 2.2%
State Aid** 10.2% 2.4% 5.9%
Local Appropriations 4.9% 1.6% 3.1%
Total 7.2% 1.9% 4.3%

Using Different Annual Per Pupil
Foundation Amounts
14
*Actual reflects statutory changes made after the enactment of the Bridge to Excellence in Public Schools Act of
2002 that altered the per pupil foundation amounts in fiscal 2009 through 2015.
**Fiscal 2009 through 2015 are inflated annually by the actual implicit price deflator (IPD) for State and local
government expenditures.
***Fiscal 2009 through 2015 are inflated by the lesser of IPD or the Consumer Price Index for All Urban Consumers
for the Washington-Baltimore metropolitan area (CPI-U) capped at 5% annually.
($ per Pupil)
Per Pupil Foundation Amount Fiscal 2002 Fiscal 2008 Fiscal 2015
Actual* $4,124 $6,694 $6,860
Full Adequacy Using IPD** $5,443 $6,694 $8,171
$ Difference $1,319 $0 $1,311
% Difference 32% 0% 19%
Full Adequacy Using Lesser of CPI-U and IPD*** $5,443 $6,694 $7,639
$ Difference $1,319 $0 $779
% Difference 32% 0% 11%

State Education Aid Using Different
Per Pupil Foundation Amounts
FY 2008 FY 2009 FY 2010 FY 2011 FY 2012 FY 2013 FY 2014 FY 2015
Actual State Aid* $4,170.0 $4,276.5 $4,324.2 $4,439.4 $4,509.2 $4,621.2 $4,747.1 $4,869.6
IPD (actual)** 4,170.0 4,449.5 4,724.9 4,858.2 5,063.4 5,318.6 5,489.4 5,712.1
Difference vs. Actual $0.0 -$173.1 -$400.7 -$418.8 -$554.2 -$697.4 -$742.3 -$842.4
Lesser of CPI-U and IPD*** 4,170.0 4,363.5 4,571.0 4,700.6 4,811.1 5,058.2 5,217.2 5,349.6
Difference vs. Actual $0.0 -$87.0 -$246.8 -$261.2 -$301.9 -$437.1 -$470.1 -$479.9
15
($ in Millions)
*Actual reflects statutory changes made after the enactment of the Bridge to Excellence in Public Schools Act of 2002 that altered
the per pupil foundation amounts in fiscal 2009 through 2015.
**Fiscal 2009 through 2015 are inflated annually by the implicit price deflator (IPD) for State and local government expenditures.
***Fiscal 2009 through 2015 are inflated by the lesser of IPD or the Consumer Price Index for All Urban Consumers for the
Washington-Baltimore metropolitan area (CPI-U) capped at 5% annually.

Fiscal 2015 State and Local Funding –
Actual, Target, and APA Proposed
16
Note: For comparability, all funding excludes transportation, retirement, and other funding not associated with
adequacy. Also excludes federal funds.
*Target weights for compensatory education, limited English proficiency, and special education aid formulas are
adjusted for federal funds.
Source: Department of Legislative Services
$10,163$11,100
$12,948
$0
$2,000
$4,000
$6,000
$8,000
$10,000
$12,000
$14,000
Actual Adequacy Target* APA Proposed
($ in
Mil
lio
ns
)

Appendix
17

State Aid Trend
18
($ in Millions) Average Annual % Change
County FY 2002 FY 2008 FY 2015 2002 to 2008 2008 to 2015
Allegany $47.9 $88.9 $85.2 10.8% -0.6%
Anne Arundel 203.2 313.0 396.2 7.5% 3.4%
Baltimore City 584.3 889.8 982.9 7.3% 1.4%
Baltimore 308.3 572.1 684.6 10.9% 2.6%
Calvert 49.7 94.7 96.5 11.4% 0.3%
Caroline 24.5 45.2 53.2 10.7% 2.4%
Carroll 89.4 158.0 156.0 10.0% -0.2%
Cecil 57.9 107.1 114.9 10.8% 1.0%
Charles 81.4 161.1 184.4 12.0% 1.9%
Dorchester 19.7 33.7 41.6 9.4% 3.0%
Frederick 113.6 222.0 266.9 11.8% 2.7%
Garrett 20.2 28.1 24.5 5.7% -1.9%
Harford 128.3 231.8 235.1 10.4% 0.2%
Howard 117.6 222.5 281.3 11.2% 3.4%
Kent 9.1 11.7 11.9 4.2% 0.2%
Montgomery 278.5 511.6 787.0 10.7% 6.3%
Prince George's 514.0 995.8 1,104.8 11.7% 1.5%
Queen Anne's 20.9 34.0 39.7 8.5% 2.3%
St. Mary's 52.5 99.2 111.3 11.2% 1.7%
Somerset 13.9 25.6 31.9 10.6% 3.2%
Talbot 7.5 12.9 17.0 9.4% 4.1%
Washington 69.8 147.8 183.9 13.3% 3.2%
Wicomico 54.5 113.7 142.0 13.0% 3.2%
Worcester 11.1 22.4 26.3 12.4% 2.3%
State Total $2,877.8 $5,142.6 $6,059.0 10.2% 2.4%
Note: Includes transportation and other State aid programs not linked to adequacy. Excludes unallocated State aid.
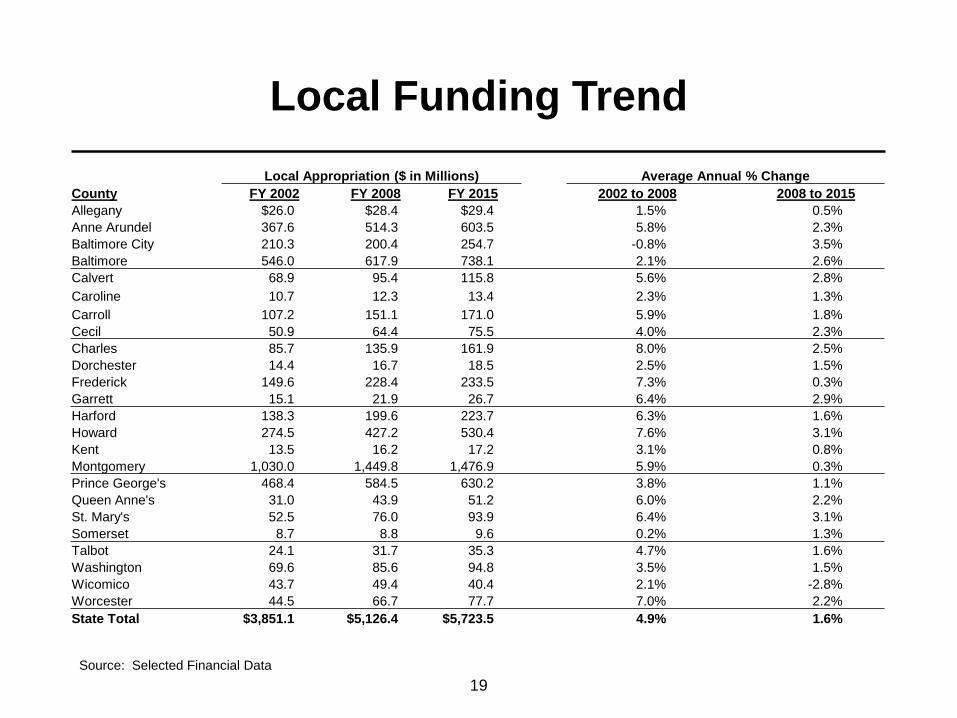
Local Funding Trend
19
Source: Selected Financial Data
Local Appropriation ($ in Millions) Average Annual % Change
County FY 2002 FY 2008 FY 2015 2002 to 2008 2008 to 2015
Allegany $26.0 $28.4 $29.4 1.5% 0.5%
Anne Arundel 367.6 514.3 603.5 5.8% 2.3%
Baltimore City 210.3 200.4 254.7 -0.8% 3.5%
Baltimore 546.0 617.9 738.1 2.1% 2.6%
Calvert 68.9 95.4 115.8 5.6% 2.8%
Caroline 10.7 12.3 13.4 2.3% 1.3%
Carroll 107.2 151.1 171.0 5.9% 1.8%
Cecil 50.9 64.4 75.5 4.0% 2.3%
Charles 85.7 135.9 161.9 8.0% 2.5%
Dorchester 14.4 16.7 18.5 2.5% 1.5%
Frederick 149.6 228.4 233.5 7.3% 0.3%
Garrett 15.1 21.9 26.7 6.4% 2.9%
Harford 138.3 199.6 223.7 6.3% 1.6%
Howard 274.5 427.2 530.4 7.6% 3.1%
Kent 13.5 16.2 17.2 3.1% 0.8%
Montgomery 1,030.0 1,449.8 1,476.9 5.9% 0.3%
Prince George's 468.4 584.5 630.2 3.8% 1.1%
Queen Anne's 31.0 43.9 51.2 6.0% 2.2%
St. Mary's 52.5 76.0 93.9 6.4% 3.1%
Somerset 8.7 8.8 9.6 0.2% 1.3%
Talbot 24.1 31.7 35.3 4.7% 1.6%
Washington 69.6 85.6 94.8 3.5% 1.5%
Wicomico 43.7 49.4 40.4 2.1% -2.8%
Worcester 44.5 66.7 77.7 7.0% 2.2%
State Total $3,851.1 $5,126.4 $5,723.5 4.9% 1.6%

Federal Funding Trend
20
Source: Selected Financial Data. Excludes food service funding.
($ in Millions) Average Annual % Change
County FY 2002 FY 2008 FY 2015 2002 to 2008 2008 to 2015
Allegany $9.0 $8.6 $10.4 -0.7% 2.7%
Anne Arundel 28.0 39.3 41.9 5.8% 0.9%
Baltimore City 125.0 138.2 119.8 1.7% -2.0%
Baltimore 40.2 65.8 64.2 8.6% -0.4%
Calvert 6.3 6.9 8.5 1.7% 2.9%
Caroline 3.8 4.4 4.6 2.4% 0.8%
Carroll 8.6 10.7 11.1 3.7% 0.5%
Cecil 7.2 7.9 10.0 1.7% 3.5%
Charles 8.0 11.8 12.1 6.6% 0.4%
Dorchester 4.2 5.2 5.5 3.7% 0.8%
Frederick 11.6 14.3 16.5 3.6% 2.0%
Garrett 4.2 4.1 3.9 -0.4% -0.7%
Harford 14.9 16.9 19.2 2.2% 1.8%
Howard 9.5 17.2 19.5 10.4% 1.8%
Kent 2.9 2.3 2.2 -3.3% -0.9%
Montgomery 43.8 77.3 74.0 9.9% -0.6%
Prince George's 59.0 88.5 84.2 7.0% -0.7%
Queen Anne's 3.9 4.1 4.7 1.2% 1.7%
St. Mary's 10.0 10.8 14.0 1.4% 3.7%
Somerset 3.9 5.1 3.8 4.5% -4.3%
Talbot 3.0 2.7 3.4 -1.7% 3.6%
Washington 9.0 12.8 16.4 6.2% 3.5%
Wicomico 8.2 10.8 12.3 4.7% 1.9%
Worcester 5.1 6.6 7.7 4.5% 2.2%
State Total $429.1 $572.6 $569.9 4.9% -0.1%