adelaide desalination toxicity assessment of an outfall
TRANSCRIPT

ecotox SERVICES AUSTRALASIA
Toxicity Assessment of an Outfall Sample from the Adelaide Desalination Plant
Adelaide Aqua
Test Report
March 2013

ecotox SERVICES AUSTRALASIA
ECOTOX Services Australas i a Pty Ltd ABN >45 094 714 904
un i t 27 / 2 chap l in drive l a n e cove nsw 2066 T >6 1 2 9420 9481 F >61 2 9420 94 8 4 W > w ww . eco t ox.com . au
Toxicity Assessment of an Outfall Sample from the Adelaide Desalination Plant
Adelaide Aqua
Test Report
March 2013
A NATA
V WORLO RECOGNISEO
ACCREDITATION
ECOTOX Services Australasia Pty Ltd ABN>45 094 714 904
unit 27/2 chaplin drive lane cove nsw 2• 066 T•~~1• 2 9420 9481
..:). ·.- ' . '
ecotox SERVICES AUSTRALASIA
F > 6 ~ 2 9 4 2 0 9 4 8 4 W r;w_ W . e C O t O X . CO m . a U
•'
Toxicity Test Report: TR0997/1 (Page 1 of 2)
This document is issued in accordance with NATA’s accreditation requirements
Client: Adelaide Aqua ESA Job #: PR0997 16 Chrysler Rd Date Sampled: 25 March 2013 Lonsdale SA 5160 Date Received: 27 March 2013
Attention: Vanessa Ayala Sampled By: Client Client Ref: Not supplied ESA Quote #: PL0997_q01
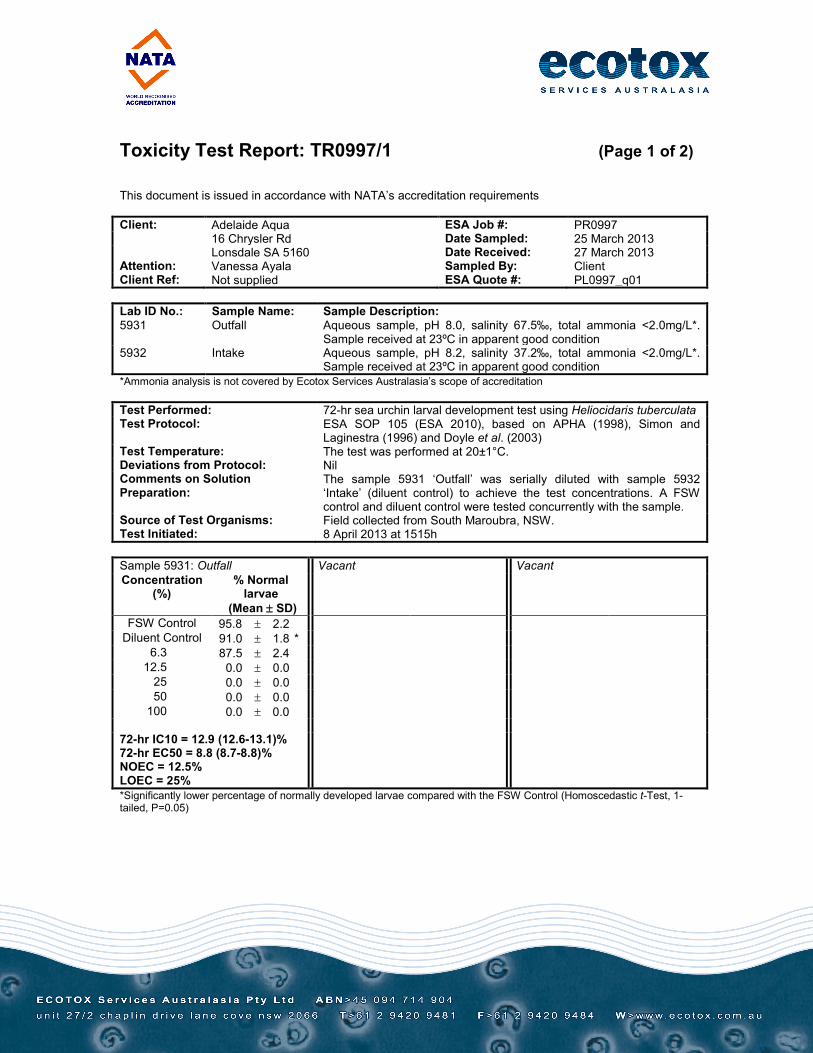
Lab ID No.: Sample Name: Sample Description: 5931 Outfall Aqueous sample, pH 8.0, salinity 67.5‰, total ammonia <2.0mg/L*.
Sample received at 23ºC in apparent good condition 5932 Intake Aqueous sample, pH 8.2, salinity 37.2‰, total ammonia <2.0mg/L*.
Sample received at 23ºC in apparent good condition *Ammonia analysis is not covered by Ecotox Services Australasia’s scope of accreditation
Test Performed: 72-hr sea urchin larval development test using Heliocidaris tuberculata Test Protocol: ESA SOP 105 (ESA 2010), based on APHA (1998), Simon and
Laginestra (1996) and Doyle et al. (2003) Test Temperature: The test was performed at 20±1°C. Deviations from Protocol: Nil Comments on Solution The sample 5931 ‘Outfall’ was serially diluted with sample 5932 Preparation: ‘Intake’ (diluent control) to achieve the test concentrations. A FSW
control and diluent control were tested concurrently with the sample. Source of Test Organisms: Field collected from South Maroubra, NSW. Test Initiated: 8 April 2013 at 1515h
Sample 5931: Outfall Concentration % Normal
(%) larvae (Mean ± SD)
Vacant Vacant
FSW Control 95.8 ± 2.2 Diluent Control 91.0 ± 1.8 *
6.3 87.5 ± 2.4 12.5 0.0 ± 0.0
25 0.0 ± 0.0 50 0.0 ± 0.0
100 0.0 ± 0.0
72-hr IC10 = 12.9 (12.6-13.1)% 72-hr EC50 = 8.8 (8.7-8.8)% NOEC = 12.5% LOEC = 25% *Significantly lower percentage of normally developed larvae compared with the FSW Control (Homoscedastic t-Test, 1-tailed, P=0.05)

A NATA
V WORLO RECOGNISEO
ACCREDITATION
ECOTOX Services Australasia Pty Ltd ABN>45 094 714 904
unit 27/2 chaplin drive lane cove nsw 2• 066 T•~~1• 2 9420 9481
..:). ·.- ' . '
ecotox SERVICES AUSTRALASIA
F > 6 ~ 2 9 4 2 0 9 4 8 4 W r;w_ W . e C O t O X . CO m . a U
•'
Toxicity Test Report: TR0997/1 (Page 2 of 2)
QA/QC Parameter Criterion This Test Criterion met? Control mean % normal larvae ≥70.0% 95.8% Yes Reference Toxicant within cusum chart limits 6.0-17.2µg Cu/L 9.7µg Cu/L Yes
Test Report Authorised by: Dr Rick Krassoi, Director on 10 May 2013
Results are based on the samples in the condition as received by ESA.
NATA Accredited Laboratory Number: 14709 This document is issued in accordance with NATA’s accreditation requirements. Accredited for compliance with ISO/IEC 17025. NATA is a signatory to the APLAC mutual recognition arrangement for the mutual recognition of the equivalence of testing, calibration and inspection reports. This document shall not be reproduced except in full.
Citations:
APHA (1998) Method 8810 D. Echinoderm Embryo Development Test. In Standard Methods for the Examination of Water and Wastewater, 20th Ed. American Public Health Association, American Water Works Association and the Water Environment Federation, USA.
Doyle, C.J., Pablo, F., Lim, R.P. and Hyne, R.V. (2003) Assessment of metal toxicity in sediment pore water from Lake Macquarie, Australia. Arch. Environ. Contam. Toxicology, 44(3): 343-350.
ESA (2010) ESA SOP 105 - Sea Urchin Larval Development Test. Issue No. 9. Ecotox Services Australasia, Sydney NSW.
Simon, J. and Laginestra, E.(1997) Bioassay for testing sublethal toxicity in effluents, using gametes of sea urchin Heliocidaris tuberculata. National Pulp Mills Research Program Technical Report No. 20. CSIRO, Canberra, ACT.

A NATA
V W~LD AtCOONIMl!D ACCRliDITATION
ECOTOX Services Aust r a l asia Pty Ltd ABN >45 094 714 904
T•':,.~ 1 2 9420 9481 unit 27/2 cha pl in
G;· drive l ane cove ' ,,, ns~. 2066
',-·,JY
ecotox SERVICES AUSTRALASIA
F>.6 ~ 2 9420 9484
R W ("':''":t- w . e c o t o x . c o m . a u
.. , ...
Toxicity Test Report: TR0997/2 (Page 1 of 2)
This document is issued in accordance with NATA’s accreditation requirements
Client: Adelaide Aqua ESA Job #: PR0997 16 Chrysler Rd Date Sampled: 25 March 2013 Lonsdale SA 5160 Date Received: 27 March 2013
Attention: Vanessa Ayala Sampled By: Client Client Ref: Not supplied ESA Quote #: PL0997_q01
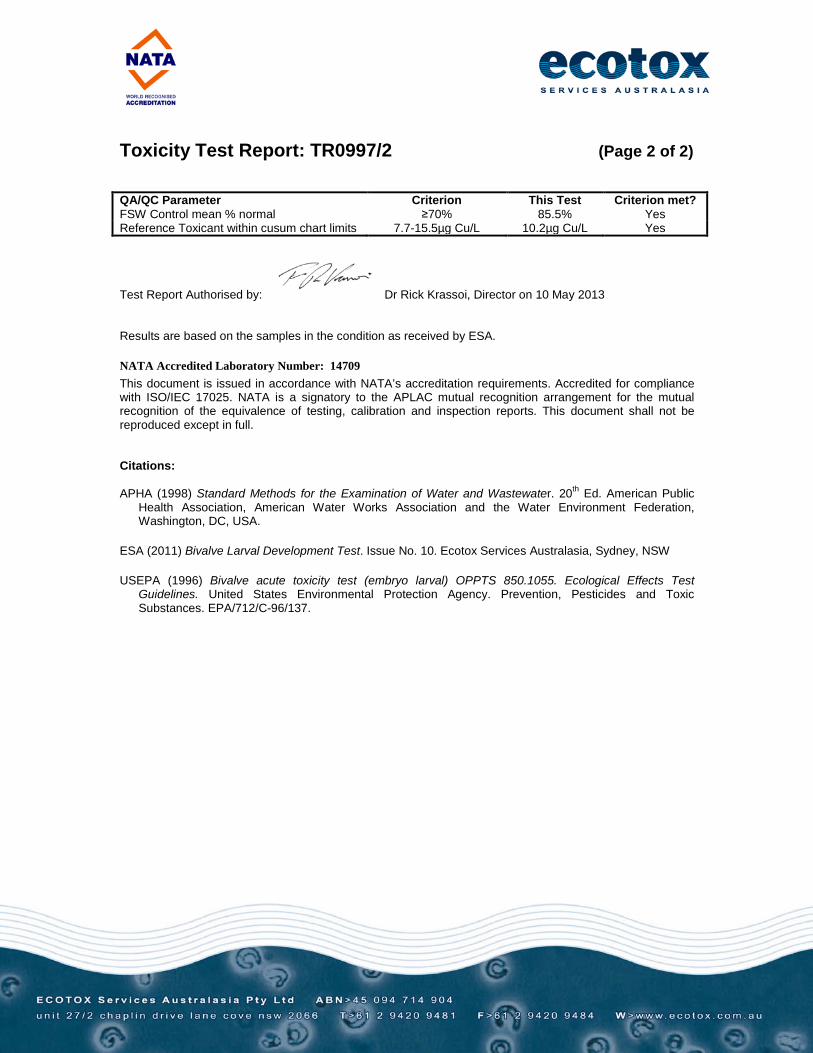
Lab ID No.: Sample Name: Sample Description: 5931 Outfall Aqueous sample, pH 8.0, salinity 67.5‰, total ammonia <2.0mg/L*.
Sample received at 23ºC in apparent good condition 5932 Intake Aqueous sample, pH 8.2, salinity 37.2‰, total ammonia <2.0mg/L*.
Sample received at 23ºC in apparent good condition *Ammonia analysis is not covered by Ecotox Services Australasia’s scope of accreditation
Test Performed: 48-hr larval development test using the mussel Mytilus galloprovincialis Test Protocol: ESA SOP 106 (ESA 2011), based on APHA (1998) and USEPA (1996) Test Temperature: The test was performed at 20±1°C. Deviations from Protocol: The test was extended to 72 hours Comments on Solution The sample 5931 ‘Outfall’ was serially diluted with sample 5932 Preparation: ‘Intake’ (diluent control) to achieve the test concentrations. A FSW
control and diluent control were tested concurrently with the sample. Source of Test Organisms: Gulf of St Vincent, SA Test Initiated: 5 April 2013 at 1300h
Sample 5931: Outfall Concentration % Normal
(%) larvae (Mean ± SD)
Vacant Vacant
FSW Control 85.5 ± 8.5 Diluent Control 88.5 ± 7.1
6.3 83.8 ± 8.3 12.5 0.0 ± 0.0
25 0.0 ± 0.0 50 0.0 ± 0.0
100 0.0 ± 0.0
72-hr IC10 = 6.4%* 72-hr EC50 = 8.7 (8.6-8.8)% NOEC = 6.3% LOEC = 12.5% *95% confidence limits are not reliable
A NATA
V W~LD AtCOONIMl!D ACCRliDITATION
ECOTOX Services Aust r a l asia Pty Ltd ABN >45 094 714 904
T•':,.~ 1 2 9420 9481 unit 27/2 cha pl in
G;· drive l ane cove ' ,,, ns~. 2066
',-·,JY
ecotox SERVICES AUSTRALASIA
F>.6 ~ 2 9420 9484
R W ("':''":t- w . e c o t o x . c o m . a u
.. , ...
Toxicity Test Report: TR0997/2 (Page 2 of 2)
QA/QC Parameter Criterion This Test Criterion met? FSW Control mean % normal ≥70% 85.5% Yes Reference Toxicant within cusum chart limits 7.7-15.5µg Cu/L 10.2µg Cu/L Yes
Test Report Authorised by: Dr Rick Krassoi, Director on 10 May 2013
Results are based on the samples in the condition as received by ESA.
NATA Accredited Laboratory Number: 14709 This document is issued in accordance with NATA’s accreditation requirements. Accredited for compliance with ISO/IEC 17025. NATA is a signatory to the APLAC mutual recognition arrangement for the mutual recognition of the equivalence of testing, calibration and inspection reports. This document shall not be reproduced except in full.
Citations:
APHA (1998) Standard Methods for the Examination of Water and Wastewater. 20th Ed. American Public Health Association, American Water Works Association and the Water Environment Federation, Washington, DC, USA.
ESA (2011) Bivalve Larval Development Test. Issue No. 10. Ecotox Services Australasia, Sydney, NSW
USEPA (1996) Bivalve acute toxicity test (embryo larval) OPPTS 850.1055. Ecological Effects Test Guidelines. United States Environmental Protection Agency. Prevention, Pesticides and Toxic Substances. EPA/712/C-96/137.
ecotox SERVICES AUSTRALAS I A
Chain-of-Custody Documentation

TRUE
ecotox SERVICES AUSTRALASIA
□ 0
Datasheet ID: 601.2
Last Revised: 30 April 2009
Sample Receipt Notification Attention : Vanessa Ayala
Client : Adelaide Aqua 16 Chrysler Road Lonsdale SA 5160
Email TelephoneFacsimile
: [email protected] : 400827816 :
Date : 27/03/2012
Re : Receipt of samples Pages : 2
ESA Project : PR0686 For Review Additional Documentation Required - Please Respond
Sample Delivery Details
Completed Chain of Custody accompanied samples: Samples received in apparent good condition and correctly bottled: Security seals on sample bottles and esky intact:
YES YES YES
Date samples received Time samples received No. of samples received Sample matrix Sample temperature
: 27/03/2013 : 10:00 : 2 : aqueous : 21-25°C
Comments : Includes 1 x 10L Intake (ESA ID# 5932) and 1 x 2.5L OUTFALL (ESA ID# 5931)
Contact Details
Customer Services Officer : Tina Micevska Telephone : 61 2 9420 9481 Facsimile : 61 2 9420 9484 Email : [email protected]
Please contact customer services officer for all queries or issues regarding samples
Note that the chain-of-custody provides definitive information on the tests to be performed
Ecotox Services Australia ABN 45 094 714 904 Phone : 61 2 9420 9481 Unit 27, 2 Chaplin Drive Fax : 61 2 9420 9484 Lane Cove NSW 2066 Australia Email : [email protected]

Chain-of-Custody/ Service Request Form ecotoxDalasheel ID: 601 .1
SERI/ICES AUSTRALASIALast Revised: 22 January 2013
Customer: ADP Ad~~ tfi2, f{y, 0d ~ Ship To: ~tot .s~~ Contact Name: VOh'le,s..A Attention: .. /'lvt°' 1'11 i'c;ze.tl.S.IZ<Zi ' Phone: (please provide an email address for sample receipt notification) 040082.78/6 Email:
Sampled by: cJ~~- ~ C-bO-O..\A..• f ...rA_¼@_ o..cle.hi~~~V~ ~e.J- .OJ..<....
Sample Sample Name Sample Number and Tests Requested Comments/ Instructions Sample Time Method Volume of - [S..=•"" '°' '"~'""')I Note that testing will be delayed if an
Date Containers I
incomplete chain of custody is received
(exactly as written on the sample (eg. Grab, (eg 2 X 1 L) • Additional treatment of samples (i.e. spiking) (day/month vessel) composite etc.) • Sub-contracted services (i.e. chemical
/year) analyses). Dilutions required (if different than 100% down to 6.25%)
• Sample holding time restriction (if applicable)
I . Sample used for lrt1gation (if applicable)
Note: An MSDS must be attached if Available
ESA Project Number: PRQ to&~
J.:~ 10.;>f1~ _ r \ : Jo 'T"Y1+ctke ~ I ("') LX. \ -- --
:2.(/_o~ lJ~ _ rt:"t-5 r-.t?TPALL 2-5 L'i-- \ - --- -- - - --- ------ - --
- ~ - - - -- - --- - --~~ .. --~-- -· - -
- - - -- -
~l13:l
'c,G(2j
1) Released By:
c,h~ Date: ~_3 2) Received By:
1 FLA..u)-Date:
?, --:} 3,-1 ) 3) Released By: Dale: 4) Received By: Date:
Of: Time:
\ 2~ _g C) Of:
(::<y\ Time:
1.J ):) Of: Time: Of: Time:
Note that the chain-of-custody documentation will provide definitive information on the tests to be performed.
Ecotox Services Australasia. Unit 27, 2 Chaplin Drive, Lane Cove NSW 2066 AUSTRALIA Phone: 61 2 9420-9481 Fax 61 2 9420-9484 [email protected] Page __ of __

ecotox SERVICES AUSTRALAS I A
Statistical Printouts for the Sea Urchin Larval Development Test

Sea Urchin Larval Development Test-Proportion Normal Start Date: 8/04/2013 15:15 Test ID: PR0997/02 Sample ID: OUTFALL End Date: 11/04/2013 15:00 Lab ID: 5931 Sample Type: AQ-Aqueous Sample Date: Protocol: ESA 105 Test Species: HT-Heliocidaris tuberculata Comments:
Conc-% 1 2 3 4 FSW Control 0.9800 0.9500 0.9300 0.9700
Diluent Control 0.9000 0.8900 0.9300 0.9200 6.3 0.9000 0.8600 0.8500 0.8900
12.5 0.0000 0.0000 0.0000 0.0000 25 0.0000 0.0000 0.0000 0.0000 50 0.0000 0.0000 0.0000 0.0000
100 0.0000 0.0000 0.0000 0.0000
Transform: Arcsin Square Root 1-Tailed Number Total Conc-% Mean N-Mean Mean Min Max CV% N t-Stat Critical MSD Resp Number
FSW Control 0.9575 1.0522 1.3685 1.3030 1.4289 4.062 4 Diluent Control 0.9100 1.0000 1.2672 1.2327 1.3030 2.531 4 * 36 400
*6.3 0.8750 0.9615 1.2105 1.1731 1.2490 2.985 4 2.346 1.943 0.0469 50 400 12.5 0.0000 0.0000 0.0500 0.0500 0.0500 0.000 4 400 400
25 0.0000 0.0000 0.0500 0.0500 0.0500 0.000 4 400 400 50 0.0000 0.0000 0.0500 0.0500 0.0500 0.000 4 400 400
100 0.0000 0.0000 0.0500 0.0500 0.0500 0.000 4 400 400
Auxiliary Tests Statistic Critical Skew Kurt Shapiro-Wilk's Test indicates normal distribution (p > 0.05) 0.87083 0.818 0.040145 -2.17718 F-Test indicates equal variances (p = 0.85) 1.269665 47.46723 The control means are significantly different (p = 0.02) 3.156177 2.446912 Hypothesis Test (1-tail, 0.05) MSDu MSDp MSB MSE F-Prob df Homoscedastic t Test indicates significant differences 0.028551 0.031353 0.006423 0.001167 0.057379 1, 6 Treatments vs Diluent Control
Trimmed Spearman-Karber Trim Level EC50 95% CL
0.0% 5.0% 8.7533 8.6912 8.8159
10.0% 8.7533 8.6912 8.8159 20.0% 8.7533 8.6912 8.8159
Auto-3.8% 8.7533 8.6912 8.8159
Res
pons
e
1.0
0.9
0.8
0.7
0.6
0.5
0.4
0.3
0.2
0.1
0.0 1 10 100
Dose %
Page 1 ToxCalc v5.0.23 Reviewed by:_____

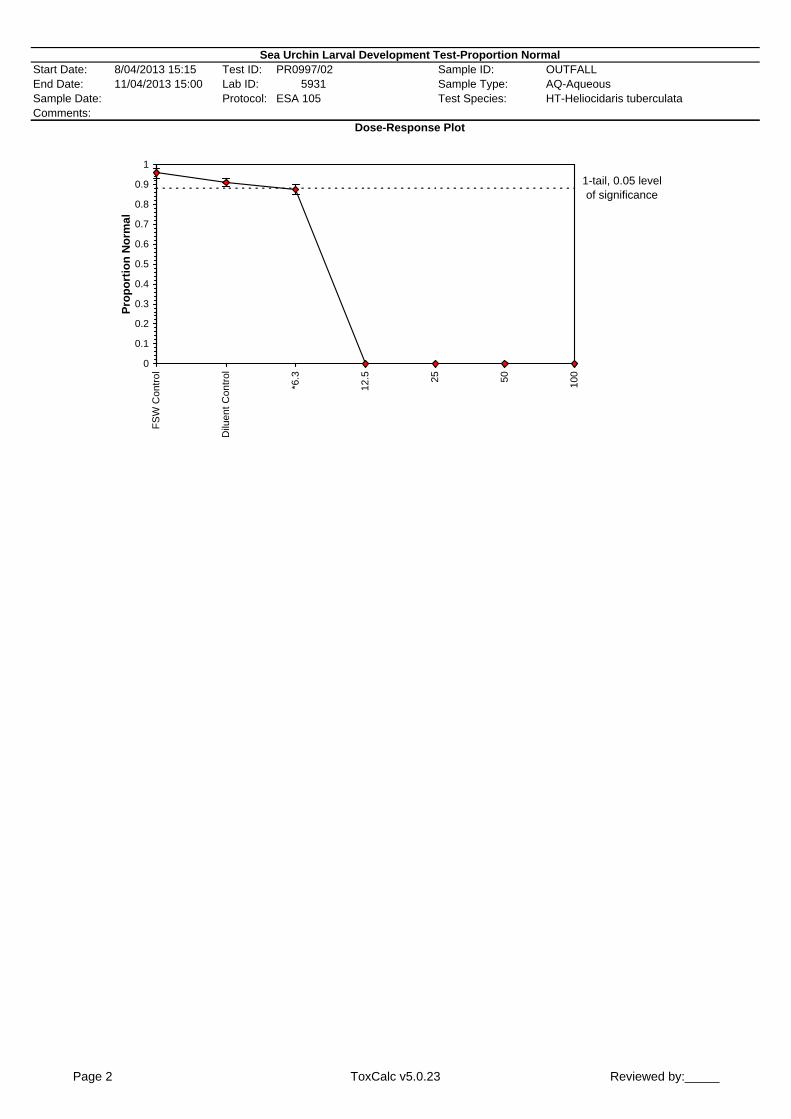
Sea Urchin Larval Development Test-Proportion Normal Start Date: 8/04/2013 15:15 Test ID: PR0997/02 Sample ID: OUTFALL End Date: 11/04/2013 15:00 Lab ID: 5931 Sample Type: AQ-Aqueous Sample Date: Protocol: ESA 105 Test Species: HT-Heliocidaris tuberculata Comments:
Dose-Response Plot
1-tail, 0.05 level of significance
0
0.1
0.2
0.3
0.4
0.5
0.6
0.7
0.8
0.9
1
Prop
ortio
n N
orm
al
FSW
Con
trol
Dilu
ent C
ontro
l
*6.3
12.5
25 50 100
Page 2 ToxCalc v5.0.23 Reviewed by:_____

Sea Urchin Larval Development Test-Proportion Normal Start Date: 8/04/2013 15:15 Test ID: PR0997/02 Sample ID: OUTFALL End Date: 11/04/2013 15:00 Lab ID: 5931 Sample Type: AQ-Aqueous Sample Date: Protocol: ESA 105 Test Species: HT-Heliocidaris tuberculata Comments:
Auxiliary Data Summary Conc-% Parameter Mean Min Max SD CV% N
FSW Control % Normal 95.75 93.00 98.00 2.22 1.56 4 Diluent Control 91.00 89.00 93.00 1.83 1.48 4
6.3 87.50 85.00 90.00 2.38 1.76 4 12.5 0.00 0.00 0.00 0.00 4
25 0.00 0.00 0.00 0.00 4 50 0.00 0.00 0.00 0.00 4
100 0.00 0.00 0.00 0.00 4 FSW Control pH 8.10 8.10 8.10 0.00 0.00 1
Diluent Control 8.10 8.10 8.10 0.00 0.00 1 6.3 8.10 8.10 8.10 0.00 0.00 1
12.5 8.10 8.10 8.10 0.00 0.00 1 25 8.10 8.10 8.10 0.00 0.00 1 50 8.10 8.10 8.10 0.00 0.00 1
100 8.00 8.00 8.00 0.00 0.00 1 FSW Control Salinity ppt 33.10 33.10 33.10 0.00 0.00 1
Diluent Control 37.30 37.30 37.30 0.00 0.00 1 6.3 39.10 39.10 39.10 0.00 0.00 1
12.5 41.30 41.30 41.30 0.00 0.00 1 25 45.10 45.10 45.10 0.00 0.00 1 50 52.70 52.70 52.70 0.00 0.00 1
100 67.80 67.80 67.80 0.00 0.00 1 FSW Control DO % 106.40 106.40 106.40 0.00 0.00 1
Diluent Control 93.60 93.60 93.60 0.00 0.00 1 6.3 104.20 104.20 104.20 0.00 0.00 1
12.5 107.70 107.70 107.70 0.00 0.00 1 25 107.70 107.70 107.70 0.00 0.00 1 50 108.70 108.70 108.70 0.00 0.00 1
100 106.90 106.90 106.90 0.00 0.00 1
Page 3 ToxCalc v5.0.23 Reviewed by:_____

Sea Urchin Larval Development Test-Proportion Normal Start Date: 8/04/2013 15:15 Test ID: PR0997/02 Sample ID: OUTFALL End Date: 11/04/2013 15:00 Lab ID: 5931 Sample Type: AQ-Aqueous Sample Date: Protocol: ESA 105 Test Species: HT-Heliocidaris tuberculata Comments:
Conc-% 1 2 3 4 FSW Control 0.9800 0.9500 0.9300 0.9700
Diluent Control 0.9000 0.8900 0.9300 0.9200 6.3 0.9000 0.8600 0.8500 0.8900
12.5 0.0000 0.0000 0.0000 0.0000 25 0.0000 0.0000 0.0000 0.0000 50 0.0000 0.0000 0.0000 0.0000
100 0.0000 0.0000 0.0000 0.0000
Transform: Arcsin Square Root 1-Tailed Isotonic Conc-% Mean N-Mean Mean Min Max CV% N t-Stat Critical MSD Mean N-Mean
FSW Control 0.9575 1.0522 1.3685 1.3030 1.4289 4.062 4 Diluent Control 0.9100 1.0000 1.2672 1.2327 1.3030 2.531 4 * 0.9100 1.0000
*6.3 0.8750 0.9615 1.2105 1.1731 1.2490 2.985 4 2.346 1.943 0.0469 0.8750 0.9615 12.5 0.0000 0.0000 0.0500 0.0500 0.0500 0.000 4 0.0000 0.0000
25 0.0000 0.0000 0.0500 0.0500 0.0500 0.000 4 0.0000 0.0000 50 0.0000 0.0000 0.0500 0.0500 0.0500 0.000 4 0.0000 0.0000
100 0.0000 0.0000 0.0500 0.0500 0.0500 0.000 4 0.0000 0.0000
Auxiliary Tests Statistic Critical Skew Kurt Shapiro-Wilk's Test indicates normal distribution (p > 0.05) 0.87083 0.818 0.040145 -2.17718 F-Test indicates equal variances (p = 0.85) 1.269665 47.46723 The control means are significantly different (p = 0.02) 3.156177 2.446912 Hypothesis Test (1-tail, 0.05) MSDu MSDp MSB MSE F-Prob df Homoscedastic t Test indicates significant differences 0.028551 0.031353 0.006423 0.001167 0.057379 1, 6 Treatments vs Diluent Control
Log-Logit Interpolation (200 Resamples) Point % SD 95% CL(Exp) Skew IC05 6.3374 0.6757 2.4060 6.4645 -2.6579 IC10 6.4777 0.0416 6.3445 6.5975 -0.2364 IC15 6.5945 0.0395 6.4647 6.7087 -0.2168 1.0 IC20 6.6972 0.0382 6.5700 6.8046 -0.2003 0.9IC25 6.7908 0.0372 6.6662 6.8966 -0.1867 IC40 7.0441 0.0352 6.9274 7.1451 -0.1588 0.8 IC50 7.2076 0.0343 7.0948 7.3072 -0.1472 0.7
0.6
0.5
0.4
0.3
0.2
0.1
0.0
Res
pons
e
1 10 100
Dose %
Page 1 ToxCalc v5.0.23 Reviewed by:_____
Sea Urchin Larval Development Test-Proportion Normal Start Date: 8/04/2013 15:15 Test ID: PR0997/02 Sample ID: OUTFALL End Date: 11/04/2013 15:00 Lab ID: 5931 Sample Type: AQ-Aqueous Sample Date: Protocol: ESA 105 Test Species: HT-Heliocidaris tuberculata Comments:
Dose-Response Plot
1-tail, 0.05 level of significance
0
0.1
0.2
0.3
0.4
0.5
0.6
0.7
0.8
0.9
1
Prop
ortio
n N
orm
al
FSW
Con
trol
Dilu
ent C
ontro
l
*6.3
12.5
25 50 100
Page 2 ToxCalc v5.0.23 Reviewed by:_____

Sea Urchin Larval Development Test-Proportion Normal Start Date: 8/04/2013 15:15 Test ID: PR0997/02 Sample ID: OUTFALL End Date: 11/04/2013 15:00 Lab ID: 5931 Sample Type: AQ-Aqueous Sample Date: Protocol: ESA 105 Test Species: HT-Heliocidaris tuberculata Comments:
Auxiliary Data Summary Conc-% Parameter Mean Min Max SD CV% N
FSW Control % Normal 95.75 93.00 98.00 2.22 1.56 4 Diluent Control 91.00 89.00 93.00 1.83 1.48 4
6.3 87.50 85.00 90.00 2.38 1.76 4 12.5 0.00 0.00 0.00 0.00 4
25 0.00 0.00 0.00 0.00 4 50 0.00 0.00 0.00 0.00 4
100 0.00 0.00 0.00 0.00 4 FSW Control pH 8.10 8.10 8.10 0.00 0.00 1
Diluent Control 8.10 8.10 8.10 0.00 0.00 1 6.3 8.10 8.10 8.10 0.00 0.00 1
12.5 8.10 8.10 8.10 0.00 0.00 1 25 8.10 8.10 8.10 0.00 0.00 1 50 8.10 8.10 8.10 0.00 0.00 1
100 8.00 8.00 8.00 0.00 0.00 1 FSW Control Salinity ppt 33.10 33.10 33.10 0.00 0.00 1
Diluent Control 37.30 37.30 37.30 0.00 0.00 1 6.3 39.10 39.10 39.10 0.00 0.00 1
12.5 41.30 41.30 41.30 0.00 0.00 1 25 45.10 45.10 45.10 0.00 0.00 1 50 52.70 52.70 52.70 0.00 0.00 1
100 67.80 67.80 67.80 0.00 0.00 1 FSW Control DO % 106.40 106.40 106.40 0.00 0.00 1
Diluent Control 93.60 93.60 93.60 0.00 0.00 1 6.3 104.20 104.20 104.20 0.00 0.00 1
12.5 107.70 107.70 107.70 0.00 0.00 1 25 107.70 107.70 107.70 0.00 0.00 1 50 108.70 108.70 108.70 0.00 0.00 1
100 106.90 106.90 106.90 0.00 0.00 1
Page 3 ToxCalc v5.0.23 Reviewed by:_____

ecotox SERVICES AUSTRALASIA
Statistical Printouts for the Mussel Toxicity Tests

Bivalve Larval Development Test-Proportion Alive/Normal Start Date: 5/04/2013 13:00 Test ID: PR0997/01 Sample ID: Outfall End Date: 8/04/2013 13:00 Lab ID: 5931 Sample Type: AQ-Aqueous Sample Date: Protocol: ESA 106 Test Species: MG-Mytilus galloprovincialis Comments:
Conc-% 1 2 3 4 FSW Control 0.7300 0.9200 0.8800 0.8900
Diluent Control 0.8400 0.9500 0.8100 0.9400 6.3 0.8900 0.7200 0.8400 0.9000
12.5 0.0000 0.0000 0.0000 0.0000 25 0.0000 0.0000 0.0000 0.0000 50 0.0000 0.0000 0.0000 0.0000
100 0.0000 0.0000 0.0000 0.0000
Transform: Arcsin Square Root 1-Tailed Number Total Conc-% Mean N-Mean Mean Min Max CV% N t-Stat Critical MSD Resp Number
FSW Control 0.8550 0.9661 1.1896 1.0244 1.2840 9.563 4 Diluent Control 0.8850 1.0000 1.2369 1.1198 1.3453 9.213 4 * 46 400
6.3 0.8375 0.9463 1.1636 1.0132 1.2490 9.246 4 0.936 1.943 0.1523 65 400 12.5 0.0000 0.0000 0.0500 0.0500 0.0500 0.000 4 400 400
25 0.0000 0.0000 0.0500 0.0500 0.0500 0.000 4 400 400 50 0.0000 0.0000 0.0500 0.0500 0.0500 0.000 4 400 400
100 0.0000 0.0000 0.0500 0.0500 0.0500 0.000 4 400 400
Auxiliary Tests Statistic Critical Skew Kurt Shapiro-Wilk's Test indicates normal distribution (p > 0.05) 0.872471 0.818 -0.45893 -1.78744 F-Test indicates equal variances (p = 0.93) 1.12217 47.46723 The control means are not significantly different (p = 0.58) 0.588233 2.446912 Hypothesis Test (1-tail, 0.05) MSDu MSDp MSB MSE F-Prob df Homoscedastic t Test indicates no significant differences 0.110901 0.124244 0.010761 0.01228 0.38535 1, 6 Treatments vs Diluent Control
Trimmed Spearman-Karber Trim Level EC50 95% CL
0.0% 5.0%
10.0% 20.0%
Auto-5.4%
8.7034 8.7034 8.7034
8.6286 8.6286 8.6286
8.7787 8.7787 8.7787
1.0
0.9
0.8
0.7
se
0.6
Res
pon
0.5
0.4
0.3
0.2
0.1
0.0 1 10 100
Dose %
Page 1 ToxCalc v5.0.23 Reviewed by:_____

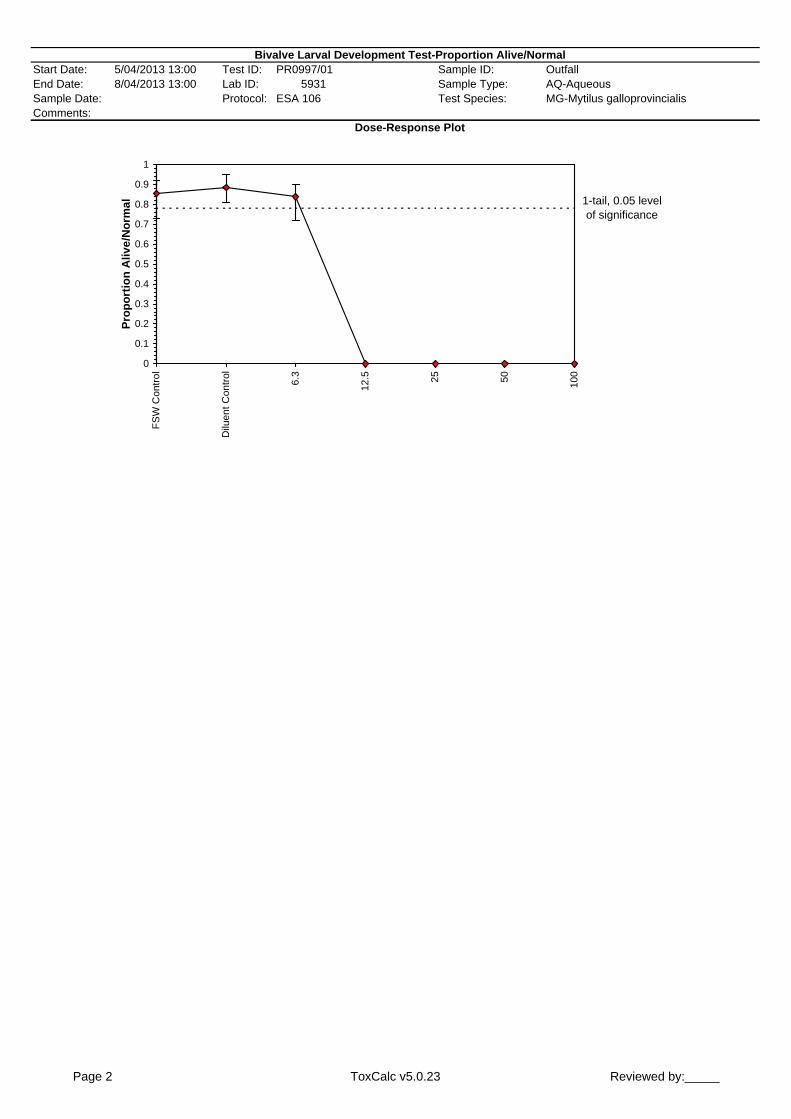
Bivalve Larval Development Test-Proportion Alive/Normal Start Date: 5/04/2013 13:00 Test ID: PR0997/01 Sample ID: Outfall End Date: 8/04/2013 13:00 Lab ID: 5931 Sample Type: AQ-Aqueous Sample Date: Protocol: ESA 106 Test Species: MG-Mytilus galloprovincialis Comments:
Dose-Response Plot
1-tail, 0.05 level of significance
0
0.1
0.2
0.3
0.4
0.5
0.6
0.7
0.8
0.9
1
Prop
ortio
n A
live/
Nor
mal
FSW
Con
trol
Dilu
ent C
ontro
l
6.3
12.5
25 50 100
Page 2 ToxCalc v5.0.23 Reviewed by:_____

Bivalve Larval Development Test-Proportion Alive/Normal Start Date: 5/04/2013 13:00 Test ID: PR0997/01 Sample ID: Outfall End Date: 8/04/2013 13:00 Lab ID: 5931 Sample Type: AQ-Aqueous Sample Date: Protocol: ESA 106 Test Species: MG-Mytilus galloprovincialis Comments:
Auxiliary Data Summary Conc-% Parameter Mean Min Max SD CV% N
FSW Control % Normal 85.50 73.00 92.00 8.50 3.41 4 Diluent Control 88.50 81.00 95.00 7.05 3.00 4
6.3 83.75 72.00 90.00 8.26 3.43 4 12.5 0.00 0.00 0.00 0.00 4
25 0.00 0.00 0.00 0.00 4 50 0.00 0.00 0.00 0.00 4
100 0.00 0.00 0.00 0.00 4 FSW Control pH 8.20 8.20 8.20 0.00 0.00 1
Diluent Control 8.20 8.20 8.20 0.00 0.00 1 6.3 8.20 8.20 8.20 0.00 0.00 1
12.5 8.20 8.20 8.20 0.00 0.00 1 25 8.10 8.10 8.10 0.00 0.00 1 50 8.10 8.10 8.10 0.00 0.00 1
100 8.00 8.00 8.00 0.00 0.00 1 FSW Control Salinity ppt 33.00 33.00 33.00 0.00 0.00 1
Diluent Control 37.20 37.20 37.20 0.00 0.00 1 6.3 39.40 39.40 39.40 0.00 0.00 1
12.5 41.60 41.60 41.60 0.00 0.00 1 25 45.30 45.30 45.30 0.00 0.00 1 50 52.70 52.70 52.70 0.00 0.00 1
100 67.50 67.50 67.50 0.00 0.00 1 FSW Control DO % 102.50 102.50 102.50 0.00 0.00 1
Diluent Control 96.60 96.60 96.60 0.00 0.00 1 6.3 98.30 98.30 98.30 0.00 0.00 1
12.5 105.20 105.20 105.20 0.00 0.00 1 25 105.80 105.80 105.80 0.00 0.00 1 50 105.00 105.00 105.00 0.00 0.00 1
100 101.90 101.90 101.90 0.00 0.00 1
Page 3 ToxCalc v5.0.23 Reviewed by:_____

Bivalve Larval Development Test-Proportion Alive/Normal Start Date: 5/04/2013 13:00 Test ID: PR0997/01 Sample ID: Outfall End Date: 8/04/2013 13:00 Lab ID: 5931 Sample Type: AQ-Aqueous Sample Date: Protocol: ESA 106 Test Species: MG-Mytilus galloprovincialis Comments:
Conc-% 1 2 3 4 FSW Control 0.7300 0.9200 0.8800 0.8900
Diluent Control 0.8400 0.9500 0.8100 0.9400 6.3 0.8900 0.7200 0.8400 0.9000
12.5 0.0000 0.0000 0.0000 0.0000 25 0.0000 0.0000 0.0000 0.0000 50 0.0000 0.0000 0.0000 0.0000
100 0.0000 0.0000 0.0000 0.0000
Transform: Arcsin Square Root 1-Tailed Isotonic Conc-% Mean N-Mean Mean Min Max CV% N t-Stat Critical MSD Mean N-Mean
FSW Control 0.8550 0.9661 1.1896 1.0244 1.2840 9.563 4 Diluent Control 0.8850 1.0000 1.2369 1.1198 1.3453 9.213 4 * 0.8850 1.0000
6.3 0.8375 0.9463 1.1636 1.0132 1.2490 9.246 4 0.936 1.943 0.1523 0.8375 0.9463 12.5 0.0000 0.0000 0.0500 0.0500 0.0500 0.000 4 0.0000 0.0000
25 0.0000 0.0000 0.0500 0.0500 0.0500 0.000 4 0.0000 0.0000 50 0.0000 0.0000 0.0500 0.0500 0.0500 0.000 4 0.0000 0.0000
100 0.0000 0.0000 0.0500 0.0500 0.0500 0.000 4 0.0000 0.0000
Auxiliary Tests Statistic Critical Skew Kurt Shapiro-Wilk's Test indicates normal distribution (p > 0.05) 0.872471 0.818 -0.45893 -1.78744 F-Test indicates equal variances (p = 0.93) 1.12217 47.46723 The control means are not significantly different (p = 0.58) 0.588233 2.446912 Hypothesis Test (1-tail, 0.05) MSDu MSDp MSB MSE F-Prob df Homoscedastic t Test indicates no significant differences 0.110901 0.124244 0.010761 0.01228 0.38535 1, 6 Treatments vs Diluent Control
Log-Logit Interpolation (200 Resamples) Point % SD 95% CL(Exp) Skew IC05* 5.4786 1.9599 0.0000 7.0284 -0.3530 IC10 6.4147 0.8524 1.6129 6.6591 -2.4132 IC15 6.5222 0.2767 6.1535 6.7613 -5.5231 1.0 IC20 IC25
6.6187 6.7080
0.1005 0.0973
6.2836 6.3785
6.8615 6.9479
-0.4233 -0.3674
0.9
IC40 6.9546 0.0915 6.6628 7.1901 -0.2501 0.8 IC50 7.1164 0.0889 6.8429 7.3489 -0.2003 0.7 * indicates IC estimate less than the lowest concentration
0.6
0.5
0.4
0.3
0.2
0.1
0.0
Res
pons
e
1 10 100
Dose %
Page 1 ToxCalc v5.0.23 Reviewed by:_____
Bivalve Larval Development Test-Proportion Alive/Normal Start Date: 5/04/2013 13:00 Test ID: PR0997/01 Sample ID: Outfall End Date: 8/04/2013 13:00 Lab ID: 5931 Sample Type: AQ-Aqueous Sample Date: Protocol: ESA 106 Test Species: MG-Mytilus galloprovincialis Comments:
Dose-Response Plot
1-tail, 0.05 level of significance
0
0.1
0.2
0.3
0.4
0.5
0.6
0.7
0.8
0.9
1
Prop
ortio
n A
live/
Nor
mal
FSW
Con
trol
Dilu
ent C
ontro
l
6.3
12.5
25 50 100
Page 2 ToxCalc v5.0.23 Reviewed by:_____

Bivalve Larval Development Test-Proportion Alive/Normal Start Date: 5/04/2013 13:00 Test ID: PR0997/01 Sample ID: Outfall End Date: 8/04/2013 13:00 Lab ID: 5931 Sample Type: AQ-Aqueous Sample Date: Protocol: ESA 106 Test Species: MG-Mytilus galloprovincialis Comments:
Auxiliary Data Summary Conc-% Parameter Mean Min Max SD CV% N
FSW Control % Normal 85.50 73.00 92.00 8.50 3.41 4 Diluent Control 88.50 81.00 95.00 7.05 3.00 4
6.3 83.75 72.00 90.00 8.26 3.43 4 12.5 0.00 0.00 0.00 0.00 4
25 0.00 0.00 0.00 0.00 4 50 0.00 0.00 0.00 0.00 4
100 0.00 0.00 0.00 0.00 4 FSW Control pH 8.20 8.20 8.20 0.00 0.00 1
Diluent Control 8.20 8.20 8.20 0.00 0.00 1 6.3 8.20 8.20 8.20 0.00 0.00 1
12.5 8.20 8.20 8.20 0.00 0.00 1 25 8.10 8.10 8.10 0.00 0.00 1 50 8.10 8.10 8.10 0.00 0.00 1
100 8.00 8.00 8.00 0.00 0.00 1 FSW Control Salinity ppt 33.00 33.00 33.00 0.00 0.00 1
Diluent Control 37.20 37.20 37.20 0.00 0.00 1 6.3 39.40 39.40 39.40 0.00 0.00 1
12.5 41.60 41.60 41.60 0.00 0.00 1 25 45.30 45.30 45.30 0.00 0.00 1 50 52.70 52.70 52.70 0.00 0.00 1
100 67.50 67.50 67.50 0.00 0.00 1 FSW Control DO % 102.50 102.50 102.50 0.00 0.00 1
Diluent Control 96.60 96.60 96.60 0.00 0.00 1 6.3 98.30 98.30 98.30 0.00 0.00 1
12.5 105.20 105.20 105.20 0.00 0.00 1 25 105.80 105.80 105.80 0.00 0.00 1 50 105.00 105.00 105.00 0.00 0.00 1
100 101.90 101.90 101.90 0.00 0.00 1
Page 3 ToxCalc v5.0.23 Reviewed by:_____