adecoagro s.a.ir.adecoagro.com/uploads/1537283468_20170703113913.pdf · legal address: vertigo naos...
TRANSCRIPT
Adecoagro S.A.
Condensed Consolidated Interim Financial Statements as of
September 30, 2015 and for the nine-month periods ended
September 30, 2015 and 2014

2rfr
F - 2
Legal information
Denomination: Adecoagro S.A.
Legal address: Vertigo Naos Building, 6, Rue Eugène Ruppert, L-2453, Luxembourg
Company activity: Agricultural and agro-industrial
Date of registration: September 11, 2010
Expiration of company charter: No term defined
Number of register (RCS Luxembourg): B153.681
Capital stock: 122,381,815 common shares (of which 1,317,259 are treasury shares)
Majority shareholder: Quantum Partners LP
Legal address: 1300 Thames St. 5th FL, Baltimore MD 21231-3495, United States of America
Parent company activity: Investing
Capital stock: 25,910,004 common shares

The accompanying notes are an integral part of these condensed consolidated interim financial statements.
F - 3
Adecoagro S.A.
Condensed Consolidated Interim Statements of Financial Position
as of September 30, 2015 and December 31, 2014
(All amounts in US$ thousands, except shares and per share data and as otherwise indicated)
September 30, December 31,
Note 2015 2014
(unaudited)
ASSETS
Non-Current Assets
Property, plant and equipment ............................................................................. 6 578,210 776,905 Investment property ............................................................................................. 7 6,638 6,675
Intangible assets .................................................................................................. 8 19,499 23,778
Biological assets .................................................................................................. 9 231,732 286,044 Investments in joint ventures ............................................................................... 105 2,752
Deferred income tax assets ......................................................................... 19 66,387 45,597
Trade and other receivables ................................................................................. 11 33,927 50,590 Other assets ......................................................................................................... . 1,233 587
Total Non-Current Assets ................................................................................. 937,731 1,192,928
Current Assets
Biological assets .................................................................................................. 9 24,077 55,188 Inventories ........................................................................................................... 12 141,095 104,919
Trade and other receivables ................................................................................. 11 150,663 164,526
Derivative financial instruments .......................................................................... 10 5,640 7,966 Cash and cash equivalents ................................................................................... 13 224,349 113,795
Total Current Assets ......................................................................................... 545,824 446,394
TOTAL ASSETS ............................................................................................... 1,483,555 1,639,322
SHAREHOLDERS EQUITY
Capital and reserves attributable to equity holders of the
parent
Share capital .................................................................................................... 15 183,573 183,573
Share premium ................................................................................................... 15 937,395 933,044 Cumulative translation adjustment ..................................................................... (546,838) (395,804)
Equity-settled compensation................................................................................ 15,488 16,735
Cash flow hedge .................................................................................................. (141,923) (43,064)
Reserve from the sale of non-controlling interests in
subsidiaries .................................................................................................... 25,508 25,508
Treasury shares .................................................................................................... (1,977) (2,840) Retained earnings ................................................................................................ 62,467 45,644
Equity attributable to equity holders of the parent ........................................ 533,693 762,796
Non-controlling interest ...................................................................................... 7,615 7,589
TOTAL SHAREHOLDERS EQUITY ............................................................ 541,308 770,385
LIABILITIES
Non-Current Liabilities
Trade and other payables ..................................................................................... 17 1,792 2,391
Borrowings .......................................................................................................... 18 562,585 491,324 Deferred income tax liabilities ............................................................................ 19 27,612 39,635
Payroll and social security liabilities ................................................................... 20 1,457 1,278
Derivatives financial instruments ........................................................................ 10 - 39 Provisions for other liabilities ............................................................................. 21 2,002 2,013
Total Non-Current Liabilities ........................................................................... 595,448 536,680
Current Liabilities
Trade and other payables ..................................................................................... 17 52,818 83,100
Current income tax liabilities .............................................................................. 1,136 76
Payroll and social security liabilities ................................................................... 20 25,957 27,315
Borrowings .......................................................................................................... 18 246,297 207,182 Derivative financial instruments .......................................................................... 10 19,777 13,860
Provisions for other liabilities .............................................................................. 21 814 724
Total Current Liabilities ................................................................................... 346,799 332,257
TOTAL LIABILITIES ..................................................................................... 942,247 868,937
TOTAL SHAREHOLDERS EQUITY AND
LIABILITIES 1,483,555 1,639,322

The accompanying notes are an integral part of these condensed consolidated interim financial statements.
F - 4
Adecoagro S.A.
Condensed Consolidated Interim Statements of Income
for the nine-month periods ended September 30, 2015 and 2014 (All amounts in US$ thousands, except shares and per share data and as otherwise indicated)
Nine-months ended September 30 Three-months ended September 30
Note 2015 2014 2015 2014
(unaudited)
Sales of manufactured products and services rendered ........................................................................................................................... 22 316,468 330,700 118,014 140,963 Cost of manufactured products sold and services
rendered ................................................................................................................................................................................................. 23 (211,086)
(221,902)
(78,738)
(95,807)
Gross Profit from Manufacturing Activities ...................................................................................................................................... 105,382 108,798 39,276 45,156
Sales of agricultural produce and biological assets................................................................................................................................. 22 139,178 175,225 52,488 61,803
Cost of agricultural produce sold and direct agricultural
selling expenses ...................................................................................................................................................................................... 23 (139,178)
(175,225) (52,488)
(61,803) Initial recognition and changes in fair value of
biological assets and agricultural produce .............................................................................................................................................. 9 19,679
40,369 (14,269)
509
Changes in net realizable value of agricultural produce after harvest ............................................................................................................................................................................................ 9,914
1,210 6,016
2,914
Gross Profit/(Loss) from Agricultural Activities ............................................................................................................................... 29,593 41,579 (8,253) 3,423
Margin on Manufacturing and Agricultural
Activities Before Operating Expenses ................................................................................................................................................. 134,975
150,377 31,023
48,579
General and administrative expenses ...................................................................................................................................................... 23 (36,345) (39,239) (12,860) (15,605) Selling expenses ..................................................................................................................................................................................... 23 (48,225) (51,771) (17,193) (20,378) Other operating income / (expense), net ................................................................................................................................................. 25 31,267 15,051 15,660 17,435 Share of loss of joint ventures ................................................................................................................................................................ (2,527) (462) (1,057) (231)
Profit from Operations Before Financing and
Taxation ................................................................................................................................................................................................ 79,145
73,956
15,573
29,800
Finance income ...................................................................................................................................................................................... 26 7,234 6,643 1,564 2,342 Finance costs .......................................................................................................................................................................................... 26 (64,316) (59,644) (19,712) (20,464)
Financial results, net ............................................................................................................................................................................... 26 (57,082) (53,001) (18,148) (18,122)
Profit / (Loss) Before Income Tax ....................................................................................................................................................... 22,063 20,955 (2,575) 11,678
Income tax (expense)/ benefit ................................................................................................................................................................ 19 (4,521) (5,661) 5,021 (432)
Profit for the Period ............................................................................................................................................................................. 17,542 15,294 2,446 11,246
Attributable to:
Equity holders of the parent ................................................................................................................................................................... 16,687 15,424 2,415 11,355
Non-controlling interest ......................................................................................................................................................................... 855 (130) 31 (109)
Income per share Attributable to the equity holders
of the parent during the period:
Basic 0.138 0.128 0.020 0.094
Diluted 0.136 0.127 0.020 0.093

The accompanying notes are an integral part of these condensed consolidated interim financial statements.
F - 5
Adecoagro S.A.
Condensed Consolidated Interim Statements of Comprehensive Income
for the nine-month periods ended September 30, 2015 and 2014 (All amounts in US$ thousands, except shares and per share data and as otherwise indicated)
Nine-months ended September 30 Three-months ended September 30
2015 2014 2015 2014
(unaudited)
Profit for the Period ......................................................................................................................................................... 17,542 15,294 2,446 11,246
Other comprehensive income:
Exchange differences on translating foreign
operations ........................................................................................................................................................................
(151,861)
(64,064)
(79,867) (61,272)
Cash flow hedge ............................................................................................................................................................... (98,861) (18,522) (69,401) (21,915)
Other comprehensive loss for the period ..................................................................................................................... (250,722) (82,586) (149,268) (83,187)
Total comprehensive loss for the period ....................................................................................................................... (233,180) (67,292) (146,822) (71,941)
Attributable to:
Equity holders of the parent ............................................................................................................................................. (233,206) (66,883) (146,572) (71,614)
Non-controlling interest ................................................................................................................................................... 26 (409) (250) (327)

The accompanying notes are an integral part of these condensed consolidated interim financial statements.
F - 6
Adecoagro S.A.
Condensed Consolidated Interim Statements of Changes in Shareholders’ Equity
for the nine-month periods ended September 30, 2015 and 2014 (All amounts in US$ thousands, except shares and per share data and as otherwise indicated)
(*) Net of 1,557 of Income Tax
Attributable to equity holders of the parent
Share Capital (Note 15)
Share
Premium
Cumulative
Translation
Adjustment
Equity-settled
Compensation
Cash flow
hedge
(*)
Other
reserves
Treasury
shares
Reserve from
the sale of non-
controlling
interests in
subsidiaries
Retained
Earnings Subtotal
Non-
Controlling
Interest
Total
Shareholde
rs’ Equity
Balance at January 1, 2014 ............................................................... 183,573 939,072 (311,807) 17,352 (15,782) (161) (961) - 43,018 854,304 45 854,349
Profit for the period ............................................................................. - - - - - - - - 15,424 15,424 (130) 15,294
Other comprehensive income:
- Items that may be reclassified
subsequently to profit or loss:
Exchange differences on
translating foreign operations .......................................................... - - (63,791) - - - - - - (63,791) (273) (64,064)
Cash flow hedge (*) ......................................................................... - - - - (18,516) - - - - (18,516) (6) (18,522)
Other comprehensive income for
the period............................................................................................. - - (63,791) - (18,516) - - - - (82,307) (279) (82,586)
Total comprehensive income for
the period............................................................................................. - - (63,791) - (18,516) - - - 15,424 (66,883) (409) (67,292)
Employee share options (Note 15):
- Value of employee services ............................................................ - - - 308 - - - - - 308 - 308
- Exercised ........................................................................................ - 844 - (290) - - 184 - - 738 - 738
- Forfeited ......................................................................................... - - - (108) - - - - 108 - - -
Restricted shares (Note 15):
- Value of employee services ............................................................. - - - 2,620 - - - - - 2,620 - 2,620
- Vested ............................................................................................ - 3,444 - (4,053) - 160 446 - - (3) - (3)
- Forfeited .......................................................................................... - - - - - 1 (1) - - - -
Purchase of own shares (Note 15) ..................................................... - (10,424) - - - - (2,534) - - (12,958) - (12,958)
Sale of non-controlling interests in
subsidiaries (Note 14) ........................................................................ - - 15,825 - - - - 25,508 - 41,333 8,010 49,343
Balance at September 30, 2014
(unaudited) ....................................................................................... 183,573 932,936 (359,773) 15,829 (34,298) - (2,866) 25,508 58,550 819,459 7,646 827,105

The accompanying notes are an integral part of these condensed consolidated interim financial statements.
F - 7
Adecoagro S.A.
Condensed Consolidated Interim Statements of Changes in Shareholders’ Equity
for the nine-month periods ended September 30, 2015 and 2014 (continued) (All amounts in US$ thousands, except shares and per share data and as otherwise indicated)
(*) Net of 50,960 of Income Tax.
Attributable to equity holders of the parent
Share Capital (Note 15)
Share
Premium
Cumulative
Translation
Adjustment
Equity-settled
Compensation
Cash flow
hedge
(*)
Treasury
shares
Reserve from the sale of non-
controlling interests in subsidiaries
Retained Earnings
Subtotal
Non-
Controlling
Interest
Total
Shareholders’
Equity
Balance at January 1, 2015 ............................................................... 183,573 933,044 (395,804) 16,735 (43,064) (2,840) 25,508 45,644 762,796 7,589 770,385
Profit for the period ............................................................................. - - - - - - - 16,687 16,687 855 17,542
Other comprehensive income:
- Items that may be reclassified
subsequently to profit or loss:
Exchange differences on
translating foreign operations .......................................................... - - (151,034) - - - - - (151,034) (827) (151,861)
Cash flow hedge (*) ........................................................................ - - - - (98,859) - - - (98,859) (2) (98,861)
Other comprehensive income for
the period ............................................................................................ - - (151,034) - (98,859) - - - (249,893) (829) (250,722)
Total comprehensive income for
the period ............................................................................................ - - (151,034) - (98,859) - - 16,687 (233,206) 26 (233,180)
Employee share options (Note 15):
- Value of employee services............................................................ - - - - - - - - - - -
- Exercised ....................................................................................... - 1,504 - (520) - 275 - - 1,259 - 1,259
- Forfeited ........................................................................................ - - - (136) - - - 136 - - -
Restricted shares (Note 15):
- Value of employee services............................................................. - - - 3,160 - - - - 3,160 - 3,160
- Vested ............................................................................................ - 3,103 - (3,751) - 648 - - - - -
- Forfeited ......................................................................................... - - - - - - - - - - -
Purchase of own shares (Note 15) .................................................... - (256) - - - (60) - - (316) - (316)
Balance at September 30, 2015
(unaudited) ...................................................................................... 183,573 937,395 (546,838) 15,488 (141,923) (1,977) 25,508 62,467 533,693 7,615 541,308

The accompanying notes are an integral part of these condensed consolidated interim financial statements.
F - 8
Adecoagro S.A.
Condensed Consolidated Interim Statements of Cash Flows for the nine-month periods ended September 30, 2015 and 2014
(All amounts in US$ thousands, except shares and per share data and as otherwise indicated)
Note
September 30,
2015 September 30,
2014
(unaudited)
Cash flows from operating activities:
Profit for the period 17,542 15,294
Adjustments for:
Income tax expense .................................................... 19 4,521 5,661
Depreciation ............................................................... 23 50,985 66,680
Amortization ............................................................... 23 437 333
Gain from of disposal of other property items ............ 25
28 (909) (788)
Equity settled share-based compensation granted ...... 24 3,160 2,928
Gain from derivative financial instruments and
forwards ...................................................................... 25, 26 (25,952) (13,868)
Interest and other expense, net .................................... 26 32,534 37,863
Initial recognition and changes in fair value of non-
harvested biological assets (unrealized) ...................... (5,211) 1,830
Changes in net realizable value of agricultural
produce after harvest (unrealized) ............................... (2,351) 5,258
Provision and allowances ........................................... (17) 65
Share of loss from joint venture .................................. 2,527 462
Foreign exchange gains, net ........................................ 26 3,110 6,889
Cash flow hedge – transfer from equity ...................... 26 14,838 5,062
Subtotal ...................................................................... 95,214 133,669
Changes in operating assets and liabilities:
Increase in trade and other receivables ....................... (13,707) (37,948)
Increase in inventories ................................................ (61,730) (62,709)
Decrease in biological assets ...................................... 21,834 27,739
Decrease in other assets .............................................. (810) 81
Decrease in derivative financial instruments .............. 27,579 6,539
Decrease in trade and other payables .......................... (19,428) (15,743)
Increase in payroll and social security liabilities......... 6,797 9,548
Increase in provisions for other liabilities ................... 389 555
Net cash generated in operating activities before
interest and taxes paid ................................................ 56,138 61,731
Income tax paid .......................................................... (206) (363)
Net cash generated from operating activities ......... 55,932 61,368

The accompanying notes are an integral part of these condensed consolidated interim financial statements.
F - 9
Adecoagro S.A.
Condensed Consolidated Interim Statements of Cash Flows for the nine-month periods ended September 30, 2015 and 2014 (continued)
(All amounts in US$ thousands, except shares and per share data and as otherwise indicated)
Note
September 30,
2015 September 30,
2014
(unaudited)
Cash flows from investing activities:
Purchases of property, plant and equipment ............. (77,440) (155,829)
Purchases of intangible assets ................................... 8 (1,014) (772)
Purchase of cattle and non-current biological assets
planting cost ........................................................... (37,931) (82,220)
Interest received ....................................................... 26 6,820 5,735
Payment of seller financing arising on subsidiaries
acquired ................................................................... - (684)
Investments in joint ventures .................................... - (1,360)
Proceeds from sale of property, plant and equipment 703 993
Proceeds from disposal of subsidiaries ..................... - 1,318
Loans to joint venture ............................................... (7,915) -
Net cash used in investing activities ....................... (116,777) (232,819)
Cash flows from financing activities:
Proceeds from equity settled share-based
compensation exercised ............................................. 1,259 735
Proceeds from long-term borrowings ......................... 285,751 173,666
Payments of long-term borrowings ............................ (78,104) (81,341)
Net proceeds from the sale of minority interest in
subsidiaries ................................................................
................................................................................... - 49,897
Proceeds from short-term borrowings ........................ 156,059 106,309
Payment of short-term borrowings ............................. (139,635) (58,139)
Interest paid .............................................................. (30,728) (32,798)
Purchase of own shares .............................................. (295) (12,992)
Net cash generated from financing activities ......... 194,307 145,337
Net increase / (decrease) in cash and cash
equivalents ................................................................ 133,462 (26,114)
Cash and cash equivalents at beginning of period ...... 113,795 232,147
Effect of exchange rate changes on cash and cash
equivalents ................................................................. (22,908) (9,241)
Cash and cash equivalents at end of period .......... 224,349 196,792

Adecoagro S.A.
Notes to the Condensed Consolidated Interim Financial Statements (continued)
(All amounts in US$ thousands, except shares and per share data and as otherwise indicated)
The accompanying notes are an integral part of these condensed consolidated interim financial statements.
F - 10
1. General information
Adecoagro S.A. (the "Company" or "Adecoagro") is the Group’s ultimate parent company and is a société
anonyme (stock corporation) organized under the laws of the Grand Duchy of Luxembourg. Adecoagro is a holding company primarily engaged through its operating subsidiaries in agricultural and agro-industrial activities. The Company and its operating subsidiaries are collectively referred to hereinafter as the "Group". These activities are carried out through three major lines of business, namely, Farming; Sugar, Ethanol and Energy and Land Transformation. Farming is further comprised of three reportable segments, which are described in detail in Note 5 to these condensed consolidated interim financial statements.
Adecoagro is a public company listed in the New York Stock Exchange as a foreign registered company
under the symbol of AGRO. These condensed consolidated interim financial statements have been approved for issue by the Board of
Directors on November 10, 2015.
On March 27, 2015, Adecoagro commenced a series of transactions for the purpose of transferring the
domicile of Adecoagro LP to Luxembourg. In connection with the Adecoagro LP redomiciliation, Adecoagro
merged IFH LP into Adecoagro LP with Adecoagro LP as the surviving entity. In connection with this merger, all of
the assets and liabilities of IFH L.P. vested in Adecoagro LP, Ona Ltd became its general partner and Toba Ltd
became a wholly owned subsidiary of Adecoagro LP. In connection with the transactions completed on March 27,
2015, Ona Ltd, assigned its general partnership interest in Adecoagro LP to Adecoagro GP S.a.r.l., a societe
responsibilitie limitee organized under the laws of Luxembourg, on April 1, 2015. Also on April 1, 2015, Adecoagro
completed the redomiciliation of Adecoagro LP out of Delaware to Luxembourg and Adecoagro LP, without
dissolution or liquidation, continued its corporate existence as Adecoagro LP S.C.S., a societe en commandite
simple organized under Luxembourg law, effective April 2, 2015. Since that date the affairs of Adecoagro LP S.C.S.
have been governed by its by-laws and Luxembourg law. This operation had no accounting impact.
2. Basis of preparation and presentation
The information presented in the accompanying condensed consolidated interim financial statements
(“interim financial statements”) as of September 30, 2015 and for the nine-month periods ended September 30, 2015
and 2014 is unaudited and in the opinion of management reflect all adjustments necessary to present fairly the
financial position of the Group as of September 30, 2015, results of operations and cash flows for the nine-month
periods ended September 30, 2015 and 2014. All such adjustments are of a normal recurring nature. In preparing
these accompanying interim financial statements, management has made certain estimates and assumptions that affect
reported amounts in the financial statements and disclosures of contingencies. Actual results may differ from those
estimates. The results for interim periods are not necessarily indicative of annual results.
These interim financial statements have been prepared in accordance with IAS 34, ‘Interim financial
reporting’ and they should be read in conjunction with the annual financial statements for the year ended December
31, 2014, which have been prepared in accordance with IFRSs.
The accounting policies adopted in the preparation of the interim financial statements are consistent with
those followed in the preparation of the Group’s annual consolidated financial statements for the year ended
December 31, 2014.
A complete list of standards, amendments and interpretations to existing standards published but not yet
effective for the Group is described in Note 2.1 to the annual financial statements. None of those standards have a
material impact on the information to be presented in the financial statements.
During the nine months period ended September 30, 2015, the IASB did not publish new standards that
would have a material impact on the Group when they become effective.

Adecoagro S.A.
Notes to the Condensed Consolidated Interim Financial Statements (continued)
(All amounts in US$ thousands, except shares and per share data and as otherwise indicated)
The accompanying notes are an integral part of these condensed consolidated interim financial statements.
F - 11
2. Basis of preparation and presentation (continued)
Seasonality of operations
The Group’s business activities are inherently seasonal. The Group generally harvest and sell its grains
(corn, soybean, rice and sunflower) between February and September, with the exception of wheat, which is
harvested from December to January. Coffee and cotton are different in that while both are typically harvested from
September to August, they require a conditioning process which takes about two to three months. Sales in other
business segments, such as in Dairy business segments, tend to be more stable. However, the sale of milk is
generally higher during the fourth quarter, when the weather is warmer and pasture conditions are more favorable.
The sugarcane harvesting period typically begins April/May and ends in November/December. This creates
fluctuations in sugar and ethanol inventory, usually peaking in December to cover sales between crop harvests (i.e.,
January through April). As a result of the above factors, there may be significant variations in the results of
operations from one quarter to another, as planting activities may be more concentrated in one quarter whereas
harvesting activities may be more concentrated in another quarter. In addition, quarterly results may vary as a result
of the effects of fluctuations in commodities prices, production yields and costs on the determination of initial
recognition and changes in fair value of biological assets and agricultural produce.
3. Financial risk management
Risk management principles and processes
The Group continues to be exposed to several risks arising from financial instruments including price risk,
exchange rate risk, interest rate risk, liquidity risk and credit risk. A thorough explanation of the Group´s risks and
the Group´s approach to the identification, assessment and mitigation of risks is included in Note 3 to the annual
financial statements. There have been no changes to the Group´s exposure and risk management principles and
processes since December 31, 2014 and refers readers to the annual financial statements for information.
However, the Group considers that the following tables below provide useful information to understand the
Group´s interim results for the nine month period ended September 30, 2015. These disclosures do not appear in any
particular order of potential materiality or probability of occurrence.

Adecoagro S.A.
Notes to the Condensed Consolidated Interim Financial Statements (continued)
(All amounts in US$ thousands, except shares and per share data and as otherwise indicated)
The accompanying notes are an integral part of these condensed consolidated interim financial statements.
F - 12
3. Financial risk management (continued)
Exchange rate risk
The following tables show the Group’s net monetary position broken down by various currencies for each
functional currency in which the Group operates at September 30, 2015. All amounts are shown in US dollars.
September 30, 2015
(unaudited)
Functional currency
Net monetary position
(Liability)/ Asset
Argentine
Peso
Brazilian
Reais
Uruguayan
Peso US Dollar Total
Argentine Peso ....................... (2,921) - - - (2,921)
Brazilian Reais ....................... - (214,656) - - (214,656)
US Dollar ............................... (80,946) (396,396) 46,596 82,923 (347,823)
Uruguayan Peso ..................... - - (188) - (188)
Total ...................................... (83,867) (611,052) 46,408 82,923 (565,588)
The Group’s analysis shown on the tables below is carried out based on the exposure of each functional
currency subsidiary against the US dollar. The Group estimated that, other factors being constant, a 10%
appreciation of the US dollar against the respective functional currencies for the period ended September 30, 2015
would have increased the Group’s Profit Before Income Tax for the period. A 10% depreciation of the US dollar
against the functional currencies would have an equal and opposite effect on the income statement. A portion of this
effect would be recognized as other comprehensive income since a portion of the Company’s borrowings was used
as cash flow hedge of the foreign exchange rate risk of a portion of its highly probable future sales in US dollars (see
Hedge Accounting - Cash Flow Hedge below for details).
September 30, 2015
(unaudited)
Functional currency
Net monetary position Argentine
Peso
Brazilian
Reais
Uruguayan
Peso US Dollar Total
Argentine Peso ....................... - - - - -
Brazilian Reais ....................... - - - - -
US Dollar ............................... (8,095) (39,640) 4,660 - (43,075)
Uruguayan Peso ..................... - - - - -
(Decrease) or increase in
Profit Before Income Tax ... (8,095) (39,640) 4,660 - (43,075)
Hedge Accounting - Cash Flow Hedge
Effective July 1, 2013, the Group formally documented and designated cash flow hedging relationships to
hedge the foreign exchange rate risk of a portion of its highly probable future sales in US dollars using a portion of
its borrowings denominated in US dollars, currency forwards and foreign currency floating-to-fixed interest rate
swaps.
The Company expects that the cash flows will occur and affect profit or loss between 2015 and 2020.
For the period ended September 30, 2015, a total amount before income tax of US$ 164,657 was
recognized in other comprehensive income and an amount of US$ 14,838 loss was reclassified from equity to
profit or loss within “Financial results, net”.

Adecoagro S.A.
Notes to the Condensed Consolidated Interim Financial Statements (continued)
(All amounts in US$ thousands, except shares and per share data and as otherwise indicated)
The accompanying notes are an integral part of these condensed consolidated interim financial statements.
F - 13
3. Financial risk management (continued)
Interest rate risk
The following table shows a breakdown of the Group’s fixed-rate and floating-rate borrowings per
currency denomination and functional currency of the subsidiary issuing the loans (excluding finance leases) at
September 30, 2015 (all amounts are shown in US dollars):
September 30, 2015
(unaudited)
Functional currency
Rate per currency denomination Argentine
Peso
Brazilian
Reais
Uruguayan
Peso Total
Fixed rate:
Argentine Peso ..................................... 5,195 - - 5,195
Brazilian Reais ..................................... - 140,692 - 140,692
US Dollar ............................................. 76,776 29,906 - 106,682
Subtotal Fixed-rate borrowings ........ 81,971 170,598 - 252,569
Variable rate:
Brazilian Reais ..................................... - 72,659 - 72,659
US Dollar ............................................. 10,502 472,811 - 483,313
Subtotal Variable-rate borrowings .. 10,502 545,470 - 555,972
Total borrowings as per analysis ..... 92,473 716,068 - 808,541
Finance leases ..................................... 341 - - 341
Total borrowings at September 30,
2015 ..................................................... 92,814 716,068 - 808,882
At September 30, 2015, if interest rates on floating-rate borrowings had been 1 % higher (or lower) with all
other variables held constant, Loss Before Income Tax for the period would decrease as follows:
September 30, 2015
(unaudited)
Functional currency
Rate per currency denomination Argentine
Peso
Brazilian
Reais
Uruguayan
Peso Total
Variable rate:
Brazilian Reais ..................................... - (727) - (727)
US Dollar ............................................. (105) (4,728) (4,833)
(Decrease) or increase in Profit
Before Income Tax ............................ (105) (5,455) - (5,560)
Credit risk
As of September 30, 2015, 4 banks accounted for more than 84% of the total cash deposited (Rabobank,
HSBC, Banco do Brasil and ING).
Adecoagro S.A.
Notes to the Condensed Consolidated Interim Financial Statements (continued)
(All amounts in US$ thousands, except shares and per share data and as otherwise indicated)
The accompanying notes are an integral part of these condensed consolidated interim financial statements.
F - 14
3. Financial risk management (continued)
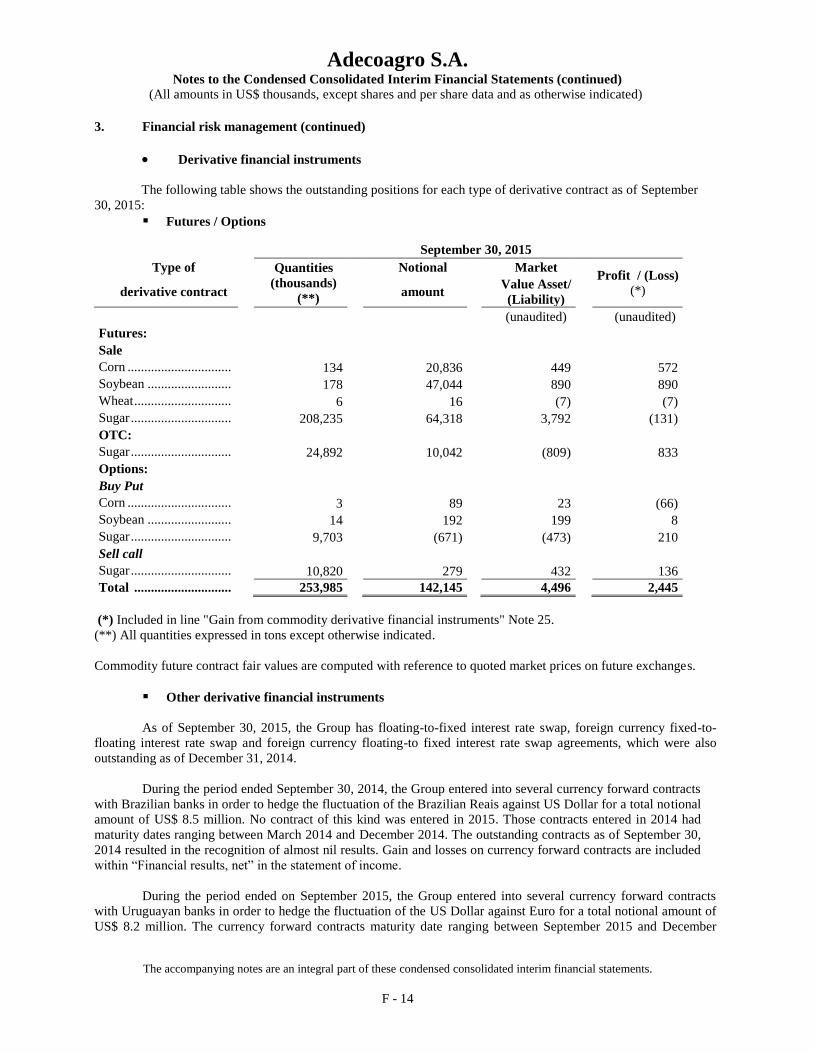
Derivative financial instruments
The following table shows the outstanding positions for each type of derivative contract as of September
30, 2015:
Futures / Options
September 30, 2015
Type of Quantities
(thousands)
(**)
Notional Market Profit / (Loss)
(*) derivative contract amount Value Asset/
(Liability)
(unaudited) (unaudited)
Futures:
Sale
Corn ............................... 134 20,836 449 572
Soybean ......................... 178 47,044 890 890
Wheat ............................. 6 16 (7) (7)
Sugar .............................. 208,235 64,318 3,792 (131)
OTC:
Sugar .............................. 24,892 10,042 (809) 833
Options:
Buy Put
Corn ............................... 3 89 23 (66)
Soybean ......................... 14 192 199 8
Sugar .............................. 9,703 (671) (473) 210
Sell call
Sugar .............................. 10,820 279 432 136
Total ............................. 253,985 142,145 4,496 2,445
(*) Included in line "Gain from commodity derivative financial instruments" Note 25.
(**) All quantities expressed in tons except otherwise indicated.
Commodity future contract fair values are computed with reference to quoted market prices on future exchanges.
Other derivative financial instruments
As of September 30, 2015, the Group has floating-to-fixed interest rate swap, foreign currency fixed-to-
floating interest rate swap and foreign currency floating-to fixed interest rate swap agreements, which were also
outstanding as of December 31, 2014.
During the period ended September 30, 2014, the Group entered into several currency forward contracts
with Brazilian banks in order to hedge the fluctuation of the Brazilian Reais against US Dollar for a total notional
amount of US$ 8.5 million. No contract of this kind was entered in 2015. Those contracts entered in 2014 had
maturity dates ranging between March 2014 and December 2014. The outstanding contracts as of September 30,
2014 resulted in the recognition of almost nil results. Gain and losses on currency forward contracts are included
within “Financial results, net” in the statement of income.
During the period ended on September 2015, the Group entered into several currency forward contracts
with Uruguayan banks in order to hedge the fluctuation of the US Dollar against Euro for a total notional amount of
US$ 8.2 million. The currency forward contracts maturity date ranging between September 2015 and December

Adecoagro S.A.
Notes to the Condensed Consolidated Interim Financial Statements (continued)
(All amounts in US$ thousands, except shares and per share data and as otherwise indicated)
The accompanying notes are an integral part of these condensed consolidated interim financial statements.
F - 15
2015. The outstanding contracts resulted in the recognition of a loss amounting to US$ 0.1 million in 2015. Gain and
losses on currency forward contracts are included within “Financial results, net” in the statement of income.
4. Critical accounting estimates and judgments
The Group's critical accounting policies are also consistent with those of the audited annual financial
statements for the year ended December 31, 2014 described in Note 4.
Impairment testing
At the date of each statement of financial position, the Group reviews the carrying amounts of its property,
plant and equipment and finite lived intangible assets to determine whether there is any indication that those assets
have suffered an impairment loss. If any such indication exists, the recoverable amount of the asset is estimated in
order to determine the extent, if any, of the impairment loss. Where the asset does not generate cash flows that are
independent from other assets, the Group estimates the recoverable amount of the cash-generating unit to which the
asset belongs. The Group’s property, plant and equipment items generally do not generate independent cash flows.
Goodwill on acquisition is initially measured at cost being the excess of the cost of the business
combination over the Group’s interest in the net fair value of the identifiable assets, liabilities and contingent
liabilities. As of the acquisition date, any goodwill acquired is allocated to the cash-generating unit (‘CGU’)
expected to benefit from the business combination.
Following initial recognition, goodwill is measured at cost less any accumulated impairment losses,
Goodwill is tested for impairment annually, or more frequently if events or changes in circumstances indicate that
the carrying amount may be impaired. The impairment review requires management to undertake certain judgments,
including estimating the recoverable value of the CGU to which the goodwill relates, based on either fair value less
costs-to-sell or the value-in-use, as appropriate, in order to reach a conclusion on whether it deems the goodwill is
impaired or not.
For purposes of the impairment testing, each CGU represents the smallest identifiable group of assets that
generate cash inflows that are largely independent of the cash inflows from other assets or group of assets.
Farmlands may be used for different activities that may generate independent cash flows. When farmlands
are used for single activities (i.e. crops), these are considered as one CGU. Generally, each separate farmland
business within Argentina and Uruguay are treated as single CGUs. Otherwise, when farmland businesses are used
for more than one segment activity (i.e. crops and cattle or rental income), the farmland is further subdivided into
two or more CGUs, as appropriate, for purposes of impairment testing. For its properties in Brazil, management
identified a farmland together with its related mill as separate CGUs.
Based on these criteria, management identified a total amount of forty CGUs as of September 30, 2015 and
thirty-eight CGUs as of September 30, 2014.
As of September 30, 2015 and 2014, due to the fact that there were no impairment indicators, the Group
only tested those CGUs with allocated goodwill in Argentina, Brazil and Uruguay.
CGUs tested based on a fair-value-less-costs-to-sell model at September 30, 2015 and 2014:
As of September 30, 2015, the Group identified 11 CGUs in Argentina and Uruguay (2014: 11 CGUs) to be
tested based on this model (all CGUs with allocated goodwill). Estimating the fair value less costs-to-sell is based
on the best information available, and refers to the amount at which the CGU could be bought or sold in a current
transaction between willing parties. In calculating the fair value less costs-to-sell, management may be assisted by
the work of external advisors. When using this model, the Group applies the “sales comparison approach” as its
method of valuing most properties. This method relies on results of sales of similar agricultural properties to
estimate the value of the CGU. This approach is based on the theory that the fair value of a property is directly
related to the selling prices of similar properties.
Adecoagro S.A.
Notes to the Condensed Consolidated Interim Financial Statements (continued)
(All amounts in US$ thousands, except shares and per share data and as otherwise indicated)
The accompanying notes are an integral part of these condensed consolidated interim financial statements.
F - 16
4. Critical accounting estimates and judgments (continued)
Fair values are determined by extensive analysis which includes current and potential soil productivity of
the land (the ability to produce crops and maintain livestock) projected margins derived from soil use, rental value
obtained for soil use, if applicable, and other factors such as climate and location. Farmland ratings are established
by considering such factors as soil texture and quality, yields, topography, drainage and rain levels. Farmland may
contain farm outbuildings. A farm outbuilding is any improvement or structure that is used for farming operations.
Outbuildings are valued based on their size, age and design.
Based on the factors described above, each farm property is assigned different soil classifications for the
purposes of establishing a value, Soil classifications quantify the factors that contribute to the agricultural capability
of the soil. Soil classifications range from the most productive to the least productive.
The first step to establishing an assessment for a farm property is a sales investigation that identifies the
valid farm sales in the area where the farm is located.
A price per hectare is assigned for each soil class within each farm property. This price per hectare is
determined based on the quantitative and qualitative analysis mainly described above.
The results are then tested against actual sales, if any, and current market conditions to ensure the values
produced are accurate, consistent and fair.
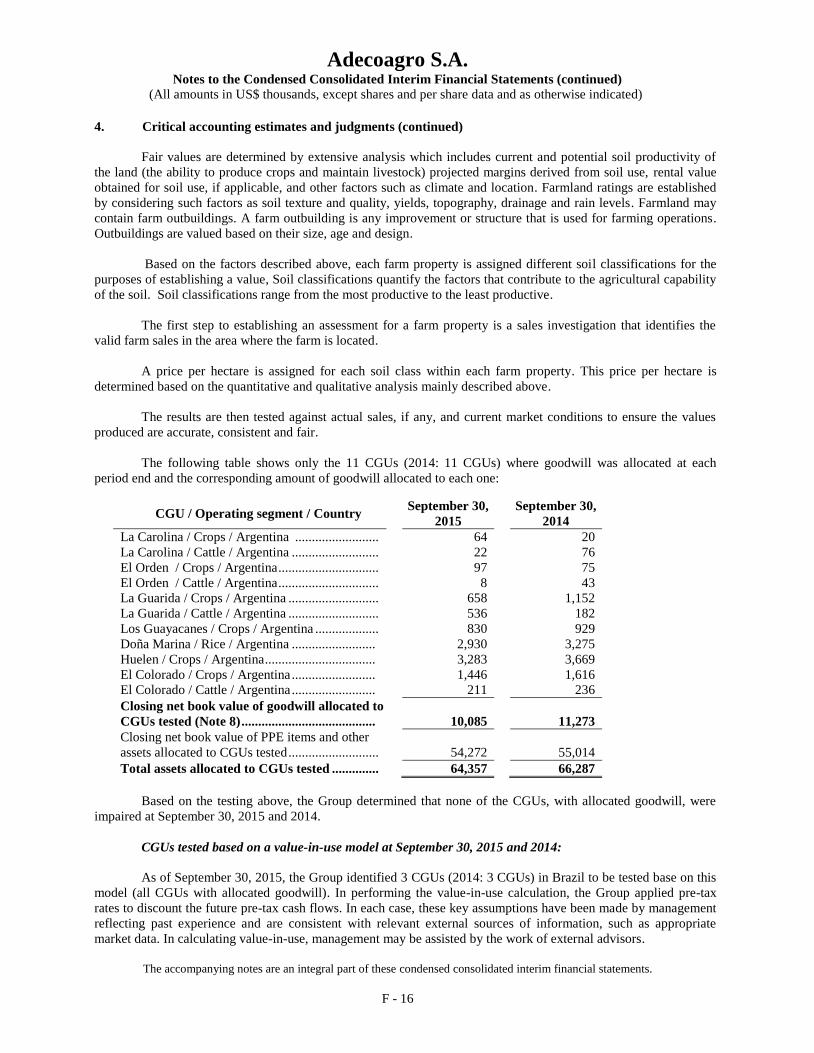
The following table shows only the 11 CGUs (2014: 11 CGUs) where goodwill was allocated at each
period end and the corresponding amount of goodwill allocated to each one:
CGU / Operating segment / Country September 30,
2015
September 30,
2014
La Carolina / Crops / Argentina ......................... 64 20
La Carolina / Cattle / Argentina .......................... 22 76
El Orden / Crops / Argentina .............................. 97 75
El Orden / Cattle / Argentina .............................. 8 43
La Guarida / Crops / Argentina ........................... 658 1,152
La Guarida / Cattle / Argentina ........................... 536 182
Los Guayacanes / Crops / Argentina ................... 830 929
Doña Marina / Rice / Argentina ......................... 2,930 3,275
Huelen / Crops / Argentina ................................. 3,283 3,669
El Colorado / Crops / Argentina ......................... 1,446 1,616
El Colorado / Cattle / Argentina ......................... 211 236
Closing net book value of goodwill allocated to
CGUs tested (Note 8) ........................................
10,085
11,273
Closing net book value of PPE items and other
assets allocated to CGUs tested ...........................
54,272
55,014
Total assets allocated to CGUs tested .............. 64,357 66,287
Based on the testing above, the Group determined that none of the CGUs, with allocated goodwill, were
impaired at September 30, 2015 and 2014.
CGUs tested based on a value-in-use model at September 30, 2015 and 2014:
As of September 30, 2015, the Group identified 3 CGUs (2014: 3 CGUs) in Brazil to be tested base on this
model (all CGUs with allocated goodwill). In performing the value-in-use calculation, the Group applied pre-tax
rates to discount the future pre-tax cash flows. In each case, these key assumptions have been made by management
reflecting past experience and are consistent with relevant external sources of information, such as appropriate
market data. In calculating value-in-use, management may be assisted by the work of external advisors.
Adecoagro S.A.
Notes to the Condensed Consolidated Interim Financial Statements (continued)
(All amounts in US$ thousands, except shares and per share data and as otherwise indicated)
The accompanying notes are an integral part of these condensed consolidated interim financial statements.
F - 17
4. Critical accounting estimates and judgments (continued)
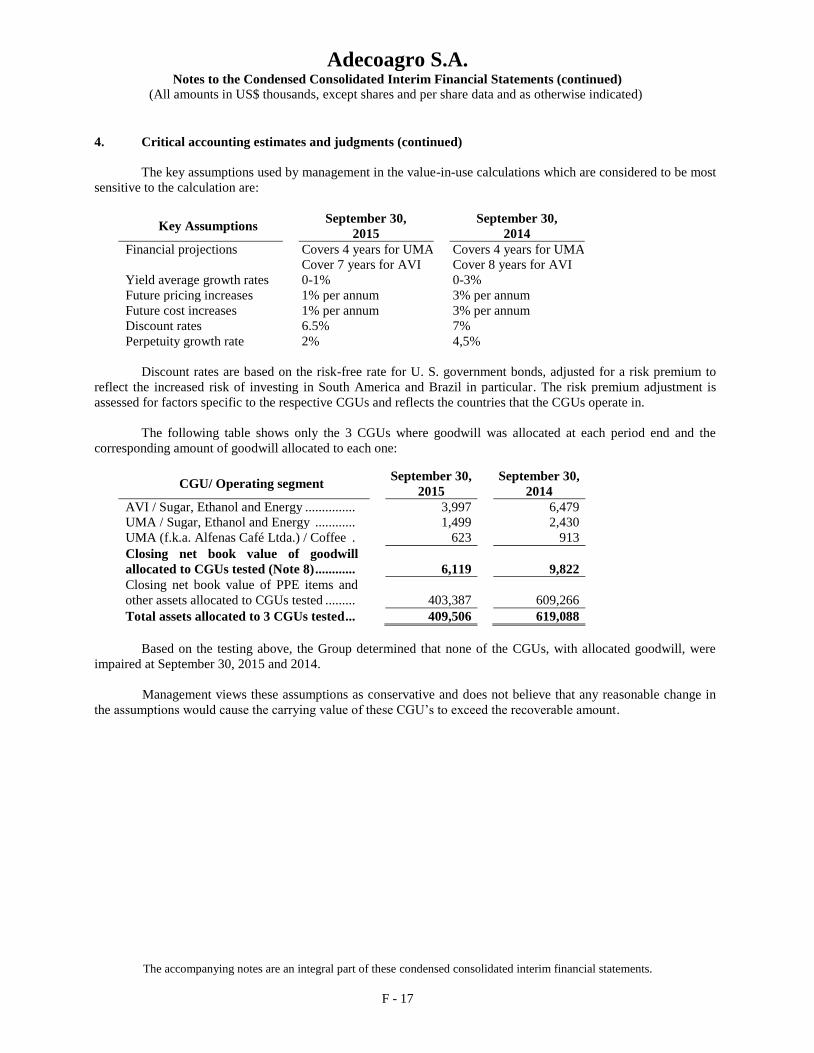
The key assumptions used by management in the value-in-use calculations which are considered to be most
sensitive to the calculation are:
Key Assumptions September 30,
2015
September 30,
2014
Financial projections Covers 4 years for UMA Covers 4 years for UMA
Cover 7 years for AVI Cover 8 years for AVI
Yield average growth rates 0-1% 0-3%
Future pricing increases 1% per annum 3% per annum
Future cost increases 1% per annum 3% per annum
Discount rates 6.5% 7%
Perpetuity growth rate 2% 4,5%
Discount rates are based on the risk-free rate for U. S. government bonds, adjusted for a risk premium to
reflect the increased risk of investing in South America and Brazil in particular. The risk premium adjustment is
assessed for factors specific to the respective CGUs and reflects the countries that the CGUs operate in.
The following table shows only the 3 CGUs where goodwill was allocated at each period end and the
corresponding amount of goodwill allocated to each one:
CGU/ Operating segment September 30,
2015
September 30,
2014
AVI / Sugar, Ethanol and Energy ............... 3,997 6,479
UMA / Sugar, Ethanol and Energy ............ 1,499 2,430
UMA (f.k.a. Alfenas Café Ltda.) / Coffee . 623 913
Closing net book value of goodwill
allocated to CGUs tested (Note 8) ............
6,119
9,822
Closing net book value of PPE items and
other assets allocated to CGUs tested .........
403,387
609,266
Total assets allocated to 3 CGUs tested ... 409,506 619,088
Based on the testing above, the Group determined that none of the CGUs, with allocated goodwill, were
impaired at September 30, 2015 and 2014.
Management views these assumptions as conservative and does not believe that any reasonable change in
the assumptions would cause the carrying value of these CGU’s to exceed the recoverable amount.

Adecoagro S.A.
Notes to the Condensed Consolidated Interim Financial Statements (continued)
(All amounts in US$ thousands, except shares and per share data and as otherwise indicated)
The accompanying notes are an integral part of these condensed consolidated interim financial statements.
F - 18
5. Segment information
IFRS 8 “Operating Segments” requires an entity to report financial and descriptive information about its
reportable segments, which are operating segments or aggregations of operating segments that meet specified
criteria. Operating segments are components of an entity about which separate financial information is available
that is evaluated regularly by the chief operating decision maker (“CODM”) in deciding how to allocate resources
and in assessing performance, The CODM evaluates the business based on the differences in the nature of its
operations, products and services. The amount reported for each segment item is the measure reported to the
CODM for these purposes.
The Group operates in three major lines of business, namely, Farming; Sugar, Ethanol and Energy; and
Land Transformation.
The Group’s ‘Farming’ line of business is further comprised of three reportable segments:
The Group’s ‘Crops’ Segment consists of planting, harvesting and sale of grains, oilseeds and fibers
(including wheat, corn, soybeans, cotton and sunflowers, among others), and to a lesser extent the
provision of grain warehousing/conditioning, handling and drying services to third parties, and the
purchase and sale of crops produced by third parties crops. Each underlying crop in the Crops segment
does not represent a separate operating segment. Management seeks to maximize the use of the land
through the cultivation of one or more type of crops. Types and surface amount of crops cultivated
may vary from harvest year to harvest year depending on several factors, some of them out of the
Group´s control. Management is focused on the long-term performance of the productive land, and to
that extent, the performance is assessed considering the aggregated combination, if any, of crops
planted in the land. A single manager is responsible for the management of operating activity of all
crops rather than for each individual crop.
The Group’s ‘Rice’ Segment consists of planting, harvesting, processing and marketing of rice;
The Group’s ‘Dairy’ Segment consists of the production and sale of raw milk and other dairy
products;
The Group’s ‘All Other Segments’ column consists of the aggregation of the remaining non-
reportable operating segments, which do not meet the quantitative thresholds for disclosure and for
which the Group's management does not consider them to be of continuing significance as from
January 1, 2014, namely, Coffee and Cattle.
The Group’s ‘Sugar, Ethanol and Energy’ Segment consists of cultivating sugarcane which is processed
in owned sugar mills, transformed into ethanol, sugar and electricity and marketed;
The Group’s ‘Land Transformation’ Segment comprises the (i) identification and acquisition of
underdeveloped and undermanaged farmland businesses; and (ii) realization of value through the strategic
disposition of assets (generating profits).
The measurement principles for the Group’s segment reporting structure are based on the IFRS principles
adopted in the interim financial statements.

Adecoagro S.A.
Notes to the Condensed Consolidated Interim Financial Statements (continued)
(All amounts in US$ thousands, except shares and per share data and as otherwise indicated)
The accompanying notes are an integral part of these condensed consolidated interim financial statements.
F - 19
5. Segment information (continued)
Total segment assets and liabilities are measured in a manner consistent with that of the condensed
consolidated interim financial statements. These assets and liabilities are allocated based on the operations of the
segment and the physical location of the asset. The Group’s investment in the joint venture CHS S.A. is allocated to
the ‘Crops’ segment.
The following table presents information with respect to the Group’s reportable segments. Certain other
activities of a holding function nature not allocable to the segments are disclosed in the column ‘Corporate’.

Adecoagro S.A.
Notes to the Condensed Consolidated Interim Financial Statements (continued)
(All amounts in US$ thousands, except shares and per share data and as otherwise indicated)
The accompanying notes are an integral part of these condensed consolidated interim financial statements.
F - 20
5. Segment information (continued)
Segment analysis for the nine-month period ended September 30, 2015 (unaudited)
Farming Sugar,
Ethanol and
Energy
Land
Transformation
Corporate
Total
Crops Rice Dairy
All Other
Segments Farming subtotal
Sales of manufactured products and services rendered...................................................... 787 65,684 1,041 988 68,500 247,968 - - 316,468
Cost of manufactured products sold and services rendered ............................................... (438) (53,839) (1,108) (536) (55,921) (155,165) - - (211,086)
Gross Profit / (loss) from Manufacturing Activities ..................................................... 349 11,845 (67) 452 12,579 92,803 - - 105,382
Sales of agricultural produce and biological assets ........................................................... 114,487 342 24,349 - 139,178 - - - 139,178
Cost of agricultural produce sold and direct agricultural selling expenses ......................... (114,487) (342) (24,349) - (139,178) - - - (139,178)
Initial recognition and changes in fair value of biological assets and agricultural produce 7,016 3,144 6,159 (24) 16,295 3,384 - - 19,679
Changes in net realizable value of agricultural produce after harvest ................................ 9,914 - - - 9,914 - - - 9,914
Gross Profit / (loss) from Agricultural Activities .......................................................... 16,930 3,144 6,159 (24) 26,209 3,384 - - 29,593
Margin on Manufacturing and Agricultural Activities Before Operating Expenses .. 17,279 14,989 6,092 428 38,788 96,187 - - 134,975
General and administrative expenses ................................................................................ (2,656) (2,366) (1,108) (55) (6,185) (14,499) - (15,661) (36,345)
Selling expenses ............................................................................................................... (4,283) (9,489) (514) (25) (14,311) (33,368) - (546) (48,225)
Other operating income / (loss), net .................................................................................. 14,065 692 (563) 6 14,200 16,816 - 251 31,267
Share of loss of joint ventures .......................................................................................... (2,527) - - - (2,527) - - - (2,527)
Profit / (loss) from Operations Before Financing and Taxation ................................... 21,878 3,826 3,907 354 29,965 65,136 - (15,956) 79,145
Depreciation and amortization .......................................................................................... (1,428) (2,285) (1,114) (216) (5,043) (46,379) - - (51,422)
Initial recognition and changes in fair value of biological assets (unrealized) ................... (2,045) (362) - 171 (2,236) 5,448 - - 3,212
Initial recognition and changes in fair value of agricultural produce (unrealized) .............. 1,750 1,261 - (173) 2,838 (839) - - 1,999
Initial recognition and changes in fair value of biological assets and agricultural produce
(realized) .......................................................................................................................... 7,311 2,245 6,159 (22) 15,693 (1,225) - - 14,468
Changes in net realizable value of agricultural produce after harvest (unrealized) ............. 2,351 - - - 2,351 - - - 2,351
Changes in net realizable value of agricultural produce after harvest (realized) ................ 7,563 - - - 7,563 - - - 7,563
Farmlands and farmland improvements, net .................................................................... 100,783 20,130 414 6,922 128,249 21,555 - - 149,804
Machinery, equipment and other fixed assets, net ............................................................. 4,733 18,350 12,636 772 36,491 365,332 - - 401,823
Work in progress .............................................................................................................. 2,197 8,386 704 - 11,287 15,296 - - 26,583
Investment property ........................................................................................................ - - - 6,638 6,638 - - - 6,638
Goodwill .......................................................................................................................... 6,378 2,930 - 1,400 10,708 5,496 - - 16,204
Biological assets............................................................................................................... 12,450 11,242 8,665 1,602 33,959 221,850 - - 255,809
Investment in joint ventures ............................................................................................. 105 - - - 105 - - - 105
Inventories ....................................................................................................................... 44,665 31,116 2,728 - 78,509 62,586 - - 141,095
Total segment assets ....................................................................................................... 171,311 92,154 25,147 17,334 305,946 692,115 - - 998,061
Borrowings .................................................................................................................. 53,170 33,595 7,466 1,297 95,528 713,354 - - 808,882
Total segment liabilities ............................................................................................. 53,170 33,595 7,466 1,297 95,528 713,354 - - 808,882

Adecoagro S.A.
Notes to the Condensed Consolidated Interim Financial Statements (continued)
(All amounts in US$ thousands, except shares and per share data and as otherwise indicated)
The accompanying notes are an integral part of these condensed consolidated interim financial statements.
F - 21
5. Segment information (continued)
Segment analysis for the nine-month period ended September 30, 2014 (unaudited)
Farming Sugar,
Ethanol and
Energy
Land
Transformation
Corporate
Total
Crops Rice Dairy
All Other
Segments
Farming
subtotal
Sales of manufactured products and services rendered...................................................... 141 73,183 2,493 1,137 76,954 253,746
- - 330,700
Cost of manufactured products sold and services rendered ............................................... - (57,421) (2,364) (615) (60,400) (161,502)
- - (221,902)
Gross Profit from Manufacturing Activities ................................................................. 141 15,762 129 522 16,554 92,244
- - 108,798
Sales of agricultural produce and biological assets ........................................................... 152,127 1,940 21,158 - 175,225 -
- - 175,225
Cost of agricultural produce sold and direct agricultural selling expenses ......................... (152,127) (1,940) (21,158) - (175,225) -
- - (175,225)
Initial recognition and changes in fair value of biological assets and agricultural produce 43,857 12,012 6,931 (3) 62,797 (22,428)
- - 40,369
Changes in net realizable value of agricultural produce after harvest ................................ 1,210 - - - 1,210 -
- - 1,210
Gross Profit / (loss) from Agricultural Activities .......................................................... 45,067 12,012 6,931 (3) 64,007 (22,428)
- - 41,579
Margin on Manufacturing and Agricultural Activities Before Operating Expenses .. 45,208 27,774 7,060 519 80,561 69,816
- - 150,377
General and administrative expenses ................................................................................ (3,266) (2,370) (1,166) (136) (6,938) (16,771)
- (15,530) (39,239)
Selling expenses ............................................................................................................... (3,413) (11,393) (464) (24) (15,294) (35,348)
- (1,129) (51,771)
Other operating (loss)/income, net .................................................................................... 11,358 (14) 80 (13) 11,411 3,495
- 145 15,051
Share of loss of joint ventures .......................................................................................... (462) - - - (462) -
- - (462)
Profit / (loss) from Operations Before Financing and Taxation ................................... 49,425 13,997 5,510 346 69,278 21,192 - (16,514) 73,956
Reserve from the sale of non-controlling interests in subsidiaries .................................... - - - - - -
25,508 - 25,508
Depreciation and amortization .......................................................................................... (1,493) (2,469) (1,162) (311) (5,435) (61,578)
- - (67,013)
Initial recognition and changes in fair value of biological assets (unrealized) ................... (1,588) 17 - - (1,571) (11,343)
- - (12,914)
Initial recognition and changes in fair value of agricultural produce (unrealized) .............. 11,484 3,918 - - 15,402 (4,318)
- - 11,084
Initial recognition and changes in fair value of biological assets and agricultural produce
(realized) .......................................................................................................................... 33,961 8,077 6,931 (3) 48,966 (6,767)
- - 42,199
Changes in net realizable value of agricultural produce after harvest (unrealized) ............. (5,258) - - - (5,258) -
- - (5,258)
Changes in net realizable value of agricultural produce after harvest (realized) ................ 6,468 - - - 6,468 -
- - 6,468
As of December 31, 2014:
Farmlands and farmland improvements, net .................................................................... 116,628 22,066 396 8,619 147,708 32,113 - - 179,821
Machinery, equipment and other fixed assets, net ............................................................. 5,478 20,339 14,599 1,169 41,585 435,323 - - 476,908
Work in progress .............................................................................................................. 1,693 3,859 652 - 6,203 113,973 - - 120,176
Investment property ........................................................................................................ - - - 6,675 6,675 - - - 6,675
Goodwill .......................................................................................................................... 7,241 3,228 - 1,482 11,951 8,221 - - 20,172
Biological assets............................................................................................................... 31,012 23,875 9,182 2,193 66,262 274,970 - - 341,232
Investment in joint ventures ............................................................................................. 2,752 - - - 2,752 - - - 2,752
Inventories ....................................................................................................................... 37,056 11,077 2,619 - 50,752 54,167 - - 104,919
Total segment assets ....................................................................................................... 196,926 84,140 27,512 25,395 333,973 918,682 - - 1,252,655
Borrowings .................................................................................................................. 68,460 13,215 3,647 1,805 87,127 611,379 - - 698,506
Total segment liabilities ............................................................................................. 68.460 13.215 3.647 1,805 87,127 611,379 - - 698,506
Adecoagro S.A.
Notes to the Condensed Consolidated Interim Financial Statements (continued)
(All amounts in US$ thousands, except shares and per share data and as otherwise indicated)
The accompanying notes are an integral part of these condensed consolidated interim financial statements.
F - 22
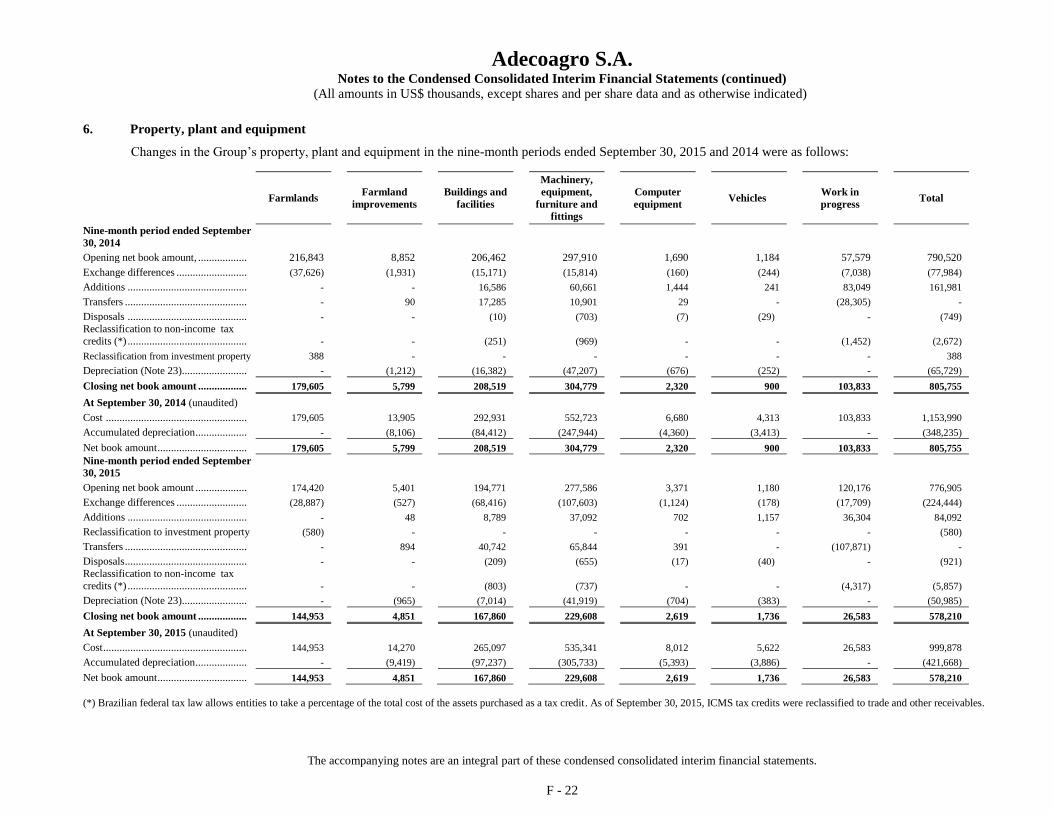
6. Property, plant and equipment
Changes in the Group’s property, plant and equipment in the nine-month periods ended September 30, 2015 and 2014 were as follows:
Farmlands Farmland
improvements
Buildings and
facilities
Machinery,
equipment,
furniture and
fittings
Computer
equipment Vehicles
Work in
progress Total
Nine-month period ended September
30, 2014
Opening net book amount, .................. 216,843 8,852 206,462 297,910 1,690 1,184 57,579 790,520
Exchange differences .......................... (37,626) (1,931) (15,171) (15,814) (160) (244) (7,038) (77,984)
Additions ............................................ - - 16,586 60,661 1,444 241 83,049 161,981
Transfers ............................................. - 90 17,285 10,901 29 - (28,305) -
Disposals ............................................ - - (10) (703) (7) (29) - (749)
Reclassification to non-income tax
credits (*) ............................................ - - (251) (969) - - (1,452) (2,672)
Reclassification from investment property 388 - - - - - - 388
Depreciation (Note 23) ........................ - (1,212) (16,382) (47,207) (676) (252) - (65,729)
Closing net book amount .................. 179,605 5,799 208,519 304,779 2,320 900 103,833 805,755
At September 30, 2014 (unaudited)
Cost .................................................... 179,605 13,905 292,931 552,723 6,680 4,313 103,833 1,153,990
Accumulated depreciation ................... - (8,106) (84,412) (247,944) (4,360) (3,413) - (348,235)
Net book amount ................................. 179,605 5,799 208,519 304,779 2,320 900 103,833 805,755
Nine-month period ended September
30, 2015
Opening net book amount ................... 174,420 5,401 194,771 277,586 3,371 1,180 120,176 776,905
Exchange differences .......................... (28,887) (527) (68,416) (107,603) (1,124) (178) (17,709) (224,444)
Additions ............................................ - 48 8,789 37,092 702 1,157 36,304 84,092
Reclassification to investment property (580) - - - - - - (580)
Transfers ............................................. - 894 40,742 65,844 391
-
(107,871) -
Disposals ............................................. - - (209) (655) (17) (40) - (921)
Reclassification to non-income tax
credits (*) ............................................ - - (803) (737) - - (4,317) (5,857)
Depreciation (Note 23) ........................ - (965) (7,014) (41,919) (704) (383) - (50,985)
Closing net book amount .................. 144,953 4,851 167,860 229,608 2,619 1,736 26,583 578,210
At September 30, 2015 (unaudited)
Cost ..................................................... 144,953 14,270 265,097 535,341 8,012 5,622 26,583 999,878
Accumulated depreciation ................... - (9,419) (97,237) (305,733) (5,393) (3,886) - (421,668)
Net book amount ................................. 144,953 4,851 167,860 229,608 2,619 1,736 26,583 578,210
(*) Brazilian federal tax law allows entities to take a percentage of the total cost of the assets purchased as a tax credit. As of September 30, 2015, ICMS tax credits were reclassified to trade and other receivables.

Adecoagro S.A.
Notes to the Condensed Consolidated Interim Financial Statements (continued)
(All amounts in US$ thousands, except shares and per share data and as otherwise indicated)
The accompanying notes are an integral part of these condensed consolidated interim financial statements.
F - 23
6. Property, plant and equipment (continued)
An amount of US$ 46,981 and US$ 60,367 of depreciation are included in “Cost of manufactured products
sold and services rendered” for the nine-month periods ended September 30, 2015 and 2014, respectively. An amount
US$ 3,941 and US$ 4,420 of depreciation are included in “General and administrative expenses” for the nine-month
periods ended September 30, 2015 and 2014, respectively, An amount of US$ 500 and US$ 942 of depreciation are
included in “Selling expenses” for the nine-month periods ended September 30, 2015 and 2014, respectively.
As of September 30, 2015, borrowing costs of US$ 5,556 (September 30, 2014: US$ 3,923) were capitalized
as components of the cost of acquisition or construction of qualifying assets.
Certain of the Group’s assets have been pledged as collateral to secure the Group’s borrowings and other
payables. The net book value of the pledged assets amounts to US$ 557,944 as of September 30, 2015.
As of September 30, 2015 included within property, plant and equipment balances are US$ 485 related to the
net book value of assets under finance leases.
7. Investment property
Changes in the Group’s investment property in the nine-month periods ended September 30, 2015 and 2014
were as follows:
September
30, 2015
September
30, 2014
(unaudited)
Beginning of the period ............................................................. 6,675 10,147
Reclassification to property, plant and
equipment ....................................................................................
580
(388)
Exchange differences .................................................................. ………………, (617) (2,298)
End of the period ...................................................................... 6,638 7,461
Cost 6,638 7,461
Accumulated depreciation - -
Net book amount 6,638 7,461
The following amounts have been recognized in the statement of income in the line “Sales of manufactured
products and services rendered”:
September
30, 2015
September
30, 2014
(unaudited)
Rental income ............................................................................ 988 1,134
As of September 30, 2015, the fair value of investment property was US$ 53 million (2014: US$ 57 million).

Adecoagro S.A.
Notes to the Condensed Consolidated Interim Financial Statements (continued)
(All amounts in US$ thousands, except shares and per share data and as otherwise indicated)
The accompanying notes are an integral part of these condensed consolidated interim financial statements.
F - 24
8. Intangible assets
Changes in the Group’s intangible assets in the nine-month periods ended September 30, 2015 and 2014
were as follows:
Goodwill Trademarks Software Others Total
Nine-month period ended
September 30, 2014
Opening net book amount ................. 24,869 1,129 1,343 - 27,341
Exchange differences ........................ (3,774) (26) (163) - (3,963)
Additions ........................................... - - 766 6 772
Amortization charge (i) (Note 23) .... - (108) (223) (2) (333)
Closing net book amount ................ 21,095 995 1,723 4 23,817
At September 30,2014 (unaudited)
Cost ................................................... 21,095 2,500 2,855 135 26,585
Accumulated amortization ................ - (1,505) (1,132) (131) (2,768)
Net book amount ............................. 21,095 995 1,723 4 23,817
Nine-month period ended
September 30, 2015
Opening net book amount ................. 20,172 959 2,634 13 23,778
Exchange differences ........................ (3,968) (10) (860) (18) (4,856)
Additions ........................................... - - 973 41 1,014
Amortization charge (ii) (Note 23) .. - - (429) (8) (437)
Closing net book amount ................ 16,204 949 2,318 28 19,499
At September 30, 2015 (unaudited)
Cost ................................................... 16,204 2,488 4,023 165 22,880
Accumulated amortization ................ - (1,539) (1,705) (137) (3,381)
Net book amount ............................. 16,204 949 2,318 28 19,499
(i) For the nine-month period ended September 30, 2014 an amount of US$ US$ 223 and US$ 110 of amortization
charges are included in “General and administrative expenses” and “Selling expenses”, respectively. There were no
impairment charges for any of the periods presented.
(ii) For the nine-month period ended September 30, 2015 an amount of US$ 429 and US$ 8 of amortization charges are
included in “General and administrative expenses” and “Selling expenses”, respectively. There were no impairment
charges for any of the periods presented.
The Group tests annually whether goodwill has suffered any impairment. The last impairment test of
goodwill was performed as of September 30, 2015 (see Note 4).

Adecoagro S.A.
Notes to the Condensed Consolidated Interim Financial Statements (continued)
(All amounts in US$ thousands, except shares and per share data and as otherwise indicated)
The accompanying notes are an integral part of these condensed consolidated interim financial statements.
F - 25
9. Biological assets
Changes in the Group’s biological assets in the nine-month periods ended September 30, 2015 and 2014
were as follows:
September 30,
2015
September 30,
2014
(unaudited)
Beginning of the period ................................ 341,232 292,144
Increase due to purchases .............................. 4 526
Initial recognition and changes in fair value
of biological assets ........................................ 19,679 40,369
Decrease due to harvest ................................. (241,528) (296,719)
Decrease due to disposals .............................. (2,728) (1,868)
Decrease due to sales of agricultural
produce ........................................................... (21,621)
(19,290)
Costs incurred during the period .................... 262,927 329,428
Exchange differences .................................... (102,156) (28,396)
End of the period .......................................... year………………………………………,,, 255,809 316,194
Biological assets as of September 30, 2015 and December 31, 2014 were as follows:
September 30,
2015
December 31,
2014
(unaudited)
Non-current
Cattle for dairy production ............................ 8,257 8,856
Other cattle .................................................... 23 25
Sown land – coffee ........................................ 1,602 2,193
Sown land – sugarcane .................................. 221,850 274,970
231,732 286,044
Current
Other cattle .................................................... 385 301
Sown land – crops ......................................... 12,450 31,012
Sown land – rice ............................................ 11,242 23,875
24,077 55,188
Total biological assets .................................. 255,809 341,232

Adecoagro S.A.
Notes to the Condensed Consolidated Interim Financial Statements (continued)
(All amounts in US$ thousands, except shares and per share data and as otherwise indicated)
The accompanying notes are an integral part of these condensed consolidated interim financial statements.
F - 26
10. Financial instruments
As of September 30, 2015, the financial instruments recognized at fair value on the statement of financial
position comprise derivative financial instruments.
In the case of Level 1, valuation is based on unadjusted quoted prices in active markets for identical financial
assets that the Group can refer to at the date of the statement of financial position. A market is deemed active if
transactions take place with sufficient frequency and in sufficient quantity for price information to be available on an
ongoing basis. Since a quoted price in an active market is the most reliable indicator of fair value, this should always be
used if available. The financial instruments the Group has allocated to this level mainly comprise crop futures and
options traded on the stock market, In the case of securities, the Group allocates them to this level when either a stock
market price is available or prices are provided by a price quotation on the basis of actual market transactions.
Derivatives not traded on the stock market allocated to Level 2 are valued using models based on observable
market data. For this, the Group uses inputs directly or indirectly observable in the market, other than quoted prices. If
the financial instrument concerned has a fixed contract period, the inputs used for valuation must be observable for the
whole of this period. The financial instruments the Group has allocated to this level mainly comprise interest-rate
swaps and foreign-currency interest-rate swaps.
In the case of Level 3, the Group uses valuation techniques not based on inputs observable in the market. This
is only permissible insofar as no observable market data are available. The inputs used reflect the Group’s assumptions
regarding the factors, which market players would consider in their pricing. The Group uses the best available
information for this, including internal company data. The Group does not have financial instruments allocated to this
level for any of the periods presented.
The following tables present the Group’s financial assets and financial liabilities that are measured at fair
value as of September 30, 2015 and their allocation to the fair value hierarchy:
2015
Level 1 Level 2 Level 3 Total
Assets
Derivative financial instruments ....... 5,640 - - 5,640
Total assets ....................................... 5,640 - - 5,640
Liabilities
Derivative financial instruments ....... (335) (19,442) - (19,777)
Total liabilities ................................. (335) (19,442) - (19,777)

Adecoagro S.A.
Notes to the Condensed Consolidated Interim Financial Statements (continued)
(All amounts in US$ thousands, except shares and per share data and as otherwise indicated)
The accompanying notes are an integral part of these condensed consolidated interim financial statements.
F - 27
10. Financial instruments (continued)
When no quoted prices in an active market are available, fair values (particularly with derivatives) are based
on recognized valuation methods. The Group uses a range of valuation models for this purpose, details of which may
be obtained from the following table:
Class Pricing
Method Parameters Pricing Model
Level Total
Futures Quoted price - - 1 5,124 Options Quoted price - - 1 181 OTC Quoted price - - 2 (809) Foreign-currency interest-rate swaps
Theoretical price - - 2 (148)
Interest-rate swaps Theoretical price Swap curve;
Money market interest-rate curve
Present value method
2 (18,485)
(14,137)

Adecoagro S.A.
Notes to the Condensed Consolidated Interim Financial Statements (continued)
(All amounts in US$ thousands, except shares and per share data and as otherwise indicated)
The accompanying notes are an integral part of these condensed consolidated interim financial statements.
F - 28
11. Trade and other receivables, net
(i) Includes US$ 4,489 for the nine-month period ended September 30, 2015 reclassified from property, plant and
equipment (for the year ended December 31, 2014: US$ 4,514).
September
30, 2015 December
31, 2014
(unaudited)
Non-current
Trade receivables ............................................. 2,382 3,528
Trade receivables – net .................................. 2,382 3,528
Advances to suppliers ...................................... 7,734 12,149
Income tax credits ............................................ 7,846 6,759
Non-income tax credits (i) ............................... 12,877 18,609
Judicial deposits ............................................... 2,011 2,545
Receivable from disposal of subsidiary ........... - 3,997
Other receivables.............................................. 1,077 3,003
Non-current portion ....................................... 33,927 50,590
Current
Trade receivables ............................................. 65,408 65,059
Receivables from related parties (Note 28) ...... 8,112 258
Less: Allowance for trade receivables ............. (688) (527)
Trade receivables – net .................................. 72,832 64,790
Prepaid expenses .............................................. 5,036 6,884
Advance to Suppliers ....................................... 24,461 11,717
Income tax credits ............................................ 5,083 6,492
Non-income tax credits (i) ............................... 33,513 42,685
Cash collateral ................................................. 23 6,329
Receivable from disposal of subsidiary ........... 2,863 4,451
Other receivables.............................................. 6,852 21,178
Subtotal ........................................................... 77,831 99,736
Current portion .............................................. 150,663 164,526
Total trade and other receivables, net .......... 184,590 215,116

Adecoagro S.A.
Notes to the Condensed Consolidated Interim Financial Statements (continued)
(All amounts in US$ thousands, except shares and per share data and as otherwise indicated)
The accompanying notes are an integral part of these condensed consolidated interim financial statements.
F - 29
11. Trade and other receivables, net (continued)
The fair values of current trade and other receivables approximate their respective carrying amounts due to
their short-term nature. The fair values of non-current trade and other receivables approximate their carrying amount,
as the impact of discounting is not significant.
The carrying amounts of the Group’s trade and other receivables are denominated in the following currencies
(expressed in US dollars):
September 30,
2015
December 31,
2014
(unaudited)
Currency
US Dollar ......................................................... 53,522 45,341
Argentine Peso ................................................. 46,198 49,876
Uruguayan Peso ............................................... 932 8,385
Brazilian Reais ................................................. 83,938 111,514
184,590 215,116
As of September 30, 2015 trade receivables of US$ 33,046 (December 31, 2014: US$ 4,224) were past due but
not impaired. The ageing analysis of these receivables indicates that 7,978 and 1,269 are over 6 months in September
30, 2015 and December 31, 2014, respectively.
The creation and release of allowance for trade receivables have been included in ‘Selling expenses’ in the
statement of income. Amounts charged to the allowance account are generally written off, when there is no expectation of recovering additional cash.
The other classes within other receivables do not contain impaired assets. The maximum exposure to credit risk at the reporting date is the carrying value of each class of receivable
mentioned above.
12. Inventories
September 30,
2015
December 31,
2014
(unaudited)
Raw materials .................................................... 32,067 35,662
Finished goods .................................................. 101,287 65,562
Stocks held by third parties ............................... 7,487 3,395
Others ................................................................ 254 300
141,095 104,919
The cost of inventories recognized as expense are included in ‘Cost of manufactured products sold and services
rendered’ amounted to US$ 211,086 for the nine-month period ended September 30, 2015. The cost of inventories
recognized as expense and included in ‘Cost of agricultural produce sold and direct agricultural selling expenses’
amounted to US$ 92,921 for the nine-month period ended September 30, 2015.

Adecoagro S.A.
Notes to the Condensed Consolidated Interim Financial Statements (continued)
(All amounts in US$ thousands, except shares and per share data and as otherwise indicated)
The accompanying notes are an integral part of these condensed consolidated interim financial statements.
F - 30
13. Cash and cash equivalents
September 30,
2015
December 31,
2014
(unaudited)
Cash at bank and on hand ................................. 183,879 104,132
Short-term bank deposits .................................. 40,470 9,663
224,349 113,795
14. Disposals
Sale of 49% of interest in Global Anceo S.L.U. and Global Hisingen S.L.U. In September, 2014, the Group sold 49% of its interest in Global Anceo S.L.U. and Global Hisingen S.L.U.
The main underlying assets of such corporations are Guayacanes and La Guarida farms. Sale price amounted US$ 50.5 million and US$ 49.4 million was collected as of the transaction´s day, As the
Company did not lose control of its subsidiaries, this operation is classified as an equity’s transaction, and the margin of the operation was registered in Statement of Changes in Shareholders’ Equity under the line item “Reserve from the sale of non-controlling interests in subsidiaries”. The transaction resulted in an increase of equity attributable to owners of the Company of US$ 25.6 million and also an increase in non-controlling interest of US$ 8.0 million.
15. Shareholder´s Contributions
Number of
shares
(thousands)
Share capital
and share
premium
At January 1, 2014 ........................................ 122,382 1,122,645
Employee share options exercised (Note 16) - 844
Restricted shares vested .................................. - 3,444
Purchase of own shares ................................... - (10,424)
At September 30,2014 ................................... 122,382 1,116,509
At January 1, 2015 ........................................ 122,382 1,116,617
Employee share options exercised (Note 16) - 1,504
Restricted shares vested .................................. - 3,103
Purchase of own shares ................................... - (256)
At September 30, 2015 .................................. 122,382 1,120,968

Adecoagro S.A.
Notes to the Condensed Consolidated Interim Financial Statements (continued)
(All amounts in US$ thousands, except shares and per share data and as otherwise indicated)
The accompanying notes are an integral part of these condensed consolidated interim financial statements.
F - 31
15. Shareholder´s Contributions
Share Repurchase Program
On September 24, 2013, the Board of Directors of the Company has authorized a share repurchase program
for up to 5% of its outstanding shares, The repurchase program has commenced on September 24, 2013 and will be reviewed by the Board of Directors after a 12-month period: repurchases of shares under the program are made from time to time in open market transactions in compliance with the trading conditions of Rule 10b-18 under the U,S, Securities Exchange Act of 1934, as amended, and applicable rules and regulations. The share repurchase program does not require Adecoagro to acquire any specific number or amount of shares and may be modified, suspended, reinstated or terminated at any time in the Company’s discretion and without prior notice. The size and the timing of repurchases will depend upon market conditions, applicable legal requirements and other factors. On August 15, 2015 the Board of directors decided to extend the program for a 12 month period.
16. Equity-settled share-based payments
The Group has set a “2004 Incentive Option Plan” and a “2007/2008 Equity Incentive Plan” (collectively
referred to as “Option Schemes”) under which the Group grants equity-settled options to senior managers and selected
employees of the Group´s subsidiaries. Additionally, in 2010 the Group has set a “Adecoagro Restricted Share and
Restricted Stock Unit Plan” (referred to as “Restricted Share Plan”) under which the Group grants restricted shares, or
restricted stock units to senior and medium management and key employees of the Group’s subsidiaries.
(a) Option Schemes
For the nine-month periods ended September 30, 2015 the Group incurred US$ nil million (2014: US$ 0.3
million), related to the options granted under the Option Schemes.
As of September 30, 2015 were exercised 183,007 options (2014: 122,828), and were forfeited 31,230
(2014: 26,946).
(b) Restricted Share and Restricted Stock Unit Plan
As of September 30, 2015, the Group recognized compensation expense US$ 3.2 million related to the
restricted shares granted under the Restricted Share Plan (2014: US$ 2,6 million).
For the nine-month period ended September 30, 2015, 624,670 Restricted Stock Units were granted, (2014:
479,816), 432,204 vested, (2014: 405,931), and 32,217 were forfeited (2014: 24,589).

Adecoagro S.A.
Notes to the Condensed Consolidated Interim Financial Statements (continued)
(All amounts in US$ thousands, except shares and per share data and as otherwise indicated)
The accompanying notes are an integral part of these condensed consolidated interim financial statements.
F - 32
17. Trade and other payables
September 30,
2015
December 31,
2014
(unaudited)
Non-current
Payable from acquisition of property, plant and
equipment (i) ................................................... 1,563 2,084
Other payables ................................................ 229 307
1,792 2,391
Current
Trade payables ................................................ 46,932 70,269
Advances from customers ............................... 2,316 5,636
Amounts due to related parties (Note 28) ...... 192 -
Taxes payable ................................................. 2,105 4,217
Escrows arising on business combinations ..... - 316
Other payables ................................................ 1,273 2,662
52,818 83,100
Total trade and other payables .................... 54,610 85,491
(i) These trades payable are mainly collateralized by property, plant and equipment.

Adecoagro S.A.
Notes to the Condensed Consolidated Interim Financial Statements (continued)
(All amounts in US$ thousands, except shares and per share data and as otherwise indicated)
The accompanying notes are an integral part of these condensed consolidated interim financial statements.
F - 33
18. Borrowings
September 30,
2015
December 31,
2014
(unaudited)
Non-current
Votoratim ........................................................ - 434
ABC Brazil Loan ............................................ 9,164 3,571
Bradesco Loan (*) ........................................... 2,351 4,557
BNDES Loan Facility(*) ................................ 104,318 163,009
IDB Facility (*) ............................................... 13,995 21,972
Ciudad de Buenos Aires Loan ........................ 11,429 11,389
Banco do Brazil Loan Facility (*) ................... 40.385 68,653
Itaú BBA Facility (*) ...................................... 17,050 30,654
ING/ABN/Bladex(*) ....................................... 17,753 28,000
Rabobank, Syndicated Loan (*) ...................... 47,158 71,562
ING Bank N.V. Syndicated Loan (*) .............. 49,815 66,006
ING/Rabobank/ABN/Crédit
Agricole/HSBC/Caixa Geral/Galena(*) .......... 123,369 -
ING/Rabobank/Bladex/Crédit
Agricole/Votorantim/ABN(*) ......................... 108,059 -
Other bank borrowings.................................... 17,621 21,224
Obligations under finance leases .................... 118 293
562,585 491,324
Current
Bank overdrafts ............................................... 1,737 7,789
BNDES Loan Facility (*) ............................... 20,909 27,430
IDB Facility (*) ............................................... 16,407 15,827
Ciudad de Buenos Aires Loan ........................ 8,976 2,947
Galicia Loan .................................................... 450 1,000
Banco do Brazil Loan Facility (*) ................... 13,327 12,708
Rabobank Loan (*) ......................................... 21,688 38,665
ITAU (*) ......................................................... 6,480 27,319
ABC Brazil Loan ............................................ 43 10,134
Bradesco Loan (*) ........................................... 4,017 4,086
Votoratim ........................................................ 1,055 2,421
ING/ABN/Bladex(*)…………………………. 89 4
Rabobank, Syndicated Loan (*)……………… 23,570 217
ING/HSBC/ICBC/BES/Bradesco/Hinduja/Blad
ex/BoC/Paschi(*) ............................................ 34,515 32,606
ING/Rabobank/ABN/Crédit
Agricole/HSBC/Caixa Geral/Galena(*)……… 34,534 -
Banco Macro…………………………………. 5,057 -
Other borrowings……………………………… 28,030 -
Other bank borrowings……………………….. 25,190 23,742
Obligations under finance leases ..................... 223 287
246,297 207,182
Total borrowings ........................................... 808,882 698,506
(*) The Group was in compliance with the related covenants under the respective loan agreements.

Adecoagro S.A.
Notes to the Condensed Consolidated Interim Financial Statements (continued)
(All amounts in US$ thousands, except shares and per share data and as otherwise indicated)
The accompanying notes are an integral part of these condensed consolidated interim financial statements.
F - 34
18. Borrowings (continued)
New loan – ING Bank N.V. Syndicated Loan
In January and February 2015, Adecoagro Vale do Ivinhema entered into a US$ 160.0 million loan with
syndicate of banks, led by ING Bank N.V. and Rabobank, due 2018. This syndicate loan bears an interest of LIBOR 3
months + 4.40% per annum and contains certain customary financial covenants and restrictions which require us to
meet pre-defined financial ratios, among other restrictions, as well as restrictions on the payment of dividends.
New loan – ING Bank N.V. and Rabobank Curaçao N.V. Syndicated Loan
In August 2015, Adecoagro Vale do Ivinhema entered into a US$ 110.0 million loan with a syndicate of
banks, led by ING Bank N.V. and Rabobank Curaçao N.V., due in 2019. This syndicate loan bears an interest of
LIBOR 3 months + 4.65% per annum and contains certain customary financial covenants which require us to meet pre-
defined financial ratios.
As of September 30, 2015, total bank borrowings include collateralized liabilities of US$ 744,769 (December
31, 2014: US$ 640,034). These loans are mainly collateralized by property, plant and equipment sugarcane plantations,
sugar export contracts and shares of certain subsidiaries of the Group.
The maturity of the Group's borrowings (excluding obligations under finance leases) and the Group's exposure
to fixed and variable interest rates is as follows:
September 30,
2015
December 31,
2014
(unaudited)
Fixed rate:
Less than 1 year .................................................. 110,079 95,524
Between 1 and 2 years ........................................ 32,406 45,518
Between 2 and 3 years ........................................ 26,664 41,685
Between 3 and 4 years ........................................ 23,449 25,809
Between 4 and 5 years ........................................ 22,217 39,992
More than 5 years ............................................... 37,754 87,219
252,569 335,747
Variable rate:
Less than 1 year .................................................. 135,995 111,371
Between 1 and 2 years ........................................ 149,076 130,426
Between 2 and 3 years ........................................ 138,150 80,199
Between 3 and 4 years ........................................ 85,650 13,154
Between 4 and 5 years ........................................ 34,231 7,346
More than 5 years ............................................... 12,870 19,683
555,972 362,179
808,541 697,926

Adecoagro S.A.
Notes to the Condensed Consolidated Interim Financial Statements (continued)
(All amounts in US$ thousands, except shares and per share data and as otherwise indicated)
The accompanying notes are an integral part of these condensed consolidated interim financial statements.
F - 35
18. Borrowings (continued)
The carrying amounts of the Group’s borrowings are denominated in the following currencies (expressed in
US dollars):
September 30,
2015
December 31,
2014
(unaudited)
Currency
US Dollar ......................................................... 590,115 320,638
Brazilian Reais ................................................ 213,351 362,733
Argentine Peso ................................................ 5,416 15,135
808,882 698,506
19. Taxation
Taxes on income in the interim periods are accrued using the tax rate that would be applicable to expected
total annual earnings.
September 30,
2015
September 30,
2014
(unaudited)
Current income tax ......................................... (1,893) (805)
Deferred income tax ...................................... (2,628) (4,856)
Income tax expense ....................................... (4,521) (5,661)
There has been no change in the statutory tax rates in the countries where the Group operates since December
31, 2014,
Argentine law includes a 10% withholding tax on dividend distributions made by Argentine companies to
individuals and foreign beneficiaries. As of September 30, 2015, the Company did not record any liability on retain
earnings at their Argentine subsidiaries due to its dividend policy which defines that the Company intends to retain any
future earnings to finance operations and the expansion of their business and does not intend to distribute or pay any
cash dividends on our common shares in the foreseeable future.
The gross movement on the deferred income tax account is as follows:
September 30,
2015
September 30,
2014
(unaudited)
Beginning of period asset/(liability) ................ 5,963 (9,255)
Exchange differences ...................................... (15,520) 10,258
Tax charge relating to cash flow hedge (i) ...... 50,960 9,764
Income tax expense ......................................... (2,628) (4,856)
End of period asset/(liability) ....................... 38,775 5,911
(i) Relates to the gain or loss before income tax of cash flow hedge recognized in other comprehensive income
net of the amount reclassified from equity to profit and loss amounting to U$S 14,838 loss for the nine-
month period ended September 30, 2015.

Adecoagro S.A.
Notes to the Condensed Consolidated Interim Financial Statements (continued)
(All amounts in US$ thousands, except shares and per share data and as otherwise indicated)
The accompanying notes are an integral part of these condensed consolidated interim financial statements.
F - 36
19. Taxation (continued)
The tax on the Group’s profit before tax differs from the theoretical amount that would arise using the
weighted average tax rate applicable to profits of the consolidated entities as follows:
September 30,
2015
September 30,
2014
(unaudited)
Tax calculated at the tax rates applicable to
profits in the respective countries ....................... (7,161)
(6,184)
Non-deductible items .......................................... (349) (335)
Tax losses where no deferred tax asset was
recognized ........................................................... (461) (952)
Non-taxable income ............................................ 3,429 2,322
Others expenses ................................................. 21 (512)
Income tax expense ........................................... (4,521) (5,661)
20. Payroll and social security liabilities
September 30,
2015
December 31,
2014
(unaudited)
Non-current
Social security payable ............................... 1,457 1,278
1,457 1,278
Current
Salaries payable .......................................... 9,311 6,322
Social security payable ............................... 2,544 3,898
Provision for vacations ............................... 9,617 12,364
Provision for bonuses .................................. 4,485 4,731
25,957 27,315
Total payroll and social security liabilities 27,414 28,593
21. Provisions for other liabilities
The Group is subject to several laws, regulations and business practices of the countries where it operates,
In the ordinary course of business, the Group is subject to certain contingent liabilities with respect to existing or
potential claims, lawsuits and other proceedings, including those involving tax, labor and social security,
administrative and civil and other matters. The Group accrues liabilities when it is probable that future costs will be
incurred and it can reasonably estimate them. The Group bases its accruals on up-to-date developments, estimates of
the outcomes of the matters and legal counsel experience in contesting, litigating and settling matters. As the scope
of the liabilities becomes better defined or more information is available, the Group may be required to change its
estimates of future costs, which could have a material effect on its results of operations and financial condition or
liquidity. There have been no material changes to claimed amounts and current proceedings since December 31,
2014.

Adecoagro S.A.
Notes to the Condensed Consolidated Interim Financial Statements (continued)
(All amounts in US$ thousands, except shares and per share data and as otherwise indicated)
The accompanying notes are an integral part of these condensed consolidated interim financial statements.
F - 37
22. Sales
September 30,
2015
September 30,
2014
(unaudited)
Sales of manufactured products and services
rendered:
Ethanol .............................................................................. 100,332 101,713
Sugar (*)............................................................................ 109,205 111,710
Rice (*) ............................................................................. 64,580 71,668
Energy ............................................................................... 38,431 40,323
Powder milk ...................................................................... 1,041 2,493
Operating leases ................................................................ 986 1,213
Services ............................................................................. 1,196 1,562
Others ................................................................................ 697 18
316,468 330,700
Sales of agricultural produce and biological
assets:
Soybean (*) ....................................................................... 63,021 71,039
Cattle for dairy production ................................................ 2,728 1,868
Corn (*) ............................................................................. 28,528 63,141
Cotton ................................................................................ 1,261 3,689
Milk ................................................................................... 21,621 19,290
Wheat ................................................................................ 9,831 6,226
Chia ................................................................................... 175 -
Peanut ................................................................................ 691 -
Sunflower .......................................................................... 9,906 6,796
Barley ................................................................................ 625 1,049
Sorghum ............................................................................ 110 72
Seeds ................................................................................. 385 823
Others ................................................................................ 296 1232
139,178 175,225
Total sales ....................................................................... 455,646 505,925
(*) Includes sales of soybean, corn, rice, powder milk, sugar and energy produced by third parties for an amount of
US$ 1,042; US$ 37; US$ 7,394; US$ 586, US$ 21,910 and US$ 2 respectively.
Commitments to sell commodities at a future date
The Group entered into contracts to sell non-financial instruments, mainly, sugar, soybean and corn
through sales forward contracts. Those contracts are held for purposes of delivery the non-financial instrument in
accordance with the Group’s expected sales. Accordingly, as the own use exception criteria are met, those contracts
are not recorded as derivatives.
The notional amount of these contracts is US$ 92.0 million as of September 30, 2015 (September 30, 2014:
US$ 159.5 million) comprised primarily of 214,339 tons of sugar (US$ 57.2 million), 13,749 m³ of ethanol (US$ 5.4
million), 138,473 mhw of energy (U$S 8.8 million) and 40,023 tons of soybean (U$S 9.8 million), 46,443 tons of
corn (US$ 6.0 million), 16,753 tons of wheat (US$ 2.1 million), 366 tons of cotton (US$ 0.4 million) and 5,870 tons
of others crops (US$ 2.3 million) which expire between October 2015 and December 2015.

Adecoagro S.A.
Notes to the Condensed Consolidated Interim Financial Statements (continued)
(All amounts in US$ thousands, except shares and per share data and as otherwise indicated)
The accompanying notes are an integral part of these condensed consolidated interim financial statements.
F - 38
23. Expenses by nature
The following table provides the additional disclosure required on the nature of expenses and their
relationship to the function within the Group:
September 30,
2015
September 30,
2014
(unaudited)
Cost of agricultural produce and biological assets
sold .............................................................. 117,270 154,322
Raw materials and consumables used in
manufacturing activities .............................. 128,778 124,109
Services ....................................................... 7,809 10,269
Salaries and social security expenses (Note 24) 43,495 45,586
Depreciation and amortization ................... 51,422 67,013
Taxes (*) ..................................................... 2,582 2,796
Maintenance and repairs ............................ 7,432 8,211
Lease expense and similar arrangements(**) 1,201 1,762
Freights ....................................................... 31,445 33,671
Export taxes / selling taxes.......................... 22,616 22,765
Fuel and lubricants ..................................... 5,886 6,425
Others .......................................................... 14,898 11,208
Total expenses by nature ......................... 434,834 488,137
(*) Excludes export taxes and selling taxes.
(**) Relates to various cancellable operating lease agreements for office and machinery equipment.
For the nine-month period ended September 30, 2015, an amount of US$ 211,086 is included as “cost of
manufactured products sold and services rendered” (September 30, 2014: 221,902); an amount of US$ 139,178 is
included as “cost of agricultural produce sold and direct agricultural selling expenses” (September 30, 2014:
175,225); an amount of US$ 36,345 is included in “general and administrative expenses” (September 30, 2014:
39,239); and an amount of US$ 48,225 is included in “selling expenses” as described above (September 30, 2014:
51,771).
24. Salaries and social security expenses
September 30,
2015
September 30,
2014
(unaudited)
Wages and salaries ...................................... 30,600 32,500
Social security costs .................................... 9,735 10,158
Equity-settled share-based compensation ... 3,160 2,928
43,495 45,586
Number of employees ................................. 8,326 8,239

Adecoagro S.A.
Notes to the Condensed Consolidated Interim Financial Statements (continued)
(All amounts in US$ thousands, except shares and per share data and as otherwise indicated)
The accompanying notes are an integral part of these condensed consolidated interim financial statements.
F - 39
25. Other operating (loss)/income, net
September 30,
2015
September 30,
2014
(unaudited)
Gain/(Loss) from commodity derivative
financial instruments ................................... 30,238 14,228
Gain / (Loss) from onerous contracts –
forwards ...................................................... 2 (176)
Gain from disposal of other property items 909 788
Others .......................................................... 118 211
31,267 15,051
26. Financial results, net
September 30,
2015
September 30,
2014
(unaudited)
Finance income:
- Interest income ......................................... 6,820 5,735
- Gain from interest rate/foreign exchange
rate derivative financial instruments, net .... - 679
- Other income ............................................ 414 229
Finance income .......................................... 7,234 6,643
Finance costs:
- Interest expense ........................................ (36,961) (42,314)
- Cash flow hedge – transfer from equity.... (14,838) (5,062)
- Loss from interest rate/foreign exchange
rate derivative financial instruments ........... (4,288) (863)
- Foreign exchange losses, net .................... (3,110) (6,889)
- Taxes ........................................................ (2,312) (3,003)
- Other expenses .......................................... (2,807) (1,513)
Finance costs .............................................. (64,316) (59,644)
Total financial results, net ........................ (57,082) (53,001)
27. Disclosure of leases and similar arrangements
The Group as lessor - Operating leases
In September 2013, Marfrig Argentina S.A. (“Marfrig ARG”), an Argentine company subsidiary of the
Brazilian company Marfrig Alimentos S.A. (today Marfrig Global Foods S.A.) (“Marfrig Brazil”) unilaterally early
terminated the Master Agreement, including the lease agreements entered into with the Group on December 2009 for a
ten-year term. Therefore, on April 21, 2014 the Group filed a lawsuit against Marfrig ARG and Marfrig Brazil claiming
the indemnification set forth in the Master Agreement and unpaid invoices for aggregate of approximately US$ 22.5
million. The lawsuit was filed with the Court of Arbitration of the Stock Exchange Chamber of the City of Buenos
Aires.

Adecoagro S.A.
Notes to the Condensed Consolidated Interim Financial Statements (continued)
(All amounts in US$ thousands, except shares and per share data and as otherwise indicated)
The accompanying notes are an integral part of these condensed consolidated interim financial statements.
F - 40
28. Related-party transactions
The following is a summary of the balances and transactions with related parties:
Related party
Relationship Description of
transaction
Income (loss) included in
the statement of income Balance receivable
(payable)
September
30, 2015
September
30, 2014
September
30, 2015
December
31, 2014
(unaudited) (unaudited) (unaudited)
Mario Jorge de Lemos
Vieira/ Cia Agropecuaria
Monte Alegre/ Alfenas
Agricola Ltda./ Marcelo
Weyland Barbosa Vieira/
Paulo Albert Weyland
Vieira
(i)
Receivables (Note 11) ...............
- - - 258
Cost of manufactured
products sold and
services rendered (ii)
(195) (2,357) - -
Payables (Note 17) - - (192) -
CHS Agro Joint venture Services ..................................... 42 31 - -
Sales of goods ............................ 2,245 1,290 - -
Interest income…… 137 18 - -
Receivables (Note
11)………………… - - 8,112 -
Directors and senior
management
Employment Compensation
selected employees ....................
(5,670) (5,553)
(15,639) (16,876)
(i) Shareholder of the Company.
(ii) Relates to agriculture partnership agreements (“parceria”)