addressing radial feeder challenges with microgrids · 2018-10-24 · microscada pro license a ’s...
TRANSCRIPT

—
Addressing Radial Feeder Challenges with Microgrids
by Randall September, ABB

—
• ABB Grid Automation overview
• Overview of Radial Feeder Challenges
• How can Microgrid help
• What ABB has to offer
• Radial Feeder Microgrid Business Case
• Summary
October 24, 2018 Slide 2
Agenda
—
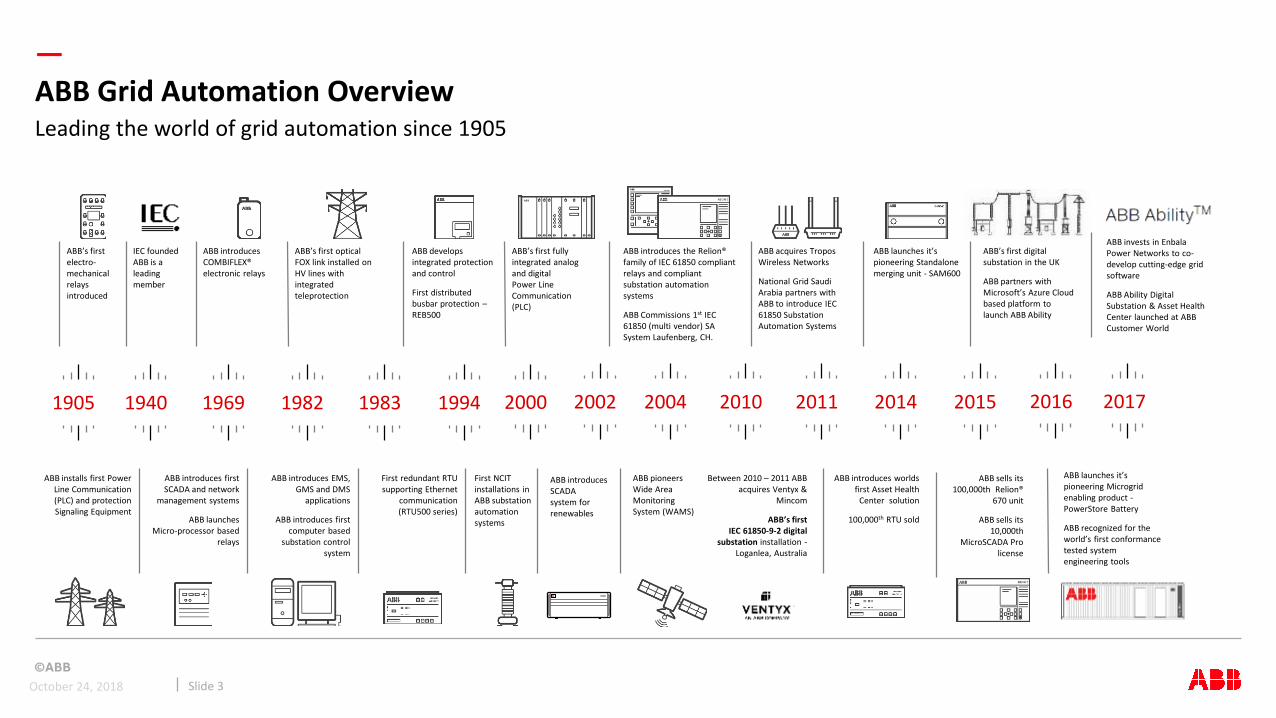
1905 1940 1969 1982 1983 1994 2002 2004 2010 2011 2014 2015
ABB installs first Power Line Communication (PLC) and protection Signaling Equipment
ABB introduces first SCADA and network
management systems
ABB launches Micro-processor based
relays
ABB introduces EMS, GMS and DMS
applications
ABB introduces first computer based
substation control system
First redundant RTU supporting Ethernet
communication (RTU500 series)
First NCIT installations in ABB substation automation systems
ABB pioneers Wide Area Monitoring System (WAMS)
Between 2010 – 2011 ABB acquires Ventyx &
Mincom
ABB’s firstIEC 61850-9-2 digital
substation installation -Loganlea, Australia
ABB introduces worlds first Asset Health
Center solution
100,000th RTU sold
ABB sells its 100,000th Relion®
670 unit
ABB sells its 10,000th
MicroSCADA Pro license
ABB’s first electro-mechanical relays introduced
IEC founded ABB is a leading member
ABB introduces COMBIFLEX® electronic relays
ABB’s first optical FOX link installed on HV lines with integrated teleprotection
ABB develops integrated protection and control
First distributed busbar protection –REB500
ABB’s first fully integrated analog and digital Power Line Communication (PLC)
ABB introduces the Relion® family of IEC 61850 compliant relays and compliant substation automation systems
ABB Commissions 1st IEC 61850 (multi vendor) SA System Laufenberg, CH.
ABB acquires Tropos Wireless Networks
National Grid Saudi Arabia partners with ABB to introduce IEC 61850 Substation Automation Systems
ABB launches it’s pioneering Standalone merging unit - SAM600
ABB Grid Automation Overview
Slide 3
Leading the world of grid automation since 1905
2016
ABB’s first digital substation in the UK
ABB partners with Microsoft’s Azure Cloud based platform to launch ABB Ability
ABB launches it’s pioneering Microgrid enabling product -PowerStore Battery
ABB recognized for the world’s first conformance tested system engineering tools
2017
ABB invests in Enbala Power Networks to co-develop cutting-edge grid software
ABB Ability Digital Substation & Asset Health Center launched at ABB Customer World
2000
ABB introduces SCADA system for renewables
October 24, 2018

—
Long-term drivers for energy storage
Challenges of the future power grid
Electricity consumption on the rise– Electrification of everything – moving towards electricity as the primary source of power– Economic and population growth will lead to increasing demand for power
Coal plant retirements – Reducing baseload power capacity – Limited resources for ancillary services on the utility grid
Growth in renewables – Governments and industry moving towards solar and wind – Intermittent generation sources can reduce reliability on the electrical grid
Electrification of transportation – More users of EVs can increase peak loads placing more strain on the electrical grid– Increase in high speed rail
Proliferation of smart grid technology– Bi-directional flow of power requires additional coordination between power supply and demand
Tax and regulatory incentives – Renewable mandates and incentives increasing demand for clean grid technologies– Potential tax benefits for storage systems (residential, commercial and utility)
October 24, 2018Slide 4

—Executive Summary
October 24, 2018 Slide 5
Challenges for distribution utilities Microgrid benefits
• Defer distribution system upgrades while manage expected demand growth
• Improve reliability performance and resiliency
• Provide voltage regulation and increase hosting capacity of network for additional renewable penetration
• Decrease demand charges by peak shaving
• Radial feeders in need of capacity upgrades for the demand growth.
• Below-average reliability and power quality metrics
• Voltage issues due to the increased Solar Photovoltaic (PV) penetration
• Peak demand charges for Distribution utility
Target is distribution utilities that can own energy storage

—Grid connected Battery Energy Storage Systems
October 24, 2018 Slide 6

—Radial Feeder challenges

—Load Growth Challenge
October 24, 2018 Slide 8
Radial feeder Load forecast, substation capacity
Distribution system cannot host the expected demand growth in future due to substation capacity
Distribution utility with radial feeders in need for capacity upgrade
Substation
Circuit Breaker
Voltage Regulator
Voltage Regulator
Solar PV
Aggregated Load

—Reliability Performance Measurements
October 24, 2018 Slide 9
System Average Interruption Duration Index System Average Interruption Frequency Index
System Average Interruption Frequency Index (SAIFI):
The sum of the number of interrupted customers for eachpower outage greater than five minutes during a givenperiod, divided by the total number of customers served forthe area. This metric is expressed in the average number ofoutages per year
System Average Interruption Duration Index (SAIDI):
The sum of the restoration time for each sustainedinterruption multiplied by the sum of the number ofcustomers interrupted, divided by the total number ofcustomers served for the area. This metric is expressed inaverage minutes per year
According to IEEE, North American utilities have the SAIFI median value of 1.10 interruptions per customer per year and the SAIDI median value of 90 minutes per customer per year
System Average Interruption Duration Index (SAIDI), System Average Interruption Frequency Index (SAIFI)

—Reliability Performance for Utilities
October 24, 2018 ABB AbilityTM Velocity Suite, https://new.abb.com/enterprise-software/energy-portfolio-management/market-intelligence-services/velocity-suiteSlide 10
US utility categories and reliability performances
Utility Type Sales (million MWh)
Fraction of distribution line miles (related to total US)
Customer Per mile of distribution line (density)
SAIDI (minutes per customer per year)
SAIFI (per customer per year)
Cooperative Utility (Co-op) 41% 8
Municipal Utility (Muni) 3% 66
Investor-Owned Utility (IOU) 56% 38
0 1000 2000
ResidentialCommercialIndustrial
0 200 400
Without major events
0 1 2 3
Without major events

—Economic Impacts of Reliability Performance
October 24, 2018“Decision Addressing The General Rate Cases of San Diego Gas & Electric Company and Southern California Gas Company and The Proposed Settlements”, June 2016Finish Electricity Market Act, 2018, “Compensation for Power Cuts”
Slide 11
Example from San Diego Gas & Electric
1. Penalty/ Reward Scheme
2. Non-Delivered Energy (Costumer compensation Finnish Electricity Market Act)
Impacts SAIDI System Worst Circuit
Target (minutes) 60 585
Dead Band +/- 2 +/- 35
Increment 1 10
Annual Improvement
1%
Reward Increment
375 kUSD 125 kUSD
Penalty Increment
375 kUSD 125 kUSD
Maximum 3 MUSD 1 MUSD
SAIFI System Worst Circuit
Target (outages)
0.51 4.40
Dead Band +/- 0.02 +/- 0.35
Increment 0.01 0.10
Annual Improvement
1%
Reward Increment
375 kUSD 125 kUSD
Penalty Increment
375 kUSD 125 kUSD
Maximum 3 MUSD 1 MUSD

—Voltage Issues
ABB AbilityTM Velocity Suite, https://new.abb.com/enterprise-software/energy-portfolio-management/market-intelligence-services/velocity-suiteJ. Bank, B. Mather, J. Keller, and M. Codington, “High Penetration Photovoltaic Case Study Report,” NREL, 2013
October 24, 2018 Slide 12
US Solar Global Horizontal Irradiance Map with Planned and Operating Solar Generating Units (By ABB AbilityTM Velocity Suite)
Over Voltage: The PV generation increases the line voltage at the feed-in point.
Voltage Fluctuations: Clouds cause frequent voltage changes. Voltage regulators have ~30 second operational delay.
Impact of PV on the long radial feeder voltage regulation
In the existence of solar PV, VRs need to get replaced every year due to hundreds of thousands operation (mechanical switching) per year

—Peak Demand Charges
ABB NAM Reference Case, https://new.abb.com/enterprise-software/energy-portfolio-managementSANDIA Report, “Green Mountain Power (GMP): Significant Revenues from Energy Storage”, SAND2017-6164, May 2017, available online at https://www.sandia.gov/ess-ssl/publications/SAND2017-6164.pdf
October 24, 2018 Slide 13
Transmission Charge Capacity Charge (ABB NAM Reference Case)
Distribution utilities pay peak demand charges- Example New England Independent System Operator (ISO)

—How Microgrids can helpWhat ABB has to offer

—Microgrid
* Islanded mode: ability to provide power independently from the main power gridOctober 24, 2018 Slide 15
Microgrid Defenition
Distributed energy resources and loads that can be operated in a controlled, coordinated way either connected to the main power grid or in “islanded”* mode.
Microgrids are low or medium voltage grids without power transmission capabilities and are typically not geographically spread out.
ABB has 331 MW global installed capacity of Microgrid and BESS
Solar PV power plant
Wind power plant
Remote asset management and
data analytics
Advanced powerdistribution and
protection
Conventional power
Grid connection
Modular scalable energy storage and grid stabilization
Commercial loads
Industrial loads
Distributed control system
Residential loads

—What ABB has to offer
October 24, 2018 Slide 16
ABB - global microgrid and battery energy storage system, solution partner
AND
Consulting
Service
3rd party financing
25+ years experience 40+ executed projects
25+
Innovation, technology & productization leadership
Global sales &service network
Microgrid
control system
Energy storage and grid stabilization Renewable power
Conventional power Power distribution and protection
Leading global expertise Broad portfolio of products & services

—Radial Feeder Microgrid Business Case

—Radial Feeder Business Case – Problem Definition
October 24, 2018 Slide 18
Distribution Utility Challenges Power System Assumptions
Location: Long radial feeders with geographic restrictions
• Peak demand exceeds the substation capacity in 5 years.
• The capacity upgrade is required to manage the load growth.
• The utility pays the peak demand charges to ISO/RTO.
• The reliability performance is below the target and utility pays the penalty.
• The utility is facing increased O&M cost for voltage issues by solar PV
Load 8 MWp, 5.5 MW avg, 1% growth rate
Substation Capacity
8.5 MW
Solar PV 800 kWp
Utility Rate 0.12 USD/kWh (50% grid fee), 2% inflation rate
SAIDI 420 minutes per customer per year
SAIFI 3 times per customer per year
Reliability Impact
125 kUSD-Year as a Penalty/ Reward, 2% inflation rate
Demand Charge
100 USD/kW-Year as transmission charge, 12 USD/kW-Month as a capacity charge, 2% growth rate
System O&M Cost
425 kUSD, including extra maintenance for VRs.

—Radial Feeder Business Case - Scenarios
October 24, 2018 Slide 19
Distribution Capacity Upgrade Scenario Microgrid Solutions Scenario
These scenarios manage the demand growth, but Microgrids have multiple revenue streams.
Substation
Circuit Breaker
Voltage Regulator
Voltage Regulator
Solar PV
ABB Microgrid Plus Control System
ABB PowerStore Energy Storage
Aggregated Load
Substation
Circuit Breaker
Voltage Regulator
Voltage Regulator
Solar PV Aggregated Load

—Scenario 1: Distribution Capacity Upgrade
October 24, 2018 Slide 20
Qualitative description
Peak Demand
Voltage Regulation
2
4
Distribution Capacity Upgrade
Distribution utility pays the penalty for low reliability performance.
1
Reliability 3
The operation and maintenance cost is increased due to the voltage issues occurred by PV integration.
Distribution utility pays the investment for capacity upgrades. This covers the load growth during the project duration considering the lead time.
Distribution utility pays for the capacity charge and transmission charge related to the peak demand.

—Scenario 1: Distribution Capacity Upgrade
Microgrid Knowledge Report for Berkley, published on August 17, 2018.October 24, 2018 Slide 21
Benefits Costs
Upgrade Cost 1 MUSD per mile*
Distance 5 miles
Lead time 5 years
• Manage the expected demand growth
• No impact on Peak demand charges
• No impact on reliability performance
• No impact on voltage regulation and relative maintenance costs
Quantitative description

—Scenario 2: Microgrid Solutions
October 24, 2018 Slide 22
Qualitative description
Peak Demand
Voltage Regulation
2
4
Microgrid
Distribution utility receives the reward for high reliability performance
1
Reliability 3
Voltage regulators need to switch less due to the battery voltage regulation
Distribution utility invests in Microgrid solution with lower lead time to manage the expected demand growth
Distribution utility pays less demand charge due to the Microgrid peak shaving capability
Microgrid improves resiliency and increase hosting capacity of distribution system for renewable integration

—Scenario 2: Microgrid Solutions
Lazard levelized cost of storage analysis,October 24, 2018 Slide 23
Benefits Costs
• Manage the expected demand growth by peak shaving
• Reduce Peak demand charges by 20%
• Improve reliability performance and receive rewards of 125 kUSD per year
• Decrease system O&M costs relative to voltage regulators by 25%.
Quantitative description of Microgrid (5.5 MW, 16.5 MWh)
Microgrid total cost 470 USD/ kWh**
Battery replacement cost after 10 years
175 USD/ kWh
Lead time 1 year
Microgrid O&M Cost 0.2% Microgrid CAPEX

—Radial Feeder Business Case- Results
October 24, 2018 Slide 24
20 years project life time with 9% discount rate
Microgrid is the economic solution for the Distribution utility with radial feeder in need for capacity upgrade
Scenario 1: Distribution System Upgrade Scenario 2: Microgrid
CAPEX 5 MUSD 7.8 MUSD
OPEX 27.3 MUSD 21.9 MUSD
Revenue 32.7 MUSD 34 MUSD
Net Present Value 0.4 MUSD 4.3 MUSD
Internal Rate of Return 10% 15%
Payback Period 10 years 6 years

—Radial Feeder Business Case- Results, Cont’d.
October 24, 2018 Microgrid O&M cost includes the battery replacement and the annual maintenance expensesSlide 25
Break down of Cost Benefit Analysis (20 years project life, 9% discount rate)

—Sensitivity Analysis – CAPEX
October 24, 2018 Slide 26
Impact of CAPEX on Upgrade Scenario NPV Impact of CAPEX on Microgrid Scenario NPV
Upgrade Cost, and Microgrid Cost
-10
-8
-6
-4
-2
0
2
4
6
8
10
-50% -40% -30% -20% -10% 0% 10% 20% 30% 40% 50%
Mic
rogr
id N
PV
(M
USD
)
Change of Microgrid Cost (%)
Microgrid Scenario
-10
-8
-6
-4
-2
0
2
4
6
8
10
-50% -40% -30% -20% -10% 0% 10% 20% 30% 40% 50%
Up
grad
e N
PV
(M
USD
)
Change of Upgrade Cost (%)
Upgrade Scenario

—Sensitivity Analysis - Key Drivers for Microgrid Scenario
October 24, 2018 Slide 27
Impact on the Net Present Value
Sensitivity Parameter Low Case (-10%)
Base Case High Case (+10%)
Impact on Net Present Value Compared to the Base Case
Microgrid Cost (USD/kWh) 423 470 517
Peak Demand Reduction (%) 18 20 22
Reliability Reward (kUSD-year)
112.5 125 137.5
O&M Cost Reduction for Voltage Regulation (%)
22.5 25 27.5
-2%
-3%
-10%
18%
2%
3%
10%
-18%
High Case (+10%) Low Case (-10%)

—
Sensitivity Parameter Impact on NPV Compared to the Base Case
Microgrid Cost (USD/kWh)
Peak Demand Reduction (%)
Reliability Reward (kUSD-year)
O&M Cost Reduction for VoltageRegulation (%)Scenario 1: Capacity
UpgradeScenario 2: Microgrid
Net Present Value 0.4 MUSD 4.3 MUSD
Internal Rate of Return 10% 15%
Payback Period 10 years 6 years
Microgrid scenario have higher NPV, and IRR with 4 years less payback period
October 24, 2018 Slide 28
Summary: Microgrid/BESS benefits utilities with multiple revenue streams
Cost benefit analysis for 20 years lifetime and 9% discount rate
Sensitivity analysis on Microgrid scenario
Radial Feeder in need of capacity upgrade to manage the demand
Microgrid is more economic, providing multiple revenue streams.
Key parameters are Microgrid Cost, peak demand reduction, reliability reward, and O&M cost reduction.
Demand exceeds the substation capacity in 5 years.
-2%
-3%
-10%
18%
2%
3%
10%
-18%
High Case (+10%) Low Case (-10%)
0
2
4
6
8
10
12
0 4 8 12 16 20
Po
we
r (M
W)
Time (Hours)
Load Substation Capacity Load Forecast in 20 years

—Summary

—Microgrid Business Case for Radial Feeder
October 24, 2018 Slide 30
Key Takeaways
• Defer Distribution System Upgrade
• Manage Demand Growth
• Provide Peak Shaving
• Improve Reliability Performance
• Provide Voltage Regulation
• Increase Hosting Capacity of Distribution System
• Improve ResiliencySubstation
Circuit Breaker
Voltage Regulator
Voltage Regulator
Solar PV
ABB Microgrid Plus Control System
ABB PowerStore Energy Storage
Aggregated Load

—Developing a microgrid project from concept to commission
October 24, 2018 Slide 31
The project lifecycle
Concept Feasibility study Detailed engineering SupplyInstallation
& commissioningOptimization
Main business drivers
Business case
Analysis
Data collection
Social & Environmental Economic & Operational
Technical Site conditions, solar, wind, generation and load
Financial Subsidies, OpEx Costs, Fuel price
Technical viability Financial analysis
Different tools are required for each stage of the project lifecycle
– HOMER Quickstart (http://quickstart.homerenergy.com/)
– Financial model
– HomerPro (Energy flow)
– Power factory, PSSE, PSCAD (Loadflow, Stability, Protection)
– MatLab (Tuning)
Each tool has its own specific application
Operations & Maintenance
Microgrid Project Lifecycle
