addressing medication non-adherence through …ncpa.co/uploads/arkansas-report-final.pdf ·...
TRANSCRIPT
Addressing Medication Non-Adherence through Implementation of an Appointment-Based
Medication Synchronization Network
Jacob T Painter, PharmD, MBA, PhD Assistant Professor of Pharmaceutical Evaluation & Policy
Department of Pharmacy Practice
University of Arkansas for Medical Sciences
Gary Moore, MS Department of Pharmacy Practice
University of Arkansas for Medical Sciences
Bri Morris, PharmD Associate Director of Strategic Initiatives
National Community Pharmacists Association
Study conducted for the National Community Pharmacists Association in cooperation with the Arkansas Pharmacists Association and support from Pfizer
2
Executive Summary
The management and treatment of patients with chronic diseases accounted for eighty-six percent of
the total health care spend in America in 2010, yet only 50% of those on chronic medications adhere
to their prescription therapy. Prescription medications are an important tool for the management of
chronic diseases. Medication adherence and persistence are critical to positive patient outcomes.
Pharmacists across the nation are helping patients improve adherence by offering a high touch and
personalized adherence program called Appointment-Based Medication Synchronization (ABMS).
This model helps patients manage their prescriptions through a monthly appointment to refill
medications and scheduled interactions with the pharmacist. By simplifying the pharmacy’s workflow,
the pharmacist has more time for valuable patient interactions and other services that help improve
health outcomes. Patients’ personal connection with a pharmacist or pharmacy staff is the number
one predictor of medication adherence.
Thousands of independent pharmacy innovators nationwide are helping patients improve adherence
through ABMS. In order to determine the impact of pharmacist-provided ABMS programs across a
virtual network of ABMS pharmacies, the National Community Pharmacists Association, working in
collaboration with the Arkansas Pharmacists Association, engaged the services of PrescribeWellness
to provide the underlying technology platform that could facilitate the delivery of ABMS. The study
measured the collective impact of ABMS on medication adherence and persistence rates across 82
independently-owned pharmacies (operating on 13 unique pharmacy management systems) in the
state of Arkansas.
Data was collected retrospectively from May 7, 2014 to May 31, 2015. There were two arms of this
study, ‘enrollees’ and ‘controls.’ Study participants were required to have two 30-day or greater
prescriptions for a chronic medication. We examined medications in nine classes: beta blockers,
biguanides, calcium channel blockers, dipeptidyl peptidase-IV inhibitors, non-warfarin anticoagulants,
renin-angiotensin system antagonists, sodium glucose transporter-2 inhibitors, statins, and
sulfonylureas. Enrollees and controls were matched on medication class, pharmacy urbanicity, follow-
up time, age, and sex. Adherence was measured using the proportion of days covered (PDC) and
non-persistence was examined using the date of discontinuation of an eligible chronic medication.
ABMS patients were significantly more adherent and more persistent across all drug classes. Patients
in an ABMS program were 2.57 times more likely to be adherent compared to controls. Finally, when
comparing persistence, ABMS enrollees were 21% less likely to discontinue therapy than matched
controls.
This study demonstrates that the high touch community pharmacy-based ABMS can significantly
improve patient adherence and persistence. Medication adherence has been shown to improve
health outcomes and decreases total healthcare costs. In addition, community pharmacists have
been very successful at tailoring the core components of ABMS into many different operational
models. Despite these differences in approach, each pharmacist-driven model works and produces
consistently positive results.
3
Introduction
Prescription medications are an important tool for the management of chronic diseases. However,
medications are most effective if taken at appropriate doses in correct quantity and at appropriate
time intervals. Medication adherence and persistence are critical to positive patient outcomes.1 The
management and treatment of those with chronic disease accounted for eighty six percent of the total
health care spend in America in 2010,2 yet only 50% of those on chronic medications adhere to their
prescription therapy.3
Medication adherence refers to the extent of patient compliance with prescribed dosing and interval
recommendations; whereas, persistence is the length of time between the initiation of a drug therapy
and its discontinuation. These issues are important not only for the clinical outcomes of individual
patients but also as a major public health concern. Taken together, non-adherence and non-
persistence results in excess costs to the health care system that total in the hundreds of billions of
dollars each year.4
Pharmacists across the nation are helping patients improve medication adherence by offering a high-
touch and personalized adherence program called Appointment-Based Medication Synchronization
(ABMS). This model helps patients manage their prescriptions through a monthly appointment to refill
medications and scheduled interactions with the pharmacist. By simplifying the pharmacist’s
workflow, the pharmacist has more time for valuable patient interactions and other services that help
improve health outcomes. Patients’ personal connection with a pharmacist or pharmacy staff is the
number one predictor of medication adherence.3
Research confirms the critical role that pharmacists play in providing patients with the assistance
necessary to maintain high levels of medication adherence. In particular, refill coordination at a single
pharmacy is recognized as an effective tactic to improve adherence. The National Community
Pharmacists Association (NCPA) developed a program called Simplify My Meds®, which is based on
the concept of refill synchronization and coordinates all of a patient’s prescriptions to be filled on the
same day each month. The ABMS model was pioneered in the 1990s by John Sykora, an
independent pharmacist-owner in Long Beach, California. The model helps patients manage their
prescriptions through scheduled visits and discussions with their pharmacist. Unlike automatic refill
programs, the ABMS builds upon established pharmacist-patient relationships to provide high-touch
interactions.5
Other literature suggests ABMS methodologies are effective at increasing patient adherence and
persistence.3,5-7 The most comprehensive look at an ABMS intervention was published in 2015 and
examined implementation in a single pharmacy chain consisting of 71 pharmacies in 20 Ohio
counties.8 This study showed that ABMS was associated with significantly better adherence and
persistence across all examined drug classes. Thousands of independent pharmacy innovators
nationwide are helping patients improve adherence through ABMS, yet little research on the overall
impact of ABMS across a large group of independent pharmacies exists.
In order to determine if independent pharmacies could come together to form a virtual network of
ABMS pharmacies to improve adherence, NCPA, working in collaboration with the Arkansas
Pharmacists Association (APA) and 82 Arkansas pharmacies, engaged the services of
PrescribeWellness to help conduct a study to assess the impact of a patient-centric ABMS on
4
patients' adherence to their medications. Due to the number of pharmacy management systems
(PMSs) utilized by independent pharmacies, NCPA sought a vendor to provide the underlying
technology platform that could both facilitate the delivery of ABMS and provide data to measure the
aggregate impact this model can have on medication adherence rates.
Despite operating more than a dozen distinct PMSs, this network of pharmacies was bound together
by the common technology platform provided by PrescribeWellness. This ABMS-enabling technology
platform facilitated the delivery of ABMS in a standardized fashion across multiple PMSs. The
objective of this study was to measure the collective impact of ABMS on medication adherence and
persistence rates across a network of independent pharmacies. Additionally, as health care moves to
a value-based system, a non-research objective of this study was to understand how community
pharmacies could come together to form a virtual network of pharmacies to improve adherence.
The project officially launched in May 2014 with 82 pharmacies participating. Some pharmacies were
delayed in their ability to enroll patients due to data connectivity to their PMS. Data was accessed by
PrescribeWellness through direct interface to PMSs or via nightly reports uploaded to
PrescribeWellness by the pharmacy.

5
Methods
Study Design
This retrospective cohort study examined records from patients that filled prescriptions at 82
independent pharmacies in Arkansas between May 7, 2014 and May 31, 2015. Prescription fill
records and patient data were collected during the study period for all patients at these pharmacies.
For inclusion in the study, patients must have been at least 18 years of age at the time of their first
prescription and had at least two fills for 30 days or more of a chronic medication falling into one of 13
classes (antiretrovirals, beta blockers, biguanides, calcium channel blockers, dipeptidyl peptidase
[DPP]-IV inhibitors, meglitinides, incretin mimetics, non-warfarin anticoagulants, renin-angiotensin
system [RAS] antagonists, sodium glucose transporter-2 [SGLT2] inhibitors, statins, sulfonylureas,
and thiazolidinediones). Patients could be included in more than one medication class group if they
met the inclusion criteria independently for each. For ABMS patients, fills were counted after the date
of enrollment in the program, control patients were included if two fills occurred after the beginning of
the study period. Patients were required to have a minimum of sixty days of data after their first fill to
allow for adequate follow-up. Patients with invalid demographic data or those at pharmacies with no
enrollees were excluded.
Enrollment
Although all patients at participating pharmacies were eligible to enroll in the ABMS program, those
patients with multiple, chronic medications were targeted for inclusion. Patients meeting this criterion
were approached by a pharmacy staff member and given information about the program and the
opportunity to opt-in. Patients opting-in to the program signed a form acknowledging their acceptance
of the terms of the intervention.
Intervention
In the ABMS model, pharmacies coordinate a patient’s prescriptions onto a single appointment day
each month. This simplification is shown to increase patient adherence by decreasing gaps between
refills, decreasing regimen complexity, and providing an opportunity for continual interaction between
pharmacists and patients to review all of the patient’s medications on a monthly basis to ensure safe
and appropriate use.
Pharmacies participating in this study employed Simplify My Meds® (an ABMS program developed by
NCPA) and StarWellness (the medication synchronization module through PrescribeWellness).
Simplify My Meds is an adherence program that provides pharmacists with training, resources, and
marketing materials to help support the implementation of ABMS. Through these programs,
pharmacies (1) synchronized refills for the patient on a single ‘appointment day’, (2) contacted the
patient 7-10 days prior to the appointment day to review his/her medications (allowing for changes to
prescriptions [i.e. discontinuations, no refills, recent hospitalizations, etc.] to be handled ahead of
time), (3) reviewed the orders one-day before the appointment day to resolve any clinical issues, and
(4) reminded the patient of their appointment day one day prior to their appointment day, and (5) met

6
with the patient on the appointment day to discuss any outstanding issues, provide counseling, or
patient services (MTM, immunizations). Pharmacy onboarding and ongoing implementation support
was provided by the APA, NCPA, and PrescribeWellness.
Measures
The outcomes of interest for this study were medication adherence and medication non-persistence.
Adherence was measured using the proportion of days covered (PDC) i.e. the proportion of days in
the measurement period that a patient had a ‘days supply’ of a medication according to their
prescription fill record. To be consistent with similar studies in this literature, a PDC threshold of 0.8
was chosen as the line between adherent and non-adherent.6,7 Non-persistence was examined using
the date of discontinuation of a chronic medication i.e. the date the patient stopped taking the
medication for 30 days or more. (See Glossary for more detail)
Data Analysis
The analysis period for this study was May 7, 2014 to May 31, 2015. Patients that participated in the
ABMS program were included in the analysis beginning on the date of their first qualifying medication
fill following enrollment in the program. Control patients were included in the analysis from the first
qualifying medication fill within the study period. Qualifying medications were those medications with
at least two fills with a day supply of at least 30 days that fell in one of the chronic medication
categories listed above. Only patients that met inclusion criteria between May 7, 2014 and April 1,
2015 were included in the study to allow at least 60 days of follow-up
Patients enrolled in the ABMS program were matched with up to 5 comparison patients based on
medication class, pharmacy urbanicity (based on United States Department of Agriculture 2013
Rural-Urban Continuum Codes), follow-up time (+/- 15 days), age (+/- 5 years), and sex. Therefore,
matched patients are enrollees and controls with the same sex, similar age, similar length of follow-
up, receiving a medication in the same class, from a pharmacy in a similar setting. If fewer than 50
enrollees remained within a drug class after matching, that medication class was excluded from
analysis.
Descriptive statistics were collected and adherence and non-persistence were compared. The
Wilcoxon signed-rank test was used to compare PDC between the two groups due to the matched
enrollees and comparison patients and the non-normality of the measure. Univariate logistic
regression was used to predict the odds of adherence (PDC ≥0.8) for patients in the ABMS and
comparison groups. Non-persistence was estimated using the time to discontinuation of the
medication in a univariate Cox proportional hazards regression. We assumed patients continued in
the program until the end of data collection following the ‘intention-to-treat’ principle commonly used
in similar analyses. All analyses used an alpha of <0.05 to define statistical significance. Data
analysis was conducted using SAS version 9.4 (SAS Institute Inc., Cary, NC) and Stata version 13
(Stata Corp., College Station, TX).
7
Results
Pharmacy and Patient Sample Flowchart
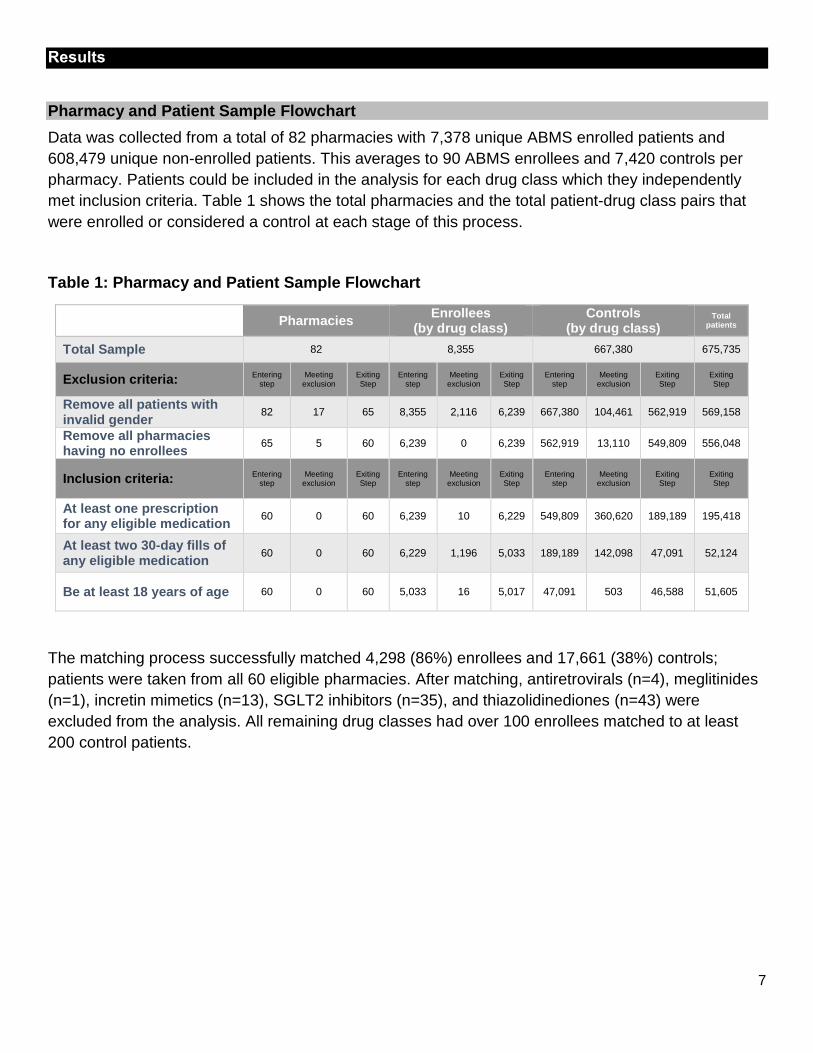
Data was collected from a total of 82 pharmacies with 7,378 unique ABMS enrolled patients and
608,479 unique non-enrolled patients. This averages to 90 ABMS enrollees and 7,420 controls per
pharmacy. Patients could be included in the analysis for each drug class which they independently
met inclusion criteria. Table 1 shows the total pharmacies and the total patient-drug class pairs that
were enrolled or considered a control at each stage of this process.
Table 1: Pharmacy and Patient Sample Flowchart
Pharmacies Enrollees
(by drug class) Controls
(by drug class) Total
patients
Total Sample 82 8,355 667,380 675,735
Exclusion criteria: Entering
step Meeting
exclusion Exiting Step
Entering step
Meeting exclusion
Exiting Step
Entering step
Meeting exclusion
Exiting Step
Exiting Step
Remove all patients with invalid gender
82 17 65 8,355 2,116 6,239 667,380 104,461 562,919 569,158
Remove all pharmacies having no enrollees
65 5 60 6,239 0 6,239 562,919 13,110 549,809 556,048
Inclusion criteria: Entering
step Meeting
exclusion Exiting Step
Entering step
Meeting exclusion
Exiting Step
Entering step
Meeting exclusion
Exiting Step
Exiting Step
At least one prescription for any eligible medication
60 0 60 6,239 10 6,229 549,809 360,620 189,189 195,418
At least two 30-day fills of any eligible medication
60 0 60 6,229 1,196 5,033 189,189 142,098 47,091 52,124
Be at least 18 years of age 60 0 60 5,033 16 5,017 47,091 503 46,588 51,605
The matching process successfully matched 4,298 (86%) enrollees and 17,661 (38%) controls;
patients were taken from all 60 eligible pharmacies. After matching, antiretrovirals (n=4), meglitinides
(n=1), incretin mimetics (n=13), SGLT2 inhibitors (n=35), and thiazolidinediones (n=43) were
excluded from the analysis. All remaining drug classes had over 100 enrollees matched to at least
200 control patients.
8
Mean PDC Score (Adherence) of Enrollees and Controls by Drug Class
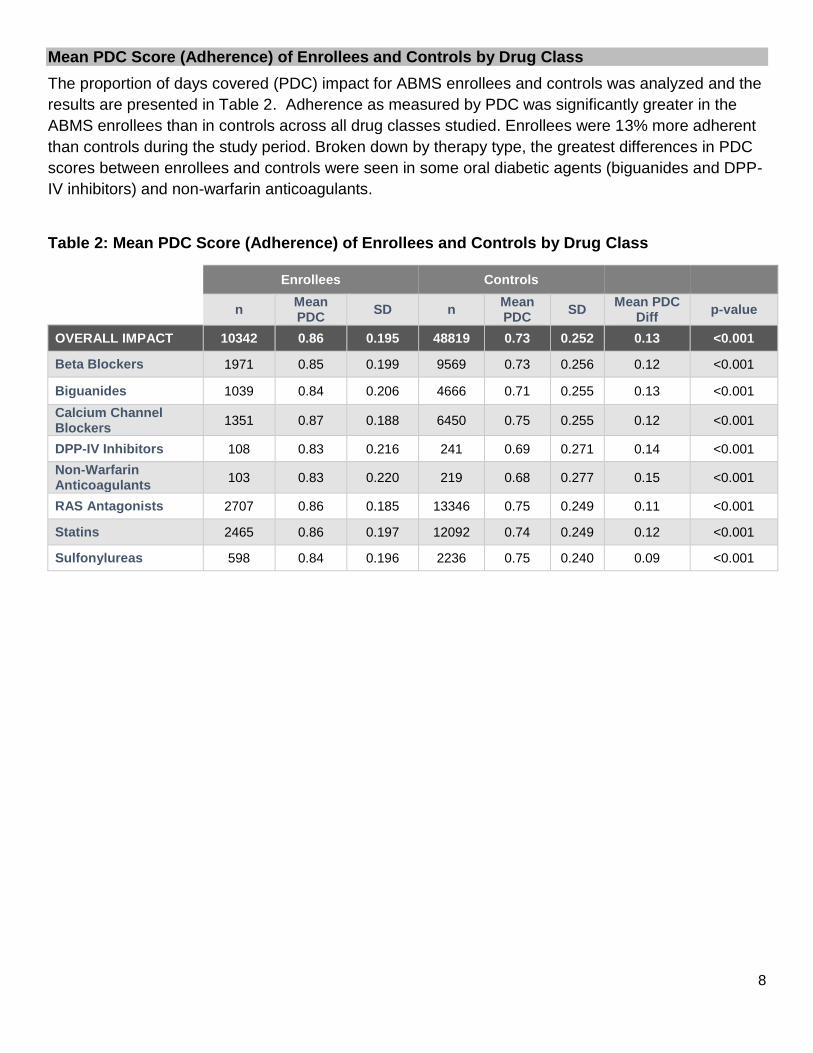
The proportion of days covered (PDC) impact for ABMS enrollees and controls was analyzed and the
results are presented in Table 2. Adherence as measured by PDC was significantly greater in the
ABMS enrollees than in controls across all drug classes studied. Enrollees were 13% more adherent
than controls during the study period. Broken down by therapy type, the greatest differences in PDC
scores between enrollees and controls were seen in some oral diabetic agents (biguanides and DPP-
IV inhibitors) and non-warfarin anticoagulants.
Table 2: Mean PDC Score (Adherence) of Enrollees and Controls by Drug Class
Drug Class Enrollees Controls
n Mean PDC
SD n Mean PDC
SD Mean PDC
Diff p-value
OVERALL IMPACT 10342 0.86 0.195 48819 0.73 0.252 0.13 <0.001
Beta Blockers 1971 0.85 0.199 9569 0.73 0.256 0.12 <0.001
Biguanides 1039 0.84 0.206 4666 0.71 0.255 0.13 <0.001
Calcium Channel Blockers
1351 0.87 0.188 6450 0.75 0.255 0.12 <0.001
DPP-IV Inhibitors 108 0.83 0.216 241 0.69 0.271 0.14 <0.001
Non-Warfarin Anticoagulants
103 0.83 0.220 219 0.68 0.277 0.15 <0.001
RAS Antagonists 2707 0.86 0.185 13346 0.75 0.249 0.11 <0.001
Statins 2465 0.86 0.197 12092 0.74 0.249 0.12 <0.001
Sulfonylureas 598 0.84 0.196 2236 0.75 0.240 0.09 <0.001
9
Percent of Patients Adherent (PDC≥0.8) for Enrollees and Controls by Drug Class
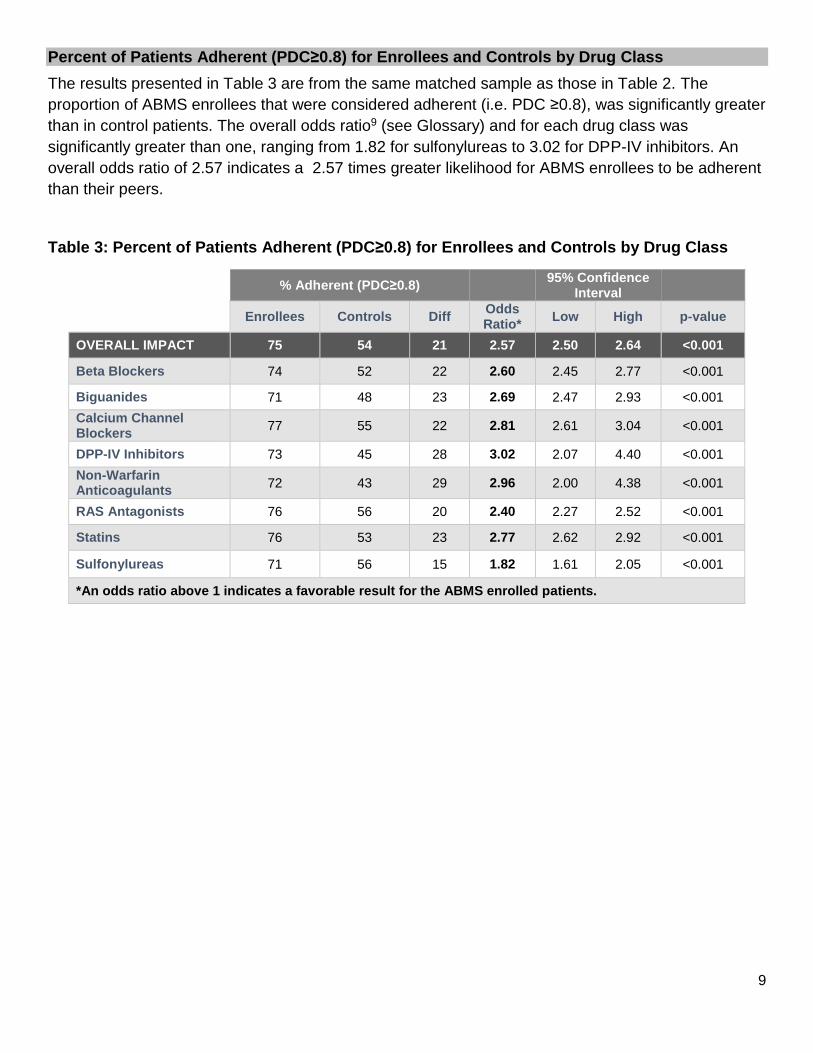
The results presented in Table 3 are from the same matched sample as those in Table 2. The
proportion of ABMS enrollees that were considered adherent (i.e. PDC ≥0.8), was significantly greater
than in control patients. The overall odds ratio9 (see Glossary) and for each drug class was
significantly greater than one, ranging from 1.82 for sulfonylureas to 3.02 for DPP-IV inhibitors. An
overall odds ratio of 2.57 indicates a 2.57 times greater likelihood for ABMS enrollees to be adherent
than their peers.
Table 3: Percent of Patients Adherent (PDC≥0.8) for Enrollees and Controls by Drug Class
% Adherent (PDC≥0.8)
95% Confidence Interval
Enrollees Controls Diff Odds Ratio*
Low High p-value
OVERALL IMPACT 75 54 21 2.57 2.50 2.64 <0.001
Beta Blockers 74 52 22 2.60 2.45 2.77 <0.001
Biguanides 71 48 23 2.69 2.47 2.93 <0.001
Calcium Channel Blockers
77 55 22 2.81 2.61 3.04 <0.001
DPP-IV Inhibitors 73 45 28 3.02 2.07 4.40 <0.001
Non-Warfarin Anticoagulants
72 43 29 2.96 2.00 4.38 <0.001
RAS Antagonists 76 56 20 2.40 2.27 2.52 <0.001
Statins 76 53 23 2.77 2.62 2.92 <0.001
Sulfonylureas 71 56 15 1.82 1.61 2.05 <0.001
*An odds ratio above 1 indicates a favorable result for the ABMS enrolled patients.
10
Mean Persistence (Time to Stay on Medication Regimen) for Enrollees and Controls
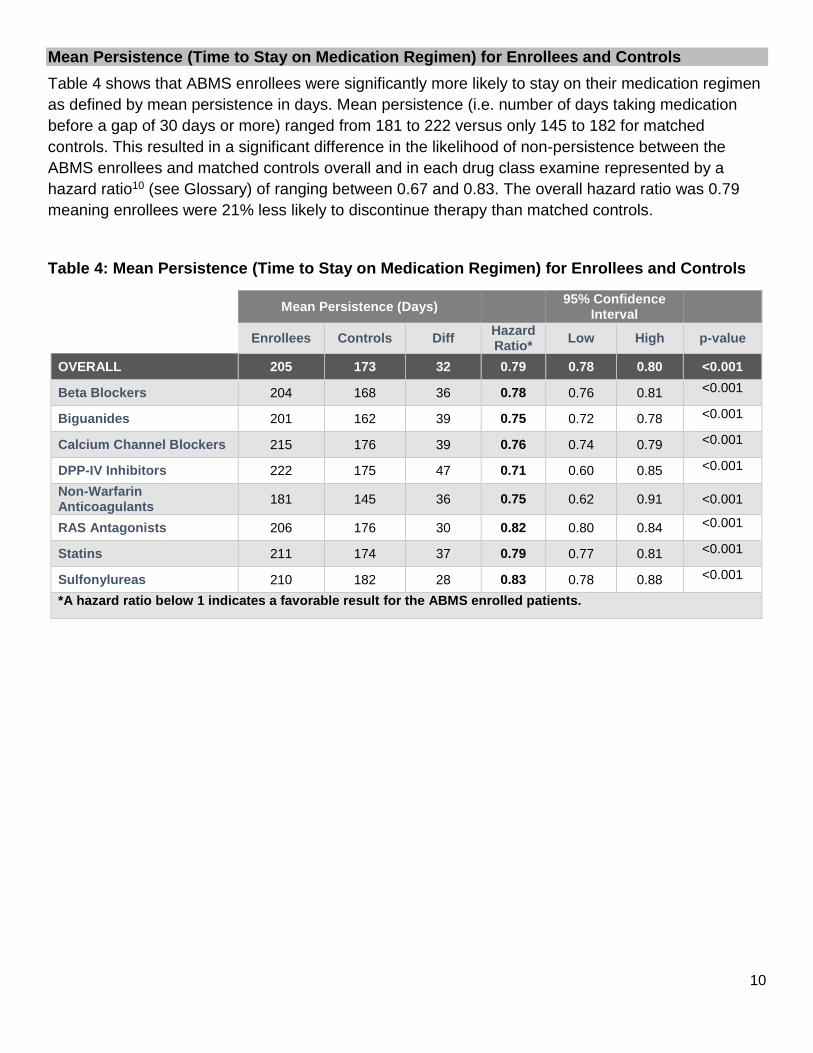
Table 4 shows that ABMS enrollees were significantly more likely to stay on their medication regimen
as defined by mean persistence in days. Mean persistence (i.e. number of days taking medication
before a gap of 30 days or more) ranged from 181 to 222 versus only 145 to 182 for matched
controls. This resulted in a significant difference in the likelihood of non-persistence between the
ABMS enrollees and matched controls overall and in each drug class examine represented by a
hazard ratio10 (see Glossary) of ranging between 0.67 and 0.83. The overall hazard ratio was 0.79
meaning enrollees were 21% less likely to discontinue therapy than matched controls.
Table 4: Mean Persistence (Time to Stay on Medication Regimen) for Enrollees and Controls
Drug Class Mean Persistence (Days) 95% Confidence
Interval
Enrollees Controls Diff Hazard Ratio*
Low High p-value
OVERALL 205 173 32 0.79 0.78 0.80 <0.001
Beta Blockers 204 168 36 0.78 0.76 0.81 <0.001
Biguanides 201 162 39 0.75 0.72 0.78 <0.001
Calcium Channel Blockers 215 176 39 0.76 0.74 0.79 <0.001
DPP-IV Inhibitors 222 175 47 0.71 0.60 0.85 <0.001
Non-Warfarin Anticoagulants
181 145 36 0.75 0.62 0.91 <0.001
RAS Antagonists 206 176 30 0.82 0.80 0.84 <0.001
Statins 211 174 37 0.79 0.77 0.81 <0.001
Sulfonylureas 210 182 28 0.83 0.78 0.88 <0.001
*A hazard ratio below 1 indicates a favorable result for the ABMS enrolled patients.
11
Discussion
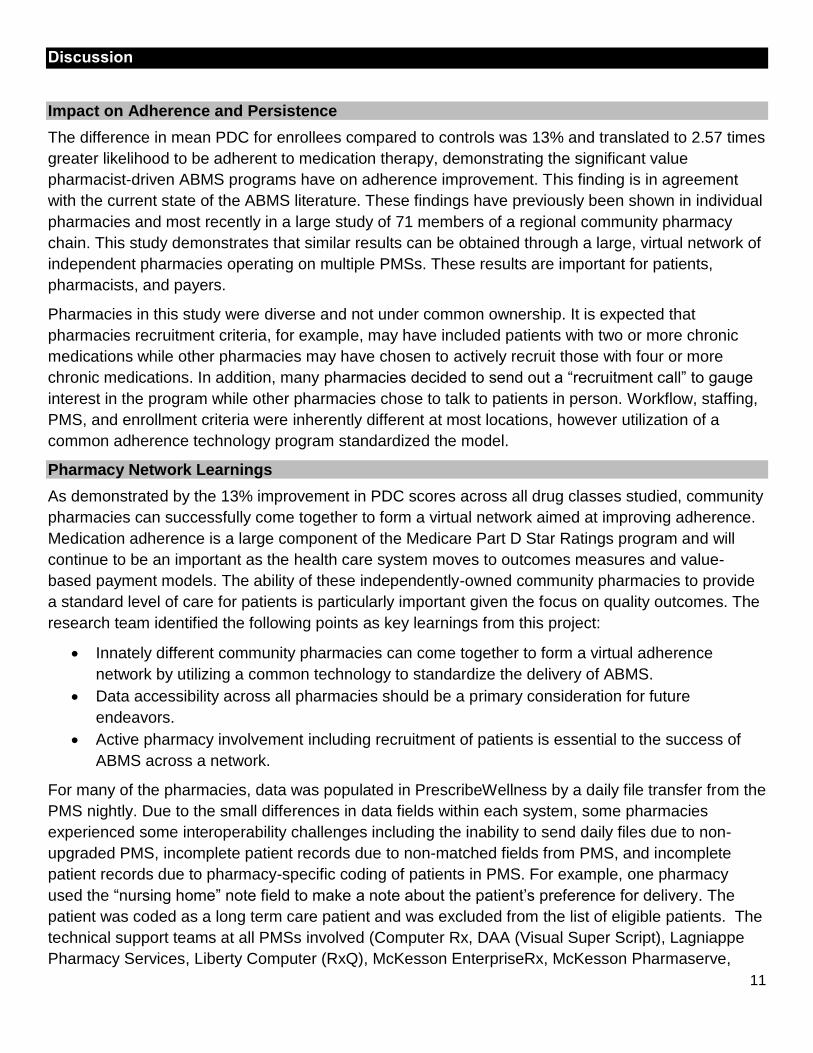
Impact on Adherence and Persistence
The difference in mean PDC for enrollees compared to controls was 13% and translated to 2.57 times
greater likelihood to be adherent to medication therapy, demonstrating the significant value
pharmacist-driven ABMS programs have on adherence improvement. This finding is in agreement
with the current state of the ABMS literature. These findings have previously been shown in individual
pharmacies and most recently in a large study of 71 members of a regional community pharmacy
chain. This study demonstrates that similar results can be obtained through a large, virtual network of
independent pharmacies operating on multiple PMSs. These results are important for patients,
pharmacists, and payers.
Pharmacies in this study were diverse and not under common ownership. It is expected that
pharmacies recruitment criteria, for example, may have included patients with two or more chronic
medications while other pharmacies may have chosen to actively recruit those with four or more
chronic medications. In addition, many pharmacies decided to send out a “recruitment call” to gauge
interest in the program while other pharmacies chose to talk to patients in person. Workflow, staffing,
PMS, and enrollment criteria were inherently different at most locations, however utilization of a
common adherence technology program standardized the model.
Pharmacy Network Learnings
As demonstrated by the 13% improvement in PDC scores across all drug classes studied, community
pharmacies can successfully come together to form a virtual network aimed at improving adherence.
Medication adherence is a large component of the Medicare Part D Star Ratings program and will
continue to be an important as the health care system moves to outcomes measures and value-
based payment models. The ability of these independently-owned community pharmacies to provide
a standard level of care for patients is particularly important given the focus on quality outcomes. The
research team identified the following points as key learnings from this project:
Innately different community pharmacies can come together to form a virtual adherence
network by utilizing a common technology to standardize the delivery of ABMS.
Data accessibility across all pharmacies should be a primary consideration for future
endeavors.
Active pharmacy involvement including recruitment of patients is essential to the success of
ABMS across a network.
For many of the pharmacies, data was populated in PrescribeWellness by a daily file transfer from the
PMS nightly. Due to the small differences in data fields within each system, some pharmacies
experienced some interoperability challenges including the inability to send daily files due to non-
upgraded PMS, incomplete patient records due to non-matched fields from PMS, and incomplete
patient records due to pharmacy-specific coding of patients in PMS. For example, one pharmacy
used the “nursing home” note field to make a note about the patient’s preference for delivery. The
patient was coded as a long term care patient and was excluded from the list of eligible patients. The
technical support teams at all PMSs involved (Computer Rx, DAA (Visual Super Script), Lagniappe
Pharmacy Services, Liberty Computer (RxQ), McKesson EnterpriseRx, McKesson Pharmaserve,
12
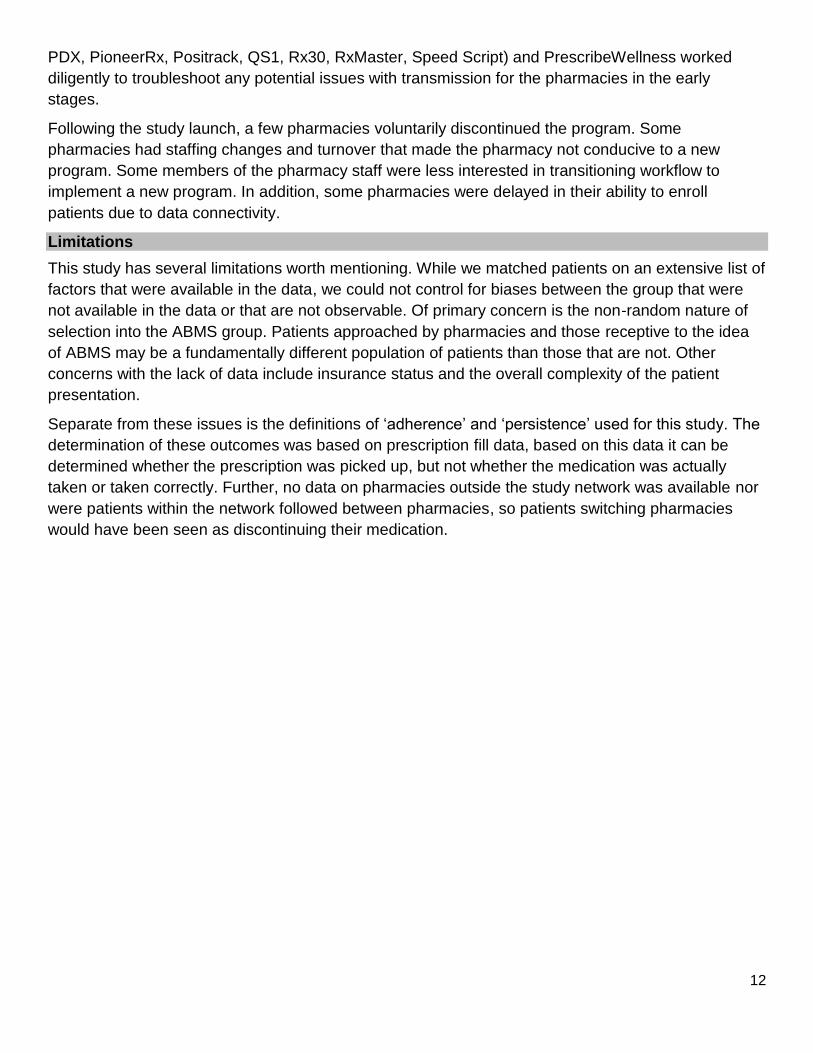
PDX, PioneerRx, Positrack, QS1, Rx30, RxMaster, Speed Script) and PrescribeWellness worked
diligently to troubleshoot any potential issues with transmission for the pharmacies in the early
stages.
Following the study launch, a few pharmacies voluntarily discontinued the program. Some
pharmacies had staffing changes and turnover that made the pharmacy not conducive to a new
program. Some members of the pharmacy staff were less interested in transitioning workflow to
implement a new program. In addition, some pharmacies were delayed in their ability to enroll
patients due to data connectivity.
Limitations
This study has several limitations worth mentioning. While we matched patients on an extensive list of
factors that were available in the data, we could not control for biases between the group that were
not available in the data or that are not observable. Of primary concern is the non-random nature of
selection into the ABMS group. Patients approached by pharmacies and those receptive to the idea
of ABMS may be a fundamentally different population of patients than those that are not. Other
concerns with the lack of data include insurance status and the overall complexity of the patient
presentation.
Separate from these issues is the definitions of ‘adherence’ and ‘persistence’ used for this study. The
determination of these outcomes was based on prescription fill data, based on this data it can be
determined whether the prescription was picked up, but not whether the medication was actually
taken or taken correctly. Further, no data on pharmacies outside the study network was available nor
were patients within the network followed between pharmacies, so patients switching pharmacies
would have been seen as discontinuing their medication.
13
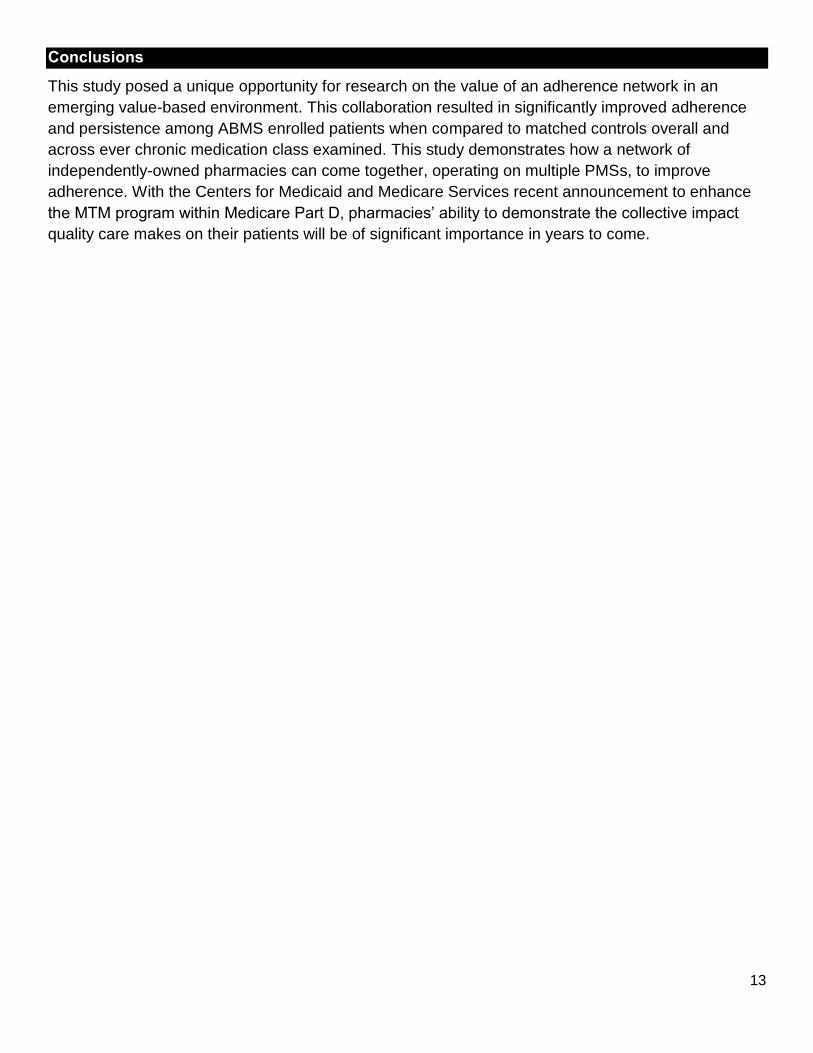
Conclusions
This study posed a unique opportunity for research on the value of an adherence network in an
emerging value-based environment. This collaboration resulted in significantly improved adherence
and persistence among ABMS enrolled patients when compared to matched controls overall and
across ever chronic medication class examined. This study demonstrates how a network of
independently-owned pharmacies can come together, operating on multiple PMSs, to improve
adherence. With the Centers for Medicaid and Medicare Services recent announcement to enhance
the MTM program within Medicare Part D, pharmacies’ ability to demonstrate the collective impact
quality care makes on their patients will be of significant importance in years to come.

14
References
1. Brown MT, Bussell JK. Medication adherence: WHO cares? Paper presented at: Mayo Clinic Proceedings2011.
2. Gerteis J, Izrael D, Deitz D, et al. Multiple Chronic Conditions Chartbook. AHRQ Publications No, Q14-0038. Rockville, MD: Agency for Healthcare Research and Quality. 2014.
3. National Community Pharmacists Association. Medication Adherence in America: A National Report Card http://www.ncpa.co/adherence/AdherenceReportCard_Full.pdf. Accessed October 6, 2015.
4. Viswanathan M, Golin CE, Jones CD, et al. Interventions to improve adherence to self-administered medications for chronic diseases in the United States: a systematic review. Annals of internal medicine. 2012;157(11):785-795.
5. APhA Foundation. Pharmacy's Appointment Based Model: A Prescription Synchronization Program that Improves Adherence. APhA Foundation White Paper 2013; http://www.aphafoundation.org/sites/default/files/ckeditor/files/ABMWhitePaper-FINAL-20130923(3).pdf.
6. Holdford D, Inocencio T. Appointment-Based Model (ABM) Data Analysis Report. Prepared for Thrifty White Pharmacy. Virginia Commonwealth University.
7. Holdford D. Simplify My Meds Appointment-Based Medication Synchronization Pilot Study Report. Prepared for National Community Pharmacists Association. http://www.ncpa.co/pdf/ncpa-abms-report.pdf.
8. Holdford DA, Saxena K. Impact of appointment-based Medication Synchronization on existing users of Chronic Medications. Value in Health. 2015;18(3):A260.
9. Szumilas M. Explaining odds ratios. Journal of the Canadian Academy of Child and Adolescent Psychiatry. 2010;19(3):227.
10. Spruance SL, Reid JE, Grace M, Samore M. Hazard ratio in clinical trials. Antimicrob Agents Chemother. 2004;48(8):2787-2792.
15
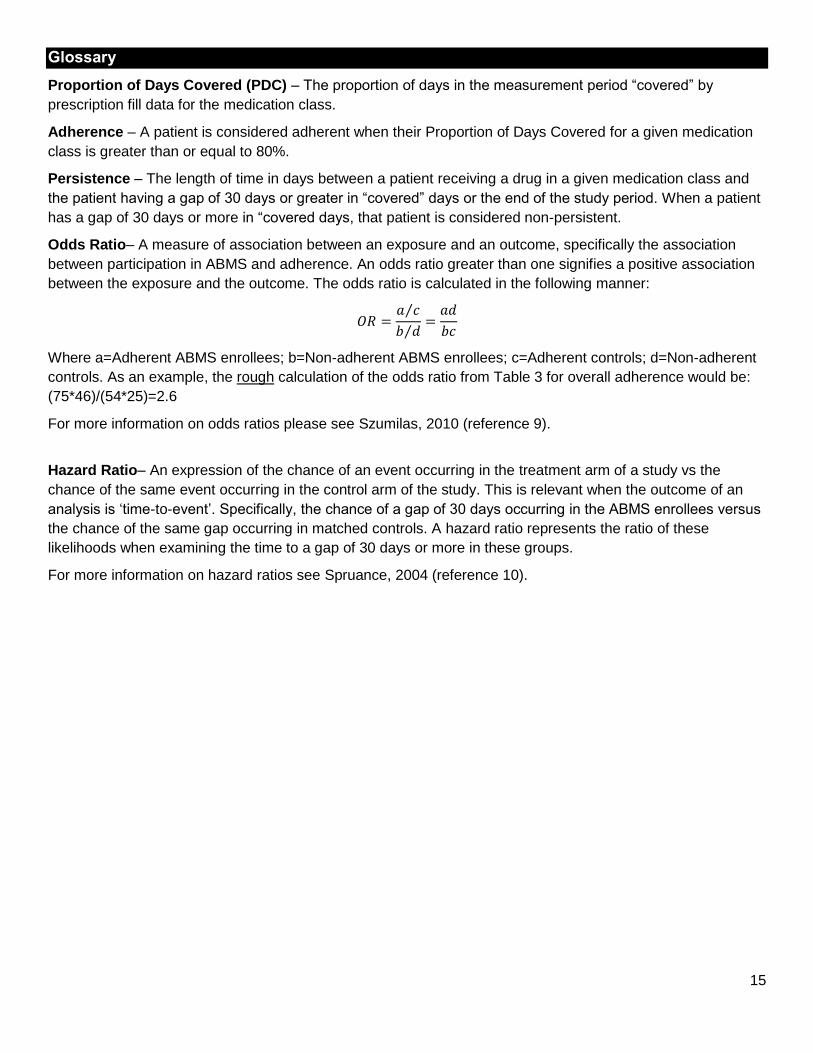
Glossary
Proportion of Days Covered (PDC) – The proportion of days in the measurement period “covered” by
prescription fill data for the medication class.
Adherence – A patient is considered adherent when their Proportion of Days Covered for a given medication
class is greater than or equal to 80%.
Persistence – The length of time in days between a patient receiving a drug in a given medication class and
the patient having a gap of 30 days or greater in “covered” days or the end of the study period. When a patient
has a gap of 30 days or more in “covered days, that patient is considered non-persistent.
Odds Ratio– A measure of association between an exposure and an outcome, specifically the association
between participation in ABMS and adherence. An odds ratio greater than one signifies a positive association
between the exposure and the outcome. The odds ratio is calculated in the following manner:
𝑂𝑅 =𝑎 𝑐⁄
𝑏 𝑑⁄=𝑎𝑑
𝑏𝑐
Where a=Adherent ABMS enrollees; b=Non-adherent ABMS enrollees; c=Adherent controls; d=Non-adherent
controls. As an example, the rough calculation of the odds ratio from Table 3 for overall adherence would be:
(75*46)/(54*25)=2.6
For more information on odds ratios please see Szumilas, 2010 (reference 9).
Hazard Ratio– An expression of the chance of an event occurring in the treatment arm of a study vs the
chance of the same event occurring in the control arm of the study. This is relevant when the outcome of an
analysis is ‘time-to-event’. Specifically, the chance of a gap of 30 days occurring in the ABMS enrollees versus
the chance of the same gap occurring in matched controls. A hazard ratio represents the ratio of these
likelihoods when examining the time to a gap of 30 days or more in these groups.
For more information on hazard ratios see Spruance, 2004 (reference 10).