additional supporting information (files uploaded...
TRANSCRIPT

1
Geophysical Research Letters
Supporting Information for
Seasonality of submesoscale flows in the ocean surface boundary layer
Christian E. Buckingham1, Alberto C. Naveira Garabato1, Andrew F. Thompson2, Liam Brannigan3, Ayah Lazar2, David P. Marshall3, A. J. George
Nurser4, Gillian Damerell5, Karen J. Heywood5, Stephen E. Belcher6,7
1--Department of Ocean and Earth Sciences, University of Southampton, UK
2--Department of Environmental Science and Engineering, California Institute of Technology, Pasadena, California
3--Department of Physics, University of Oxford, Oxford, UK
4--National Oceanography Centre - Southampton, UK
5--School of Environmental Sciences, University of East Anglia, Norwich, UK
6--Department of Meteorology, University of Reading, Reading, UK
7-- MetOffice Hadley Centre, Exeter, UK
Contents of this file Figures S1 to S4
Additional Supporting Information (Files uploaded separately)
N/A
Introduction
This supporting information contains a set of figures that describe (S1) eddy kinetic energy in the vicinity of the mooring site, (S2) vertical positions of sensors on inner moorings, (S3) standard errors on main results, (S4) development of the mooring motion model.

2
(a)
(b)
Figure S1. Kinetic energy associated with (a) mean and (b) mesoscale eddy fields in the Northeast Atlantic. Kinetic energies were estimated from surface currents as 0.5*(u2 + v2), where u = −(g/f)∂yφ and v = (g/f)∂xφ are zonal and meridional geostrophic velocities, respectively. In (a), φ denotes mean dynamic topography (MDT) (see AVISO DUACS2014 documentation), while in (b), φ = 𝜼 − 𝜼 denotes sea level anomaly (SLA) recorded by the altimeter.
3
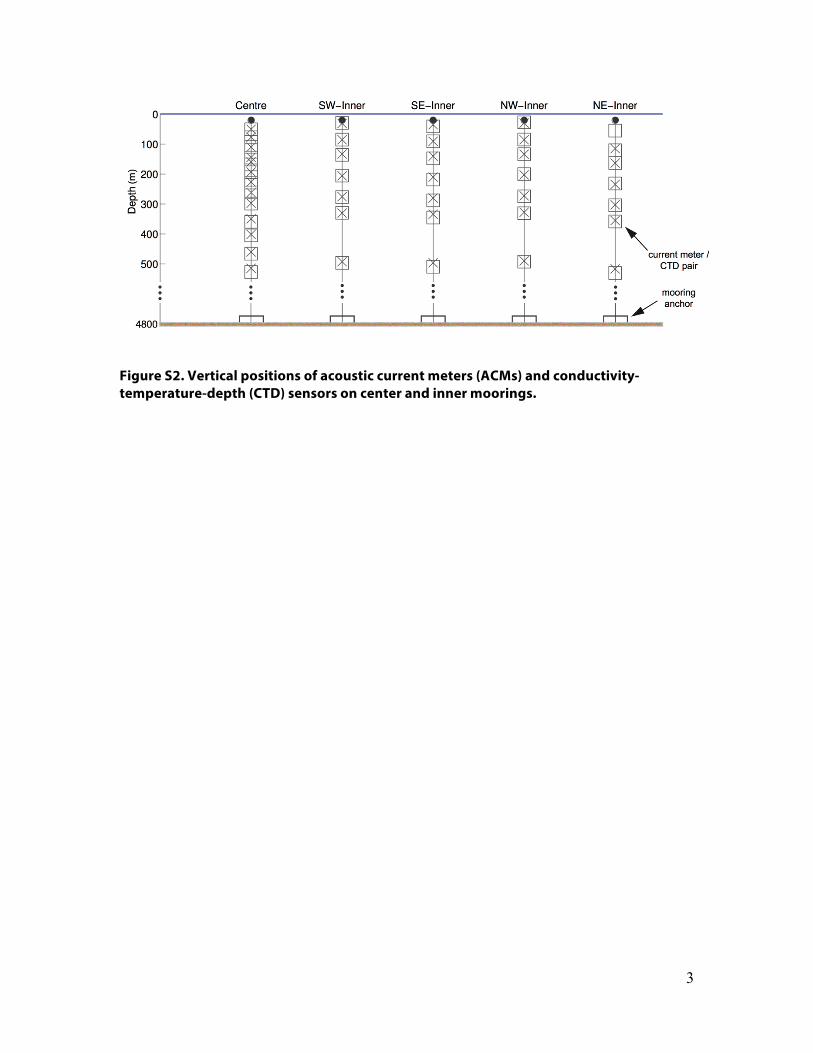
Figure S2. Vertical positions of acoustic current meters (ACMs) and conductivity-temperature-depth (CTD) sensors on center and inner moorings.

4
Figure S3. Confidence intervals for each statistic: (a) stratification, (b) standard deviation of relative vorticity, ζ/f, (c) skewness of ζ/f and (d) mean of the logged-gradient Richardson number, log10(Ri). Confidence intervals correspond to standard errors on each statistic, and note that the standard error of sample skewness is
. The effective sample number, n, was estimated by dividing the total observation time of each depth-season bin by a decorrelation time scale, td = 3 days. We only display statistics for sample numbers n > 15. In panels (a) and (d), we depict estimates made by ocean gliders (dashed). The gradient Richardson number is biased since gliders resolve only the along-track buoyancy gradient.
withinOSBL
belowOSBL
Mean[N/f ] Skewness[ζ/f ]Std[ζ/f ] Mean[log10 Ri]
|z|/h
(a) (b) (c) (d)
std.err.

5
Figure S4. Magnitude-squared coherence, |γ|2, and (b) phase, θ, of u and v near 80-m depth as determined from center and inner moorings (September 2012 – September 2013). Periods corresponding to diurnal (K1) tides, semidiurnal (M2) tides and inertial oscillations at this latitude (Ti = 2π/f) are highlighted. Other periods are shown for reference. (c) Mooring motion amplitudes, σx and σy, obtained from the time-integration of horizontal currents. In all cases (a)-(c), gray lines depict estimates measured between individual mooring pairs while blue and red lines depict mean values.
10−1
100
0
0.5
1
Ti
M2K1
2 hr15.9 hr 12.4 hr23.9 hr36 hr 6 hr
|γ|2
Ti
M2K1
2 hr15.9 hr 12.4 hr23.9 hr36 hr 6 hr
Ti
M2K1
2 hr15.9 hr 12.4 hr23.9 hr36 hr 6 hr
Ti
M2K1
2 hr15.9 hr 12.4 hr23.9 hr36 hr 6 hr
10−1
100
−100
0
100
θ(d
eg)
S O N D J F M A M J J A S0
200
400
600
σx,σy(
)uv
σxσy
(a)
(b)
(c)
Frequency (cph)
Frequency (cph)