additional α= global stock picking combined with long ... · this is a good environment for active...
TRANSCRIPT

FAST – Global Strategy
Additional α = Global
Stock Picking combined with Long/Short Extension
April 2014
Dmitry SolomakhinPortfolio Manager

Global Market – Observations
2
� We are 4 years into an equity bull market
� The last 2 years have seen a significant re-rating of equities without commensurate earnings growth
� Uncertainty remains:
– Structural imbalances
– QE, tapering
– Inflation
� Emerging versus Developed Market return spreads are at odds with the long term structural trends
� This is a good environment for active management but with a focus on stock selection
Source: FIL Limited.

Dmitry SolomakhinPortfolio Manager - FAST Global
3
Funds under management
FAST Global* Jan 2012 – Present**
Experience at Fidelity
Fidelity Global Technology Fund Nov 2008 – Oct 2013
Portfolio Manager Assistant, Global Equities Jan 2008 – Nov 2008
Research Analyst (European Aerospace & Defence; Airlines and Logistics) 2006 – 2008
Previous experience
IT Project Manager, Gillette 2002 – 2004
IT Project Manager, Nestle (Russia/Poland) 1999 – 2001
Dmitry Solomakhin
Portfolio Manager
Based in: London
Years of investment
experience: 8
Education:
MBA (Hons), INSEAD,
France
MSc (Hons), Applied
Mathematics & Computer
Sciences, Moscow State
University, Russia
Source: FIL Limited as at 28 February 2014. *Fund was not available for purchase by clients until Sept 2013, when it was launched officially. **The representative track record for FAST Global began in January 2012 when it was run as an internal/pilot fund. Proof of concept phase from March 2011 to January 2012.

Global Equity Team
Source: FIL Limited, 31 December 2013. The number of Portfolio Manager resources includes those with dual coverage which may be double counted under other regions listed in this graphic. **The number of Equity Research resources responsible for Emerging Markets coverage includes analysts with dual research coverage which are also counted under the other regions listed in this graphic.
31 Portfolio Managers
42 Equity Research
Europe
25 Portfolio Managers
52 Equity Research
Asia
5 Portfolio Managers
17 Equity Research
United States
5 Portfolio Managers
53 Equity Research**
Emerging Markets Japan
9 Portfolio Managers
25 Equity Research
Amit Lodha
Focus/Real Assets
Global
Portfolio Managers
Sudipto Banerji
Opportunities
Jeremy Podger
Special Situations
Dmitry SolomakhinFAST Global
Dan Roberts
Income
7 Portfolio Managers
Global Sector/Thematic
5 Derivative Specialists
Advise and monitor use of
derivative instruments
Derivatives Team
Technical strategists,
portfolio trading
and monitoring
Traders / PSG / QuantShorting Analysts
5 Shorting Analysts
Find and analyse
shorting opportunities
4

FAST – Global Strategy
5
Source: FIL Limited.
� Active long and short extensions to maximise risk adjusted returns
� Unconstrained and benchmark unaware global equity fund
� Long term investment horizon, but with dynamic stock position management
� Fundamental bottom up stock selection drives high conviction, concentrated positions:
– Typically 60 - 110 stocks in total
– Long position sizes 1.0% - 5.0%
– Short position sizes 0.5% - 2.0%
� No exposure to illiquid or binary outcome stocks
Long positions – what I look for
6
Source: FIL Limited.
Where normalised earnings are much higher than current earningsRecovery
Beat the Fade Where the long term earnings power of the franchise is not appreciated by the market
Special Situations Where the market is using an inappropriate fundamental approach to analyse the stock

Short positions – looking for absolute downside
7
Source: FIL Limited.
� Broken business models (usually in an
industry undergoing structural change)
� Weak balance sheet, poor management &
questionable track record
Structural shorts (~ 2/3 of the positions)
Common considerations
� Ownership structure
� Takeout probability
� Sentiment, technical indicators,
short interest and borrow cost
� Shorter term in nature
� Specific catalyst
Tactical shorts (~ 1/3 of the positions)

Idea generation & validation
8
Source: FIL Limited.
� Fidelity Research
� Global Sector PMs
� Meetings, conferences, trips
Idea Generation - both Long and Short
Investment Universe
c5,000 listed stocks worldwide
Portfolio construction
� Internal research
� Financial statements & annual reports
� Sell side and technical research
� Hypothesis challenges iteration
� Downside risk + stress test
Idea Validation - both Long and Short
Long / Short BookLong Book

Long position – Recovery
9
CME Group
� Great quality franchise with very high
barriers to entry.
� Strong management team with very
shareholder friendly approach.
� Earnings currently depressed by a
variety of factors.
� Several important catalysts over the
next two years.
� Core position in the fund.
Price
Bought SoldStock/CFD:
Source: Datastream/FIL Limited, 18 February 2014.*Reduced on portfolio construction considerations
Performance shown might represent trade initially deployed in the FAST Global Pilot. For illustration purposes only. Pilots are funded entirely by Fidelity and are not available for client investment.
40
45
50
55
60
65
70
75
80
85
90
Mrz
20
11
Apr
20
11
Ma
i 2
011
Jun 2
01
1Jul 201
1A
ug 2
011
Sep 2
011
Okt 20
11
No
v 2
011
De
z 2
011
Jan 2
01
2F
eb
201
2M
rz 2
012
Apr
20
12
Ma
i 2
012
Jun 2
01
2Jul 201
2A
ug 2
012
Sep 2
012
Okt 20
12
No
v 2
012
De
z 2
012
Jan 2
01
3F
eb
201
3M
rz 2
013
Apr
20
13
Ma
i 2
013
Jun 2
01
3Jul 201
3A
ug 2
013
Sep 2
013
Okt 20
13
No
v 2
013
De
z 2
013
Jan 2
01
4F
eb
201
4
Price (
US
D)
CME Group
*
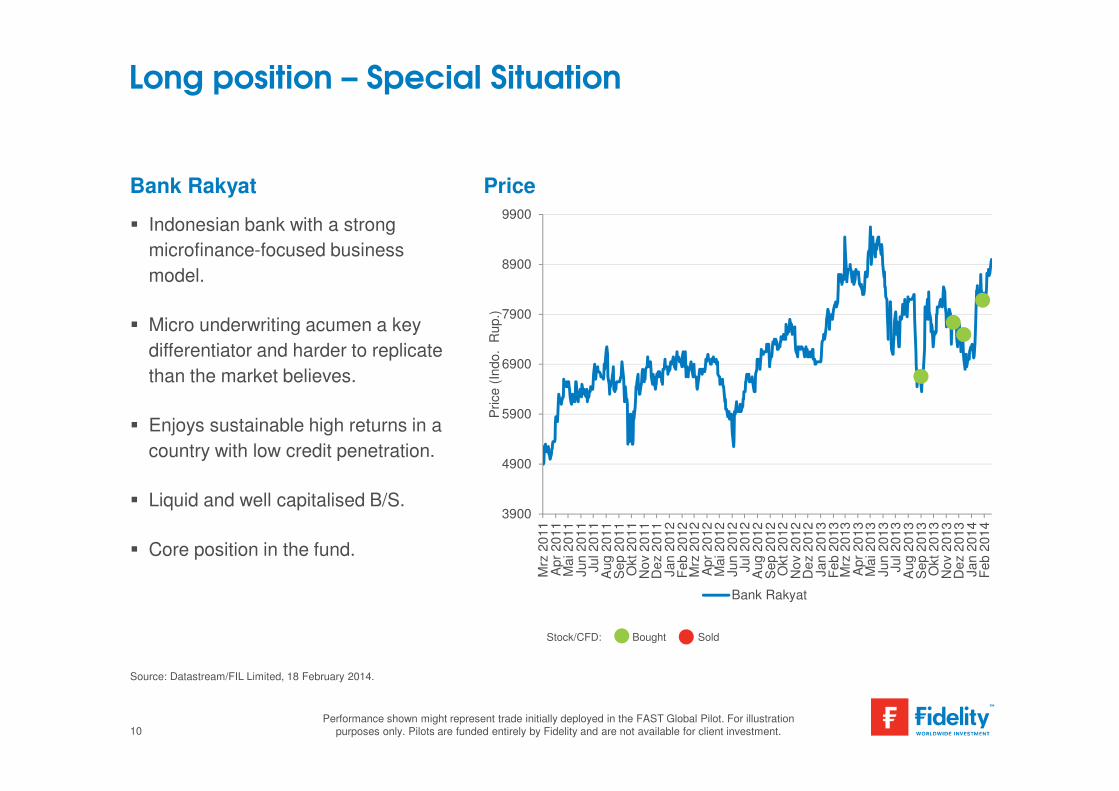
Long position – Special Situation
10
Bank Rakyat Price
� Indonesian bank with a strong
microfinance-focused business
model.
� Micro underwriting acumen a key
differentiator and harder to replicate
than the market believes.
� Enjoys sustainable high returns in a
country with low credit penetration.
� Liquid and well capitalised B/S.
� Core position in the fund.
Performance shown might represent trade initially deployed in the FAST Global Pilot. For illustration purposes only. Pilots are funded entirely by Fidelity and are not available for client investment.
Source: Datastream/FIL Limited, 18 February 2014.
Bought SoldStock/CFD:
3900
4900
5900
6900
7900
8900
9900
Mrz
20
11
Apr
20
11
Ma
i 2
011
Jun 2
01
1Jul 201
1A
ug 2
011
Sep 2
011
Okt 20
11
No
v 2
011
De
z 2
011
Jan 2
01
2F
eb
201
2M
rz 2
012
Apr
20
12
Ma
i 2
012
Jun 2
01
2Jul 201
2A
ug 2
012
Sep 2
012
Okt 20
12
No
v 2
012
De
z 2
012
Jan 2
01
3F
eb
201
3M
rz 2
013
Apr
20
13
Ma
i 2
013
Jun 2
01
3Jul 201
3A
ug 2
013
Sep 2
013
Okt 20
13
No
v 2
013
De
z 2
013
Jan 2
01
4F
eb
201
4
Price (
Indo.
Rup.)
Bank Rakyat

Bank Rakyat – Macro forces matter
11
Exchange Rate Price to Book Relative
Source: Datastream, 28 February 2014. Source: Bloomberg, Datastream 28 February 2014. End month data used.
0
2000
4000
6000
8000
10000
12000
14000
16000
18000
Feb
94
Feb
96
Feb
98
Feb
00
Feb
02
Feb
04
Feb
06
Feb
08
Feb
10
Feb
12
Feb
14
Exchange R
ate
Indo. Rupiah to US Dollar
0,4
0,6
0,8
1,0
1,2
1,4
1,6
1,8
2,0
2,2
2,4
2,6
Mrz
04
Okt 04
Ma
i 0
5
De
z 0
5
Jul 06
Feb
07
Sep 0
7
Apr
08
No
v 0
8
Jun 0
9
Jan 1
0
Aug 1
0
Mrz
11
Okt 11
Ma
i 1
2
De
z 1
2
Jul 13
Feb
14
Price t
o B
ook
Bank Rakyat rel to MSCI AC World Index

Long Position – Special Situation
12
Serco Group Price
Source: Datastream/FIL Limited, 18 February 2014.
� Leading outsourcing firm under
pressure from ongoing government
investigations.
� Solid underlying business with high
earnings visibility, margin expansion
via improving mix and M&A .
� ROIC in excess of 15%.
� Compelling valuations; stock
expected to re-rate once overhang
dissipates.
Bought SoldStock/CFD:
Performance shown might represent trade deployed in the FAST Global Pilot. For illustration purposes only. Pilots are funded entirely by Fidelity and are not available for client investment.
350
400
450
500
550
600
650
700
Mrz
20
11
Apr
20
11
Ma
i 2
011
Jun 2
01
1Jul 201
1A
ug 2
011
Sep 2
011
Okt 20
11
No
v 2
011
De
z 2
011
Jan 2
01
2F
eb
201
2M
rz 2
012
Apr
20
12
Ma
i 2
012
Jun 2
01
2Jul 201
2A
ug 2
012
Sep 2
012
Okt 20
12
No
v 2
012
De
z 2
012
Jan 2
01
3F
eb
201
3M
rz 2
013
Apr
20
13
Ma
i 2
013
Jun 2
01
3Jul 201
3A
ug 2
013
Sep 2
013
Okt 20
13
No
v 2
013
De
z 2
013
Jan 2
01
4F
eb
201
4
Price (
GB
P)
Serco Group
4
6
8
10
12
14
16
18
De
z 2
011
Jan 2
01
2
Feb
201
2
Mrz
20
12
Apr
20
12
Ma
i 2
012
Jun 2
01
2
Jul 201
2
Aug 2
012
Sep 2
012
Okt 20
12
No
v 2
012
De
z 2
012
Jan 2
01
3
Feb
201
3
Mrz
20
13
Apr
20
13
Ma
i 2
013
Jun 2
01
3
Jul 201
3
Aug 2
013
Sep 2
013
Okt 20
13
No
v 2
013
De
z 2
013
Jan 2
01
4
Price (
US
D)
BlackBerry
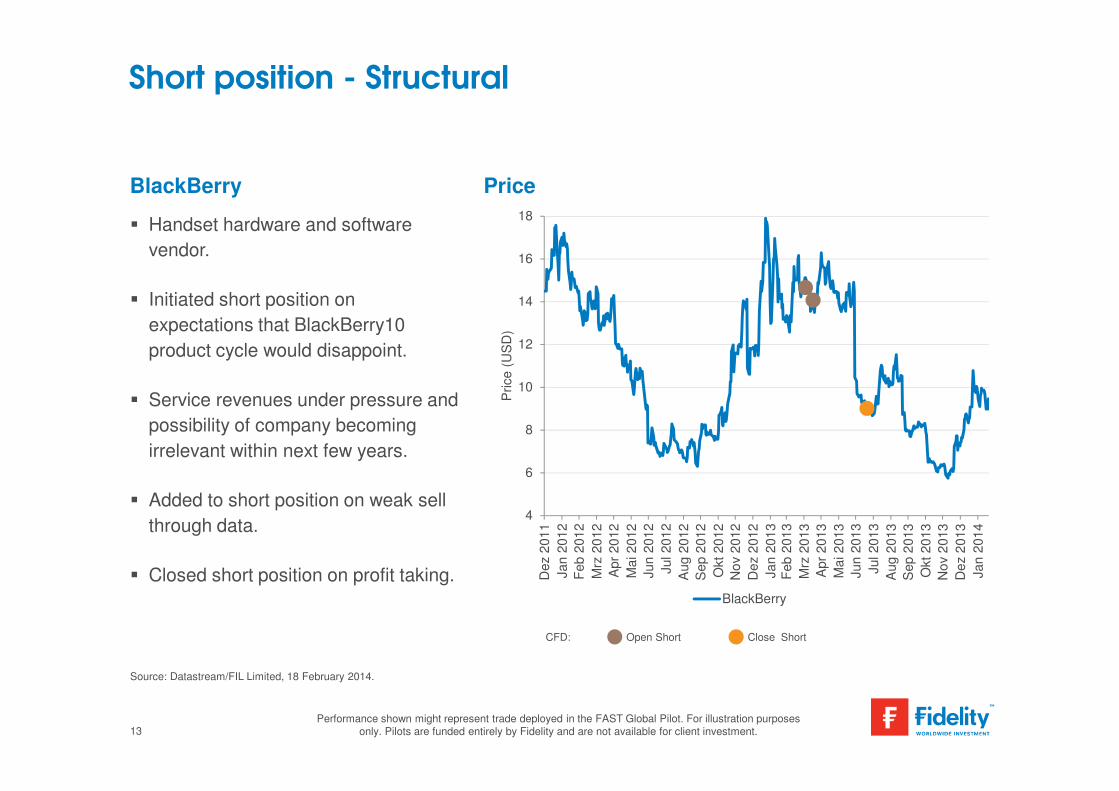
Short position - Structural
13
BlackBerry Price
Source: Datastream/FIL Limited, 18 February 2014.
� Handset hardware and software
vendor.
� Initiated short position on
expectations that BlackBerry10
product cycle would disappoint.
� Service revenues under pressure and
possibility of company becoming
irrelevant within next few years.
� Added to short position on weak sell
through data.
� Closed short position on profit taking.
Performance shown might represent trade deployed in the FAST Global Pilot. For illustration purposes only. Pilots are funded entirely by Fidelity and are not available for client investment.
Open Short CFD: Close Short

Risk management
14
� Statistical risk analysis including factor
exposures of the total fund and each underlying
‘book’
� ‘Real’ risks at the portfolio level
Source: FIL Limited, 28 February 2014. Comparative index = MSCI AC World. Data includes any derivative exposures as an economically equivalent position in the underlying asset.
Stock level risk
Portfolio level risk
� Statistical risk analysis
� ‘Real’ risks at the stock level
� Additional risk control for short positions
– dynamic positioning & stop loss discipline
Portfolio level risk (Barra)
80%
6%
6%
5%2%
0%
Stock Country Industry
Risk Index Currency World Equity

-30
-10
10
30
50
70
90
110
130
150
170Jan 1
2
Feb
12
Mrz
12
Apr
12
Ma
i 1
2
Jun 1
2
Jul 12
Aug 1
2
Sep 1
2
Okt 12
No
v 1
2
De
z 1
2
Jan 1
3
Feb
13
Mrz
13
Apr
13
Ma
i 1
3
Jun 1
3
Jul 13
Aug 1
3
Sep 1
3
Okt 13
No
v 1
3
De
z 1
3
Jan 1
4
Feb
14
% T
NA
Long Short Gross Net
Exposure – total equity level - life of FAST Global
15
Current positioning* % TNA
Long positions
(46 stocks)
116.7
Short positions
(24 stocks)
-18.5
Net equity exposure 98.2
Gross equity exposure 135.1
%
Active money 112.8
Ex-ante tracking error 3.8
Source: FIL Limited, 28 February 2014. *After the aggregation of all investments, including derivatives on an exposure basis, linked to a particular issuing company or basket security (e.g. index futures and options). The aggregate holding is referred to as a position. Chart data shows the net equity exposure of the FAST Global Pilot from January 2012 to September 2013 and the live fund thereafter.
Pilot Fund

Source: FIL Limited, Morningstar Direct, nav-nav, gross income reinvested, in USD, 31 December 2011 to 28 February 2014 vs Morningstar Offshore Global Large-Cap Blend Equity category. While the FAST
Global pilot launched in March 2011, the representative track record commences following a proof of concept phase. The FAST Global Composite reflects composited performance data constructed from the
FAST Global pilot from 31 December 2011 to 30 September 2013, and thereafter the A-ACC-USD class of the live FAST Global Fund. While no fees were applied to the FAST Global pilot, its performance has
been adjusted to reflect the 206bps predicted Ongoing Charges Figure of the A-ACC-USD class of the live fund, plus has also been adjusted for an estimation of performance fee had the live fund methodology
been applied to the pilot. Live fund performance may differ from this pilot performance based on the impact of actual expenses associated with live fund administration, transaction costs, shareholder inflows
and outflows, and performance fees. Pilots are funded entirely by Fidelity and are not available for client investment. All trading for pilots is transacted via Fidelity’s centralised dealing desk, in the same way as
a live fund. However, in the absence of sufficient liquidity, all client orders must be completed in full before a pilot receives any allocation. Pilots may also not trade with client accounts. Past performance is not
a reliable indicator of future results. Numbers may not sum due to rounding. *Risk measures based on time periods less than 3 years are not statistically significant.
FAST Global – Performance vs. comparative index & peers
16
Risk/return vs comparative index and peer groupCumulative net outperformance: +14.5%Annualised net outperformance: +5.4%
89% of peers beaten on IR at 1.03*95% of peers beaten on performance
-20
0
20
40
60
80
100
120
0 5 10 15 20 25 30
Cu
mu
lative
re
turn
(%
)Annualised volatility (m) (%)
MSCI ACWIFAST Global Composite
Sector Average
+58.0%
+43.5%
90
100
110
120
130
140
150
160
170
Dez 11 Jun 12 Dez 12 Jun 13 Dez 13
FAST Global Composite MSCI AC World (N)
Pilot Fund

Attribution vs. comparative index
17
Source: FIL Limited, 28 February 2014. Data represents FAST Global Pilot from 1 January 2012 – 30 September 2013, and the live FAST Global Fund from 02 October 2013.Comparative Index is MSCI AC World (N). Data includes any derivative exposures as an economically equivalent position in the underlying asset. The pilot attribution data includes an estimation of the effect of fund fees, but live fund performance may differ from this pilot performance based on the impact of actual expenses associated with live fund administration, transaction costs, shareholder inflows and outflows, performance fees and taxation. The fund attribution analysis is based on the overall portfolio’s holdings and may therefore differ from individual share class returns.
Delta adjusted average relative weights (%) Relative contribution (bps)
Strategy Pilot Fund Pilot Fund
Total Primary Assets (Incl Cash) 0.0 0.0 2601 -237
- Long Book -4.6 -2.5 2353 -244
- Long / Short Book -0.9 -0.1 516 21
- of which Short only -19.1 -22.2 122 57
Cash + FX (Incl Hedging) 5.5 2.6 -269 -14
Fund Fees 0.0 0.0 -760 -94
Other Expenses / Adjustments 0.0 0.0 5 -12
0.0 0.0 1845 -343

Fund Positioning
18
Source: FIL Limited, 28 February 2014
� Incrementally increasing Emerging Market exposure at the expense of the US
– Not a macro call but driven by bottom-up stock selection
– Emerging market-listed companies e.g. Bank Rakyat, and developed market-listed companies e.g.
Volkswagen, Diageo
– Select large capitalization banks e.g. UBS, Credit Suisse, Citi
– Telecommunications equipment companies e.g. Cisco Systems, Ericsson, Altera
– Biotechnology companies e.g. Amgen, Abbvie
� Stock-specific ‘special situations’
� Remain negative on US telecommunication operators, mining CAPEX and extremely overvalued
technology companies

19
Q & A

Important notes
ATTENTION: If this fund is not registered in your jurisdiction, the distribution of this document and the offering of Shares may be restricted. Accordingly, it is only directed at andissued to specially selected persons such as qualifying investment professionals to whom it may be lawfully promoted. This document does not constitute an offer or solicitation toany person in any jurisdiction in which to make such an offer or solicitation may be unlawful and should not be relied upon by persons who do not have professional experience ofparticipating in such offers. This document is for Professional Investors only and should not be relied upon by private investors. This document is intended only for the person orentity to which it is provided. It must not be reproduced or circulated without prior permission. Distribution or reproduction of this document, in whole or in part, or the divulgence ofany of its content, is strictly prohibited. This document is protected by copyright and may not be photocopied, amended or reproduced in any manner without Fidelity WorldwideInvestment's written permission. Fidelity Active STrategy (‘FAST’ or the ‘Fund’) is an open-ended investment company (SICAV) established in Luxembourg with different classes ofshares. The Fund is registered under Part I of the Luxembourg Law of 17 December 2010 relating to undertakings for collective investment, as amended (the “Law of 2010”). TheFund therefore qualifies as an undertaking for collective investment in transferable securities (‘UCITS’) and has obtained recognition under the Directive 2009/65/EC. Investmentsshould be made on the basis of the current Key Investor Information Document (KIID) and prospectus, which are available along with any current annual and semi-annual reportsfree of charge from our European Service Centre in Luxembourg or from the offices of FIL as outlined below. Any investment activity described or referred to in this document isavailable only to qualifying investment professionals and will be engaged in only with qualifying investment professionals. Fidelity Worldwide Investment only gives information aboutits own products and services and does not provide investment advice based on individual circumstances. Any reference to specific securities is included for the purposes ofillustration only and should not be construed as a recommendation to buy or sell the same. Investors should also note that the views expressed may no longer be current and mayhave already been acted upon by Fidelity Worldwide Investment. Unless otherwise stated, all views are those of Fidelity Worldwide Investment. Past performance is not a reliableindicator of future returns. The value of investments can go down as well as up and investors may not get back the amount invested. Investments denominated in a currency otherthan the investor’s own currency will be subject to movements in foreign exchange rates. Foreign exchange transactions may be effected on an arm’s length basis by or throughFidelity Worldwide Investment companies from which a benefit may be derived by such companies. Investments in small and emerging markets can be more volatile than other moredeveloped markets. Due to the lack of liquidity in many smaller stock markets, certain funds may be volatile and redemption rights may be restricted in extreme circumstances. Incertain countries, and for certain types of investments, transaction costs are higher and liquidity is lower than elsewhere. For funds specializing in such countries and investmenttypes, transactions, particularly those large in size, are likely to have a greater impact on the costs of running a fund than similar transactions in larger funds. Performance of bonds isaffected by changes in interest rates and the issue of new bonds. If interest rates rise, bond prices fall and vice versa. Bonds are also subject to credit risk and default, and aninvestment in corporate bonds is generally less secure than an investment in Government bonds. Prospective investors should bear this in mind in selecting funds. In addition,investment in the fund may involve greater risk as a result of the fund’s use of derivatives, such as futures, forwards, swaps and options. Examples of the investment techniques forwhich the fund may use derivatives (though not exhaustive) include establishment of synthetic long and short positions, the creation of leverage that increases the fund’s economicexposure beyond the value of its net assets, or for hedging purposes. Whilst Fidelity Worldwide Investment employs a sophisticated risk management process to oversee andmanage derivative exposures within the fund, investors should be aware that the use of derivative instruments may involve risks different from, and, in certain cases, greater than, therisks presented by the securities from which they are derived. Further details of the risks involved in investing in the fund are given in the prospectus and the Key Investor Document(KID), which all investors should read before investing. In the event of systemic shocks to financial markets, liquidity can become severely restricted causing some firms to withdrawfrom the market or, in extreme cases, become insolvent. Such events may have an adverse impact on the fund, particularly where the fund has counterparty exposure to thecompanies involved. Equally, the fund’s ability to utilise synthetic short exposures might from time to time be restricted in certain sectors, securities and/or certain jurisdictions due tolocal regulations. FIL means FIL Limited and its respective subsidiary companies. Fidelity, Fidelity Worldwide Investment, the Fidelity Worldwide Investment logo and F symbol aretrademarks of FIL Limited. No statements or representations made in this document are legally binding on Fidelity Worldwide Investment or the recipient. Any proposal is subject tocontract terms being agreed. Barra. Inc.’s analytics and data (www.barra.com) were used in the preparation of this document. Copyright 2013 BARRA, INC. All rights reserved. Thismaterial is issued by FIL Investments International, FIL (Luxembourg) S.A. and FIL Investment Services GmbH, Postfach 200237, 60606 Frankfurt/Main. FIL InvestmentsInternational is authorised and regulated by the Financial Conduct Authority in the UK (FCA registered number 122170) and FIL (Luxembourg) S.A. is authorised and regulated bythe Commission de Surveilllance du Secteur Financier (CSSF) in Luxembourg. FIL Investments International is a member of the Fidelity Worldwide Investment group of companiesand is incorporated in England and Wales under company number 1448245 with registered address at Oakhill House, 130 Tonbridge Road, Hildenborough, Tonbridge, Kent TN119DZ, United Kingdom.
FCRU0551
20

Country specific notifications
For residents of Austria: We recommend that you obtain detailed information before taking any investment decision. Investments should be made on the basis of the current prospectus/Key Investor Information Document (KIID), which is available along with the current annual and semi-annual reports free of charge from: FIL (Luxembourg), S.A., 2a rue Borchette, 1021 Luxembourg, Luxembourg; at the service point: FIL Investment Services GmbH, Kastanienhöhe 1, D-61476 Kronberg im Taunus, Germany; FIL (Luxembourg) S.A., Zweigniederlassung Wien, Mariahilfer Strasse 36, 1070 Wien or www.fidelity.at as well as with the Austrian paying agent UniCredit Bank Austria AG, Vordere Zollamtstrasse 13, A-1030 Wien.
For residents of Belgium: We recommend that you obtain detailed information before taking any investment decision. Investments should be made on the basis of the current Key Investor Information Document (KIID) and prospectus, including the Addendum for Belgian investors, which are available along with the current annual and semi-annual reports free of charge from our distributors, from FIL (Luxembourg) S.A. and CACEIS België NV, with head office at Havenlaan 86C, B320, 1000 - Brussels, the financial service provider in Belgium.
For residents of Germany: Eine Anlageentscheidung sollte in jedem Fall auf Grundlage der wesentlichen Anlegerinformationen, des Verkaufsprospektes, des letzten Geschäftsberichtes und - sofern nachfolgend veröffentlicht - des jüngsten Halbjahresberichtes getroffen werden. Diese Unterlagen sind die allein verbindliche Grundlage des Kaufes und können kostenlos bei der FIL Investment Services GmbH, Postfach 200237, 60606 Frankfurt/Main oder . Die FIL Investment Services GmbH veröffentlicht ausschließlich produktbezogene Informationen und erteilt keine Anlageempfehlung.
For residents of Spain: For the purposes of distribution in Spain, FAST is registered with the CNMV Register of Foreign Collective Investment Schemes under registration number 649, where complete information is available from the authorised distributors. The purchase of or subscription for shares in FAST shall be made on the basis of the Key Investor Information Document that investors shall receive in advance. The Key Investor Information Document is available free of charge from, and for inspection at, the offices of locally authorised distributors as well as at the CNMV.
For residents of the UK: Fidelity Active STrategy (SICAV) (FAST or the ‘Fund’) is recognised under section 264 of the Financial Services and Markets Act 2000. Investors shouldnote that loss caused by such recognised funds will not be covered by the provisions of the Financial Services Compensation Scheme (or by any similar scheme in Luxembourg) if the Fund is unable to meet its obligations; however, claims for loss in regards to such recognised funds against an FCA authorised firm such as FIL Investments International will be.
For residents of the Netherlands: Investments should be made on the basis of the current Key Investor Information Document (KIID) and prospectus, which are available along with the current annual and semi-annual reports free of charge from our distributors, from FIL (Luxembourg) S.A. in Luxembourg and from FIL (Luxembourg) S.A., Netherlands Branch , World Trade Center, Tower H, 6th Floor, Zuidplein 52, 1077 XV Amsterdam (tel. 0031 20 79 77 100). FAST is authorised to offer participation rights in The Netherlands pursuant to article 2:66 (3) in conjunction with article 2:71 and 2:72 Financial Supervision Act.