addendum for acetone - agency for toxic · some degree of sensory adaptation to inhaled...
TRANSCRIPT

ADDENDUM TO THE TOXICOLOGICAL PROFILE FOR
ACETONE
Agency for Toxic Substances and Disease Registry Division of Toxicology and Environmental Medicine
Atlanta, GA 30333
August 2011
ii ACETONE
CONTENTS
LIST OF TABLES......................................................................................................................... iii Background Statement ................................................................................................................... iv 2. HEALTH EFFECTS.................................................................................................................. 1
2.1 INTRODUCTION............................................................................................................ 1 2.2 DISCUSSION OF HEALTH EFFECTS BY ROUTE OF EXPOSURE ......................... 1
2.2.1 Inhalation Exposure ..................................................................................................... 1 2.2.2 Oral Exposure .............................................................................................................. 3 2.2.3 Dermal Exposure ........................................................................................................ 4 2.3.3 Metabolism .................................................................................................................. 5 2.3.4 Physiologically Based Pharmacokinetic (PBPK)/Pharmacodynamic Models .............. 6 2.3.5 Mechanism of Action ................................................................................................... 7
3. CHEMICAL AND PHYSICAL INFORMATION ................................................................... 9 4. PRODUCTION, IMPORT/EXPORT, USE, AND DISPOSAL................................................ 9 5. POTENTIAL FOR HUMAN EXPOSURE............................................................................... 9
5.3.2 Transformation and Degradation ................................................................................. 9 6. ANALYTICAL METHODS ................................................................................................... 10 No updated data. ........................................................................................................................... 10 7. REGULATIONS AND ADVISORIES ................................................................................... 10 8. REFERENCES ........................................................................................................................ 12

iii ACETONE
LIST OF TABLES
7-1. Regulations and Guidelines Applicable to Acetone ............................................................. 10

iv ACETONE
ADDENDUM FOR ACETONE
Supplement to the 1994 Toxicological Profile for Acetone
Background Statement
This addendum to the Toxicological Profile for Acetone supplements the profile that was released in 1994.
Toxicological profiles are developed in response to the Superfund Amendments and Reauthorization Act (SARA) of 1986 which amended the Comprehensive Environmental Response, Compensation, and Liability Act of 1980 (CERCLA or Superfund). CERCLA mandates that the Administrator of ATSDR prepare toxicological profiles on substances on the CERCLA Priority List of Hazardous Substances and that the profiles be revised “no less often than once every three years.” CERCLA further states that the Administrator will “establish and maintain inventory of literature, research, and studies on the health effects of toxic substances” [Title 42, Chapter 103, Subchapter I, § 9604 (i)(1)(B)].
The purpose of this addendum is to provide to the public and federal, state, and local agencies a non-peer reviewed supplement of the scientific data that were published in the open peer-reviewed literature since the release of the profile in 1994
Chapter numbers in this addendum coincide with the Toxicological Profile for Acetone. This document should be used in conjunction with the profile. It does not replace it.
1 ACETONE
2. HEALTH EFFECTS
2.1 INTRODUCTION
2.2 DISCUSSION OF HEALTH EFFECTS BY ROUTE OF EXPOSURE
2.2.1 Inhalation Exposure
2.2.1.2 Systemic Effects
Respiratory Effects. Some degree of sensory adaptation to inhaled acetone—i.e., the body adapts to
regular exposure to acetone, is apparent. The basis for this observation is the displayed reduced sensitivity
to both odor and irritancy in workers who had also been exposed to acetone in their work. People without
prior occupational exposure to acetone who served as controls in an experiment did not have such sensory
adaptation (Dalton et al. 1997; Wysocki et al. 1997). In the experiment, the workers and the controls had
been exposed to 800 ppm acetone for 20 minutes. The results of the experiment suggest that the general
population may be more sensitive to the acute irritant effects of inhaled acetone than workers with
repeated exposure. A 49-year-old male who had been accidentally sprayed with acetone during roadwork
application developed edema within the bronchial tree (Piatkowski et al. 2007). Increased prevalence of
upper respiratory tract irritation was reported among acetone-exposed workers (n=71) compared with
matched controls (n=86) at a coin-printing factory (Mitran et al. 1997). Eight-hour acetone exposure
levels in the workplace air of the exposed workers ranged from 988 to 2,114 mg/m3 (416 to 890 ppm).
The mean length of exposure was 14 years.
Gastrointestinal Effects. Acetone-exposed workers (n=71) had increased prevalence of
gastrointestinal symptoms (nausea, loss of appetite, hyperacidity, bad taste, abdominal pains) compared to
matched controls (n=86) at a coin-printing factory (Mitran et al. 1997). Eight-hour acetone exposure
levels in the workplace air of the exposed workers ranged from 988 to 2,114 mg/m3 (416 to 890 ppm); the
mean length of exposure was 14 years.
Musculoskeletal Effects. Increased prevalence of rheumatic symptoms (pain in bones, joints,
muscles) was reported among acetone-exposed workers (n=71) compared to matched controls (n=86) at a
coin-printing factory (Mitran et al. 1997). Eight-hour acetone exposure levels in the workplace air of the
2 ACETONE
exposed workers ranged from 988 to 2,114 mg/m3 (416 to 890 ppm); the mean length of exposure was 14
years. A man who was accidentally sprayed with acetone during roadwork application later developed
rhabdomyolosis and acute renal failure (Piatkowski et al. 2007). The investigator attributed the
development of these effects to acute inhalation exposure to acetone.
Renal Effects. Minimal glomerulopathy and moderate tubulointerstitial nephritis were diagnosed in a
55-year-old woman following occupational exposure to a cleansing solution consisting principally of
acetone (Chen et al. 2002). The woman had been using the solution periodically for approximately two
years and had no prior history of renal disease. Acute renal failure was diagnosed in a 49-year-old male
who had been accidentally sprayed with acetone during roadwork application. Because the man had
significant injury to the respiratory tract, inhalation was the suspected major route of exposure Piatkowski
et al. 2007).
Dermal Effects. Increased prevalence of dermal irritation was reported among acetone-exposed
workers (n=71) compared to matched controls (n=86) at a coin-printing factory (Mitran et al. 1997).
Eight-hour acetone exposure levels in the workplace air of the exposed workers ranged from 988 to 2,114
mg/m3 (416 to 890 ppm); the mean length of exposure was 14 years.
Ocular Effects. Increased prevalence of ocular irritation was reported among acetone-exposed workers
(n=71) compared to matched controls (n=86) at a coin-printing factory (Mitran et al. 1997). Eight-hour
acetone exposure levels in the workplace air of the exposed workers ranged from 988 to 2,114 mg/m3
(416 to 890 ppm); the mean length of exposure was 14 years.
2.2.1.4 Neurological Effects
Mitran et al. (1997) reported increased signs of neurotoxicity (mood disorders, irritability, memory
difficulty, sleep disturbances, and headache) among acetone-exposed workers (n=71) compared to
matched controls (n=86) at a coin-printing factory. Eight-hour acetone exposure levels in the workplace
air of the exposed workers ranged from 988 to 2,114 mg/m3 (416 to 890 ppm); the mean length of
exposure was 14 years. Kiesswetter et al. (1994) reported a correlation of acetone urine concentrations
with symptoms of annoyance, tension, tiredness, and discomfort in a group of eight acetone-exposed
workers compared to eight unexposed controls. A correlation of these symptoms was not found with
exposure concentrations (1138 ppm in the first half of work shift, 717 ppm in second half of work shift).
Satoh et al. (1996) reported symptoms of heavy, vague, or faint feelings in the head, along with impaired

ACETONE 3
neurobehavioral responses, in a group of 110 male workers at an acetate fiber manufacturing plant where
acetone was used in the production of cellulose-containing dope. Controls consisted of 67 unexposed
workers at the same facility. Acetone levels at the end of the work shift measured 5–1212 ppm in the
breathing zone (mean of 361.4 ppm).
Exposure of male rats to acetone vapor concentrations as high as 4,000 ppm for 6 hours/day, 5 days/week
for 13 weeks did not cause lasting effects on schedule-controlled operant performance. Operant sessions
were run prior to daily exposures to avoid confounding with transient acute effects (Christoph et al.
2003). Female mice were exposed by inhalation to acetone (4 mL placed on cotton in a glass in the
inhalation chamber) for 5 hours/day, 5 days/week for 4 weeks and assessed for effects on the nasal
olfactory neuroepithelium (Buron et al. 2009). The acetone concentration during each exposure rose
during the first 1.5 hours to a constant level of about 8,000 ppm for the remaining 3.5 hours. Olfactory
sensitivity, assessed by how the mice avoided acetone in a maze, was increased (less time spent in the
acetone compartment of maze) during weeks 2 and 4 of exposure and during weeks 6 and 8 (post
exposure). Histological examination of olfactory neuroepithelium of similarly exposed mice revealed a
significant decrease in the number of cells at week 2, an increase at week 4 that remained at week 6, and a
recovery by week 8. Thickness of the olfactory epithelium remained stable at week 0 and week 2,
decreased at week 4, increased at week 6, and recovered by week 8. Immunological evaluations for
olfactory marker protein (OMP) and proliferating cell nuclear antigen (PCNA) showed no change in
OMP, indicating no damage to olfactory neuroreceptors. However, the number of PCNA-positive cells
was decreased in the basal layer during week 2 and sustained during weeks 4 and 6, indicating an increase
in mitotic activity.
2.2.2 Oral Exposure
2.2.2.2 Systemic Effects
Hematological Effects. Exposure of CD-1 male mice to acetone in the drinking water at average
doses as high as 1,144 mg/kg/day for 28 days resulted in no evidence of exposure-related effects on red or
white blood cell counts, hemoglobin, or hematocrit (Woolhiser et al. 2006).
Hepatic Effects. Rats were assessed for liver oxidative balance and lipid content after treatments with
acetone in water (5% m/v) for 28 days (de Almeida et al. 2010). Compared with controls, acetone-

4 ACETONE
treated rats had increased hepatic GSH, hepatic vitamin E, glycemia, choleserolemia, and hepatic fat,
which is similar to the features of non-alcoholic steatohepatitis (NASH).
Renal Effects. Mild functional renal insufficiency was diagnosed in a 56-year-old woman suspected
of having ingested a large quantity of acetone (Kostusiak et al. 2003).
2.2.2.3 Immunological and Lymphoreticular Effects
Exposure of CD-1 male mice to acetone in the drinking water at average doses as high as 1,144
mg/kg/day for 28 days resulted in no evidence of immunotoxicity, as assessed by the antibody plaque-
forming cell assay performed to measure the T cell-dependent anti-sheep red blood cell immunoglobulin
M response (Woolhiser et al. 2006). Furthermore, there were no treatment-related effects on spleen or
thymus weights or spleen cellularity.
2.2.3 Dermal Exposure
2.2.3.2 Systemic Effects
Dermal/Ocular Effects. Superficial burns to the skin were observed in a 49-year-old male who had
been accidentally sprayed with acetone during roadwork application (Piatkowski et al. 2007).
Mild irritation was observed in the eyes of rabbits that received 10 μL acetone applied directly to the
cornea of the right eye (Maurer et al. 2001). The mean normalized depth of injury was less than 10% in
the corneal and was limited to the epithelium and superficial stroma. The majority of the regions showed
no stromal injury. The injury was first seen after 3 hours, and it persisted for up to 3 days, with complete
recovery at the 35-day determination.
ACETONE 5
2.3 TOXICOKINETICS
2.3.2 Distribution
2.3.2.1 Inhalation Exposure
Rats were exposed by inhalation to 1,000 ppm of acetone for 8 hours/day. Plasma concentrations
of acetone were 122, 107 and 125 µg/ml at 30 minutes after exposure for days 1, 2, and 3,
respectively. Plasma elimination followed first-order kinetics in rats that were terminated after
exposure to 1,000 ppm for 3 hours/day for 3 days. The half-life for elimination was 4.5 hours,
and the area under the curve (AUC) was 950 µg.hr/ml. Inhalation exposure of the rats to 1,000
ppm of acetone for 3 hours/day for 10 days resulted in concentrations of 35.3 µg/g of acetone in
plasma, 13.2 µg/g in liver, 11.4 µg/g in the lung, and 21.8 µg/g in the kidney (Scholl and Iba
1997).
2.3.2.2 Oral Exposure
In rats receiving acetone in drinking water (7.5% v/v) for 11 consecutive days, plasma concentrations of
acetone on day 1 were in the range of 315–800 µg/mL. The plasma concentration appeared to plateau at
about 1,200 µg/mL by day 4 (Scholl and Iba 1997).
2.3.3 Metabolism
Recent investigations that included CYP2E1-null mice have confirmed the importance of CYP2E1 in
acetone catabolism in vivo (Bondoc et al. 1999; Bruckner et al. 2002; Chen et al. 1994). In the study of
Bondoc et al. (1999), acetone levels were measured in non-fasted and 48-hour-fasted wild type and
CYP2E1-null mice. Fasting is known to result in the elevation of acetone levels in the blood. Blood
acetone levels in non-fasted wild type and CYP2E1-null mice were not significantly different from one
another. However, fasted CYP2E1-null mice exhibited 24-fold increased blood acetone levels compared
to their non-fasted controls. The wild type fasted mice, on the other hand, exhibited only a 2- to 4-fold
increase in blood acetone levels compared to their non-fasted controls. Bruckner et al. (2002)
administered acetone to non-fasted rats by gavage at single doses ranging from 50 to 2,000 mg/kg and

ACETONE 6
measured CYP2E1 activity 24 hours later. The investigators observed dose-dependent increases in blood
acetone concentrations and CYP2E1 activity. Chen et al. (1994) assessed the role of CYP2E1 in acetone
catabolism by measuring acetone levels at different time points in rats that had been treated with diallyl
sulfide (DAS, a CYP2E1 inhibitor) at a variety of dose levels. The study noted DAS dose-dependent
increases in the time to peak blood acetone level and in the time to return to pre-dose levels, suggesting an
important role of CYP2E1 in acetone catabolism.
2.3.4 Physiologically Based Pharmacokinetic (PBPK)/Pharmacodynamic Models
PBPK models have been developed to simulate the behavior of acetone in rats and humans exposed by
various routes (Clewell et al. 2001; Gentry et al. 2002; Kumagai and Matsunaga 1995; Mörk and
Johanson 2006).
Clewell and coworkers (Clewell et al. 2001; Gentry et al. 2002) developed a PBPK model intended to
simulate the behavior of isopropanol and its major metabolite, acetone, in rats and humans for
intravenous, intraperitoneal, oral, inhalation, and dermal exposure. The model was specifically intended
to be used for human health risk assessment for isopropanol. The model is capable of simulating
exposures to acetone as well (Gentry et al. 2003). Gentry et al. (2002) expanded the model to simulate
exposure to isopropanol during pregnancy. Validation of acetone metabolism was performed by use of
intravenous, oral, and inhalation exposure data from rats and by use of inhalation and oral exposure data
from humans.
The PBPK model of Kumagai and Matsunaga (1995) was designed to account for uptake of acetone in the
mucous layer of the respiratory tract. By adjusting the value for the volume of the mucous layer and the
rate of respiration, the authors found that the simulated acetone concentrations in arterial blood, end
exhaled air, urine, and fatty tissues were well matched to experimental data.
Mörk and Johanson (2006) designed a PBPK model for acetone to account for differences in the behavior
of acetone in blood and exhaled air at different levels of physical exercise. The model involves deeper
parts of the mucous membrane in absorption and desorption of acetone than the ones used in previous
modeling exercises and includes separate compartments for working and resting muscles. Using the
PBPK model, Mörk and Johanson (2010) derived chemical-specific adjustment factors (CSAFs) for
acetone by Monte Carlo simulations. According to the simulations, CSAFs for occupational exposure
were 1.6, 1.8, and 1.9 for 90th, 95th, and 97.5th percentiles, respectively. The corresponding CSAFs for

ACETONE 7
the general population were 2.1, 2.9, and 3.8. CSAFs for children from 3 months of age to 10 years of
age ranged from 4.2–4.8, 4.7–5.0, and 5.0–5.9 for the 90th, 95th, and 97.5th percentiles.
2.3.5 Mechanism of Action
Results of Orellana et al. (2001) support a hypothesis that ketone bodies such as acetone may be common
inducers of microsomal and peroxisomal fatty acid oxidation. In this study, parameters of oxidative
stress, microsomal CYP activity, and peroxisomal fatty acid oxidation were assessed in the liver of rats
that had received acetone (1% v/v) in the drinking water for 7 days. Compared to the livers of controls,
livers of acetone-exposed rats showed increases in CYP content, microsomal biotransformation activity,
peroxisomal fatty acid oxidation, and catalase activity and decreases in hepatic activity of superoxide
dismutase and glutathione peroxidase without altering glutathione and malondialdehyde content. These
results suggest that ketone bodies such as acetone could be common inducers of microsomal and
peroxisomal fatty acid oxidation. However, the results also suggest that acetone-induced increases in CYP
and peroxisomal fatty acid oxidation are not related to significant changes in hepatic oxidative stress.
Stadler et al. (2008) provide evidence of inducible nitric oxide synthetase (iNOS) mediated free radical
production and protein oxidation in acetone-induced ketosis by using iNOS and NADPH oxidase
knockout mice receiving acetone in a single intragastric dose or in drinking water for 5 days or 3 weeks.
In the acute intragastric experiment, free radical production was unchanged in NADPH oxidase knockout
mice. However, free radical production was greatly decreased in iNOS knockout mice, indicating that
iNOS may play a role in acetone-induced free radical production. Longer-term exposure to acetone via
drinking water resulted in iNOS over-expression and protein radical formation in the liver. Other results
included enhanced lipid peroxidation and protein oxidation after 21 days of acetone treatment in control
and NADPH oxidase knockout mice, but not in iNOS knockout mice. These results together indicate that
acetone administration can result in iNOS over-expression that leads to protein oxidation and lipid
peroxidation via a free radical-dependent mechanism. The authors discuss the implication of high levels
of ketosis with the development of complications in diabetes.
2.4 RELEVANCE TO PUBLIC HEALTH
Genotoxic Effects. Acetone did not increase the number of micronuclei in binucleated human
lymphocytes in vitro (Zarani et al. 1999).

8 ACETONE
2.6 INTERACTIONS WITH OTHER SUBSTANCES
Iba et al. (1993) prepared microsomes from lungs and livers of rats exposed to 20 ppm pyridine by
inhalation for 5–6 hours/day for 10 days, to acetone (7.5%, v/v) in drinking water for 10 days or by
inhalation to 50% aqueous acetone for 5–6 hours/day for 10 days, or to acetone in combination with
pyridine administered separately as above. Controls received water for inhalation and oral exposures. In
the liver microsomes, there was induction of ethoxyresorufin O-deethylase (EROD) activity for oral
acetone by 2.5-fold, for pyridine by inhalation by 2.8-fold, and for the combination of acetone and
pyridine by 7.6-fold, indicating greater-than-additive interaction. The levels of CYP1A1 were induced by
acetone, pyridine, and the combination by 8.3-, 6.6-, and 32.7-fold, respectively. These results indicated
even greater synergistic interaction. Similar greater-than-additive interaction results were also found for
methoxyresorufin O-demethylase (MEROD) and CYP1A2 in the liver microsomes. Microsomal EROD
was induced by all treatments in the lung, and a synergistic interaction was even greater in the lung, with
an increase that was 4-fold for acetone, 21-fold for pyridine, and 115.5-fold for the combination.
CYP1A1 was also induced synergistically by acetone and pyridine in the lung microsomes.
In the 1994 Toxicological Profile for Acetone, studies by Ladefoged and co-workers demonstrated that
acetone potentiated the nerve conduction velocity and neurobehavioral effects of 2,5-hexanedione in rats,
but noted that the mechanism of action of this potentiation was not fully understood. More recently,
Ladefoged et al. (1994) performed similar experiments. This time, they included histological examination
of the sciatic and tibial nerves in rats immediately after the 6-week exposures in rats allowed a 10-week
recovery period. As in previous experiments, acetone potentiated 2,5-hexanedione-induced open field
ambulation and rearing balance in the rotarod tests, and grip strength. The ambulation was reversible
during the recovery period by all treatments, but the effects on rearing and balance were reversible in the
2,5-hexanedione group only. That is, the potentiation by acetone persisted. Histological examination
revealed that after exposure, giant axon swelling was induced by 2,5-hexanedione and the combination of
2,5-hexanedione and acetone, and a change in the distribution of fiber area size occurred in rats exposed
to 2,5-hexanedione. The lesions observed in the co-exposure group were statistically similar to the effects
of 2,5-hexanedione alone, but appeared aggravated by co-exposure, as seen by conventional pathological
evaluation. After the 10-week recovery period, the nerve tissues appeared normal. The investigators
concluded that neurotoxicity of the combined exposure was not reversible and that the mechanism of
acetone potentiation is probably an effect on the toxicokinetics of 2,5-hexanedione.

9 ACETONE
2.7 POPULATIONS THAT ARE UNUSUALLY SUSCEPTIBLE
Groups of obese and lean mice maintained on high-fat diets were given acetone in drinking water (2%)
for 2 weeks to induce CYP2E1 (Dey and Cedebaum 2007). Controls consisted of obese and lean mice
maintained on the same diet as the experimental mice but not given acetone. Acetone induced more
extensive fatty changes, and mild necrosis in the livers of the obese mice compared with the livers of both
control lean and control obese mice. The acetone-treated obese mice also had higher caspase-3 activity,
numerous apoptotic hepatocytes, increased protein carbonyls, malondialdehyde, 4-hydroxynonenal- and
3-nitrotyrosine-protein adducts, and elevated levels of inducible nitric oxide synthase. These results
suggest that obesity contributes to liver toxicity and that the damage is enhanced by exposure to acetone
through its induction of CYP2E1.
3. CHEMICAL AND PHYSICAL INFORMATION
No updated data.
4. PRODUCTION, IMPORT/EXPORT, USE, AND DISPOSAL
No updated data.
5. POTENTIAL FOR HUMAN EXPOSURE
5.3.2 Transformation and Degradation
5.3.2.3 Soil
A gram-negative bacterium (Paracoccus solventivorans) capable of degrading acetone was isolated from
soil at a natural gas company (Siller et al. 1996).

10 ACETONE
6. ANALYTICAL METHODS
No updated data.
7. REGULATIONS AND ADVISORIES
Table 7-1. Regulations and Guidelines Applicable to Acetone
Agency Description Information Reference INTERNATIONAL
Guidelines:
IARC Carcinogenicity classification No IARC 2009
WHO Air quality guidelines No WHO 2000
Drinking water quality guidelines No WHO 2006
NATIONAL
Regulations and Guidelines:
a. Air
ACGIH TLV (8-hour TWA) 500 ppm ACGIH 2008
TLV-basis (critical effect) Upper respiratory tract, eye irritation, central nervous system impairment, hematologic effects
NIOSH REL (10-hour TWA) 250 ppm (590 mg/m3) NIOSH 2005
IDLH (10% LEL) 2500 ppm
Target organs Eyes, skin, respiratory system, central nervous system
OSHA PEL (8-hour TWA) for general industry 1000 ppm (2400 mg/m3)
OSHA 2009
b. Water
EPA Drinking water standards and health advisories
No EPA 2006
National primary drinking water No EPA 2009 standards
11 ACETONE
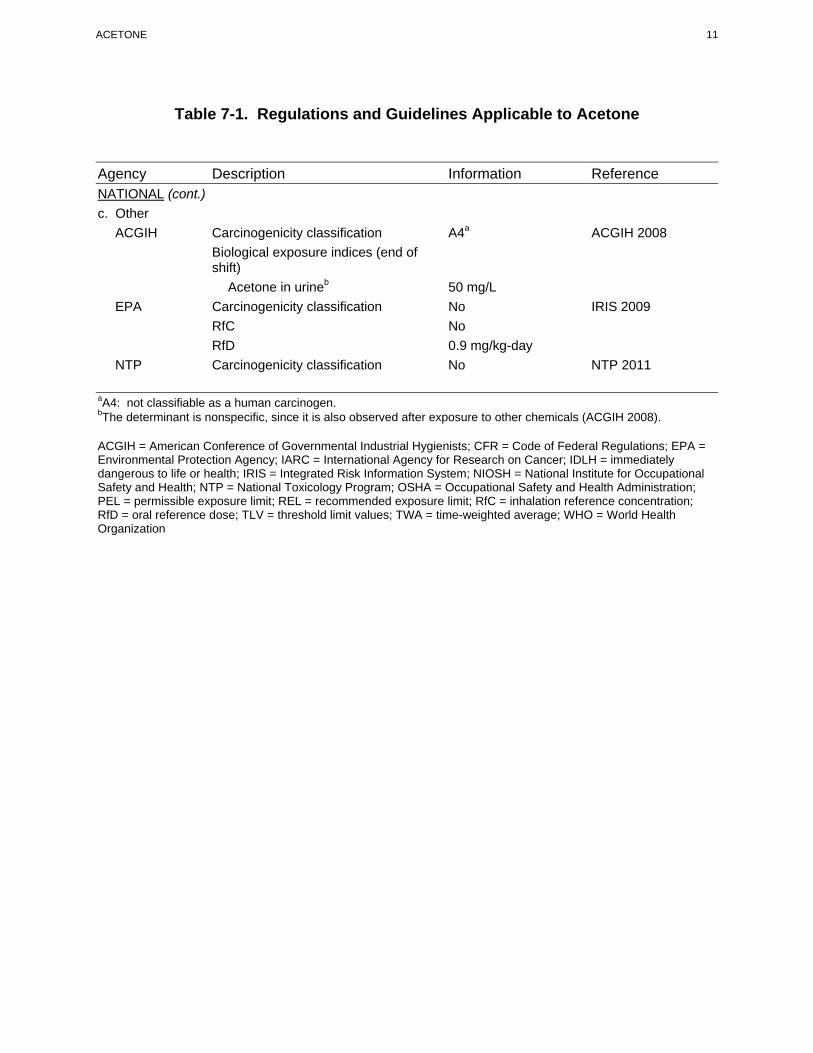
Table 7-1. Regulations and Guidelines Applicable to Acetone
Agency Description Information Reference NATIONAL (cont.)
c. Other
ACGIH Carcinogenicity classification A4a ACGIH 2008
Biological exposure indices (end of shift)
Acetone in urineb 50 mg/L
EPA Carcinogenicity classification No IRIS 2009
RfC No
RfD 0.9 mg/kg-day
NTP Carcinogenicity classification No NTP 2011
aA4: not classifiable as a human carcinogen. bThe determinant is nonspecific, since it is also observed after exposure to other chemicals (ACGIH 2008).
ACGIH = American Conference of Governmental Industrial Hygienists; CFR = Code of Federal Regulations; EPA = Environmental Protection Agency; IARC = International Agency for Research on Cancer; IDLH = immediately dangerous to life or health; IRIS = Integrated Risk Information System; NIOSH = National Institute for Occupational Safety and Health; NTP = National Toxicology Program; OSHA = Occupational Safety and Health Administration; PEL = permissible exposure limit; REL = recommended exposure limit; RfC = inhalation reference concentration; RfD = oral reference dose; TLV = threshold limit values; TWA = time-weighted average; WHO = World Health Organization

12 ACETONE
8. REFERENCES
ACGIH. 2008. 2008 TLVs and BEIs: Based on the documentation of the threshold limit values for chemical substances and physical agents and biological exposure indices. Cincinnati, OH: American Conference of Governmental Industrial Hygienists, 10, 78, 100–102.
Bondoc FY, Bao Z, Hu WY, et al. 1999. Acetone catabolism by cytochrome P450 2E1: Studies with CYP2E1-null mice. Biochem Pharmacol 58(3):461–463. http://www.ncbi.nlm.nih.gov/pubmed/10424765.
Bruckner JV, Ramanathan R, Lee KM, et al. 2002. Mechanisms of circadian rhythmicity of carbon tetrachloride hepatotoxicity. J Pharmacol Exp Ther 300(1):273–281. http://www.ncbi.nlm.nih.gov/pubmed/11752126.
Buron G, Hacquemand R, Pourié, et al. 2009. Inhalation exposure to acetone induces selective damage on olfactory neuroepithelium in mice. NeuroToxicology 30:114–120. http://www.sciencedirect.com/science/article/B6W81-4TYYNK4-1/2/97f46515ad6ac278b7c5ff4fce9d386b
Chen L, Lee M, Hong JY, et al. 1994. Relationship between cytochrome P450 2E1 and acetone catabolism in rats as studied with diallyl sulfide as an inhibitor. Biochem Pharmacol 48(12):2199–2205. http://www.ncbi.nlm.nih.gov/pubmed/7811301.
Christoph GR, Malley LA, Stadler JC. 2003. Subchronic inhalation exposure to acetone vapor and scheduled controlled operant performance in male rats. Inhal Toxicol 15(8):781–798. http://www.ncbi.nlm.nih.gov/pubmed/12825153.
Clewell HJ, 3rd, Gentry PR, Gearhart JM, et al. 2001. Development of a physiologically based pharmacokinetic model of isopropanol and its metabolite acetone. Toxicol Sci 63(2):160–172. http://www.ncbi.nlm.nih.gov/pubmed/11568359.
Dalton P, Wysocki CJ, Brody MJ, et al. 1997. Perceived odor, irritation, and health symptoms following short-term exposure to acetone. Am J Ind Med 31(5):558–569. http://www.ncbi.nlm.nih.gov/pubmed/9099358.
De Almeida BB, Mathias MG, Portari GV, et al. 2010. Chronic acetonemia alters liver oxidative balance and lipid content in rats. A model of Nash? Exp Clin Endocrinol Diabetes 118:61–63. https://www.thieme-connect.com/ejournals/html/eced/doi/10.1055/s-0029-1225649.
Dey A, Cedebaum AI. 2007. Induction of cytochrome promotes liver injury in ob/ob mice. Hepatology 45:1355–1365. http://dx.doi.org/10.1002/hep.21603.
EPA. 2009. National primary drinking water regulations. Washington, DC: U.S. Environmental Protection Agency. Office of Ground Water and Drinking Water. EPA816F09004. http://www.epa.gov/safewater/consumer/pdf/mcl.pdf. August 7, 2009.

13 ACETONE
EPA. 2006. 2006 Edition of the drinking water standards and health advisories. Washington, DC: U.S. Environmental Protection Agency. Office of Water. EPA822R04005. http://epa.gov/waterscience/criteria/drinking/dwstandards.pdf. May 19, 2009.
Gentry PR, Covington TR, Andersen ME, et al. 2002. Application of a physiologically based pharmacokinetic model for isopropanol in the derivation of a reference dose and reference concentration. Regul Toxicol Pharmacol 36:51–68. http://www.ncbi.nlm.nih.gov/pubmed/12383718.
Gentry PR, Covington TR, Clewell HJ III. 2003. Application of a physiologically based pharmacokinetic model for reference dose and reference concentration estimation for acetone. J. toxiocl Environ Health Part A 66:2209–2225. http://www.informaworld.com/smpp/content~db=all?content=10.1080/713853996
IARC. 2009. Agents reviewed by the IARC Monographs. Volumes 1-100A. Lyon, France: International Agency for Research on Cancer. http://monographs.iarc.fr/ENG/Classification/ListagentsCASnos.pdf. May 19, 2009.
Iba MM, Bennett S, Storch A, et al. 1993, Synergistic induction of rat microsomal CYP1A1 and CYP1A2 by acetone in combination with pyridine. Cancer Letters 74:69–74.
IRIS. 2009. Acetone. Integrated Risk Information System. Washington, DC: U.S. Environmental Protection Agency. http://www.epa.gov/ncea/iris/subst/0128.htm. August 6, 2009.
Kiesswetter E, Blaszkewicz M, Vancala RR, et al. 1994. Acute exposure to acetone in a factory and rating of well-being. NeuroToxicology 15 (3): 597–602.
Kostusiak V, Bekkal R, Mateu P. 2003. Survival after drinking lethal dose of acetone. Intensive Care Med 29(2):339. http://www.ncbi.nlm.nih.gov/pubmed/12594602.
Kumagai S, Matsunaga I. 1995. Physiologically based pharmacokinetic model for acetone. Occup Environ Med 52(5):344–352. http://www.ncbi.nlm.nih.gov/pubmed/7795758.
Ladefoged O, Roswall K, Larsen, J-J. 1994. Acetone potentiation and influence on the reversibility of 2,5-hexanedione-induced neurotoxicity studied with behavioural and morphometric methods in rats. Pharmacology and Toxicology 74:294–299.
Maurer JK, Molai A, Parker RD, et al. 2001. Pathology of ocular irritation with acetone, cyclohexanol, paraflurooaniline, and formaldehyde in the rabbit low-volume eye test. Toxicol Pathol 29(2):187–199. http://tpx.sagepub.com/content/29/2/187.abstract.
Mitran E, Callender T, Orha B, et al. 1997. Neurotoxicity associated with occupational exposure to acetone, methyl ethyl ketone, and cyclohexanone. Environ Res 73(1-2):181–188. http://www.ncbi.nlm.nih.gov/pubmed/9311545.
Mörk AK, Johanson G. 2006. A human physiological model describing acetone kinetics in blood and breath during various levels of physical exercise. Toxicol Lett 164(1):6–15. http://www.ncbi.nlm.nih.gov/pubmed/16364574.

14 ACETONE
Mörk AK, Johanson G. 2010. Chemical-specific adjustment factors for intraspecies variability of acetone toxicokinetics using a probabilistic approach. Toxicological Sciences 116(1):336–348. http://toxsci.oxfordjournals.org/content/116/1/336.abstract
NIOSH. 2005. Acetone. NIOSH pocket guide to chemical hazards. Atlanta, GA: U.S. Department of Health and Human Services. National Institute for Occupational Safety and Health. Centers for Disease Control and Prevention. NIOSH Publication 2005-149. http://www.cdc.gov/niosh/npg/npgd0004.html. August 6, 2009.
NTP. 2011. Report on carcinogens, twelfth edition. Research Triangle Park, NC: U.S. Department of Health and Human Services. Public Health Service. National Toxicology Program. http://ntp.niehs.nih.gov/ntp/roc/twelfth/roc12. August 15. 2011.
Orellana BM, Guajardo V, Araya J, et al. 2001. Oxidative stress, microsomal and peroxisomal fatty acid oxidation in the liver of rats treated with acetone. Comp Biochem Physiol C Toxicol Pharmacol 128(4):503–509. http://www.ncbi.nlm.nih.gov/pubmed/11301292.
OSHA. 2009. Table Z-1 limits for air contaminants. Occupational Safety and Health Administration. Code of Federal Regulations. 29 CFR 1910.1000 Subpart Z. http://www.osha.gov/pls/oshaweb/owadisp.show_document?p_table=STANDARDS&p_id=9992. May 19, 2009.
Piatkowski A, Groger A, Bozkurt A, et al. 2007. Acetone associated inhalation injury and rhabdomyolysis. Burns 33(7):932–934. http://www.ncbi.nlm.nih.gov/pubmed/17498882.
Satoh T, Omae K, Nakashima H, et al. 1996. Relationship between acetone exposure concentration and health effects in acetate fiber plant workers. Int Arch Occup Environ Health 68(3):147–153. http://www.ncbi.nlm.nih.gov/pubmed/8919841.
Scholl RR, Iba MM. 1997. Pharmacokinetics of the CYP1A induction by pyradine and acetone in the rat: interactions and effects of route of exposure. Xenobiotica 27(3):265–277.
Siller H, Rainey FA, Stackebrandt E, et al. 1996. Isolation and characterization of a new gram-negative, acetone-degrading, nitrate-reducing bacterium from soil, Paracoccus solventivorans sp. nov. Int J Syst Bacteriol 46(4):1125–1130. http://ijs.sgmjournals.org/cgi/content/abstract/46/4/1125.
Stadler K, Bonini MG, Dallas S, et al. 2008. Direct evidence of iNOS-mediated in vivo free radical production and protein oxidation in acetone-induced ketosis. Am J Physiol Endocrinol Metab 295(2):E456–E462. http://www.ncbi.nlm.nih.gov/pubmed/18559982.
WHO. 2000. Summary of the guidelines. In: WHO air quality guidelines for Europe—2nd ed. Geneva, Switzerland: World Health Organization. May 19, 2009.
WHO. 2006. Annex 4—Chemical summary tables. In: Guidelines for drinking-water quality, third edition, incorporating first and second addenda. Geneva, Switzerland: World Health Organization, 488– 492. http://www.who.int/water_sanitation_health/dwq/GDWAN4rev1and2.pdf. May 19, 2009.
Woolhiser MR, Houtman CE, Waechter JM. 2006. Acetone in drinking water does not modulate humoral immunity in mice as measured by the antibody, plaque-forming cell assay. Int J Toxicol 25(5):333–339. http://www.ncbi.nlm.nih.gov/pubmed/16940005.

15 ACETONE
Wysocki CJ, Dalton P, Brody MJ, et al. 1997. Acetone odor and irritation thresholds obtained from acetone-exposed factory workers and from control (occupationally unexposed) subjects. Am Ind Hyg Assoc J 58(10):704–712. http://www.ncbi.nlm.nih.gov/pubmed/9342830.
Zarani F, Papazafiri P, Kappas A. 1999. Induction of micronuclei in human lymphocytes by organic solvents in vitro. J Environ Pathol. 18(1):21–28.