adcorp holdings annual report 2005 · • growth in the financial services,retail and fast moving...
TRANSCRIPT

ANNUAL REPORT 2005
ADCORPHOLDINGS
CONTENTS
Mission statement and salient features 1Shareholders: what they can expect 1Chairman’s statement 2Achievements in 2005 3Brands and service offerings 4Performance against stated targets 6Chief executive’s report 7Divisional overviews 11Board of directors and management committee 16Six-year review 20Corporate governance 22Employment equity 26Corporate social responsibility 27Shareholder analysis and diary 28Adcorp share data 29Approval of the annual financial statements 30Certification by company secretary 30Report of the joint independent auditors 31Directors’ report 32Annual financial statements 38Notice of annual general meeting 68Form of proxy 69Administration IBC
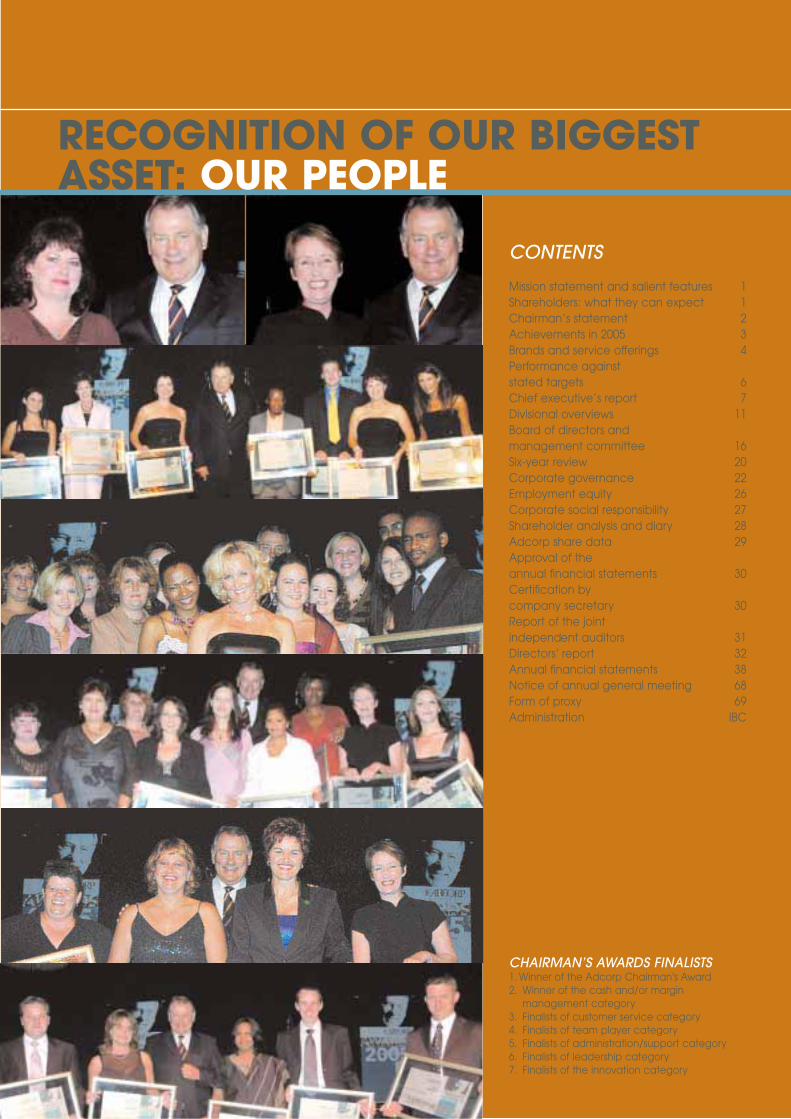
CHAIRMAN’S AWARDS FINALISTS1. Winner of the Adcorp Chairman's Award2. Winner of the cash and/or margin
management category3. Finalists of customer service category4. Finalists of team player category5. Finalists of administration/support category6. Finalists of leadership category7. Finalists of the innovation category
RECOGNITION OF OUR BIGGESTASSET: OUR PEOPLE

Adcorp’s mission is to position the group as the most valued
partner in professional business services specialising in human
capital management and marketing advisory services.
1ADCORPANNUAL REPORT 05
SALIENT FEATURES
• Headline earnings per share up by 23%• Operating profit up by 36%• Operating profit margin up to 4,9%• Debtors days reduced by 3 days to 33 days• Total dividend in respect of 2005 of 140 cents per share – up 33%• Return on assets managed up to 34%
MISSIONTATEMENT
SHAREHOLDERS:WHAT THEY CAN EXPECT
• Total transparency in the conduct of the affairs of the business
• Sound corporate governance
• A primary focus on cash generation (as priority over profit)
• A focus on organic rather than acquisitive growth centred around
margin management
• A return of excess cash resources to shareholders within the confines
of maintaining an acceptable level of gearing
• A commitment to broad-based black economic empowerment
(BBBEE) and transformation

“Adcorp isconfident that
our type ofbusiness willcontinue to
enjoy support”
The performance of Adcorp and its group of
companies continues to be a good news story
having achieved another year of excellence.
Adcorp, under the very competent and
exemplary leadership of its Chief Executive
Officer, Richard Pike embarked on an
operational plan and repositioning strategy in
2001. Since then the company has delivered
three consecutive years of double digit profit
growth. We now have an established
development strategy which enables the
company to exploit its core strengths and focus
on unleashing synergy. In a very tangible sense,
Adcorp’s performance is also testimony to a
larger robust South African economy.
BBBEE remains a formidable challenge for the
group. This challenge is made immeasurably
more difficult because of the vacillation,
uncertainty and ambiguity of official policy in
this regard, particularly where Codes of
Conduct are concerned. However, Adcorp
believes that the problem BBBEE is trying to
address is a very real one and we are
determined to find innovative and value
added ways to address it.
In this and other regards, Adcorp is blessed
with a stable management team that has a very
clear sense of purpose. The focus is on delivery
and avoiding ritualism and bureaucratic
stagnation.
With our focus largely on organic growth, the
outlook for the coming year remains very
positive. Given the nature of demand in the
larger economy with its emphasis on staffing
and skilled labour, Adcorp is confident that our
type of business will continue to enjoy support.
For me as Chairman, it has been a privilege
and pleasure to be associated with a very
dedicated and cooperative group of executives
and I look forward to another exciting year.
Dr Van Zyl Slabbert
Chairman
2 ADCORPANNUAL REPORT 05
CHAIRMAN’STEMENTST

3ADCORPANNUAL REPORT 05
ACHIEVEMENTSIN 2005
• Headline earnings per share up by 23%
• Return on assets managed up to 34%
• Distributions to shareholders total 140 cents per sharedeclared for 2005 year
• Operating profit up by 36%
• Operating margin up to 4,9%
• Cash conversion ratio 79%
• Debtors days down by 3 days
• Gearing reduced to nil
• Share price increased from R16,90 to R24,00
• Value of the group increased by R325 million
• Value return to shareholders 54%
• Shares traded 16 million
• Financial Mail Top Empowerment Companies 2005
– Ranked 1st in Services Sector of JSE Limited– Ranked 7th overall on JSE Limited
• Empowerdex “BBB” rating achieved
• Two additional social investment projects established

BRANDS ANDSERVICE OFFERINGS
4 ADCORPANNUAL REPORT 05
• Graphicor• Simeka TWS Communications
• Public relations• Brand development• Project management of marketing and
communication plans• Design and production of annual reports• Design and production of various stakeholder
communication reports• Financial advertising• Graphic design• Design and production of multimedia
presentations
• Leading market research products andmethodologies
• Specialist consumer research• Brand strategy• Shopper behaviour research• Employee commitment surveys• Socio-political surveys• Qualitative and quantitative techniques
• Research Surveys• Customer Equity Company
(associate)
• Capacity• Charisma Nursing Services• Emmanuels Advance• Quest Flexible Staffing Solutions• Knovation• PMI
• DAV• Grey Consulting• The Oval Office• JobVest • Premier Personnel• Career Junction (associate)• Adcorp Talent Resourcing
• Strategic staffing advisory services• Recruitment advertising• Talent search• Executive search• Internet recruitment• Job profiling• Candidate response management• Candidate assessment and selection• Turn key managed staffing solutions
SERVICE OFFERINGSPERMANENT RECRUITMENT BRANDS
Variety of staffing services and solutions in a multiplenumber of job types and industries, including:• Temporary staffing assignments• Contract staffing solutions• Workforce optimisation• Learnership implementation and administration• Leadership and management development• Customised, strategically aligned, corporate
training solutions• Comprehensive offering of business relevant,
accredited education and training programmes
FLEXIBLE STAFFING BRANDS (includes training)
CORPORATE COMMUNICATIONS BRANDS
MARKETING RESEARCH BRANDS

5ADCORPANNUAL REPORT 05
• The leading marketing knowledge and research company in South Africa• Successful track record of developing cutting edge marketing research
products, for both the local and international markets• A people-centred organisation with a culture of deliberate curiosity staffed
by talented professionals• Extraordinary relationships with clients• Cutting edge thinking supported by technical and process excellence
• Growth in the financial services, retail and fastmoving consumer goods (FMCG) sectors of theeconomy
• Growth in public sector surveys• Growth in the South African economy
• Productivity enhancing service offerings• Market leaders in differentiated recruitment practices• Learning as an integrated part of a flexible workforce management solution• Sophisticated workforce optimisation technology to unlock optimum client
benefits• Database in excess of 250 000 candidates over all levels, skills sets and
various industries• Measurable performance against defined service level agreements• Employment equity record of 68% PDI (previously disadvantaged
individuals) placements • Credible black economic empowerment profile• Action-based training approach: learn – apply – measure• Fully accredited training offerings• Ability to measure efficiency of training in the working environment • Sustainability of benefits for clients • Ability to customise offerings
• Growth in outsourcing of non-core functions byclients
• Desire by organisations to match labour inputcosts to variable market demand
• Rapid expansion of call centres in South Africa• Growth in learnerships established in terms of the
Skills Development Act• Growth in the South African economy
• Uniquely broad range of recruitment services enabling fully outsourcedrecruitment offerings
• Candidate sourcing spanning numerous leading, branded consultanciescombining unrivalled knowledge, experience, databases and advertisingreach
• Job profiling, candidate assessment and selection profiling within aquantifiable, consistent, scientifically verified and legally compliantframework
• Intimate client relationships facilitating the development of unique humancapital strategies and resource planning
• Growth in the South African economy• In particular, demand for staff in the financial
services, retail, engineering, telecommunicationsand public sectors
• Demand for exclusive single supplier, managedstaffing solutions
KEY DRIVERS FOR GROWTHDIFFERENTIATORS
• Diverse talent pool uniquely positioned to match the demands of themarket
• Credible broad-based black economic empowerment profile• Dominant market position• Unique, market leading product and service offerings
• Growth in public sector communication• Growth in multimedia as an effective
communication medium• Trend away from traditional “above the line”
advertising to “through the line” promotionalsolutions
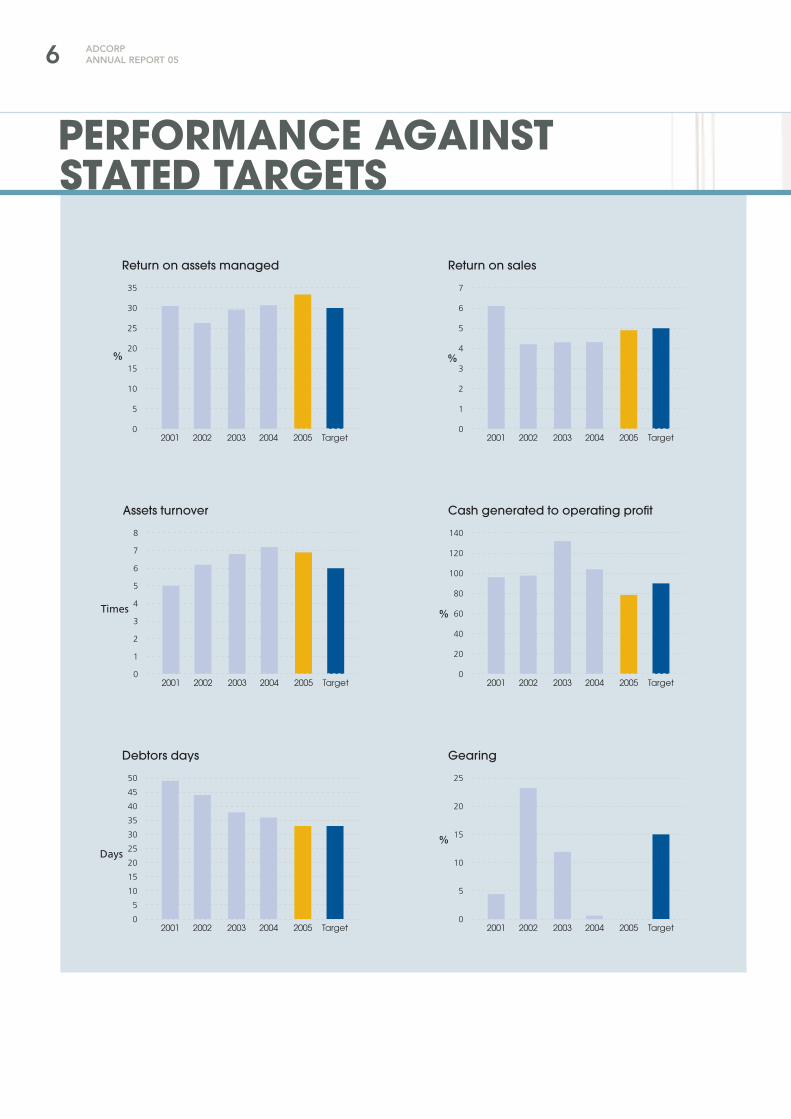
Return on assets managed
2003 2004 2005 Target20022001
35
30
25
20
15
10
5
0
%
Return on sales
2003 2004 2005 Target20022001
7
6
5
4
3
2
1
0
%
Assets turnover
2003 2004 2005 Target20022001
8
7
6
5
4
3
2
1
0
Times
2003 2004 2005 Target20022001
140
120
100
80
60
40
20
0
Cash generated to operating profit
%
2003 2004 2005 Target20022001
50
45
40
35
30
25
20
15
10
5
0
Debtors days
Days
2003 2004 2005 Target20022001
25
20
15
10
5
0
Gearing
%
6 ADCORPANNUAL REPORT 05
PERFORMANCE AGAINSTSTATED TARGETS

7ADCORPANNUAL REPORT 05
“Adcorp has nowdeclared three
consecutiveyears of
double-digitprofit growth”
OVERVIEW2005 proved to be another very successful yearfor the Adcorp group. Operating profit increasedby 36% compared with the prior year whilstheadline earnings per share were 23% higher forthe same period.
Following the repositioning strategy andoperational plan embarked upon by the groupin 2001, Adcorp has now delivered threeconsecutive years of double digit profit growth.
The foundation of the original 2001 repositioningstrategy was to place the group on a soundfinancial and operational footing. As such, it wasrecognised that cash and margin managementwere the key value drivers of the business andrequired a single minded focus.
Simply put, the philosophy was to grow profit andto convert this profit into cash.
As the Adcorp businesses are service relatedwith relatively limited capital infrastructure,the businesses tend to have strong cashgeneration potential given the limited needfor reinvestment. The key, therefore, tounlocking cash from these businesses andconverting profit into cash has been tomanage the receivables book.
Much has now been achieved in this regard.Over the past three years, debtors’ daysoutstanding have been significantly reduced.At the end of the 2000 financial year, debtors’days stood at 55 days. At the end of the 2005financial year, debtors’ days stand at 33 days.By reducing the collection period by 22 days,this has freed up an estimated R80 million toR100 million cash, the majority of which has beenreturned to shareholders by way of dividendsand capital distributions.
CHIIEF EXECUTIVE’SPORTR

8 ADCORPANNUAL REPORT 05
In addition, it has placed the group on anextremely sound footing and has engendereda “cash” culture and discipline within the group.
In terms of margin management, the focuson operating margin has lagged the cashmanagement focus with the real focus beingachieved over the past two years.
For the financial year ended 2002, operatingmargins averaged 4,2% whilst the averagemargin for the 2005 year was 4,9%.
Whilst the individual businesses all attractdifferent operating margins and product andservice mix, which can have a marked impacton reported margins resulting in the averagingof margins being potentially misleading, it ispleasing to note that overall, operating marginsare on the increase.
Given the simplicity and potential shortfalls offocusing on an averaged operating margin,the importance to our businesses of focusing onmargin management as an operating disciplineis therefore, not about a statistical number, but israther about a strategic Adcorp philosophy.This philosophy focuses on the quality rather thanthe quantity of work we take on, on the need todifferentiate our product and service offerings, onthe need to demonstrate value to clients and isabout focusing on the key financial value drivers.
The effectiveness of the strategy to date and thefoundation laid for the group as evidenced byAdcorp’s financial performance over the pastthree years, has provided a sound base fromwhich the strategy can evolve providing theopportunity to now focus on exploiting corestrengths and optimising group synergy.
Management believe that there are manysignificant, untapped organic opportunities
available to the group such as in the areas ofproviding turnkey, managed staffing solutions,providing employee benefits to contract workers,providing group wide shared services, utilisingtechnology to better service clients and focusingon growth sectors such as the call centre industryand public sectors to mention a few.
As such, I believe that the group has never beenon a more sound financial and strategic footingand is extremely well poised for “the next wave”of growth.
In terms of the financial objectives of the business,the focus remains strongly focused on cash andmargin management in terms of the strategy ofmaximising profit and converting it into cash.
To the extent cash is generated in excess of thegroup reinvestment requirement, which is growthin working capital in line with growth in salesactivity, the potential for exceptional cash returnsto shareholders by way of a generous dividendpolicy, remains.
The success of the group’s strategy over the pastthree years has translated into significant valuecreation for shareholders which is the drivingforce and key objective of the group.
Significantly, R373 million of shareholder wealthwas created through an increase in the group’smarket capitalisation in addition to the R48 millionreturned to shareholders by way of capitaldistributions during the 2005 year.
The strong financial performance of the group isalso testimony to a robust South African economy.
Businesses such as the Permanent Recruitmentbusinesses which as a division achieved a 65%jump in operating profit contribution for the yearare a good indicator of economic activity.
SHAREHOLDER WEALTH CREATION(R’000) 2005 2004 2003
Closing share price 31 December (cents) 2 400 1 690 1 180
Market capitalisation (at the end of the year) 1 022 745 697 265 475 533
Market capitalisation (at the beginning of the year) 697 265 475 533 253 267
Increase in market capitalisation 325 480 221 732 222 266
Cash returned to shareholders (dividends/
capital distributions) 48 227 31 964 18 668
Wealth generated for shareholders 373 707 253 696 240 934
% one year return for shareholders 54% 53% 95%
% dividend yield to shareholders (beginning
of year investor) 6,8% 6,7% 7,5%
55
50
45
40
35
30
Debtors days 2000 to 2005
2000 2001 2002 2003 2004 2005
Days
5,5
5,0
4,5
4,0
Operating margin2002 to 2005
2003 2004 20052002
%

9ADCORPANNUAL REPORT 05
Operating profit increased by 36% andheadline earnings per share were 23%higher than the previous year
In addition, the group’s Marketing Researchbusiness which has a large exposure to the fastmoving consumer goods (FMCG) sector has alsobenefited from the recent South Africaneconomic boom.
Whilst one enjoys the fruits of a robust economywhich is expected to remain so for the next while,the group has recognised the importance ofusing the luxury this boom provides to defensivelyposition the businesses for leaner times.
As such, whilst the strategic agenda is largelyoffensive in nature, consideration has also beengiven to defensive tactics.
Broad-based black economic empowerment(BBBEE) remains a major challenge for the group.
As previously reported, the group entered intotwo empowerment shareholding structures atoperating level in the Flexible Staffing division(2003) and in the Corporate Communicationsdivision (2004).
Whilst these two structures have on balanceserved a purpose, the remainder of thegroup struggles to boast an acceptableempowerment credential and, with thegovernment having recently published theirrecommended BBBEE Codes of Good Practice,the profile of the consortia invested in thesestructures is not optimal in terms of these codes.
As such, this has required a re-look and a re-thinkwith regard to our BBBEE profile.
A major source of frustration has been thelack of guidelines as to what constitutes anacceptably empowered business. To compoundthe frustration, different clients often requiredifferent BBBEE criteria depending on theirspecific guidelines or industry charters.
The recently published BBBEE Codes of GoodPractice are therefore welcomed as, for the firsttime, we now have some goal posts to aim for.
That said, however, a number of clients, includingcertain Public Sector clients, still choose toimpose their own criteria in conflict with theCodes which results in an uneven playing fieldand makes for an unpredictable businessenvironment.
Given the client profile of the group, the abilityto demonstrate acceptable BBBEE credentialsis a critical success imperative. Accordingly,
empowerment and transformation are currentlyreceiving the highest priority and necessitating agroup-wide approach.
During the year, the decision was taken tocommence with an upgrade of the managementinformation systems of the Flexible Staffing Division,and to implement the Microsoft developed“Axapta” ERP system.
This upgrade has been necessitated due tothe rapid growth and changing nature ofthe Flexible Staffing businesses, the age andcomplexity of the existing systems as well asthe need for timely, relevant operationalinformation given the strong focus on marginmanagement and the untapped potentialthat can be achieved by focusing onoperational excellence.
The new system is expected to be fullyimplemented early in 2007 and is anticipatedto cost in the region of R27 million. ApproximatelyR12 million of this cost has already been incurredin the 2005 financial year.
Being a service based business, it has beenmanagement’s philosophy to maintain balancesheet flexibility and to deploy financial resourcesto best financial advantage in order to maximisereturns for shareholders. The group, therefore,opts to lease business premises in preferenceto owning such premises.
Accordingly, Adcorp took the decision to sell itsfixed property consisting primarily of its HeadOffice building situated in Melville, Johannesburg.
Consequently, the building was sold towards theend of the 2005 financial year for an amount ofR21,3 million.
The funds from this sale have been earmarkedto fund the new management informationsystem referred to above, such that the group’scash flows and consequential dividend returnsto shareholders remain unaffected.
In pursuit of our strategic objectives of aggressivelyand organically growing the profits of the business,topping the strategic priorities for 2006 are:• Exploiting our core strengths and optimising
group synergy;• Driving operational excellence; and• The achievement of substantial compliance
with the government’s BBBEE Codes of GoodPractice
In addition to these priorities, the group remainsfocused on the following Adcorp philosophieswhich we have committed to over the pastthree years:• Focusing on margin management;• Driving the group cash flows;
Shareholder wealth creation1 January 2005 to 31 December 2005
Cash returned to shareholder –dividend paid R48,227 million
Increase in market capitalisation– R325,480 million

10 ADCORPANNUAL REPORT 05
• Being vigilant with regard to non-performingassets; and
• Maintaining exemplary corporategovernance standards
Financial performanceOnce again, the group’s financial performancefor the year has been most pleasing resulting inyear-on-year growth in operating profit of 36%from the 2004 level of R85 million to the 2005level of R116 million.
Headline earnings per share of 195,1 cents weresome 23% ahead of the 158,2 cents earningsof the prior year.
As part of the strategic philosophy, the groupadopts a policy of financial targeting.
In terms of this financial targeting approach,management is primarily focused on achievinga Return on Asset Managed (ROAM) target of30% which provides for an attractive return toshareholders well in excess of the group’s costof capital.
For the year ended 31 December 2005, thegroup achieved a return on assets managedof 33%.
The key drivers of ROAM are asset productivity orasset turnover (ATO) and margin managementor return on sales (ROS).
The group’s ATO of 6,9 times for 2005 comparedfavourably to the target of 6,0 times whilst theROS figure for the year of 4,9% was only slightlybehind the target of 5%.
The group also targets a cash conversion ratioof 90%, however, December 2005 fell short at 79%largely as a result of high sales revenue inDecember which had the effect of increasingworking capital requirements. This was partiallyoffset by a reduction in debtors days from 36 daysfor 2004 to 33 days at the end of 2005.
Cash generated by operating activities ofR91 million resulted in the group being in a netcash positive position holding net group’s cashreserves of R19 million. This net cash holdingwas achieved despite dividend distributionsbeing paid to shareholders of R48,2 million butwas bolstered by the significant cash receipt ofR20 million relating to the sale of the group’shead office building, The Atrium.
During the 2005 year, shareholders received twodividend distributions totalling 115 cents per share.A further final dividend of 105 cents per share hasbeen approved in respect of the 2005 financialyear to be distributed to shareholders in 2006.
Human resourcesBeing a people intensive business, the need forsound human resource policies and proceduresis of paramount importance.
The key focus of this function is around theattraction and retention of top talent intothe group.
In this regard, the group remains committedto upholding a best practice human resourcemanagement approach ensuring that themanagement of human resources is effective,efficient and that there is fair treatment ofall employees.
In terms of this best practice approach, particularemphasis is given to the following areas:• Recruitment practices• Retention policies and programmes• Succession planning• Performance management• Training and development• Employment equity and affirmative action• Labour relations
In addition, the group human resources functionis the custodian of the group’s social investmentactivities which are primarily focused on thesupport of vegetable garden projects indisadvantaged communities and the supportand care of AIDS sufferers and orphans.
The year aheadProspects for the group remain positive and thegrowth trend achieved over the past three yearsis expected to continue.
As previously mentioned, the major priorities ofthe group relate to exploiting our core strengths,optimising group synergy, driving operationalexcellence and BBBEE.
Operationally, all businesses are strongly focusedon cash and margin management.
Given the inherent potential in unlockingoperational productivity coupled with theexpansion of existing market opportunitiescoupled with favourable economic conditions,prospects for sustained, real growth remain goodfor the foreseeable future.
AppreciationAs Adcorp’s strength has always been itsoutstanding people, I would like to thank thedirectors, management and staff of the Adcorpgroup for their valued contribution over the pastyear and look forward to their continued supportin the future.
Richard PikeChief Executive Officer

11ADCORPANNUAL REPORT 05
PERMANENT RECRUITMENTThe Permanent Recruitment division of the group
recorded another outstanding year. Operating
profit of R23 million was some 65% ahead of that
reported in the prior financial year.
The recruitment environment in South Africa
continues to perform well in line with strong
growth in the South African economy. In
particular, the demand for staff in the financial
services, retail, engineering, telecommunications
and public sectors continues to be strong.
The demand for affirmative action candidates
is also a major driver in the recruitment industry.
As such, the balance in the market has shifted
somewhat away from a constraint in new
employment positions to a constraint in
candidate availability.
Given the division’s diversity of recruitment
methodologies which range from typical search
and selection or “head hunting” activities to
recruitment advertising, response handling
and internet recruitment, Adcorp’s Permanent
Recruitment division is best placed in the South
African market to source the right candidate
for the right job, thus positioning it as clear
industry leader.
The integrated, managed staffing solutions
offered by the division in terms of a key account
management structure have been highly
effective. In terms of this approach, clients are
afforded access to the division’s broad spectrum
of candidate sourcing activities which
significantly increases the potential for successful
placement while reaping the benefits and
simplicity of a single supply, point of contact.
Another major divisional initiative which has
contributed to the financial success of the
division has been the integration of all
recruitment advertising and response handling
activities as one operational entity namely,
“Adcorp Talent Resourcing”.
Although this single entity still has a multi-brand
approach, the integration has provided for
greater market access as well as greater
operational efficiency.
Both the managed staffing solution and talent
resourcing initiatives, while contributing
substantially in a buoyant recruitment market,
also position the division far better defensively
should markets turn as recruitment is typically
impacted by economic cycles.
Specialist recruitment agencies DAV and Premier
Personnel had record years not only in terms of
financial performance but also in terms of
placements made as did the newly merged
activities of Adcorp Talent Resourcing.
Grey Consulting returned to modest profitability
whist The Oval Office continued with their focus
on restructuring for top line success.
Internet recruitment company, Career Junction,
in which Adcorp owns a 25% stake, continued
to grow its position of dominance in this market.
The site hosted 21 000 job advertisements at the
end of 2005 compared with the 15 000 in the
previous year whilst the number of résumés
hosted increased from a level of 182 000 in the
prior year to 288 000 during 2005.
DIVISIONALOVERVIEWS

12 ADCORPANNUAL REPORT 05
to variable market demand, the rapid expansion
of call centres in South Africa servicing both local
and international organisations, the advent of
learnerships as established in terms of the Skills
Development Act as well as the general growth
of the South African economy.
The division has four flexible staffing brands
namely Capacity, Charisma Healthcare
Solutions, Emmanuels Advance and Quest
Flexible Staffing Solutions.
In terms of empowerment credentials, the
division entered into a black economic
empowerment deal in October 2003 whereby
BMFI and ZICO acquired a 25% stake in the
flexible staffing operations.
Transformation remains a major challenge and
receives a high priority on the strategic agenda.
The division has been most successful in
establishing a large number of learnerships in
terms of the Skills Development Act. These
learnerships have been accessed through the
Services Seta and have helped create a
number of permanent jobs for previously
unemployed individuals, predominantly in the
call centre environment.
The creation of these learnerships has also
facilitated the access of tax grants which have
benefited the group’s overall tax rate.
From an operational point of view, cash
management and margin management
continue to drive the divisional strategic agenda.
In terms of cash management, the division’s
debtor’s book forms a significant proportion of
the overall Adcorp group debtor’s book and, as
such, tight debtor’s management and collections
by this division have a major bearing on the
overall cash generative potential of the group.
Debtor’s days have been consistently reduced
in this division over the past four years which has
contributed greatly to the cash “breakthrough”
achieved by the group over this period.
FLEXIBLE STAFFINGThe Flexible Staffing division recorded operating
profit of R104 million which is 42% ahead of the
operating profit of R73 million recorded for the
same period last year.
This division is the most dominant contributor to
group profitability and, once again, produced
an outstanding financial performance.
The division provides jobs for between 30 000
and 35 000 employees at any point in time with
its biggest markets being the financial services,
telecommunications, healthcare, retail, office
support, call centre, technical and semi-skilled
sectors of the job market.
In addition to its flexible staffing operations, the
education and training operations of Adcorp
namely, Knovation and the Production
Management Institute of Southern Africa (PMI),
form part of this division.
Key drivers in the flexible staffing or contract
labour market are growth in the outsourcing of
non-core functions by organisations, the desire by
many organisations to match labour input costs

Prospects remain sound. It is expected thatsustainable real growth will continue to beachieved in the future
The focus on operating margin management
remains a key strategic priority. In terms of this
focus, given that overall margins are averaged
and are impacted by sales mix, the philosophy
is therefore not as much about targeting an
overall margin number as it is about adopting a
philosophy of having clear pricing objectives,
focusing on the “quality” of work undertaken in
preference to the “quantity” of work, providing
employee benefits to flexible workers and
focusing on value or productivity pricing.
Operational excellence also remains a strategic
priority. By controlling the cost base and
managing inherent economies of scale, this will
unlock additional profitability and render the
underlying businesses more competitive.
During the year, the decision was taken to
commence with an upgrade of the management
information systems of the Flexible Staffing division
and to implement the Microsoft developed
“Axapta” ERP system.
This upgrade has been necessitated due to the
rapid growth and changing nature of the Flexible
Staffing businesses, the age and complexity of
the existing systems as well as the need for timely,
relevant operational information given the strong
focus on margin management and the
untapped potential that can be achieved by
focusing on operational excellence.
The new system is expected to be fully
implemented early in 2007 and is anticipated to
cost in the region of R27 million. Approximately
R12 million of this cost has already been incurred
in the 2005 financial year.
A large proportion of flexible staffing income
is now contractual as opposed to the less
predictable, contingency type business which
renders much of the division’s revenues annuity
based.
Prospects for this division remain sound and it
is expected that it will continue to achieve
sustainable real growth into the future.
OBITUARYFollowing a short illness, Francis Khubedu, the
Managing Director of Quest Flexible Staffing
Solutions, passed away on 23 January 2006.
Francis was 33 years old at the time of his death.
In his dealings, he gained the respect and
admiration of the management and staff of
both Quest and Adcorp, his clients and business
associates, competitors and the Flexible Staffing
industry as a whole.
In recognition of his contribution and abilities,
Francis was honoured in 2005 with the Black
Business Quarterly’s (BBQ) “Young Business
Achiever” award whilst Quest went on to receive
the BBQ award for “Business Performance and
Productivity”.
Whilst Francis’ presence will most certainly be
missed in our group, his influence and his
memory will live on.
13ADCORPANNUAL REPORT 05

14 ADCORPANNUAL REPORT 05
CORPORATE COMMUNICATIONSWhilst a relatively small division in the greater
Adcorp group, the Corporate Communications
division experienced a difficult year in 2005.
Although Graphicor produced a reasonable
profit, the division produced an overall
breakeven situation due to losses incurred in
Simeka TWS.
Graphicor had a mixed year. Whilst certain key
clients were lost, a number of new client gains
were made.
The focus of this business recently has been on
stabilising the organisation from a staffing point
of view, focusing on the quality of delivery and
focusing on client retention and new sales.
The losses incurred in Simeka TWS during the year
were a hangover from the turnaround and
restructuring exercise embarked upon at the
end of 2004 following the conclusion of a public
sector contract which represented more than
50% of its business at that stage.
The restructure resulted in a significant
downsizing of the staff complement to match
the reduced revenue base as well as focusing
on upskilling the remaining consultants, soliciting
more private and public sector work and
expanding the product and service offerings.
Whilst much progress was made during the year,
the benefits came too late to impact positively
on the 2005 financial year but prospects look far
better for 2006.
A number of management changes have recently
been made at divisional level as well as at both
Graphicor and Simeka TWS. The division, trading as
Adcorp Communication Solutions, is now extremely
well poised from a position of transformation and
empowerment, delivery capability, cross-company
synergy and market profile.
Now that the ingredients are in place for
success, the challenge in 2006 is to ensure that
the plan is effectively implemented and that the
new sales drive delivers the additional required
level of revenues to put the division back on to
a profitable footing.
The key drivers of this division include the growth
in public sector communication, the growth in
multimedia as an effective communication
medium and the trend away from traditional
“above the line” advertising spend to “below the
line” promotional spend.
The process has started to position Graphicor
and Simeka TWS as providers of strategic
communication solutions to build positive
reputations for corporate and public sector
clients.

15ADCORPANNUAL REPORT 05
Over the past two years, a number of new
product and service offerings have been added
in areas such as retail consumer observation,
web monitoring, consumer profiling and socio-
political surveys.
The socio-political surveys in particular, have
helped raise brand awareness with Research
Surveys having received much publicity given
the relevant, topical nature of these surveys.
The division’s key business drivers are
predominantly growth in the financial services,
retail and FMCG sectors of the economy, as
well as the growth in public sector surveys.
Significant new business gains were achieved
during the year under review as a result of the
efforts of the new business development team
with significant inroads having been made with
regard to the public sector which remains a
priority focus area for the 2006 year.
Innovation remains a key priority and accounts
for much of the success the business currently
enjoys. Innovative measures such as EQLi, a
unique consumer behavioural measure
developed exclusively by Research Surveys, is
rapidly becoming an accepted market measure,
invaluable to marketers providing them with a far
broader understanding of their target markets.
Given the current demand for Research Surveys’
products and services coupled with its strong
order book, prospects for 2006 are extremely
positive.
Significant new business gains wereachieved, with inroads having been madewith regard to the public sector
MARKETING RESEARCHThe Marketing Research division, trading as
Research Surveys, had a very good year.
Operating profit of R10 million for 2005 grew by
a factor of 33% compared to operating profit of
R7 million for 2004.
This improved performance is reflective of the
dominant position Research Surveys now enjoys
in the consumer research industry as well as a
strong South African economy, particularly in the
fast moving consumer goods (FMCG) sector.
Research Surveys is the market leader in its field
and is the leading consumer research house in
South Africa.
The business also has a 25% stake in a joint
venture, the Customer Equity Company (CEC),
owned jointly with United Kingdom-based
research group TNS. CEC which markets the
brand equity product, Conversion Model,
internationally, enjoyed another successful year.
In terms of the competitive landscape, there are
around 600 registered research companies in
South Africa with the majority being relatively
small. As such, there is an element of
fragmentation in the market.
A major challenge for this division, as with
the others in the Adcorp group remains
transformation. As such, a number of key senior,
black appointments have been made to the
Research Surveys’ board and senior management
ranks during the past year.
16 ADCORPANNUAL REPORT 05
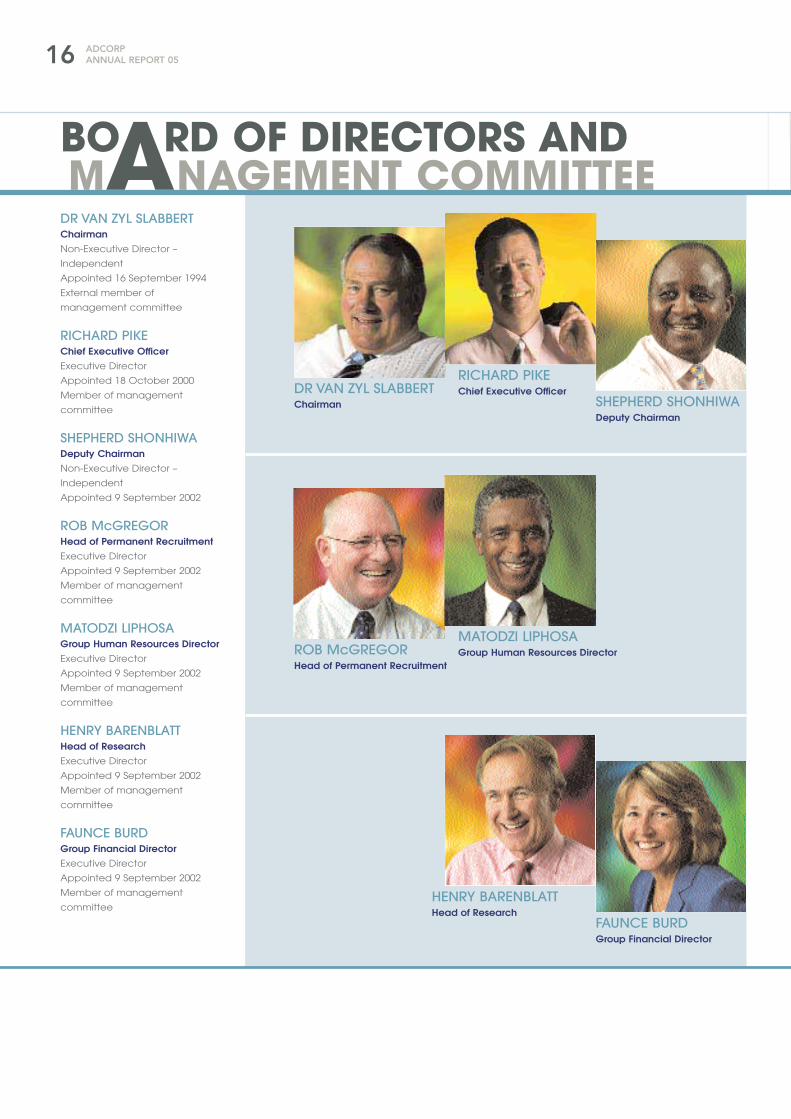
DR VAN ZYL SLABBERTChairman
RICHARD PIKEChief Executive Officer
SHEPHERD SHONHIWADeputy Chairman
DR VAN ZYL SLABBERTChairmanNon-Executive Director –
Independent
Appointed 16 September 1994
External member of
management committee
RICHARD PIKEChief Executive OfficerExecutive Director
Appointed 18 October 2000
Member of management
committee
SHEPHERD SHONHIWADeputy ChairmanNon-Executive Director –
Independent
Appointed 9 September 2002
ROB McGREGORHead of Permanent RecruitmentExecutive Director
Appointed 9 September 2002
Member of management
committee
MATODZI LIPHOSAGroup Human Resources DirectorExecutive Director
Appointed 9 September 2002
Member of management
committee
HENRY BARENBLATTHead of ResearchExecutive Director
Appointed 9 September 2002
Member of management
committee
FAUNCE BURDGroup Financial DirectorExecutive Director
Appointed 9 September 2002
Member of management
committee
ROB McGREGORHead of Permanent Recruitment
MATODZI LIPHOSAGroup Human Resources Director
HENRY BARENBLATTHead of Research
FAUNCE BURDGroup Financial Director
NAGEMENT COMMITTEEMBOARD OF DIRECTORS AND

FAITH KHANYILENon-Executive Director
NELIS SWARTHead of Flexible Staffing
GEORGE NEGOTANon-Executive Director
CAMPBELL BOMELA Director in charge of BBBEE
SONJA SEBOTSA Non-Executive Director
BONGA ZUNGU Alternate Director
THENDO RATSHITANGA Alternate Director
17ADCORPANNUAL REPORT 05
FAITH KHANYILENon-Executive Director –
Independent
Appointed 11 September 2002
NELIS SWARTHead of Flexible StaffingExecutive Director
Appointed 9 September 2002
Member of management
committee
GEORGE NEGOTANon-Executive Director –
Independent
Appointed 11 March 2004
CAMPBELL BOMELAExecutive Director in charge of
BBBEE
Appointed 1 March 2006
SONJA SEBOTSANon-Executive Director –
Independent
Appointed 9 September 2002
BONGA ZUNGUAlternate director
Appointed 5 August 2003
THENDO RATSHITANGAMember of management
committee and alternate director
Appointed 10 March 2004

enhancing professional standards in the
industry. In 1996 he was awarded the SAMRA
trophy for the best paper presented at the
18th SAMRA Convention.
MATODZI LIPHOSA (61)Group Human ResourcesDirectorExecutive Director
HDip ASWP
Appointed 9 September 2002
Outside directorships held
Totem Investment Holdings –
Director
Mutomba Agri Business Enterprises cc –
Member
Matodzi Liphosa joined Adcorp Holdings
Limited in 1992 and has held leadership
positions in community, business and sports
organisations. Matodzi has been both a
member and has also held leadership
positions in organisations such as the Black
Management Forum, NAFCOC and The Free
Market Foundation. He holds a Higher
Diploma in Advanced Social Work Practice
from the University of the Witwatersrand and
has participated in management
development programmes at the business
schools of the University of Cape Town and
the University of the Witwatersrand. He also
completed a management development
programme at the University of North
Carolina at Chapel Hill in the USA as well as
an executive management programme at
the American Management Association.
ROB McGREGOR (60)Head of Permanent RecruitmentExecutive Director
Appointed 9 September 2002
No outside directorships held
Rob McGregor was employed by Argus
Newspapers/-Independent Newspapers for
the period 1981 – 1997. At the time of
leaving the company he was General
Manager of The Independent Newspaper
Company and a member of the Executive
Committee for Independent Newspapers,
RSA. He joined the board of Adcorp
Holdings Limited in 1998 as Executive
Director responsible for the Recruitment
Advertising division. In 1999 he was
appointed Divisional Director of both
Recruitment Advertising and the
Communications divisions. In 2000 he was
appointed Divisional Director of the
Permanent Recruitment division which
included all the permanent staffing
18 ADCORPANNUAL REPORT 05
DR VAN ZYL SLABBERT (65)ChairmanNon-Executive Director – Independent
MA, DPhil
Appointed 16 September 1994
Outside directorships held
CTP Caxton – Chairman
Van Zyl graduated from Stellenbosch
University. He lectured at Stellenbosch,
Rhodes, UCT and Wits from 1964 to 1974.
From 1974 to 1986 he was a member of
Parliament and Leader of the Opposition
Party. In 1986 he formed IDASA with
A Boraine to promote internal/external
dialogue. Van Zyl received honorary
Doctorates from Simon Fraser University in
Vancouver, Canada, University of Natal and
University of Orange Free State. He is
currently involved with Soros Philanthropy in
southern Africa and nine SADC countries.
SHEPHERD SHONHIWA (52)Deputy ChairmanNon-Executive Director – Independent
Dip SocSc, Dip Pers, BSc, BAdmin (Hons), MBA
Appointed 9 September 2002
Outside directorships held
Metcash Trading Africa (Pty) Limited –
Director
MetAf Investment Holdings (Pty) Limited –
Director
MetBee Investment Holdings – Director
TransAfrica Investment Holdings – Director
Easigas SA (Pty) Limited – Director
Easigas Botswana (Pty) Limited – Director
Easigas Lesotho – Director
Easigas Swaziland (Pty) Limited – Director
Jaggers Wholesalers Zimbabwe – Director
Institute of Directors South Africa – Director
Graduated with degrees in Social Science
(Honours), BAdmin and MBA from universities
in Zimbabwe and South Africa. Entered the
corporate world in mid 1970s
and has worked in the sugar, brewing,
petroleum, milling, motor, manufacturing,
FMCG and media sectors. Shepherd has
held general management/chief executive
positions in the motor, media and petroleum
industries in large organisations in central
and southern Africa. This included leading
black economic empowerment and
transformation at company, industry and
national levels in these countries. His
dominant competencies lie in management
development, leadership skills
enhancement, strategic planning and cross-
cultural management.
RICHARD PIKE (44)Chief Executive OfficerExecutive Director
BCom (Hons), CA(SA)
Appointed 18 October 2000
No outside directorships held
After completing articles at Deloitte Haskins
& Sells, he joined the Hunt Leuchars &
Hepburn Group as group Financial Manager,
later being appointed as Financial Director
of HL&H Mining Timber. In 1995 he co-
founded Morgan University Alliance, a
private education and business consulting
initiative offering degree and diploma
programmes in business management from
the University of Warwick in the UK. In 1999,
he listed Acumen Holdings Limited, a staffing
and training group of companies. Acumen
was acquired by Adcorp Holdings Limited in
the year 2000 when Richard assumed the
position of Deputy Chief Executive Officer.
In 2001 he was appointed as Chief Executive
Officer of Adcorp Holdings Limited.
FAUNCE BURD (58)Group Financial DirectorExecutive Director
Appointed 9 September 2002
No outside directorships held
Faunce first joined the Adcorp group in
1990 in the capacity of Managing Director
of Adcorp Graphics. She then left the group
in 1991 to take up the position of Financial
Director of Mono Pumps (part of Murray and
Roberts) for a period of five years. Faunce
re-joined Adcorp in 1997, heading up the
subsidiary Adcorp Management Services
and a year later was appointed as Group
Financial Director of Adcorp Holdings
Limited.
HENRY BARENBLATT (56)Head of Marketing ResearchExecutive Director
Appointed 9 September 2002
No outside directorships held
Henry is the head of Research Surveys. Prior
to becoming a founding partner of
Research Surveys, Henry gained his initial
business experience in a family business
manufacturing and distributing polishes and
detergents for the consumer and industrial
markets. He has frequently addressed the
South African Marketing Research
Association conventions and was awarded
the MRSA trophy in 1991 for his paper

19ADCORPANNUAL REPORT 05
companies and the recruitment advertising
division of Adcorp Holdings. He was
appointed to the board of Career Junction
in 1999.
NELIS SWART (43)Head of Flexible StaffingExecutive Director
MCom
Appointed 9 September 2002
Outside directorships held
Dreamworld Investments – Director
Gentle Property Investments – Director
Nelis lectured on the subjects of Strategic
and Financial Management at the University
of Pretoria. During the same period he was
also a co-founder of a consulting and
marketing research company. Thereafter he
was involved with Deloitte & Touche and
Byrne Fleming in a management consulting
capacity during which period he gained
significant consulting experience in a variety
of industries. Prior to his appointment as
Managing Director of Quest Flexible Staffing
Solutions, he was the commercial director of
Beier Industries in KwaZulu-Natal.
FAITH KHANYILE (39)Non-Executive Director – Independent
BA Economics (Hons), MBA
Appointed 11 September 2002
Outside directorships held
WDB Investment Holdings –
Non-Executive Director
BP (SA) – Non-Executive Director
Ndalama-Schwela – Non-Executive Director
Uthingo – Non-Executive Director
Faith started her career in private equity at
Brait in 1995. In 1999 Faith was instrumental in
the establishment of a woman’s
empowerment company, Women’s
Development Business Investment Holding
Company (WDB Investment Holdings).
During the same year, Faith was part of the
team in Uthingo that was successful in
securing the first National Lottery Licence in
South Africa.
SONJA SEBOTSA (34)Non-Executive Director – Independent
LLB Hons (LSE), MA, SFA
Appointed 9 September 2002
Outside directorships held
WDB Investment Holdings SA – Executive
Director
Agito – Shareholder
Dipeo – Director
Paracon – Non-Executive Director
Willis SA– Non-Executive Director
FirstRand Limited – Non-Executive Director
Makalani Limited – Non-Executive Director
Sonja is an Executive Director at WDB
Investment Holdings, a women-focused
empowerment company wholly owned by
the WDB Trust. Prior to joining WDB in late
2002, Sonja was a Vice President in the
Corporate Finance Division of Deutsche
Bank where she had worked since January
1997. Sonja has been a member of both the
Association of Black Securities and
Investment Professionals and the Investment
Analysts Society of South Africa since 1997.
GEORGE NEGOTA (55)Non-Executive Director – Independent
BA (Hons), BIuris, LLB, MCom, HDip Tax Law,
HDip Co Law, Cert in Tax Law, BCom (Hons)
Appointed 11 March 2004
Outside directorships held
Phalaborwa Mining Co – Director
BKS Engineering – Director
Negota Investment Holdings – Chairman
Negota Inc Attorneys – Chairman
National Lotteries – Director
Ilizwe Industrial – Director
George Negota is a practising attorney and
transport economist. He has worked for
Mobil Oil where he gained experience in
international trade law. He has also worked
for SBDC as a senior consultant and whilst
working for Edward Nathan & Friedland he
acted as the lawyer responsible for the
drafting of the founding documents for
Khula Finance Corporation. He participated
in the privatisation of Iscor and National
Sorghum Breweries (NSB) whilst working for
Edward Nathan & Friedland. Through his
company Negota Incorporated, he was
charged with the reorganisation of Eskom
through the amendment of its founding
legislation.
CAMPBELL BOMELA (57)Executive Director in charge of BBBEE
BCom, MBA
Appointed as a Non-Executive Director
11 March 2004
Appointed as an Executive Director
1 March 2006
Outside directorships held
Computershare SA – Non-Executive Director
Matlapeng Resources – Non-Executive
Director
Talknet Holdings – Non-Executive Director
Prop 5 Corporation – Non-Executive Director
Campbell Bomela was the MD of Black
Management Forum Investments
Company (BMFI) until he joined Adcorp
on 1 March 2006. He has been a senior
business professional for over 15 years and
as part of his experience, he was seconded
to start up the Department of Economic
Affairs for the Eastern Cape Government
after the 1994 general elections. Later
he was seconded to assist with
the amalgamation and rationalisation
of the different economic development
corporations which operated in the Eastern
Cape prior to 1994. On completion, he
started and ran his own businesses in
this area.
THENDO RATSHITANGA (31) Head of CorporateCommunications divisionMember of the management committee
Alternate director to GM Negota
Post-graduate diploma in Public Policy and
Development Management, diploma in
Legislative Drafting
Appointed 11 March 2004
BONGA ZUNGU (40)Alternate director to C Bomela
BCom, MBA
Diploma in Sport and Marketing
Management
Appointed 11 March 2004

SIX-YEARREVIEW
20 ADCORPANNUAL REPORT 05
IFRS* SA GAAP*2005 2004 2003 2002 2001 2000
INCOME STATEMENTRevenue (R’000) 2 359 652 1 980 116 1 667 235 1 523 381 1 211 287 963 443
Operating profit before depreciation
and amortisation (R’000) 131 655 99 323 85 735 79 466 90 061 111 265
Operating profit before amortisation
of goodwill (R’000) 116 407 85 493 72 433 64 500 74 035 94 699
Operating profit (R’000) 116 407 85 493 67 942 59 258 67 432 91 484
Profit/(loss) before taxation (R’000) 102 139 78 465 17 016 (20 246) 69 398 97 728
Tax rate (%) 30,5 23,0 39,2 32,4 32,1 26,7Profit/(loss) for the year (R’000) 67 129 59 333 (9 089) (38 387) 50 487 71 264Profit/(loss) attributable to ordinary shareholders 65 185 56 917 (8 802) (38 577) 49 205 71 264
BALANCE SHEETFixed and other non-current
assets (R’000) 119 723 141 541 132 791 175 871 205 805 198 012Current assets (R’000) 438 307 349 035 294 081 262 035 261 423 178 859
Total assets 558 030 490 576 426 872 437 906 467 228 376 871
Ordinary shareholders’ interest (R’000) 249 706 215 945 186 707 214 309 261 510 230 681
Minority and BEE shareholders’ interest (R’000) 2 456 3 070 788 394 1 281 –
Non-interest-bearing
non-current liabilities (R’000) 5 541 6 887 – 1 002 1 137 1 810
Deferred taxation (R’000) 1 777 – – – – 3 362Current liabilities (R’000) 298 550 264 674 239 377 222 201 203 300 141 018
Total equity and liabilities (R’000) 558 030 490 576 426 872 437 906 467 228 376 871
PROFITABILITYReturn on assets managed (%) 33,4 30,7 29,6 26,3 30,5 49,6
Return on equity (%) 28,5 29,2 (4,5) (16,1) 20,5 44,0
Return on sales (operating
margin) (%) 4,9 4,3 4,3 4,2 6,1 9,8
EBITDA/revenue (%) 5,6 5,0 5,1 5,2 7,4 11,5Number of employees 1 569 1 658 1 611 1 594 1 649 1 628
LIQUIDITYCash generated by operations
to operating profit (%) 79,4 102,9 131,9 97,6 96,0 82,0
Current ratio 1,5 1,3 1,2 1,2 1,3 1,3
Gearing (%) – 0,6 11,9 23,2 4,4 0Debtors days 33 36 38 44 49 55
STATISTICSWeighted average
number of shares in issue (’000) 41 730 40 302 40 031 39 936 40 481 39 338
Headline earnings per share (cents) 195,1 158,2 96,4 106,6 137,7 189,3
Earnings/(loss) per share (cents) 156,2 141,2 (22,0) (96,6) 121,6 181,2
Total capital distribution/annual
dividend per share (cents) 140 105 64 37 28 28
Dividend/capital distribution cover
(times) based on HEPS 1,4 1,5 1,5 2,9 4,9 6,8Net asset value per share (cents) 592 531 466 535 652 585
* Note: The 2005 year results have been prepared in accordance with International Financial Reporting Standards (IFRS). The transition date to IFRS was1 January 2004 resulting in the 2004 figures being restated to reflect IFRS adjustments. Figures prior to 2004 have been prepared in accordance withSouth African statements of General Accepted Accounting Practice (SA GAAP, which was effective at 31 December 2004).

21ADCORPANNUAL REPORT 05
Cash generated by operating activities to operating profit Cash generated by operations as a percentage of operating profit.
Current ratioTotal current assets divided by total current liabilities.
Debtors daysDebtors days are calculated using the peel back method, whereby the trade debtorsbalance is reduced by monthly sales (including VAT), until the balance is exhausted.
Dividend/capital distribution coverHeadline earnings divided by the annual dividend/capital distribution.
EBITDA/turnoverOperating profit before depreciation and amortisation as a percentage of revenue.
Earnings per shareProfit attributable to ordinary shareholders, divided by the weighted average numberof shares in issue.
GearingTotal interest-bearing debt divided by total ordinary shareholders’ interest.
Net asset value per shareOrdinary shareholders’ interest, divided by the number of shares in issue at the year-end.
Return on assets managedOperating profit (before goodwill amortisation prior to 2004) divided by the total ofproperty and equipment, trade and other receivables.
Return on equityProfit for the year divided by average equity of shareholders.
Return on sales (operating margin)Operating profit (before goodwill amortisation prior to 2004) divided by revenue.
DEFINITIONS

CORPORATEGOVERNANCE
22 ADCORPANNUAL REPORT 05
COMPLIANCE WITH THE CODEOF CORPORATE PRACTICESAND CONDUCTThe board of directors is fully committed to
effective corporate governance and the need
for integrity and high ethical standards in the
conduct of its business. Adcorp fully supports the
Code of Corporate Practices and Conduct and
endorses the need to conduct its business
in accordance with the highest standards of
corporate practice. The directors have applied
the recommendations as contained in the Code
of Corporate Practices and Conduct set out in
the King II report.
BOARD OF DIRECTORSThe board of directors as set out on pages
16 to 19 of the annual report consists of six
executive directors and six non-executive
directors. There are two alternate directors.
The non-executive directors provide the board
with independent judgement based on their
significant range of skills and commercial
experience. Six board members are black
and three are women. The functions of chairman
and CEO are not performed by the same
person.
The board meets quarterly and on an ad hoc
basis if considered necessary. The main function
of the board is to determine strategy and
direction and to lead the group in this direction
with integrity and judgement. In addition it
is responsible for the overall sustainability of the
group including areas such as risk management,
protection of group assets, monitoring key
performance indicators as well as the adequacy
of policies and systems. It is further required to
ensure compliance with all legal and statutory
requirements.
Certain functions have been delegated to sub-
committees, which currently consist of the
audit committee, risk committee, transformation
committee and the remuneration and
nominations committee. The functions of these
committees are described more fully under
each of the relevant sub-headings in this report.
All new directors are given a presentation on the
group’s strategy as well as a document outlining
the duties and responsibilities of directors.
Presentations covering director responsibilities
and fiduciary duties are also arranged for board
directors from time to time.
Executive directors do not have service
contracts, and employment is subject to a
maximum of three months’ notice with the
exception of the CEO where the notice period
is six months. Restraint agreements have been
signed and all executive and non-executive
directors hold either shares or share options
or both with the exception of alternate director
S Zungu who sold his shares.
A declaration of interests is submitted by all
directors annually in order to determine any
conflict of interests. No conflicts of interest exist
at present but if this were to occur it would be
resolved by the board. All board directors have
access to the advice of the company secretary
and are at liberty to obtain external advice at
the company’s cost if necessary.
BOARD MEETINGSBoard meetings were held quarterly and all
board members attended these meetings with
the following exceptions. Apologies were
received from:
1st quarter: S Sebotsa, G Negota
2nd quarter: None
3rd quarter: R Pike, M Liphosa, G Negota,
C Bomela
4th quarter: G Negota
EXECUTIVE COMMITTEEThe Adcorp executive committee is the most
senior executive decision making body in the
group. The committee is chaired by the Chief
Executive Officer and comprises the group
financial director, human resources director,
transformation director and divisional directors
responsible for the Flexible Staffing, Permanent
Staffing and Recruitment, Communications and
Marketing Research divisions. In addition the
group chairman, while not directly involved in
the day to day operational issues of the group,
also attends the executive committee meetings
which are held on a monthly basis.
The executive committee is responsible for inter
alia the following:
• Strategic planning, monitoring of market
trends and competitive activity.
• Structuring of the group’s portfolio of assets.
• Shaping and approving operational
strategies, budgets and forecasts.
• Measuring, monitoring and taking proactive
action on company performances.

23ADCORPANNUAL REPORT 05
• Monitoring and managing cash, cash
collections and margins.
• Shaping and approving succession plans
and senior management appointments.
• Group BEE structures, initiatives and
transformation.
• Group reporting and reporting to
shareholders.
AUDIT COMMITTEEThe audit committee consists of:
Non-executiveS Sebotsa
(Chairperson) Appointed
2 October 2002
F Khanyile Appointed
2 October 2002
Executive (by invitation)F Burd
(Group Financial
Director) Appointed
9 September 2002
L Warwick Appointed
(Group Financial 25 November 2004
Manager)
A Nkuna
(Group Manager: Appointed 1 March 2005
Internal Audit) Resigned 19 August 2005
Internal auditors (by invitation)Sizwe Ntsaluba vsp Appointed 28 October 2005
External auditors (by invitation)Deloitte & Touche Appointed 2002
Charter Financial
& Auditing Inc Appointed 1987
Following the resignation of the group manager:
internal audit, the committee approved the
appointment of Sizwe Ntsaluba vsp as the
group’s internal auditors.
Apologies were received from S Sebotsa,
L Warwick and A Saffer (Charter Financial
Auditing Inc) in respect of the May 2005
meeting. The remaining members attended
all meetings.
The audit committee has a charter setting out its
functions and responsibilities and is chaired by a
non-executive director. The committee met four
times during the year with management as well
as the external and internal auditors to review
the group’s financial systems and reports. The
audit committee works from a written checklist
which includes, amongst other items, the
following areas which are reviewed on an
ongoing basis:
• Appropriate accounting policies have been
adopted and consistently applied.
• Evaluation of critical risk areas and how
these are being addressed.
• Review of internal and external audit reports.
• Assessment of control mechanisms and
correctness of financial data.
• Level and competency of company and
group management, particularly in the
financial area.
• Disaster recovery procedures.
The auditors are appointed annually based on
the recommendation of the audit committee.
Currently the group auditors are Deloitte &
Touche and Charter Financial & Auditing Inc.
Relevant issues discussed by this committee are
reported to the Adcorp board and the board
is kept fully informed as to the workings of the
committee.
RISK COMMITTEEThe risk committee consists of:
Non-executiveG Negota
(Chairman) Appointed
1 April 2004
F Khanyile Appointed
1 April 2004
S Shonhiwa Appointed
1 April 2004
ExecutiveF Burd Appointed
1 April 2004
L Warwick Appointed
25 November 2004
A Nkuna Appointed
1 March 2005
Resigned 19 August 2005
The risk committee met once in October and all
committee members attended.

24 ADCORPANNUAL REPORT 05
The transformation framework is focusedon building capacity throughdevelopment and transfer of skills
The risk committee was established in 2004 and
will in future meet twice in any financial year.
The committee has a charter and is responsible
for the evaluation of external and internal risks to
the group as well as reviewing the philosophy
and strategy, policies and processes in order to
ensure that risk management is embedded in
the culture of the group. The risk committee also
monitors management action in dealing with
and minimising risks to the group.
TRANSFORMATION COMMITTEEThe transformation committee was established in
2004 and consists of:
Non-executiveC Bomela
(Chairman) Appointed
1 April 2004
Dr VZ Slabbert Appointed
1 April 2004
M Liphosa Appointed
1 April 2004
S Sebotsa
(ex officio) Appointed
1 April 2004
ExecutiveA Ramsden Appointed
(ex officio) 1 April 2004
This committee did not meet officially during
2005, however, Messrs Bomela and Liphosa met
informally on transformation issues on several
occasions. Formal committee meetings will be
held during 2006. Transformation is an ongoing
group focus and is discussed at all Adcorp
board meetings as well as at all executive
committee meetings.
The transformation committee is responsible for
monitoring transformation at all levels within the
group as well as assisting with formulation of
group transformation policy and reviewing the
implementation of these policies. In addition the
committee reviews progress on employment
equity and skills development as well as
corporate social investment.
REMUNERATION ANDNOMINATIONS COMMITTEEThis committee met once during the year and
consists of:
Non-executiveS Shonhiwa
(Chairman) Appointed
2 October 2002
Dr VZ Slabbert Appointed
20 November 1995
ExecutiveF Burd (ex officio)
R Pike (ex officio)
The remuneration committee is responsible
for approving the remuneration of all board
directors as well as the allocation of share
options to employees. Independent external
consultants and market comparisons are used
to ensure that remuneration is market related
and is linked to both individual and company
performance. Directors’ remuneration is fully
disclosed on page 62.
INTERNAL CONTROLThe directors report that the company’s internal
controls and systems are designed to provide
reasonable assurance as to the integrity and
reliability of the financial statements and to
adequately safeguard, verify and maintain
accountability of its assets. Such controls are
based on established written policies and
procedures and are implemented by trained
personnel with an appropriate segregation of
duties. These policies and procedures are
reviewed continually and updated as necessary.
The internal audit division conducts ongoing
audits on all group companies and written
reports are compiled. All items raised in these
reports are addressed promptly. The risk
committee evaluates external risks to the
businesses and matters of concern are
addressed on an ongoing basis by
management. The group has a documented
and tested business continuity plan which should
enable it to recover from a disastrous incident.
Nothing has come to the attention of the
directors to indicate that any material
breakdown in the functioning of these controls,
procedures and systems has occurred during
the year under review.

25ADCORPANNUAL REPORT 05
GOING CONCERNThe directors are of the opinion that the business
will be a going concern for the foreseeable
future and accordingly, the financial statements
have been prepared on a going concern basis.
SOCIAL INVESTMENTAdcorp established a formal Social Investment
Programme in January 2001. The achievements
of this programme as well as its purpose and
future direction are covered more fully under the
section on “Corporate Social Responsibility” on
page 27.
NON-FINANCIAL MATTERSAll directors and employees are required to
maintain the highest ethical standards in
ensuring that the group’s business practices are
conducted in a manner which in all reasonable
circumstances is beyond reproach. There is a
documented code of conduct which is signed
by all employees.
Adcorp is committed to educating and
supporting employees in the fight against
HIV/Aids and has produced a booklet and
posters on HIV/Aids awareness. The group
has a formal HIV/Aids policy and has done
assessments on the effect HIV/Aids could have in
the workplace.
Adcorp is concerned about employee safety
and while employees mainly work in an office
environment, reasonable steps are taken to
ensure their safety. Capacity, which is involved in
the contracting of “blue collar” workers, has
a National Health and Safety Manager who is
responsible for the safety of all employees.
Adcorp is environmentally responsible and
aware and ensures that at all times the
group in no way negatively impacts on the
environment.
STAKEHOLDERCOMMUNICATIONThe board strives to present a balanced and
understandable assessment of the group’s
position, addressing material matters of
significant interest and concern to stakeholders.
At all times, a balance is sought in presenting the
positive and negative aspects of activities
of the group.
The group is reporting for the first time under the
IFRS standard for the year ended 31 December
2005 and accordingly, the results for the year
ended 31 December 2005 have been prepared
in accordance with the group’s accounting
policies, which comply with International
Financial Reporting Standards (IFRS). The
disclosures required in terms of IFRS1 (First Time
Adoption of International Financial Reporting
Standards) concerning the transition from South
African Statements of Generally Accepted
Accounting Practice (SA GAAP) and the
requisite changes in accounting policies are set
out more fully in the directors’ report.
USE OF EMPOWERED SUPPLIERSThe group places significant importance on the
use of empowered suppliers and sourcing of
services and supplies from empowered
companies is encouraged at all times.
CLOSED TRADING PERIODDirectors and managerial staff are precluded
from trading in Adcorp shares from
31 December until the announcement of the
annual results and again from 30 June until the
announcement of the interim results.
HUMAN RESOURCESThe board of directors has formalised a
transformation programme whereby measurable
objectives for the Adcorp group have been set
in four areas:
• Best practices in human resources
• Affirmative action
• Organisational culture
• Black economic empowerment
The transformation framework has followed the
strategic business plan of the group and its
operating companies and is focused primarily
on building capacity through focused
development and skills transfer. This is aimed at
achieving sustained growth and profitability both
now and in the future. In order to achieve
strategic business objectives, the above
transformation process is supported with a
performance measurement system focused on
measuring key objectives at all levels throughout
the group. The system facilitates effective
planning, implementation and monitoring at
board level and reflects the individual and
collective commitment of all directors and
senior managers to the process. A table setting
out the number of employees and the
employment equity status of the group appears
on page 26. In addition to 1 569 permanent
employees the group has approximately
35 000 contract and temporary employees
which it places in employment across a wide
spectrum of businesses. Adcorp has a large
number of learnerships which also form part of
the group’s training initiatives.

26 ADCORPANNUAL REPORT 05
Total workforce 1 568 1 658Total employees with disabilities 1 15
Workforce profileRacial and gender profile
Non-designated group 156 170White females 618 605Black males 214 247Black females 581 619
Occupational level profile
Management 429 387Non-management 1 140 1 256
Management profile by gender
Females 302 267Males 127 134
Management profile by race
Black 118 121White 311 270
Non-management profile by gender
Females 897 984Males 243 267
Non-management profile by race
Black 677 749White 463 483
Disability profile
Management – 4Non-management 1 11
People with disabilities by gender
Females 1 10Males – 5
Total employees before reporting cycle 1 658 1 611
Less: Resignations 32 226Non-renewal of contracts(contract employees) 820 612Dismissals 22 26RetirementsOther, deceased, transferred 7 1Retrenchments 28 49
Total employees as on reporting date of the reporting cycle (1 October) 1 569 1 658
Adcorp Holdings complies fully with the provisions of Chapter 3 of the Employment Equity Act. Employment equity isviewed as an integral part of the broad-based black economic empowerment strategy and is continuously monitoredacross the group and its subsidiaries.
EMPLOYMENTEQUITY
2005 2004

The group has committed to spend a minimum
1% of its annual profits on social investment
projects. In 2005 the group social responsibility
spend amounted to R2,3 million (2004: R2,1 million).
In this regard, the group has selected the
implementation and support of agricultural
projects, specifically vegetable gardens, in
disadvantaged communities as its preferred
vehicle for community support.
Geographically, the focus of these activities is
on the Gauteng, greater Durban and Cape
Town areas.
The vegetable garden projects are
predominantly situated in disadvantaged
schools and support the schools’ feeding
schemes and are also used by these schools
for educational purposes.
The approach of Adcorp in terms of these
projects is to help unskilled, unemployed people
in these disadvantaged communities. Where
practical preference in the transfer of skills is
given to women.
Each project requires a committed champion
and all participants receive basic skills training
on growing vegetables. Adcorp also provides
the necessary infrastructure, equipment, seeds
and fertilisers and assists with the set up of a
governing constitution for the project and the
establishment of a project bank account.
The projects are designed to be self-sustaining
within two years of establishment, operating as
individual micro-enterprises.
Additional benefits of these projects are that
they provide nutrition to people in participating
schools and the surrounding communities
including orphanages and clinics.
Seven such projects have been established
to date and participants are currently selling
vegetables in the informal retail markets in their
respective communities and have begun to
extend their sales efforts to include formal, open
vegetable markets.
To date projects have been established at the
following sites:
• Eluthandweni Maternity Clinic, Vosloorus
• Ikusasa Secondary School, Tembisa
• T-SHAD (Tembisa Self Help Association for the
Disabled), Tembisa
• Sonqoba Primary School, Katlehong
• Banareng Primary School, Atteridgeville
• Tshedimosho Primary School, Mofolo, Soweto
• Thembile Primary School, Kagiso
In addition, the Adcorp Corporate Social
Investment Programme has in the past
supported a number of rural projects in
Limpopo, focusing on skills development in
pottery, vegetable and chicken farming.
CORPORATE SOCIALONSIBILITYRES
27ADCORPANNUAL REPORT 05

Number of % of Number of % ofshareholders shareholders shares shares
1 PORTFOLIO SIZERange1 – 1 000 798 50,57 314 904 0,74
1 001 – 10 000 579 36,69 1 925 927 4,52
10 001 – 100 000 124 7,86 4 167 057 9,78
100 001 – 1 000 000 67 4,25 21 236 609 49,83
1 000 001 and above 10 0,63 14 969 878 35,13
Totals 1 578 100,00 42 614 375 100,00
2 DISTRIBUTION OF SHAREHOLDERSBanks 11 0,70 2 448 613 5,75
Close corporations 4 0,25 76 138 0,18
Individuals 1 028 65,15 2 440 353 5,73
Insurance companies 12 0,76 7 258 879 17,03
Investment companies 8 0,51 1 593 600 3,74
Limited companies 5 0,32 596 200 1,40
Mutual funds 208 13,18 17 011 346 39,92
Nominees and trusts 98 6,21 1 773 499 4,16
Other corporations 18 1,14 210 412 0,49
Pension funds 130 8,24 8 463 814 19,86
Private companies 54 3,42 599 600 1,41
Adcorp share trusts 2 0,12 141 920 0,33
Totals 1 578 100,00 42 614 375 100,00
3 SHAREHOLDER SPREADNon-public 6 0,38 479 072 1,23
Share trusts 3 0,19 141 920 0,44
Directors 3 0,19 337 152 0,79
Public 1 572 99,62 42 135 303 98,77
Totals 1 578 100,00 42 614 375 100,00
4 MAJOR SHAREHOLDERS (5% OR MORE OF THE SHARES IN ISSUE)Investec Asset Management 7 653 218 17,96
Old Mutual Asset Management 4 818 794 11,31
Allan Gray Asset Management 4 753 920 11,16
Sanlam Asset Management 3 253 378 7,63
RMB Asset Management 2 429 142 5,70
SHAREHOLDERS’ DIARY
Financial year-end 31 December 2005
Annual general meeting 09:00 Thursday, 29 June 2006
ReportsInterim results August
Reviewed annual results March
Audited annual financial statements June
SHAREHOLDER ANALYSISAND DIARY
28 ADCORPANNUAL REPORT 05

2005 2004
Closing price of Adcorp Holdings (at 31 December) (cents) 2 400 1 690
Total number of shares traded 16,2 million 17,5 million
Total value of shares traded (rands) 339 138 484 268 100 000
Price of shares traded – highest (cents) 2 400 1 701
Price of shares traded – lowest (cents) 1 675 1 180
Total number of Adcorp transactions recorded on the JSE 2 318 1 491
Total value of shares traded as a % of total shares issued (%) 38,1 43,9
ADCORPSHARE DATA
29ADCORPANNUAL REPORT 05
2 400
2 300
2 200
2 100
2 000
1 900
1 800
1 700
1 600Jan Feb Mar Apr May Jun Jul Aug Sept Oct
2005Nov Dec
Adcorp price chart – daily closing price
Cen
ts p
er s
hare
2 500 000
2 000 000
1 500 000
1 000 000
500 000
0Jan Feb Mar Apr May Jun Jul Aug Sept Oct
2005Nov Dec
Adcorp volume chart – daily volume traded for 2005
Num
ber
of s
hare
s

30 ADCORPANNUAL REPORT 05
APPROVAL OF THE ANNUAL FINANCIAL STATEMENTSfor the year ended 31 December 2005
TO THE MEMBERS OF ADCORP HOLDINGS LIMITED
The directors of the company are responsible for the preparation, integrity, objectivity and fair presentation of the annualfinancial statements and related financial information presented in this report.
The directors are also responsible for the systems of internal control. These are designed to provide reasonable but notabsolute assurance as to the reliability of the financial statements, and to adequately safeguard, verify and maintainaccountability for assets and to prevent and detect material misstatement and loss. The systems are implemented andmonitored by suitably trained personnel with appropriate segregation of authority and duties. Nothing has come to theattention of the directors to indicate that any material breakdown in the functioning of these controls, procedures andsystems has occurred during the year under review.
The company and group financial statements are prepared in accordance with the provisions of the South AfricanCompanies Act and comply with International Financial Reporting Standards and incorporate full and reasonabledisclosure in line with the accounting policies of the group.
The directors are of the opinion that the business will be a going concern for the foreseeable future, and accordingly thefinancial statements continue to be prepared on a going concern basis.
It is the responsibility of the joint independent auditors to report on the annual financial statements. Their response to themembers is set out on page 31.
The annual financial statements set out on pages 32 to 67 were approved by the board of directors on 26 May 2006and are signed on its behalf by:
RL Pike FD BurdChief Executive Officer Group Financial Director
Johannesburg26 May 2006
CERTIFICATION BY COMPANY SECRETARYfor the year ended 31 December 2005
In accordance with section 268G(d) of the Companies Act, 61 of 1973 as amended, I certify that the company haslodged with the Registrar all such returns as are required by a public company in terms of the Act and that all suchreturns are true, correct and up to date.
LJ SudburyCompany secretary
28 Sloane StreetBryanston2021
Appointed 8 March 2006
Johannesburg26 May 2006

31ADCORPANNUAL REPORT 05
REPORT OF THE JOINT INDEPENDENT AUDITORS
TO THE MEMBERS OF ADCORP HOLDINGS LIMITED
We have audited the annual financial statements and group financial statements of Adcorp Holdings Limited set out onpages 32 to 67 for the year ended 31 December 2005. These financial statements are the responsibility of the board ofdirectors. Our responsibility is to express an opinion on the financial statements based on our audit.
We conducted our audit in accordance with International Standards on Auditing. Those standards require that we planand perform the audit to obtain reasonable assurance about whether the financial statements are free of materialmisstatement. An audit includes examining, on a test basis, evidence supporting the amounts and disclosures in thefinancial statements. An audit also includes assessing the accounting principles used and significant estimates madeby management as well as evaluating the overall financial statements presentation. We believe that our audit providesa reasonable basis for our opinion.
In our opinion, the financial statements present fairly, in all material respects, the financial position of Adcorp HoldingsLimited and the group at 31 December 2005 and the results of its operations and cash flows for the year then ended. Inaccordance with the International Financial Reporting Standards and in a manner required by the Companies Act ofSouth Africa.
Deloitte & ToucheRegistered Auditors
R Campbell Partner
26 May 2006
Buildings 1 and 2 Deloitte PlaceThe Woodlands Office ParkWoodlands DriveSandton2052
National executive: V Naidoo – Chief executive, RMW Dunne – Chief operating officer, GM Pinnock – Audit, DL Kennedy – Tax, GG Gelink – Consulting, MG Crisp – Financial advisory, CR Beukman, TJ Brown, AE Swiegers, NT Mtoba – Chairman of the board, J Rhynes – Deputy chairman of the board.
A full list of partners and directors is available on request.
Charter Financial & Auditing IncorporatedRegistered Auditors
A SafferPartner
26 May 2006
25 Plantation RoadNorwood2192
Directors: A Saffer, J Segel

32 ADCORPANNUAL REPORT 05
DIRECTORS’ REPORTfor the year ended 31 December 2005
The directors have pleasure in submitting their report and financial statements for the year ended 31 December 2005.
NATURE OF BUSINESSAdcorp Holdings Limited is an investment holding company whose subsidiaries and associates carry on business mainlyin South Africa, in the permanent recruitment and flexible staffing sectors as well as the education and training,communications and marketing research sectors of the service industry.
OVERVIEW2005 proved to be another very successful year for the Adcorp group. Operating profit increased by 36,2% compared withthe prior year whilst headline earnings per share were 23,3% higher for the same period.
Following the repositioning strategy and operational plan embarked upon by the group in 2001, Adcorp has nowdelivered three consecutive years of double digit profit growth.
The foundation of the original 2001 repositioning strategy was to place the group on a sound financial and operationalfooting. As such, it was recognised that cash and margin management were the key value drivers of the business andrequired a single minded focus.
Simply put, the philosophy has been to grow profit and to convert this profit into cash.
The Permanent Recruitment division of the group recorded another outstanding year. Operating profit of R23,2 million wassome 64,9% ahead of that reported in the prior financial year.
The recruitment environment in South Africa continues to perform well in line with strong growth of the South Africaneconomy. In particular, the demand for staff in the financial services, retail, engineering, telecommunications and publicsectors continues to be strong.
The demand for equity candidates is also a major driver in the recruitment industry. As such, the balance in the markethas shifted somewhat away from a constraint in new employment positions to a constraint in candidate availability.
The Flexible Staffing division recorded operating profit of R103,5 million which is 42,2% ahead of the operating profit ofR72,8 million recorded for the same period last year. This division is the most dominant contributor to group profitabilityand, once again, produced an outstanding financial performance.
The division provides jobs for between 30 000 and 35 000 employees at any point in time with its biggest markets being thefinancial services, telecommunications, healthcare, retail, office support, call centre, technical and semi-skilled sectors ofthe job market.
Whilst a relatively small division in the greater Adcorp group, the Corporate Communications division experienced adifficult year in 2005.
Although the graphic design and annual report operations produced a reasonable profit, the division produced anoverall modest operating profit of R0,4 million due to losses incurred in the public relations business.
A number of management changes have been made and the division is now well poised from a position oftransformation and empowerment, delivery capability, cross-company synergy, and market profile. The challenge in 2006is to ensure that the plan is effectively implemented and that the new sales drive delivers the additional required level ofrevenues to put the division back on to a profitable footing.
The Marketing Research division, trading as Research Surveys, had a very good year. An operating profit of R10,1 millionfor 2005 grew by 33,0% compared to operating profit of R7,6 million for 2004. This improved performance is reflective ofthe dominant position Research Surveys now enjoys in the consumer research industry as well as a strong South Africaneconomy, particularly in the fast moving consumer goods (FMCG) sector.
During the year, the decision was taken to commence with an upgrade of the management information systems ofthe Flexible Staffing division and to implement the Microsoft developed “Axapta” ERP system. This upgrade has beennecessitated by the rapid growth and changing nature of the Flexible Staffing businesses, the age and complexity ofthe existing systems as well as the need for timely, relevant operational information given the strong focus on marginmanagement and the untapped potential that can be achieved by focusing on operational excellence.
The new system is expected to be fully implemented early in 2007 and is anticipated to cost in the region of R27 millionto complete the project. R10,6 million of this cost has already been incurred in the 2005 financial year and will bedepreciated once the system is commissioned.
Being a service-based business, it has been management’s philosophy to maintain balance sheet flexibility and to deployfinancial resources to best financial advantage in order to maximise returns for shareholders. The group, therefore, opts tolease business premises in preference to owning them.

33ADCORPANNUAL REPORT 05
Accordingly, Adcorp took the decision to sell its fixed property consisting primarily of its head office building situated inMelville, Johannesburg.
Consequently, the building was sold towards the end of the 2005 financial year for an amount of R21,3 million. The fundsfrom this sale have been earmarked to fund the new management information system referred to above, such that thegroup’s cash flows and consequential dividend returns to shareholders remain largely unaffected.
The major strategic priorities of the group for 2006 are to exploit its core strengths, optimise group synergy, driveoperational excellence and enhance the group’s broad-based black economic empowerment (BBBEE) profile whilstoperationally, all businesses remain strongly focused on cash and margin management.
FIRST TIME ADOPTION OF INTERNATIONAL FINANCIAL REPORTING STANDARDS (“IFRS”)This annual report has been prepared in accordance with International Financial Reporting Standards (“IFRS”). Thetransition date to IFRS was 1 January 2004 and the figures for the year ended 31 December 2004 have been restatedaccordingly. The audited results for the year ended December 2005 have been prepared in accordance with the group’saccounting policies, which comply with International Financial Reporting Standards (“IFRS”). The disclosures required interms of IFRS1 (First Time Adoption of International Financial Reporting Standards) concerning the transition from SouthAfrican Statements of Generally Accepted Accounting Practice (“SA GAAP”) and the requisite changes in accountingpolicies are set out below.
The following IFRS standards have impacted on group accounting policies and the disclosure of group results:
IFRS2 – Share-based paymentsThe notional values of share-based payments to employees are charged in the income statement and the reciprocalcredit is shown as a “Share-based payment reserve” in the balance sheet.
IFRS3 – Business combinationsGoodwill is no longer amortised over its expected useful life, but is tested for impairment on an annual basis and anyimpairment is charged in the income statement.
IAS16 – Property, plant and equipmentThe residual values and useful lives of major fixed assets have been assessed and where applicable depreciation hasbeen adjusted.
OTHER RESTATEMENTSIAS17 – LeasesIn addition to the above changes, the accounting treatment of lease rentals has been modified to accord with the SAICAcircular 07/2005 in respect of IAS17, namely, escalations in operating lease rentals are no longer recognised in the periodsthey are actually incurred, but are now charged in the income statement on a straight-line basis over the term of theleases.
FINANCIAL OVERVIEWHeadline earnings per share increased by 23,3% compared with 2004 while the increase in earnings per share 10,6%above last year. The reason for the lower increase in earnings per share is the impairment of goodwill of R19,1 million. Ofthis, R14,0 million was precipitated by the reduced profit prospects of Graphicor, the Communications division companywhich has experienced some management and staff difficulties. The balance is primarily due to the ProductionManagement Institute of South Africa, a training company, where R4,1 million was impaired as a result of this company’sslow return to accepted levels of profitability.
The overall increase in margin of 0,6% is a pleasing upward trend and has contributed approximately R14,0 millionadditional profit in the current year.
Net cash at 31 December 2005, was R18,7 million compared with an overdraft of R1,3 million at the end of 2005. Workingcapital requirements increased by R28,3 million over the same period last year mainly as a result of December 2005turnover being significantly higher than that of December 2004. The full impact of this was offset by a reduction in debtorsdays form 36 to 33 days.
The increase in central costs compared with 2004 is mainly due to additional expenses incurred in complying withcorporate governance and accounting requirements.
The effective tax rate of 30,5% (2004: 23,0%) was higher than in previous years due to the payment of a dividend asopposed to a capital distribution necessitating the payment of secondary tax on companies (STC). In addition thereduced tax rate resulted in an increased charge to the income statement arising from the adjustment to deferred taxassets. The effect of this was offset by the tax incentives resulting from learnerships implemented by the Flexible Staffingdivision in terms of the Skills Development Act.

34 ADCORPANNUAL REPORT 05
DIRECTORS’ REPORTfor the year ended 31 December 2005
SHARE CAPITALNumber
000’s R’000
Opening balance 1 January 2004– Issued shares 40 299 1 007Employee share scheme (ordinary shares created) 958 875 shares at 2,5 cents 959 24
Opening balance 1 January 2005– Issued shares 41 258 1 031Employee share scheme (ordinary shares created) 1 356 000 shares at 2,5 cents 1 356 34
Closing balance 31 December 2005 42 614 1 065
SHARE PREMIUMMovements in share premium during the year are shown below:
2005 2004R’000 R’000
Opening balance 1 January 2005 34 694 56 747Employee combined option/deferred payment scheme 1 356 123 ordinary shares created as shown below:
– Employee combined option payment scheme 5 000 ordinary shares created at a premium of R3,225 per share 16 29
– Employee combined option/deferred payment scheme 296 000 created at a premium of R6,325 per share 1 872 –
– Employee combined option/deferred payment scheme 2 500 created at a premium of R6,775 per share 17 –
– Employee combined option/deferred payment scheme 14 500 created at a premium of R7,975 per share 116 210
– Employee combined option/deferred payment scheme 150 000 created at a premium of R8,825 per share 1 324 2 787
– Employee combined option/deferred payment scheme 5 000 created at a premium of R9,975 per share 50 –
– Employee combined option/deferred payment scheme 18 750 created at a premium of R10,375 per share 195 1 175
– Employee combined option/deferred payment scheme 3 600 created at a premium of R11,475 per share 41 –
– Employee combined option/deferred payment scheme 4 890 created at a premium of R11,875 per share 58 303
– Employee combined option/deferred payment scheme 826 883 created at a premium of R11,975 per share 9 902 5 616
– Employee combined option/deferred payment scheme 1 000 created at a premium of R12,975 per share 13 –
– Employee combined option/deferred payment scheme 12 000 created at a premium of R13,475 per share 162 –
– Employee combined option/deferred payment scheme 16 000 created at a premium of R13,725 per share 219 –
– Capital distribution July 2004 54 cents and November 2004 25 cents – (32 173)
Closing balance 31 December 2005 48 679 34 694

35ADCORPANNUAL REPORT 05
DIVIDENDOn 8 March 2006, the board declared a dividend of 105 cents (2004: 80 cents) per share which, together with the interimdividend of 35 cents per share, results in a total distribution in respect of the 2006 financial year of 140 cents per share.
The dividend of 105 cents per share was paid on 10 April 2006.
STRATEAdcorp dematerialised its issued shares with effect from 9 July 2001 since which time settlement of any trade on oroutside of the JSE can only be done in electronic format. All shareholders were circulated with a brochure at the timegiving details of how to go about dematerialising their shares. Despite this, a number of shares remain in certificate formatand will have to be dematerialised before they may be traded. Adcorp’s company secretary may be contacted should ashareholder require advice on the dematerialisation of their share certificates.
ADCORP EMPLOYEE SHARE OPTION SCHEMEThe Adcorp Share Option Scheme was introduced in 1987 and expanded during 1989 to include a share purchasescheme and again in 1994 to allow for the creation of a combined option/deferred payment scheme. The total numberof shares in the various schemes may not exceed 15% of the total number of shares in issue. In terms of clause 6.4 of theTrust Deed the total number of shares available to the schemes as at 31 December 2005 is a maximum of 6 392 156(2004: 6 188 738).
Options to purchase shares have been granted on 1 410 942 shares as at 31 December 2005. These options have eitheralready vested or will vest on 31 May 2006 and may therefore be paid for and converted into shares at any time at theoption of the relevant employees.
As the existing share scheme has become expensive when considering the cost to shareholders versus the benefit toemployees, it was decided not to issue share options during 2005 but rather to create a similar benefit which would besettled in cash rather than shares. This is a temporary arrangement as Adcorp is currently investigating the possibility ofintroducing a new share scheme which will be more beneficial to shareholders in that fewer shares will be required inorder to create the same benefit to the employee. A circular will be sent to shareholders in due course outlining theproposed share scheme.
Movements for the year in the Adcorp Employee Share Option Scheme appear below:
Opening balance 2005 Options granted/(cancelled)/(exercised) 2005 Closing balance 2005
Date Quantity Quantity
option Quantity (can- (exer-
Quantity Price Value granted granted Forfeited celled) cised) Price Value Quantity Price Value
9 600 3,25 31 200 – – – – (5 000) – – 4 600 3,25 14 950
419 000 6,35 2 660 650 – – (5 000) – (296 000) – – 118 000 6,35 749 300
2 500 6,80 17 000 – – – – (2 500) – – – 6,80 –
14 500 8,00 116 000 – – – – (14 500) – – – 8,00 –
265 000 8,85 2 345 250 – – – – (150 000) – – 115 000 8,85 1 017 750
5 000 10,00 50 000 – – – – (5 000) – – – 10,00 –
20 250 10,40 210 600 – – – – (18 750) – – 1 500 10,40 15 600
3 600 11,50 41 400 – – – – (3 600) – – – 11,50 –
81 582 11,90 970 826 – – – – (4 890) – – 76 692 11,90 912 635
1 378 833 12,00 16 545 996 – – (9 550) (130 000) (826 883) – – 412 400 12,00 4 948 800
652 750 13,00 8 485 750 – – – – – – – 652 750 13,00 8 485 750
1 000 13,00 13 000 – – – – (1 000) – – – 13,00 –
12 000 13,50 162 000 – – – – (12 000) – – – 13,50 –
46 000 13,75 632 500 – – – – (16 000) – – 30 000 13,75 412 500
5 000 18,50 92 500 – – (5 000) – – – – – 18,50 –
2 916 615 32 374 672 – Nil (19 550) (130 000) (1 356 123) – – 1 410 942 16 557 285
36 ADCORPANNUAL REPORT 05
DIRECTORS’ REPORTfor the year ended 31 December 2005
ADCORP EMPOWERMENT SHARE TRUSTThe above trust owns 141 920 Adcorp shares of which 35 302 shares were unallocated as at 31 December 2005 as a resultof employees leaving the group. These will be re-allocated during 2006. The earliest years at which these options can bepaid for and the shares transferred into the employee’s name are as follows:2006 86 6182007 20 000 Unallocated* 35 302
Total 141 920
PDI opening balance 2005 Options granted/(cancelled)/(exercised) 2005 PDI closing balance 2005
Date Quantity Quantity
option Quantity (can- (exer-
Quantity Price Value granted granted Forfeited celled) cised) Price Value Quantity Price Value
55 000 6,35 349 250 21/01/03 – (5 000) – (40 000) – – 10 000 6,35 63 500
25 000 7,50 187 500 28/07/03 – – – (25 000) – – – 7,50 –
86 168 8,85 762 587 – – (31 168) – (25 132) – – 29 868 8,85 264 332
30 000 11,80 354 000 – – – – (30 000) – – – 11,80 –
49 750 13,00 646 750 24/06/04 – (3 000) – – – – 46 750 13,00 607 750
– – – 31/05/05 10 000,00 – – – – – 10 000 18,00 180 000
– – – 21/11/05 10 000,00 – – – – – 10 000 18,15 181 500
245 918 – 2 300 087 – 20 000,00 (39 168) – (120 132) – – 106 618 – 1 297 082
16 134 – – – – – – – – – 35 302* – –
262 052 – 2 300 087 – – – – – – – 141 920 – 1 297 082
* Unallocated as at 31 December 2005. These shares have been allocated subsequent to year-end.
SUBSIDIARIES AND ASSOCIATESDetails of the company’s operating subsidiaries and associates are set out in Annexure A on page 66.
The summarised attributable interest of the company in the profits and losses of its subsidiary companies is as follows:
2005 2004R’000 R’000
Total profit after taxation 101 237 195 189Total losses after taxation (19 428) (56 419)Total losses after taxation from disposed operations – (475)
81 809 138 295

37ADCORPANNUAL REPORT 05
SIGNIFICANT SHAREHOLDERSDetails of significant shareholders are included on page 28.
SUBSEQUENT EVENTSSubsequent to year-end no events took place which require any further information to be communicated.
SPECIAL RESOLUTIONSNo special resolutions were passed during 2005.
STATUTORY INFORMATIONThe company was incorporated in the Republic of South Africa on 16 July 1974. The registration number is 1974/001804/06.For details of the registered office, company secretary and auditors refer to inside back cover.
DIRECTORS’ REMUNERATION AND INTERESTDetails of directors’ remuneration and interests appear in notes 42 and 43 on pages 62 and 63 of the annual financialstatements.
DIRECTORATE AND SECRETARYThe names of the directors and company secretary are set out on pages 16 to 19 and 30 respectively. There were nochanges to the directorate during 2005.

38 ADCORPANNUAL REPORT 05
BALANCE SHEETSas at 31 December 2005
GROUP COMPANY
2005 2004* 2005 2004*Notes R’000 R’000 R’000 R’000
ASSETSNon-current assets 119 723 141 541 385 264 401 362
Property and equipment 4 34 667 49 501 1 455 513Intangible assets 5 13 708 3 140 – –Goodwill 6 42 015 60 802 – –Investment in subsidiaries 7 – – 379 473 395 450Investment in associates 8 4 092 3 550 1 528 1 529Other financial assets 9 – – 2 569 3 865Deferred taxation 10 25 241 24 548 239 5
Current assets 438 307 349 035 139 811 119 782
Trade and other receivables 11 354 562 258 213 4 728 3 013Amounts due by subsidiary companies 12 – – 131 566 113 674Taxation prepaid 8 302 6 821 3 516 3 093Bank balances, cash and deposits 75 443 84 001 1 2
TOTAL ASSETS 558 030 490 576 525 075 521 144
EQUITY AND LIABILITIESCapital and reserves 252 162 219 015 218 230 186 218
Share capital 13 1 065 1 031 1 065 1 031Share premium 14 48 679 34 694 48 679 34 694Treasury shares 15 (2 127) (4 205) – –Non-distributable reserve 16 – – 119 918 119 918Share-based payments reserve 17 2 821 1 318 2 821 1 318Accumulated profit 199 268 183 107 45 747 29 257Minority shareholders’ interest 2 379 1 367 – –BEE shareholders’ interest 18 77 1 703 – –
Non-current liabilities 7 318 6 887 581 181
Non-interest-bearing non-current liabilities 19 5 541 6 887 581 181Deferred tax 10 1 777 – – –
Current liabilities 298 550 264 674 306 264 334 745
Non-interest-bearing current liabilities 241 837 179 329 250 683 251 357
Trade and other payables 20 169 513 127 541 17 559 14 57412 – – 225 525 231 993
Amounts due to vendor 21 2 187 3 500 – –Provisions 22 58 523 46 243 6 599 4 790Taxation 11 614 2 045 1 000 –
Interest-bearing current liabilities 56 713 85 345 55 581 83 388
Bank overdrafts 56 713 85 345 55 581 83 388
TOTAL EQUITY AND LIABILITIES 558 030 490 576 525 075 521 144
* Restated – refer note 39.

39ADCORPANNUAL REPORT 05
INCOME STATEMENTSfor the year ended 31 December 2005
GROUP COMPANY
2005 2004* 2005 2004*Notes R’000 R’000 R’000 R’000
REVENUE 23 2 359 652 1 980 116 – –Cost of sales 25 (1 650 708) (1 375 106) – –
GROSS PROFIT 708 944 605 010 – –Other income 26 20 358 25 532 23 036 18 064Administration expenses (238 923) (215 047) (26 782) (21 673)Marketing and selling expenses (298 052) (254 781) (2 033) (2 620)Other operating expenses (75 920) (75 221) (1 034) (375)
OPERATING PROFIT/(LOSS) 27 116 407 85 493 (6 813) (6 604)Interest received 28 2 587 5 361 8 819 10 584Interest paid 29 (4 026) (7 728) (6 891) (9 925)Dividends received – – 48 625 12 483Share of profits from associates 3 294 2 222 – –Impairment of goodwill and investment in subsidiary (19 112) (1 224) (19 410) (59)Profit/(loss) on disposal of property and equipment 3 322 (94) – (155)Loss on disposal of operations and subsidiaries (333) (5 565) (1 048) (5 565)Loss on loans to subsidiaries written off – – – (18 842)
PROFIT/(LOSS) BEFORE TAXATION 102 139 78 465 23 282 (18 083)Taxation 30 (35 010) (19 132) (6 792) (441)
PROFIT/(LOSS) FOR THE YEAR 67 129 59 333 16 490 (18 524)
Profit/(loss) for the yearAttributable to:Ordinary shareholders 65 185 56 917 16 490 (18 524)Minority shareholders 1 012 898 – –BEE shareholders 932 1 518 – –
Profit/(loss) for the year 67 129 59 333 16 490 (18 524)
EARNINGS PER SHAREBasic (cents) 31 156,2 141,2 – –Diluted (cents) 31 154,8 139,8 – –
DISTRIBUTION TO SHAREHOLDERS DURING THE YEAR 31 105 80 – –
– interim prior year capital distribution (cents) – 25 – –– interim dividend (cents) 35 – – –– final dividend (cents) in respect of prior year 80 54 – –
* Restated – refer to note 39.

40 ADCORPANNUAL REPORT 05
STATEMENT OF CHANGES IN EQUITYfor the year ended 31 December 2005
Share Minority BEENon-distri- based share- share- Accumu-
Share Share Treasury butable payments holders’ holders’ latedcapital premium shares reserve reserve interest interest profit Total
R’000 R’000 R’000 R’000 R’000 R’000 R’000 R’000 R’000
GROUPBalance as at 1 January 2004 1 007 56 747 (4 454) – – – – 133 407 186 707Prior year adjustments:
Leave pay provision – – – – – – – (6 510) (6 510)Operating lease rentaltiming adjustment – – – – – – – (1 800) (1 800)Taxation effect of above adjustments – – – – – – – 1 905 1 905
Minority shareholders’ interest reclassified – – – – – 603 – – 603
BEE shareholders’ interest reclassified – – – – – – 185 – 185
IFRS transition adjustmentsImpairment of goodwill – – – – – – – (4 854) (4 854)Adjustment of fixedproperty residual value – – – – – – – 4 396 4 396Share-based payments – – – – 355 – – (355) –
Restated balance at 1 January 2004 1 007 56 747 (4 454) – 355 603 185 126 189 180 632Shares issued 24 10 120 – – – – – – 10 144Capital distribution July and November 2004 – (32 173) 209 – – – – – (31 964)Treasury shares sold – – 40 – – – – – 40Minority shareholders’interest – – – – – 764 – (897) (133) BEE share of super profits – – – – – – 1 518 (1 518) –Share-based payments – – – – 963 – – – 963Profit for the year – – – – – – – 59 333 59 333
Restated balance at 31 December 2004 1 031 34 694 (4 205) – 1 318 1 367 1 703 183 107 219 015Shares issued 34 13 985 – – – – – – 14 019Treasury shares sold – – 1 800 – – – – (782) 1 018Dividend distributions – – 278 – – – (2 186) (48 242) (50 150)BEE share of super profits – – – – – – 932 (932) –Minority shareholders’ share of profits – – – – – 1 012 – (1 012) –Payments made to BEE shareholders – – – – – – (372) – (372)Share-based payments – – – – 1 503 – – – 1 503Profit for the year – – – – – – – 67 129 67 129
Balance as at 31 December 2005 1 065 48 679 (2 127) – 2 821 2 379 77 199 268 252 162
COMPANYBalance as at 1 January 2004 1 007 56 747 – 176 840 – – – 52 159 286 753IFRS transition adjustments
Impairment of goodwill – – – (56 922) – – – (4 190) (61 112)Operating lease rental timing adjustments – – – – – – – (1) (1)Share-based payments – – – – 355 – – (188) 167
Restated balance at 1 January 2004 1 007 56 747 – 119 918 355 – – 47 780 225 807Shares issued 24 10 120 – – – – – – 10 144Capital distribution July and November 2004 – (32 173) – – – – – – (32 173)Share-based payments – – – – 963 – – 1 964Loss for the year – – – – – – – (18 524) (18 524)
Restated balance at 31 December 2004 1 031 34 694 – 119 918 1 318 – – 29 257 186 218Shares issued 34 13 985 – – – – – – 14 019Share-based payments – – – – 1 503 – – – 1 503Profit for the year – – – – – – – 16 490 16 490
Balance as at 31 December 2005 1 065 48 679 – 119 918 2 821 – – 45 747 218 230

41ADCORPANNUAL REPORT 05
CASH FLOW STATEMENTSfor the year ended 31 December 2005
GROUP COMPANY
2005 2004* 2005 2004*Notes R’000 R’000 R’000 R’000
OPERATING ACTIVITIESProfit/(loss) before taxation and dividends 102 139 78 465 23 282 (5 600)Adjusted for:
Dividends received – – (48 625) (12 483)Depreciation 15 248 13 381 313 306Impairment of goodwill and investment in subsidiary 19 112 1 224 19 410 59Loss on disposal of businesses 333 5 565 (1 048) 5 565(Profit)/loss on disposal of property and equipment (3 322) 94 – (155)Share of profits from associates (3 294) (2 222) – –Share-based payments expense 1 503 962 660 445Prior year adjustment – leave pay – 1 512 – –Non-cash portion of operating lease rentals 1 656 1 393 148 18Interest paid 4 026 7 728 6 891 9 925Interest received (2 587) (5 361) (8 819) (10 584)
Cash generated/(utilised) by operating activities before working capital changes 134 814 102 741 (7 788) (12 504)
Increase in trade and other receivables (96 349) (44 198) (1 715) (1 109)Increase/(decrease) in trade and other payables 54 252 29 388 5 046 (1 944)Net movement in holding and fellow subsidiaries account – – (23 517) 51 481
CASH GENERATED/(UTILISED) BY OPERATIONS 92 717 87 931 (27 974) 35 924
Interest paid (3 864) (7 728) (6 891) (9 925)Interest received 2 587 5 279 8 819 10 584Taxation paid 44 (26 210) (24 148) (6 449) (1 464)Dividend/capital distribution paid 45 (46 996) (31 964) 48 625 (32 173)
Net cash retained by operations 18 234 29 370 16 130 2 946
INVESTMENT ACTIVITIES (12 222) (19 397) (3 639) 3 006
Additions to property and equipment 46 (29 086) (20 823) (1 255) (289)Proceeds from sale of property and equipment 21 425 1 298 – 155Outflow on disposal of businesses 47 (333) (550) – –Acquisition of business 48 (325) (1 517) – –Purchase/increase in investments (33) (168) (2 384) (2 619)Vendor loan repayments (3 500) – – 2 407Net movement in loans and advances (370) 2 363 – 3 352
6 012 9 973 12 491 5 952FINANCE ACTIVITIES 14 062 10 815 15 315 10 144
Issue of shares 15 039 10 184 15 315 10 144(Decrease)/increase in non-current interest-bearing liabilities (977) 631 – –
Net increase in cash and cash equivalents 20 074 20 788 27 806 16 096Net cash and cash equivalents at the beginning of the year (1 344) (22 132) (83 386) (99 482)
Net cash and cash equivalents at the end of the year 49 18 730 (1 344) (55 580) (83 386)
* Restated – refer note 39.
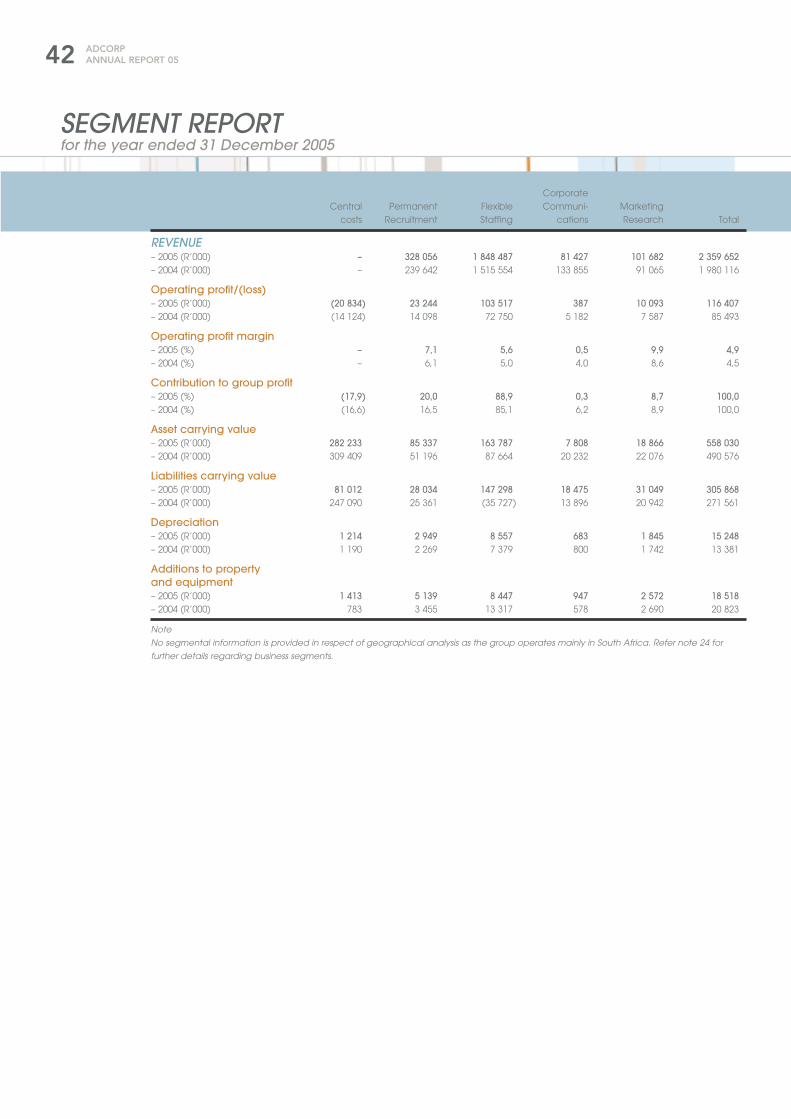
42 ADCORPANNUAL REPORT 05
SEGMENT REPORTfor the year ended 31 December 2005
CorporateCentral Permanent Flexible Communi- Marketing
costs Recruitment Staffing cations Research Total
REVENUE– 2005 (R’000) – 328 056 1 848 487 81 427 101 682 2 359 652– 2004 (R’000) – 239 642 1 515 554 133 855 91 065 1 980 116
Operating profit/(loss)– 2005 (R’000) (20 834) 23 244 103 517 387 10 093 116 407– 2004 (R’000) (14 124) 14 098 72 750 5 182 7 587 85 493
Operating profit margin– 2005 (%) – 7,1 5,6 0,5 9,9 4,9– 2004 (%) – 6,1 5,0 4,0 8,6 4,5
Contribution to group profit– 2005 (%) (17,9) 20,0 88,9 0,3 8,7 100,0– 2004 (%) (16,6) 16,5 85,1 6,2 8,9 100,0
Asset carrying value– 2005 (R’000) 282 233 85 337 163 787 7 808 18 866 558 030– 2004 (R’000) 309 409 51 196 87 664 20 232 22 076 490 576
Liabilities carrying value– 2005 (R’000) 81 012 28 034 147 298 18 475 31 049 305 868– 2004 (R’000) 247 090 25 361 (35 727) 13 896 20 942 271 561
Depreciation– 2005 (R’000) 1 214 2 949 8 557 683 1 845 15 248– 2004 (R’000) 1 190 2 269 7 379 800 1 742 13 381
Additions to propertyand equipment– 2005 (R’000) 1 413 5 139 8 447 947 2 572 18 518– 2004 (R’000) 783 3 455 13 317 578 2 690 20 823
Note
No segmental information is provided in respect of geographical analysis as the group operates mainly in South Africa. Refer note 24 for
further details regarding business segments.

43ADCORPANNUAL REPORT 05
NOTES TO THE ANNUAL FINANCIAL STATEMENTSfor the year ended 31 December 2005
1. ADOPTION OF NEW AND REVISED INTERNATIONAL FINANCIAL REPORTING STANDARDS (“IFRS”)In the current year, the group has adopted all new and revised standards (IFRS) that were effective at 31 December2005 and are relevant to its operations. The adoption of these new and revised standards has resulted in changes tothe group’s accounting policies in the following areas that have affected the amounts reported for the currentand prior years:• share-based payments (IFRS2);• goodwill (IFRS3);• property, plant and equipment (IAS16).
In accordance with IFRS1 (First time adoption of IFRS) the group elected to apply the above standards retrospectively.
The impact of these changes in accounting policies is discussed in note 39.
At the date of authorisation of these financial statements, the following standards and interpretations were in issue butnot yet effective: IFRS7 Financial Instruments: DisclosuresIFRIC4 Determining whether an arrangement contains a leaseIFRIC8 Scope of IFRS2IFRIC9 Reassessment of embedded derivatives
2. SIGNIFICANT ACCOUNTING POLICIESThe financial statements have been prepared in accordance with International Financial Reporting Standards (IFRS).
The financial statements have been prepared on the historical cost basis, except for the revaluation of certainfinancial instruments and incorporate the following principal accounting policies. In all material respects, thesepolicies have been followed by all companies in the group.
Basis of consolidationThe consolidated financial statements incorporate the financial statements of the company and entities controlledby the company (its subsidiaries). Control is achieved where the company has the power to govern the financialand operating policies of an entity so as to obtain benefits from its activities.
All intergroup transactions, balances, income and expenses have been eliminated upon consolidation.
All shares and investments are held at fair value and are reviewed annually to determine any impairment.
The results of subsidiaries acquired or disposed of during the year are included in the consolidated incomestatement from the effective date of acquisition or up to the effective date of disposal, as is appropriate.
Business combinationsThe acquisition of subsidiaries is accounted for using the purchase method. The cost of the acquisition is measuredat the aggregate of the fair values, at the date of exchange, of assets given, liabilities incurred or assumed, andequity instruments issued by the group in exchange for control of the acquiree, plus any costs directly attributableto the business combination. The acquiree's assets, liabilities and contingent liabilities that meet the conditions forrecognition under IFRS3 are recognised at their fair values at the acquisition date.
Goodwill arising on acquisition is recognised as an asset and initially measured at cost, being the excess of thecost of the business combination over the group's interest in the fair value of identifiable assets, liabilities andcontingent liabilities recognised. If, after reassessment, the group's interest in the net fair value of the acquiree’sidentifiable assets, liabilities and contingent liabilities exceeds the cost of the business combination, the excess isrecognised immediately in profit or loss.
The interest of minority shareholders in the acquiree is initially measured at the minority's portion of the net fairvalue of the assets, liabilities and contingent liabilities recognised.
Investment in associatesAn associate is an entity over which the group has significant influence and that is neither a subsidiary nor aninterest in a joint venture. Significant influence is defined as the ability to participate in the financial and operatingpolicy decisions of the investee.
The results and assets and liabilities of associates are incorporated in these financial statements using the equitymethod of accounting. The carrying amounts of such investments are reduced to recognise any decline, otherthan a temporary decline, in the value of individual investments.
Where a group enterprise transacts with an associate of the group, unrealised profits and losses are eliminated tothe extent of the group’s interest in the relevant associate, except where unrealised losses provide evidence of animpairment of the asset transferred.
TaxationIncome tax expense represents the sum of the tax currently payable and deferred tax.
The tax currently payable is based on taxable profit for the year. Taxable profit differs from profit as reported in theincome statement because it excludes items of income or expense that are taxable or deductible in other yearsand it further excludes items that are never taxable or deductible. The group’s liability for current tax is calculatedusing tax rates that have been enacted or substantively enacted by the balance sheet date.

44 ADCORPANNUAL REPORT 05
NOTES TO THE ANNUAL FINANCIAL STATEMENTSfor the year ended 31 December 2005
2. SIGNIFICANT ACCOUNTING POLICIES (continued)Deferred tax is recognised on the differences between the carrying amounts of assets and liabilities in the financialstatements and the corresponding tax bases used in the computation of taxable profit, and is accounted for using thebalance sheet liability method. Deferred tax liabilities are generally recognised for all taxable temporary differencesand deferred tax assets are recognised to the extent that it is probable that taxable profits will be available againstwhich deductible temporary differences can be utilised. Such assets and liabilities are not recognised if the temporarydifference arises from goodwill or from the initial recognition (other than in a business combination) of the other assetsand liabilities in a transaction that affects neither the taxable profit nor the accounting profit.
The carrying amount of the deferred tax asset is reviewed at each balance sheet date and reduced to theextent that it is no longer probable that sufficient taxable profits will be available to allow all or part of the assetto be recovered.
Deferred tax is calculated at the tax rates that are expected to apply in the period when the liability is settled orthe asset realised. Deferred tax is charged or credited to profit or loss, except when it relates to items chargedor credited directly to equity, in which case the deferred tax is also dealt with in equity.
Deferred tax assets and liabilities are offset when there is a legally enforceable right to set off current tax assetsagainst current tax liabilities and when they relate to income taxes levied by the same taxation authority andthe group intends to settle its current tax assets and liabilities on a net basis.
Property and equipmentProperty and equipment is stated at cost less accumulated depreciation and any recognised impairment losses.
Depreciation is charged so as to write off the cost or valuation of the asset over their estimated useful lives to itsresidual value, using the straight-line method, on the following basis:Computers and office equipment 20% – 33%Furniture and fittings 10% – 16,7%Buildings owned and occupied 2,86%Land is not depreciated
Assets held under finance leases are depreciated over their expected useful lives on the same basis as ownedassets or, where shorter, over the term of the relevant lease.
The gain or loss arising on the disposal or retirement of an asset is determined as the difference between the saleproceeds and the carrying amount of the asset and is recognised in income.
GoodwillGoodwill arising on consolidation represents the excess of the cost of acquisition over the group’s interest in the fairvalue of the identifiable assets, liabilities and contingent liabilities of a subsidiary, associate or jointly controlledentity at the date of acquisition.
Goodwill is recognised as an asset and tested for impairment on an annual basis. The valuation of goodwill is doneon a discounted cash flow basis and compared to the carrying value on an annual basis. Any impairment isrecognised immediately in profit or loss and is not subsequently reversed.
The group has discontinued amortising goodwill.
On disposal of a subsidiary, associate or jointly controlled entity, the attributable amount of goodwill is included inthe determination of the profit or loss on disposal.
Goodwill arising on acquisitions before the date of transition to IFRSs has been retained at the previous SA GAAPamounts subject to being tested for impairment at that date.
Impairment of assets (excluding goodwill)The carrying amounts of the group’s assets are reviewed at each balance sheet date to determine whetherthere is any indication of impairment. If there is any indication that an asset may be impaired, its recoverableamount is estimated.
The recoverable amount is the higher of its net selling price and its value in use. An impairment loss is recognisedwhenever the carrying amount of the asset exceeds its recoverable amount.
Where an impairment loss subsequently reverses, the carrying amount of the asset is increased to the revisedestimate of its recoverable amount, to the extent that the carrying amount does not exceed the carrying amountthat would have been determined had no impairment loss been recognised for the asset in the prior years.

45ADCORPANNUAL REPORT 05
Revenue recognitionRevenue comprises mainly of the invoice value of services rendered to customers, as well as commission receivedand training course income. Revenue excludes value added tax.
Revenue is recognised at the date the services are rendered.
Revenue is measured at the fair value of the consideration received or receivable and represents amountsreceivable for goods and services provided in the normal course of business, net of discounts and sales related taxes.
Investment incomeInvestment income is recognised on the accrual basis by reference to the principal outstanding and the effectiveinterest rates applicable.
Cost of salesCost of sales consists of direct costs of temporary assignees, advertising costs incurred in recruitment and directexpenditure in respect of public relations, research and training courses.
LeasesLeases are classified as finance leases whenever the terms of the lease transfer substantially all the risks andrewards of ownership to the lessee. All other leases are classified as operating leases.
Assets held under finance leases are recognised as assets of the group at their fair value at the inception of the leaseor, if lower, at the present value of the minimum lease payments. The corresponding liability to the lessor is included inthe balance sheet as a finance lease obligation. Lease payments are apportioned between finance charges andreduction of the lease obligation so as to achieve a constant rate of interest on the remaining balance of the liability.Finance charges are charged to profit or loss, unless they are directly attributable to qualifying assets, in which casethey are capitalised in accordance with the group's general policy on borrowing costs.
Rentals payable under operating leases are charged to profit or loss on a straight-line basis, after allowing for fixedescalations, over the term of the relevant lease.
Foreign currency transactionsTransactions in foreign currencies are accounted for at the rates of exchange ruling on the date of thetransactions. Gains and losses arising from the settlement of such transactions are recognised in theincome statement.
Borrowing costsBorrowing costs are recognised in profit or loss in the period in which they are incurred.
Government grantsGovernment grants towards staff training costs are recognised in profit or loss over the periods necessary to matchthem with the related costs and are deducted in reporting the related expense.
Employee benefitsThe company’s contributions to defined contribution plans (either provident or pension funds) in a particularperiod are recognised as an expense in that period.
Contributions to the medical aid are recognised as an expense in the period during which the related servicesare rendered.
All employee benefits cease on termination of employment, except for Research Surveys (Pty) Limited thatprovides post-employment subsidy of healthcare benefits to certain employees. The post-employment liabilityis calculated in terms of IAS19 (Employee Benefits) and the expense is recognised in profit or loss.
ProvisionsProvisions are recognised when the group has a present obligation as a result of a past event and it is probablethat this will result in an outflow of economic benefits that can be reliably estimated.
Share-based paymentsThe group has complied with the requirements of IFRS2 Share-based Payments. In accordance with the transitionalprovisions, IFRS2 has been applied retrospectively to all grants of equity instruments after 7 November 2002 thatwere unvested as of 1 January 2005 and to all liabilities for share-based transactions existing at 1 January 2005.The standard therefore applies to share options granted in 2004 and 2005.
The group has issued equity-settled and cash-settled share based payments to certain employees. Equity-settledshare-based payments are measured at fair value at the date of grant. The fair value determined at the grantdate of the equity-settled share-based payments is expensed on a straight-line basis over the vesting period,based on the group’s estimate of shares that will eventually vest.
46 ADCORPANNUAL REPORT 05
NOTES TO THE ANNUAL FINANCIAL STATEMENTSfor the year ended 31 December 2005
2. SIGNIFICANT ACCOUNTING POLICIES (continued)Share-based payments (continued)Fair value is measured by use of the Black-Scholes model. The expected life used in this model has been adjusted,based on management’s best estimate, for the effects of non-transferability, exercise restrictions and behaviouralconsiderations.
For cash-settled share-based payments, a liability equal to the portion of the goods or services received isrecognised at the current fair value determined at each balance sheet date.
Financial instrumentsFinancial assets and financial liabilities are recognised in the group’s balance sheet when the group has becomeparty to contractual provisions of the instrument.
Proceeds from disposals which are not due within one year have been discounted to net present value.
Trade and other receivablesTrade and other receivables do not carry any interest and are stated at their nominal value. Trade and otherreceivables are reduced by appropriate allowances for estimated irrecoverable amounts.
Trade and other payablesTrade and other payables do not carry any interest and are stated at their nominal value.
InvestmentsInvestments in securities are recognised on a trade date basis and are initially measured at cost. Investments areclassified as either held for trading or available-for-sale, and are measured at subsequent reporting dates at fair value,based on quoted market prices at the balance sheet date. Where securities are held for trading purposes, unrealisedgains and losses are included in net profit or loss for the period. For available-for-sale investments, unrealised gains orlosses are recognised directly in equity, until the security is disposed of or is determined to be impaired, at which timethe cumulative gain or loss previously recognised in equity is included in the net profit or loss for the period. Proceedsfrom disposals which are not due within one year have been discounted to net present value.
Cash and cash equivalentsCash and cash equivalents comprise cash on hand and demand deposits, and other short-term highly liquidinvestments that are readily convertible to a known amount of cash and are subject to an insignificant risk ofchanges in value.
Bank borrowingsInterest-bearing bank loans and overdrafts are recorded as the proceeds received, net of direct issue costs.Finance charges, including premiums payable on settlement or redemption, are accounted for on an accrualbasis and are added to the carrying amount of the instrument to the extent that they are not settled in the periodin which they arise.
Equity instrumentsEquity instruments are recorded as the proceeds received, net of direct issue costs.
Derivative financial instruments and hedge accountingDerivative financial instruments are initially recorded at cost and are remeasured to fair value at subsequentreporting dates. Changes in the fair value of derivative financial instruments that are designated and effective ascash flow hedges are recognised directly in equity. Amounts deferred in equity are recognised in the incomestatement in the same period in which the hedged firm commitment or forecast transaction affects net profit or loss.
Changes in the fair value of derivative financial instruments that do not qualify for hedge accounting arerecognised in the income statement as they arise.
3. CRITICAL ACCOUNTING JUDGEMENTS AND KEY SOURCES OF ESTIMATION UNCERTAINTYCritical judgements in applying the group’s accounting policiesIn the process of applying the group’s accounting policies, which are described in note 2, management has madethe following judgements that have a significant effect on the amounts recognised in the financial statements:
Allowance for bad debtsThe allowance was measured at the group’s best estimate of future unrecoverable trade receivables, taking intoaccount circumstances prevailing at year-end. Details of the allowance are provided in note 11.
Provision for leave payIn making its judgement, the provision for leave pay was measured at the group’s best estimate of theexpenditure required to settle the obligation at balance sheet date in accordance with the Basic Conditions ofEmployment Act. Details of the provision for leave pay are provided in note 22.

47ADCORPANNUAL REPORT 05
3. CRITICAL ACCOUNTING JUDGEMENTS AND KEY RESOURCES OF ESTIMATION UNCERTAINTY(continued)Key sources of estimation uncertaintyImpairment of goodwillDetermining whether goodwill is impaired requires an estimation of the value in use of the cash-generating units towhich goodwill is allocated. The value in use calculation requires the entity to estimate future cash flows expectedto arise from the cash-generating unit and to determine a suitable discount rate in order to calculate presentvalue. Details of the impairment of goodwill are provided in note 6.
Share-based paymentsDetermining the value of share-based payments to be expensed requires an estimation using the Black-Scholespricing model. The model has been adjusted, based on management’s best estimate, for the effects of non-transferability, exercise restrictions and behavioural consideration. Details of share-based payments andassumptions used are provided in note 38.
Land, Computerbuildings and office
and equipment,leasehold furniture
improve- andments fittings Total Total*
2005 2005 2005 2004R’000 R’000 R’000 R’000
4. PROPERTY AND EQUIPMENTGROUPBalance at the beginning of the year 17 976 31 525 49 501 43 451
Assets at cost 17 976 76 677 94 653 81 920Accumulated depreciation – (45 152) (45 152) (38 469)
Current year movementsAdditions – 17 982 17 982 20 570Improvements 536 – 536 253Disposals (16 874) (1 230) (18 104) (1 392)
Cost (16 874) (7 080) (23 954) (6 506)Accumulated depreciation – 5 850 5 850 5 114
Depreciation (38) (15 210) (15 248) (13 381)
Net book value at the end of the year 1 600 33 067 34 667 49 501
Represented by:Assets at cost 1 638 87 579 89 217 96 237Accumulated depreciation (38) (54 512) (54 550) (46 736)
Net book value at the end of the year 1 600 33 067 34 667 49 501
COMPANYBalance at the beginning of the year – 513 513 530
Assets at cost – 2 918 2 918 2 630Accumulated depreciation – (2 405) (2 405) (2 100)
Current year movementsAdditions 403 852 1 255 289Depreciation (27) (286) (313) (306)
Net book value at the end of the year 376 1 079 1 455 513
Represented by:Assets at cost 403 3 770 4 173 2 919Accumulated depreciation (27) (2 691) (2 718) (2 406)
Net book value at the end of the year 376 1 079 1 455 513
* Restated – refer note 39.

48 ADCORPANNUAL REPORT 05
NOTES TO THE ANNUAL FINANCIAL STATEMENTSfor the year ended 31 December 2005
GROUP COMPANY
2005 2004* 2005 2004*R’000 R’000 R’000 R’000
4. PROPERTY AND EQUIPMENT (continued)4.1 Computer and office equipment,
furniture and fittings 33 067 31 525 1 079 513
Cost 87 579 76 677 3 770 2 919Accumulated depreciation (54 512) (45 152) (2 691) (2 406)
4.2 Land, buildings and leasehold improvements 1 600 17 976 376 –
Cost 1 638 17 976 403 –Accumulated depreciation (38) – (27) –
4.3 Land, buildings and leasehold improvements4.3.1 Land and buildings
Owner occupied at cost 1 638 17 976 403 –
Total cost Stand 948 – 16 860 – –
Land – 1990 1 275 1 275 –Buildings – 1991 4 900 4 900 – –
– 1992 6 240 6 240 – –– 1993 3 935 3 935 – –
Improvements – 1993 180 180 – –– 1994 96 98 – –– 2004 234 232 – –– 2005 14 – – –
Stand 948, Melville,Johannesburg, Gauteng was disposed of during 2005 (16 874) – – –
4.3.2 Land and buildings – 1995 at costErf 715, Melville, Johannesburg, Gauteng 390 390 – –
4.3.3 Land and buildings – 1998 at cost 614 599 – –
22 Swart Street, Kempton Park Ext 2 489 489 – –Improvements – 2001 110 110 – –
– 2005 15 – – –
4.3.4 Land and buildings – Erf 14 Sunnyside 210 106 – –
(Johannesburg) Townships 106 106 – –Improvements – 2005 104 – – –
4.3.5 Leasehold improvements 424 21 403 –
Improvements – 2004 21 21 – –– 2005 403 – 403 –
5. INTANGIBLE ASSETSCost 13 708 3 140 – –
Balance at beginning of year 3 140 – – –Recognised on acquisition of Margie Middleton and Associates being learning programmes, NQF accreditations, methodologies and tool development. – 3 140 – –
Computer software in progress 10 568 – – –The balance represents costs incurred to date on the development of the Axapta Management System. The system is currently in the process of development and is not in use. No amortisation has been recorded for the current year. Once in use, it is intended to amortise the software over its estimated useful life of five years.
At the end of the year 13 708 3 140 – –
* Restated – refer note 39.

49ADCORPANNUAL REPORT 05
GROUP COMPANY
2005 2004* 2005 2004*R’000 R’000 R’000 R’000
6. GOODWILLCostOpening balance 66 616 89 370 – –Elimination of amortisation accumulated prior to the adoption of IFRS3 – (21 060)Add: Goodwill acquired during current year 325 3 896 – –Less: Goodwill disposed of – (5 590) – –
Closing balance 66 941 66 616 – –
AmortisationOpening balance – as previously stated – (21 060) – –Elimination of amortisation accumulated prior to the adoption of IFRS3 – 21 060
Closing balance – – – –
ImpairmentOpening balance (5 814) (4 590) – –Add: Impairment of goodwill (19 112) (1 224) – –
(24 926) (5 814) – –
Carrying amountAt the end of the year 42 015 60 802 – –
Goodwill acquired in a business combination is allocated, at acquisition, to the cash-generating units (CGUs) thatare expected to benefit from that business combination. After recognition of impairment losses, the carryingamount of goodwill has been allocated to the following material CGUs:
GROUP
2005 2004*R’000 R’000
Flexible Staffing – staffing 5 980 5 414Flexible Staffing – training 2 209 6 054Permanent Recruitment 19 678 21 201Marketing Research 1 064 1 064Corporate Communications 13 084 27 069
42 015 60 802
The group tests goodwill annually for impairment.
The recoverable amounts of the CGUs are determined using the discounted cash flow valuation method. The keyassumptions for the discounted cash flow valuation method are those regarding the discount rate, growth rateand expected changes to selling prices and direct costs during the period.
The group prepares cash flow forecasts derived from the most recent financial budgets approved bymanagement. The rate used to discount the forecast cash flows is 11,97%.
At 31 December 2005, before impairment testing, goodwill of R6,054 million was allocated to the Flexible Staffing –Training CGU. Due to a revised strategy and forecast outlook for 2006, the CGU has been reduced to itsrecoverable amount through a recognition of an impairment loss against goodwill of R4,105 million.
At 31 December 2005, before impairment testing, goodwill of R27,069 million was allocated to the CorporateCommunications CGU. Due to a difficult trading year in 2005, which is likely to continue into 2006, the CGU has beenreduced to its recoverable amount through a recognition of an impairment loss against goodwill of R14,048 million.
* Restated – refer note 39.

50 ADCORPANNUAL REPORT 05
NOTES TO THE ANNUAL FINANCIAL STATEMENTSfor the year ended 31 December 2005
GROUP COMPANY
2005 2004* 2005 2004*R’000 R’000 R’000 R’000
7. INVESTMENT IN SUBSIDIARIES(for details refer Annexure A)Shares at cost less amounts written off – – 379 473 395 450Directors’ valuation – – 379 473 395 450
8. INVESTMENT IN ASSOCIATES(for details refer Annexure A)Carrying values at beginning of year 3 550 3 142 1 528 1 528Increase in investment 480 168 – –Share of current year earnings(net of dividends received) 139 688 – –
4 169 3 998 1 528 1 528Loans to/(from) associates (77) (448) – 1
Total investment in associates 4 092 3 550 1 528 1 529
Directors’ valuation 4 092 3 550 1 528 1 529
9. OTHER FINANCIAL ASSETSPDI (Previously Disadvantaged Individuals) Share Trust – – 2 569 3 865
Adcorp shares141 920 at R7,965 (2004: 262 052 shares at R7,965) – – 1 130 2 087Loan to PDI Share Trust – – 3 776 4 115Impairment provision – – (2 337) (2 337)
10. DEFERRED TAXATIONTax effect of:– Deferred tax raised on provisions 4 128 3 604 7 732– Excess tax allowances and depreciation charge 28 – 28– Expenditure incurred but not allowable for tax
purposes in the year in which it is incurred 4 324 – 4 324– Rate change adjustment – (752) (752)– Finance lease timing adjustments 958 (153) 805– Computed losses 14 928 (3 075) 11 853– Other 2 633 (708) 1 925
26 999 (1 084) 25 915– Deferred tax disposed of (2 451) – (2 451)
24 548 (1 084) 23 464
Analysed as:31 December 31 December
2005 2004*
Deferred tax liabilities (1 777) –Deferred tax assets 25 241 24 548
23 464 24 548
* Restated – refer note 39.
As at* As at31 December Current year 31 December
2004 movement 2005R’000 R’000 R’000

51ADCORPANNUAL REPORT 05
GROUP COMPANY
2005 2004* 2005 2004*R’000 R’000 R’000 R’000
11. TRADE AND OTHER RECEIVABLES 354 562 258 213 4 728 3 013
Trade debtors 305 082 238 613 50 –Allowance for bad debts (7 954) (7 732) – –Deposits and staff loans 2 104 1 434 64 (72)Prepaid expenses 7 984 4 672 155 124Other 47 346 21 226 4 459 2 961
The group partakes in learnerships that are registered with the Services Seta and receives government grants in order to develop its employees.
During the current year the group incurred training expenses of R15 211 878 (2004: R19 431 932) that have been claimed from Services Seta.
Included in other receivables are amounts due from Services Seta in respect of learnerships that the group has engaged in: 14 735 9 114 – –
Opening balance 9 114 5 662 – –Claims submitted 15 212 19 432 – –Grants received (9 591) (15 980) – –
12. AMOUNTS DUE TO/(BY) SUBSIDIARY COMPANIES – – (93 959) (118 319)(for details refer Annexure A)
Amounts due by subsidiary companies – – 131 566 113 674Amounts due to subsidiary companies – – (225 525) (231 993)
13. SHARE CAPITALAuthorised100 000 000 ordinary shares of 2,5 centseach (2004: 100 000 000) 2 500 2 500 2 500 2 500
Issued42 614 375 ordinary shares of 2,5 centseach (2004: 41 258 252) 1 065 1 031 1 065 1 031The unissued shares are under the controlof the directors until the next annualgeneral meeting subject to limitations.
Number of shares (’000)Opening balance 41 258 40 299 41 258 40 299Shares issued 1 356 959 1 356 959
Shares in issue 42 614 41 258 42 614 41 258
Share Trust consolidated (142) (262) – –
Closing balance – net 42 472 40 996 42 614 41 258
14. SHARE PREMIUM 48 679 34 694 48 679 34 694
Balance at 1 January 2005 34 694 56 747 34 694 56 747Capital distribution 2005: Nil(2004: July and November 2004) – (32 173) – (32 173)Arising from the issue of 1 356 123shares (2004: 958 875) 13 985 10 120 13 985 10 120
15. TREASURY SHARES (2 127) (4 205) – –
Adcorp Empowerment Share Trust consolidated 141 920 shares (2004: 262 052 shares) (4 205) (4 454) – –Dividends on treasury shares 278 209 – –120 132 shares redeemed (2004: 2 500) 1 800 40 – –
* Restated – refer note 39.

52 ADCORPANNUAL REPORT 05
NOTES TO THE ANNUAL FINANCIAL STATEMENTSfor the year ended 31 December 2005
GROUP COMPANY
2005 2004* 2005 2004*R’000 R’000 R’000 R’000
16. NON-DISTRIBUTABLE RESERVE – – 119 918 119 918Unrealised profit arising on sale of BEE companies into new entity during 2004 – – 176 840 176 840Investment impaired on transition (IFRS3) – – – (56 922)
17. SHARE-BASED PAYMENTS RESERVE 2 821 1 318 2 821 1 318
Balance at 1 January 1 318 356 1 318 188Recognition of share-basedpayments to income statement 1 503 962 660 445Recognition of share-basedpayments to loan account – – 843 685
18. BEE SHARE OF SUPER PROFITSStructure of the Adcorp Flexible Staffing empowerment dealThe BEE transaction has been effected by way of the sale of all the flexible staffing companies of Adcorp into a newentity, Adcorp Flexible Staffing Solutions, in which the empowerment consortium comprising Black Management ForumInvestments Company Limited (BMFI), Zungu Investments Company Limited (ZICO) and African Harvest CapitalHoldings (AHC) (“BEE”) is to effectively hold 25% of the shares whilst Adcorp will hold the other 75%. A separate class ofshares is to be issued to Adcorp in settlement of the purchase consideration of R320 million plus the value of the loanaccounts, which will entitle Adcorp to the pre-deal or “base profits” of the Flexible Staffing Business on an ongoingbasis. A second class of shares enabling all profits in excess of the base profits derived by the Flexible Staffing Businessafter the deal, to be known as the “super profits”, will be held 50% by the BEE and 50% by Adcorp. After a period offive years, the BEE will have the opportunity of converting its stake in the empowered flexible staffing entity into theAdcorp listed entity on the basis of a “value-for-value” swap of their shareholding. This conversion will be calculatedusing a rate equal to 70% of Adcorp’s price earnings ratio and therefore the result will always be earnings enhancing.
The “base profits” will be calculated using the 2003 actual profits as a base. Thereafter the base profits will beagreed annually between Adcorp and the BEE, or failing agreement, at the CPIX percentage rate (ConsumerPrice Index percentage excluding mortgage rate) plus 2% per annum. These escalated profits will be known asthe base profits and will be attributable entirely to Adcorp. All profits over and above the base profits will beknown as the super profits and these profits will share on a 50/50 basis between Adcorp and the BEE consortium.
The deal was effective 1 August 2003 and super profits for the year ended 31 December 2005 amounted toR932 122 (2004: R1 518 366). The 2004 figure has been amended to include the leave pay underprovision in 2004.
Structure of the Adcorp Communications empowerment dealA similar BEE transaction has been effected by way of the sale of all the communication companies of Adcorpinto a new entity, Adcorp Communication Solutions, in which the empowerment consortium comprising BlackManagement Forum Investments Company Limited (BMFI) and Tshirundu Investments (Pty) Limited (“BEE”) is toeffectively hold 25% of the shares whilst Adcorp will hold the other 75%. A separate class of shares is to be issued toAdcorp in settlement of the purchase consideration of R93,5 million plus the value of the loan accounts, which willentitle Adcorp to the pre-deal or “base profits” of the Communications Business on an ongoing basis. A secondclass of shares enabling all profits in excess of the base profits derived by the Communications Business after thedeal, to be known as the “super profits”, will be held 50% by the BEE and 50% by Adcorp. After a period of fiveyears, the BEE will have the opportunity of converting its stake in the empowered flexible staffing entity into theAdcorp listed entity on the basis of a “value-for-value” swap of their shareholding. This conversion will take placeat a rate equal to 70% of Adcorp’s price earnings ratio and therefore the result will always be earnings enhancing.The R93,5 million has been reduced to R13,3 million as a result of the sale of PR Connections in 2004, and currentyear impairment of R14 million and 2004 IFRS transitional impairment of R60,8 million.
The “base profits” will be calculated using the 2004 budgeted profits as a base. Thereafter the base profits will beagreed annually between Adcorp and the BEE, or failing agreement, at the CPIX percentage rate (ConsumerPrice Index percentage excluding mortgage rates) plus 2% per annum. These escalated profits will be known asthe base profits and will be attributable entirely to Adcorp. All profits over and above the base points will beknown as the super profits and these profits will share on a 50/50 basis between Adcorp and the BEE consortium.The deal was effective 1 November 2003 and no super profits accrued for the year ended 31 December 2005.
19. NON-INTEREST-BEARING NON-CURRENT LIABILITIESOperating lease timing adjustment 5 541 4 862 581 181Amounts due to vendor (refer note 21) – 2 025 – –
Total 5 541 6 887 581 181
* Restated – refer note 39.

53ADCORPANNUAL REPORT 05
GROUP COMPANY
2005 2004* 2005 2004*R’000 R’000 R’000 R’000
20. TRADE AND OTHER PAYABLES 169 513 127 518 17 559 14 574
Trade creditors 31 728 16 894 15 357 –VAT 24 738 17 023 (137) (245)Accruals 55 299 48 404 510 14 682Other 57 748 45 197 1 829 137
Maximum Fair value ofpayments maximum payments
21. AMOUNTS DUE TO VENDORGroup and companyAmounts payable:Within one year 1 400 3 500 1 400 3 500In the second to fifth year inclusive 850 2 250 850 2 025
2 250 5 750 2 250 5 525Less: Fair value adjustments (63) (225) (63) –
Fair value of maximum payments 2 187 5 525 2 187 5 525
Analysed as:Non-current liabilities (refer note 19) – 2 025 – 2 025Non-interest-bearing current liabilities 2 187 3 500 2 187 3 500
2 187 5 525 2 187 5 525
The above represents the estimated payments that are expected to be made in respect of Margie Middleton andAssociates. The purchase price will be determined over the period 2004 to 2006 on an earn out basis.
Re-allocation
fromnon-
interest- Prior Re- RestatedAs bearing year allocated as at Provisions Provisions As at
previously current ad- between 31 Dec raised utilised 31 Decstated liabilities justment categories 2004 2005 2005 2005R’000 R’000 R’000 R’000 R’000 R’000 R’000 R’000
22. PROVISIONS – GROUPLeave pay 10 435 8 912 8 640 (54) 27 933 89 201 (85 538) 31 596Bonuses 9 429 6 331 – (210) 15 550 39 035 (30 799) 23 786Other 2 466 30 – 264 2 760 1 044 (663) 3 141
Total 22 330 15 273 8 640 – 46 243 129 280 (117 000) 58 523
PROVISIONS – COMPANYLeave pay – – – – 136 242 (137) 241Bonuses – – – – 4 654 6 637 (4 939) 6 352Other – – – – – 6 – 6
Total – – – – 4 790 6 885 (5 076) 6 599
Leave payLeave pay is provided based on leave days due to employees at balance sheet date, at rates prevailing at that date.
BonusesBonuses are provided to employees based on operating entity performance management criteria and are inrespect of the current year earnings.
OtherIncluded in other provisions is a provision for an onerous contract in the Corporate Communications division. Thisconsists mainly of future rental costs of unused computer equipment. The provision is calculated based on thediscounted present value of contracted rental costs.
In addition, a provision for post-retirement health care benefits is included, amounting to R1 772 000 (2004: R839 408)The amount charged to the income statement amounted to R938 880 (2004: nil)
* Restated – refer note 39.

54 ADCORPANNUAL REPORT 05
NOTES TO THE ANNUAL FINANCIAL STATEMENTSfor the year ended 31 December 2005
GROUP COMPANY
2005 2004* 2005 2004*R’000 R’000 R’000 R’000
23. REVENUEExternal revenuePermanent Recruitment 328 056 239 642 – –Flexible Staffing 1 848 487 1 515 554 – –Corporate Communications 81 427 133 855 – –Marketing Research 101 682 91 065 – –
Total external sales 2 359 652 1 980 116 – –
Internal revenueCentral costs 5 429 9 029 – –Permanent Recruitment 25 066 13 229 – –Flexible Staffing 2 363 3 285 – –
Total internal sales 32 858 25 543 – –
Eliminations (32 858) (25 543) – –
Total revenue 2 359 652 1 980 116
24. BUSINESS AND GEOGRAPHICAL SEGMENTSFor management purposes, the group is currently organised into five operating divisions – central costs, permanent recruitment, flexible staffing, corporate communications and market research. These divisions are the basis on which the group reports its primary segment information. The principal activities are as follows:Central costs – Holding company and head office function,including group research and tendering services as well as human resources.Permanent Recruitment – Recruitment, advertising and response handling, selection and placement of staff into permanent positions.Flexible Staffing – Recruitment, selection and placement of staff into temporary assignments and contract work.Corporate Communications – Public relations and corporate communications.Marketing Research – Market research and surveys.No segmental information is provided in respect of geographical analysis as the group operates mainly in South Africa.
25. COST OF SALESThe breakdown of cost of sales is as follows:Cost of buyouts (6 970) (31 004) –
–Course material (1 418) (833) – –Lecturing (7 099) (10 219) – –Media (132 209) (86 629) – –Placements (7 293) (19 233) – –Production (34 320) (19 799) – –Project costs (13 488) (9 850) – –Protective clothing (4 727) (4 556) – –Royalties (2 637) (2 424) – –Temporary employee costs (1 417 308) (1 163 113) – –Wage costs (23 239) (19 954) – –Other – (7 492) – –
(1 650 708) (1 375 106) – –
26. OTHER INCOMECorporate management fee – – 19 000 13 394Bad debts recorded 355 1 023 – –Media rebates and commissions received 2 778 3 516 2 778 3 516Licence fee 3 894 3 806 – –Other 13 331 17 187 1 258 1 154
20 358 25 532 23 036 18 064
* Restated – refer note 39.

55ADCORPANNUAL REPORT 05
GROUP COMPANY
2005 2004* 2005 2004*R’000 R’000 R’000 R’000
27. OPERATING PROFIT/(LOSS)Operating profit/(loss) is determined after allowing for the following items requiring separate disclosure:Auditors’ remuneration (4 193) (2 412) (1 673) (644)
– fee for audit (3 413) (2 239) (1 094) (519)– fee for other services (780) (173) (579) (125)
Consulting fees (17 738) (16 451) (412) (471)Depreciation (refer note 4) (15 248) (13 381) (313) (306)Foreign exchange gains 249 45 – –Government grants received 9 591 15 980 – –Directors’ emoluments – executive directors (27 549) (16 412) (16 170) (8 535)
– non-executive directors (2 787) (2 779) (2 787) (2 682)Leasing and rentals – properties and premises (23 030) (20 786) (1 209) (610)
– office furniture and equipment (5 258) (13 926) – –– motor vehicles (548) 232 – –
Profit/(loss) on disposal of plant and equipment 3 322 (94) – (155)Staff costs (357 117) (323 475) (913) (5 871)Share-based payments expense** (1 503) (963) (660) (445)
Number of employees 1 569 1 658 26 22
28. INTEREST RECEIVEDGroup loans – – 8 814 10 583Bank deposits 2 238 4 749 5 1Other 349 530 – –Fair value adjustments – 82 – –
2 587 5 361 8 819 10 584
29. INTEREST PAIDGroup loans – – (3 132) (3 214)Bank overdrafts (3 850) (7 728) (3 759) (6 711)Other (14) – – –Fair value adjustments (162) – – –
(4 026) (7 728) (6 891) (9 925)
30. TAXATIONSA normal tax – current 27 891 21 667 1 000 446
– underprovision prior year 4 – – –Deferred taxation 1 084 (2 535) (239) (5)Secondary tax on companies 6 031 – 6 031 –
35 010 19 132 6 792 441
Standard tax rate (%) 29% 30% 29% 30%Normal tax at standard rate 29 620 23 540 6 753 (5 286)Adjustment for the tax effect at the standardrate of the following items:Exempt income:
Dividends received (96) – (14 101) (3 745)Capital profit on disposal of property and equipment (1 352) – – –Capital gains tax 111 – – –Associated company profit already subject to tax (955) (666) – –
Non-deductible items charged against income:Capital losses 325 599 293 –Impairment of assets and investments 5 542 367 5 542 –
Special allowances claimed:Learnerships (9 062) (8 338) – –
Tax losses not recognised 1 292 13 974 – –Prior year adjustment 4 (890) – –Other permanent differences 2 798 (9 454) 2 274 9 472 Rate change adjustment 752 – – –Secondary tax on companies 6 031 – 6 031 –
Actual tax charge for the year 35 010 19 132 6 792 441
* Restated – refer note 39.** The share-based payment expense recorded in the company is net of amounts charged to subsidiaries.

56 ADCORPANNUAL REPORT 05
NOTES TO THE ANNUAL FINANCIAL STATEMENTSfor the year ended 31 December 2005
GROUP COMPANY
2005 2004* 2005 2004*R’000 R’000 R’000 R’000
30. TAXATION (continued)Reconciliation of estimated tax losses available in the group:
Estimated losses at beginning of year 69 781 75 472 – –Tax losses raised – current year 9 175 1 863 – –
– prior year 4 375 – – –Net tax losses utilised (21 024) (7 554) – –
62 307 69 781 – –
Which consists of:Losses recognised 40 872 49 760 – –Losses not recognised 21 435 20 021 – –
62 307 69 781 – –
31. EARNINGS PER SHAREThe calculation of earnings per share is basedon earnings of R65 185 960 (2004: R56 917 000)and ordinary shares of 41 730 144 (2004: 40 302 457)being the weighted average number of shares relative to the above earnings.Profit/(loss) per share 156,2 141,2 – –Diluted earnings per share is based on42 102 860 (2004: 40 711 169) weighted, diluted number of shares 154,8 139,8 – –
RECONCILIATION OF DILUTED NUMBER OF SHARESOrdinary shares 41 730 144 40 302 457Adcorp Employee Share Scheme – shares matured 354 835 401 660Adcorp Empowerment Share Trust – shares matured 17 881 7 052
Diluted number of shares 42 102 860 40 711 169
RECONCILIATION OF HEADLINE EARNINGSProfit for the year 67 129 59 333 – –Impairment of goodwill, investment and property 19 112 1 224 – –Minority shareholders’ share in profit (1 012) (898) – –BEE shareholders’ share of profits (932) (1 518) – –(Profit)/loss on sale of property and equipment (3 210) 66 – –Loss on disposal of operations and subsidiaries 333 5 565 – –
Headline earnings 81 420 63 772 – –
Headline earnings per share – cents 195,1 158,2 – –Diluted headline earnings per share – cents 193,4 156,6 – –
Note: – The dilution of shares results from the exercise of options in the employee share scheme and empowerment share trust
which are below the year-end market price.
– Headline earnings per share is based on earnings adjusted for impairment costs, loss on sale of asset, and loss on disposal
of operations.
32. CONTINGENT LIABILITIES – GROUP AND COMPANY32.1 The company has guaranteed payment to creditors in subsidiary companies amounting to R1 068 194
(2004: R221 945).
32.2 The group has guaranteed payments to creditors amounting to R1 797 963 (2004: R221 945).
32.3 The company has a contingent liability for secondary tax on companies (STC) in respect of undistributedaccumulated profit of R5,083 million (2004: R3,25 million).
32.4 The group has a contingent liability for STC in respect of undistributed accumulated profit of R22,14 million(2004: R20,3 million).
* Restated – refer note 39.

57ADCORPANNUAL REPORT 05
GROUP COMPANY
2005 2004* 2005 2004*R’000 R’000 R’000 R’000
33. COMMITMENTSCommitments for the acquisition of computer software (refer note 5) 11 535 – – –
The commitment will be funded out of group resources.
34. RETIREMENT BENEFITSThe group makes contributions on behalf of all permanent employees to defined contribution schemes which aregoverned by the Pensions Fund Act of 1956 on behalf of its employees. These costs are charged to the incomestatement as they occur. The total contributed by the group for the year. 16 712 19 184 1 383 1 251
35. OPERATING LEASE ARRANGEMENTSThe group as lesseeMinimum lease payments under operating leases recognised as an expense in the year 28 836 34 480 1 209 610
At the balance sheet date, the group has outstanding commitments under non-cancellable operating leases, which fall due as follows:
– within one year 27 909 30 253 485 473– in the second to fifth years inclusive 57 628 105 804 1 177 1 662– after five years 368 718 – –
85 905 136 775 1 662 2 135
Average lease terms (months) 48 48 60 60
36. FINANCIAL RISK MANAGEMENTLiquidity riskThis is the risk of not being able to generate sufficient cash to meet commitments to borrowers, depositors andother creditors at any point in time.
The group manages liquidity risk by monitoring forecast cash flows and ensuring that adequate unutilisedborrowing facilities are maintained. Borrowing facilities are reflected in note 49 to the cash flow statement.
Credit riskThe group maintains cash, cash equivalents and short-term investments with various financial institutions. Thegroup’s policy is designed to limit exposure with any one institution and ensure a high credit standing for thefinancial institution with which such transactions are executed.
Credit risk with respect to trade accounts receivable is limited due to the blue chip nature of the group’s clientbase. Credit assessments are done and continually updated on all group’s clients.
Other financial assets/liabilitiesThe directors consider that the carrying amount of trade and other receivables and payables approximates theirfair value.
* Restated – refer note 39.

58 ADCORPANNUAL REPORT 05
NOTES TO THE ANNUAL FINANCIAL STATEMENTSfor the year ended 31 December 2005
GROUP COMPANY
2005 2004 2005 2004R’000 R’000 R’000 R’000
37. CAPITAL DISTRIBUTION/DIVIDENDA final capital distribution of 54 cents per share in respect of 2003 was paid in July 2004 – 21 942 – 21 942An interim capital distribution of 25 cents per share was paid in November 2004 – 10 231 – 10 231A final dividend of 80 cents per share was declared on 9 March 2005 and was paid to shareholders on 4 July 2005 – 33 119 – 33 119An interim dividend of 35 cents per share was paid in October 2005 14 894 – 14 894 –A final dividend of 105 cents per share was declared on 8 March 2006 and was paid to shareholders on 10 April 2006 44 797 – 44 797 –
38. SHARE-BASED PAYMENTS38.1 Equity-settled share-based payments
The group has an equity-settled share option scheme for certain employees of the group. Options are exercisableat a price equal to the average quoted market price of the company’s shares on the date of grant. The vestingperiod is two years. If the options remain unexercised after a period of 10 years from the date of grant, the optionswill expire. Options are forfeited if the employee leaves the group before the options vest.
Details of the share options outstanding during the year are as follows:
2005 2004
Adcorp Employee Number Weighted Number WeightedShare Option Scheme of average of average
share exercise share exerciseoptions price options price
Outstanding at the beginning of the year 2 916 615 11,10 3 269 091 10,35Granted during the year – – 833 748 12,76Forfeited during the year (19 550) 12,22 (155 608) 9,34Cancelled during the year (130 000) 12,00 (71 741) 6,85Exercised during the year (1 356 123) 10,33 (958 875) 10,58
Outstanding at the end of the year 1 410 942 11,73 2 916 615 11,10
Exercisable at the end of the year 758 192 –
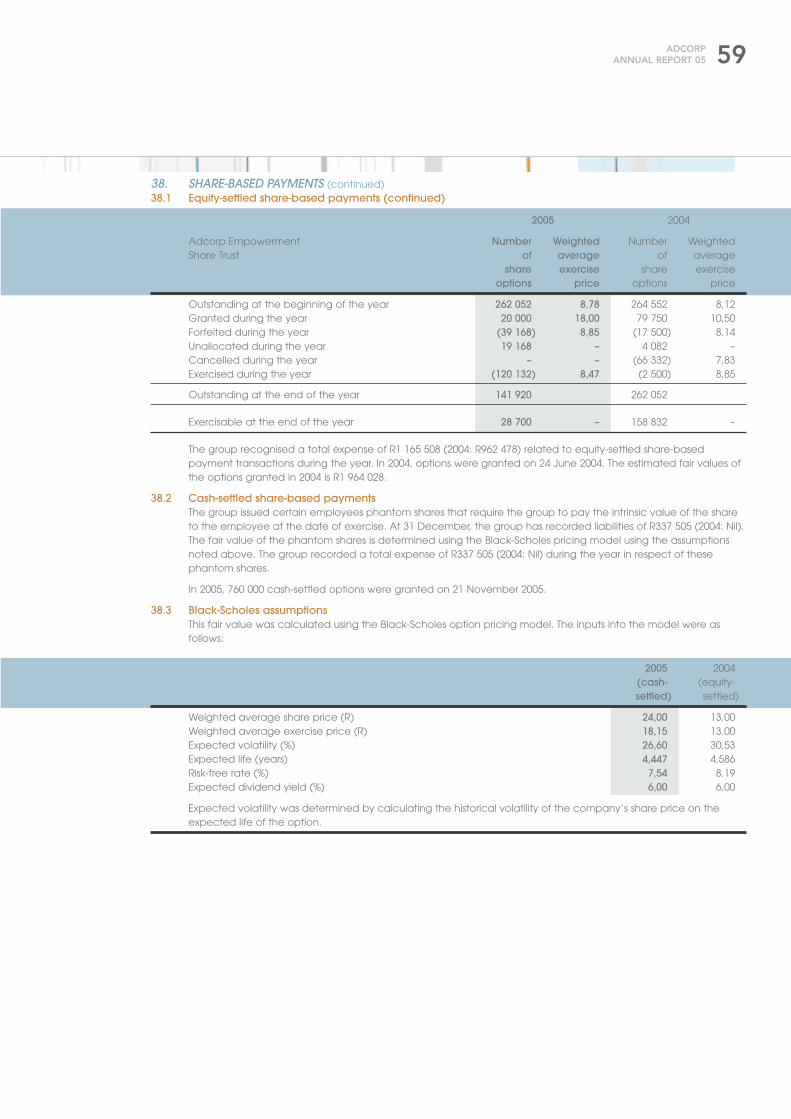
59ADCORPANNUAL REPORT 05
38. SHARE-BASED PAYMENTS (continued)38.1 Equity-settled share-based payments (continued)
2005 2004
Adcorp Empowerment Number Weighted Number WeightedShare Trust of average of average
share exercise share exerciseoptions price options price
Outstanding at the beginning of the year 262 052 8,78 264 552 8,12Granted during the year 20 000 18,00 79 750 10,50Forfeited during the year (39 168) 8,85 (17 500) 8,14Unallocated during the year 19 168 – 4 082 –Cancelled during the year – – (66 332) 7,83Exercised during the year (120 132) 8,47 (2 500) 8,85
Outstanding at the end of the year 141 920 262 052
Exercisable at the end of the year 28 700 – 158 832 –
The group recognised a total expense of R1 165 508 (2004: R962 478) related to equity-settled share-basedpayment transactions during the year. In 2004, options were granted on 24 June 2004. The estimated fair values ofthe options granted in 2004 is R1 964 028.
38.2 Cash-settled share-based paymentsThe group issued certain employees phantom shares that require the group to pay the intrinsic value of the shareto the employee at the date of exercise. At 31 December, the group has recorded liabilities of R337 505 (2004: Nil).The fair value of the phantom shares is determined using the Black-Scholes pricing model using the assumptionsnoted above. The group recorded a total expense of R337 505 (2004: Nil) during the year in respect of thesephantom shares.
In 2005, 760 000 cash-settled options were granted on 21 November 2005.
38.3 Black-Scholes assumptionsThis fair value was calculated using the Black-Scholes option pricing model. The inputs into the model were asfollows:
2005 2004(cash- (equity-settled) settled)
Weighted average share price (R) 24,00 13,00Weighted average exercise price (R) 18,15 13,00Expected volatility (%) 26,60 30,53Expected life (years) 4,447 4,586Risk-free rate (%) 7,54 8,19Expected dividend yield (%) 6,00 6,00
Expected volatility was determined by calculating the historical volatility of the company’s share price on theexpected life of the option.
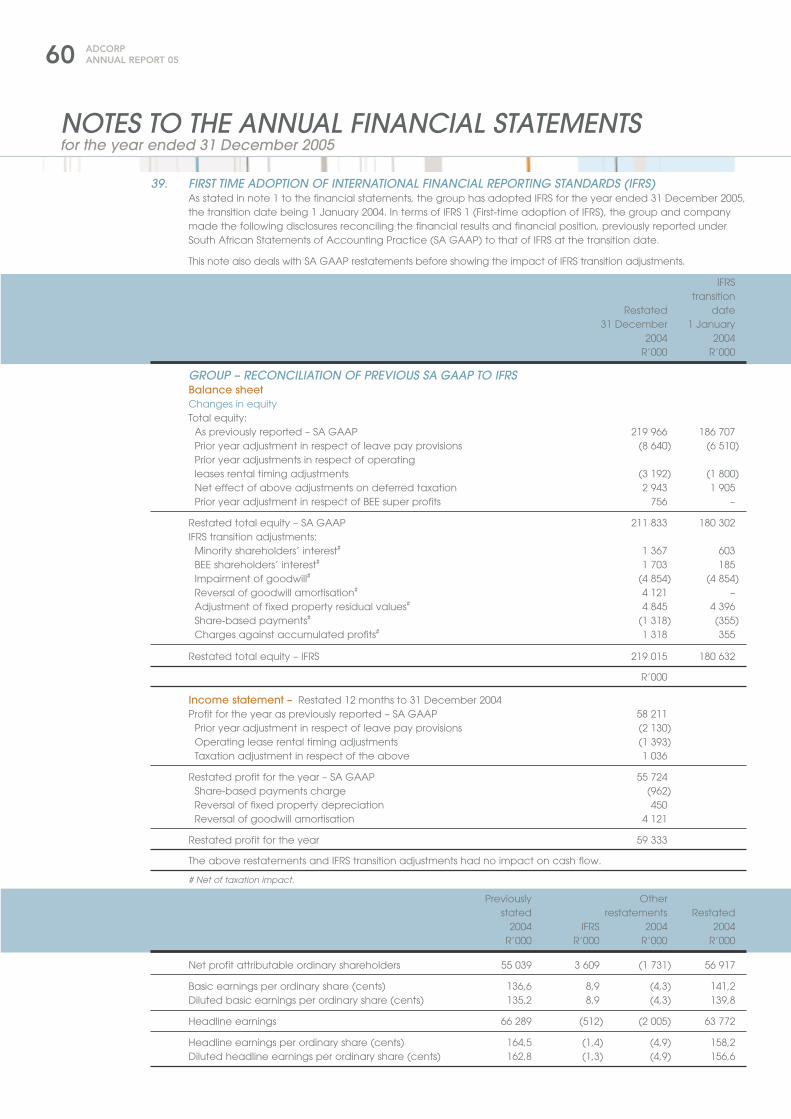
60 ADCORPANNUAL REPORT 05
NOTES TO THE ANNUAL FINANCIAL STATEMENTSfor the year ended 31 December 2005
39. FIRST TIME ADOPTION OF INTERNATIONAL FINANCIAL REPORTING STANDARDS (IFRS)As stated in note 1 to the financial statements, the group has adopted IFRS for the year ended 31 December 2005,the transition date being 1 January 2004. In terms of IFRS 1 (First-time adoption of IFRS), the group and companymade the following disclosures reconciling the financial results and financial position, previously reported underSouth African Statements of Accounting Practice (SA GAAP) to that of IFRS at the transition date.
This note also deals with SA GAAP restatements before showing the impact of IFRS transition adjustments.
IFRStransition
Restated date31 December 1 January
2004 2004R’000 R’000
GROUP – RECONCILIATION OF PREVIOUS SA GAAP TO IFRSBalance sheetChanges in equityTotal equity:
As previously reported – SA GAAP 219 966 186 707Prior year adjustment in respect of leave pay provisions (8 640) (6 510)Prior year adjustments in respect of operating leases rental timing adjustments (3 192) (1 800)Net effect of above adjustments on deferred taxation 2 943 1 905Prior year adjustment in respect of BEE super profits 756 –
Restated total equity – SA GAAP 211 833 180 302IFRS transition adjustments:
Minority shareholders’ interest# 1 367 603BEE shareholders’ interest# 1 703 185Impairment of goodwill# (4 854) (4 854)Reversal of goodwill amortisation# 4 121 –Adjustment of fixed property residual values# 4 845 4 396Share-based payments# (1 318) (355)Charges against accumulated profits# 1 318 355
Restated total equity – IFRS 219 015 180 632
R’000
Income statement – Restated 12 months to 31 December 2004Profit for the year as previously reported – SA GAAP 58 211
Prior year adjustment in respect of leave pay provisions (2 130)Operating lease rental timing adjustments (1 393)Taxation adjustment in respect of the above 1 036
Restated profit for the year – SA GAAP 55 724Share-based payments charge (962)Reversal of fixed property depreciation 450Reversal of goodwill amortisation 4 121
Restated profit for the year 59 333
The above restatements and IFRS transition adjustments had no impact on cash flow.
# Net of taxation impact.
Previously Otherstated restatements Restated
2004 IFRS 2004 2004R’000 R’000 R’000 R’000
Net profit attributable ordinary shareholders 55 039 3 609 (1 731) 56 917
Basic earnings per ordinary share (cents) 136,6 8,9 (4,3) 141,2Diluted basic earnings per ordinary share (cents) 135,2 8,9 (4,3) 139,8
Headline earnings 66 289 (512) (2 005) 63 772
Headline earnings per ordinary share (cents) 164,5 (1,4) (4,9) 158,2Diluted headline earnings per ordinary share (cents) 162,8 (1,3) (4,9) 156,6

61ADCORPANNUAL REPORT 05
IFRStransition
Restated date31 December 1 January
2004 2004R’000 R’000
COMPANY – RECONCILIATION OF PREVIOUS SA GAAP TO IFRSBalance sheetChanges in equityTotal equity:
As previously reported – SA GAAP 246 658 286 753Operating lease rental timing adjustments (18) (1)Net effect of above adjustments on deferred taxation 5 –
Restated total equity – SA GAAP 246 645 286 752Impairment of goodwill# (61 112) (61 112)Share-based payments# 1 318 355Charges against accumulated profit# (633) (188)
Restated total equity – IFRS 186 218 225 807
R’000
Income statement – Restated 12 months to 31 December 2004Loss for the year as previously reported – SA GAAP (18 066)
Operating lease rental timing adjustments (18)Taxation adjustment in respect of the above 5
Restated profit for the year – SA GAAP (18 079)Share-based payments charge (445)
Restated profit for the year 18 524
40. PRIOR YEAR ADJUSTMENTS
GROUP
2004 2003 and priorR’000 R’000
40.1 Underprovision of leave payThe provision for leave pay was found to be understated and adjusted in the current year.
The effect of this adjustment is as follows:Increase in cost of sales 2 130 6 510Decrease in taxation (618) (1 367)
Net effect on accumulated profit 1 512 5 143
Reduction in outside shareholders’ interest 756 –
40.2 Operating lease rental timing adjustmentA prior year adjustment in respect of operating lease timing adjustments was required due to a revised interpretation of IAS17.
The effect of this adjustment is as follows:Increase in operating expenses 1 393 1 800Decrease in taxation (418) (538)
Net effect on accumulated profit 975 1 262
Effect on outside shareholders’ interest – –
The above adjustments have no impact on cash flow.
# Net of taxation impact.

62 ADCORPANNUAL REPORT 05
NOTES TO THE ANNUAL FINANCIAL STATEMENTSfor the year ended 31 December 2005
41. RELATED PARTIESThe group did not enter into any transactions with group parties other than those with subsidiaries which wereeliminated on consolidation.
41.1 Trading transactionsDuring the year, group entities entered into the following transactions:
Holding company Accounting andSale of services management fees marketing fees Rental2005 2004 2005 2004 2005 2004 2005 2004
R’000 R’000 R’000 R’000 R’000 R’000 R’000 R’000
Adcorp Holdings Limited – – (19 000) (13 394) 548 849 2 200 3 840
Subsidiaries ofAdcorp HoldingsLimited 32 858 25 543 19 000 13 394 22 118 21 547 (2 200) (3 840)
Associates – – – – – – – –
41.2 Compensation paid to key management (which excludes payments to directors set out in note 42 below)
2005 2004R’000 R’000
Short-term employment benefits 8 190 7 445Share-based payments 796 385
Total 8 986 7 830
Medicalaid/ 2005 2004 2005 2004 2005 2004
Bonus/ provi- Direc- Total Total Profit on Profit on Total Totalprofit dent Allow- tors’ cost to cost to share share remu- remu-
Salary share fund ances fees company company options options neration nerationR’000 R’000 R’000 R’000 R’000 R’000 R’000 R’000 R’000 R’000 R’000
42. DIRECTORS’EMOLUMENTSExecutive V Baker – – – – – – 1 143 – – – 1 143H Barenblatt 1 936 360 249 129 – 2 674 2 164 1 574 – 4 248 2 164F Burd 1 109 966 236 33 – 2 344 1 890 1 508 – 3 852 1 890M Liphosa 852 685 188 59 – 1 784 1 452 360 245 2 144 1 697R McGregor 1 030 953 233 96 – 2 312 1 870 2 291 245 4 603 2 115R Pike 1 421 1 458 354 286 – 3 519 2 833 2 052 – 5 571 2 833T Ratshitanga (alternate) 784 542 193 175 – 1 694 1 006 – – 1 694 1 006PC Swart 1 099 2 451 245 145 – 3 940 1 880 – – 3 940 1 880N Lilford – – – – – – 764 – – – 764S Zungu (alternate) 525 419 54 121 – 1 119 920 378 – 1 497 920
8 756 7 834 1 752 1 044 – 19 386 15 922 8 163 490 27 549 16 412
Non-executivedirectorsC Bomela* – – – – 65 65 42 – – 65 42F Khanyile – – – – 146 146 94 – – 146 94G Negota – – – – 68 68 52 – – 68 52S Sebotsa – – – – 122 122 90 – – 122 90S Shonhiwa – – – – 112 112 82 – – 112 82B Sibiya – – – – – – 97 – – – 97F Van Zyl Slabbert 772 733 157 115 – 1 777 1 477 497 845 2 274 2 322
772 733 157 115 513 2 290 1 934 497 845 2 787 2 779
* C Bomela was appointed as executive director on 1 March 2006.

63ADCORPANNUAL REPORT 05
Number Number Numberof un- of of Number
exercised options options of Dateoptions granted exercised options Option from
Directors’ shareholding as at in during as at price whichat 31 December 2005 31/12/2004 2005 2005 31/12/2005 Rand exercisable
43. DIRECTORS’SHAREHOLDINGHW Barenblatt 60 000 60 000 12,00 31/05/2002
30 000 30 000 8,85 31/05/200430 000 30 000 6,35 31/05/200530 000 30 000 13,00 31/05/2006
30 000 30 000 18,15 31/05/2007
FD Burd 2 500 2 500 6,80 31/05/20022 500 2 500 10,00 31/05/20012 500 2 500 10,00 31/05/2002
60 000 60 000 12,00 31/05/200230 000 30 000 12,00 31/05/200330 000 30 000 8,85 31/05/200430 000 30 000 6,35 31/05/200530 000 30 000 13,00 31/05/2006
30 000 30 000 18,15 31/05/2007
F Khanyile 15 000 15 000 13,00 31/05/2006
M Liphosa 60 000 60 000 12,00 31/05/200215 000 15 000 12,00 31/05/200330 000 30 000 6,35 31/05/200530 000 30 000 13,00 31/05/2006
30 000 30 000 18,15 31/05/2007
RB McGregor 180 000 180 000 12,00 31/05/200230 000 30 000 12,00 31/05/200330 000 30 000 6,35 31/05/200530 000 30 000 13,00 31/05/2006
30 000 30 000 18,15 31/05/2007
RL Pike 47 809 47 809 12,00 31/05/200250 000 50 000 8,85 31/05/200450 000 50 000 6,35 31/05/200550 000 50 000 13,00 31/05/2006
50 000 50 000 18,15 31/05/2007
T Ratshitanga (alternate) 30 000 30 000 13,00 31/05/200630 000 30 000 18,15 31/05/2007
S Sebotsa 15 000 15 000 13,00 31/05/2006
S Shonhiwa 20 000 20 000 13,00 31/05/2006
PC Swart 55 000 55 000 12,00 31/05/200230 000 30 000 8,85 31/05/200430 000 30 000 6,35 31/05/200530 000 30 000 13,00 31/05/2006
30 000 30 000 18,15 31/05/2007
F Van Zyl Slabbert 30 000 30 000 6,35 31/05/200530 000 30 000 13,00 31/05/2006
30 000 30 000 18,15 31/05/2007
S Zungu (alternate) 25 000 25 000 7,50 31/05/2005
Number of shares Number of sharesheld as at held as at
31/12/2005 Non- 31/12/2004 Non-Beneficially beneficially Beneficially beneficially
Directors’ interest in shares held held held held
RL Pike 249 630 – 341 390 –
HW Barenblatt 87 096 – 75 000 15 936
M Liphosa 426 – 10 000 –
Note: As at 31 March 2006 the above shareholdings remain unchanged.
64 ADCORPANNUAL REPORT 05
NOTES TO THE ANNUAL FINANCIAL STATEMENTSfor the year ended 31 December 2005
GROUP COMPANY
2005 2004* 2005 2004*R’000 R’000 R’000 R’000
44. TAXATION PAIDAmount prepaid/(unpaid) at the beginning of the year 4 776 (1 445) 3 093 (1 117)Prior year adjustment – 3 808 5 3 192Amount charged to income statement (35 010) (19 132) (6 792) (441)Adjustment for deferred tax charged to income statement 1 084 (2 535) (239) (5)Tax liability disposed – (68) – –Amount paid in respect of BEE shareholders (372) – – –Amount unpaid/(prepaid) at the end of the year 3 312 (4 776) (2 516) (3 093)
Net cash payment (26 210) (24 148) (6 449) (1 464)
45. DIVIDEND/CAPITAL DISTRIBUTION PAIDAmounts declared and approved (48 243) (32 173) (48 243) (32 173)Received on treasury shares 278 209 – –Amounts paid to BEE shareholders (2 186) – – –Received from subsidiaries – – 96 868 –
Net cash (payments)/receipts before cash from associates (50 151) (31 964) 48 625(32 173)
Received from associates 3 155 – – –
Net cash (payments)/receipts (46 996) (31 964) 48 625 (32 173)
46. ADDITIONS TO PROPERTY,EQUIPMENT AND INTANGIBLE ASSETSLand and buildings – replacement (536) (253) (403) –Furniture and computer equipment – replacement (12 798) (18 122) (852) (289)
– expansion (5 184) (2 448) – –Computer software (in progress) – expansion (10 568) – – –
(29 086) (20 823) (1 255) (289)
47. OUTFLOW ON DISPOSAL OF BUSINESSES (333) (550) – –
Goodwill (333) 5 328 – –Trade receivables – (189) – –Reserves – (5 566) – –Provisions – (304) – –Deferred taxation – 113 – –Taxation – 68 – –
48. ACQUISITION OF BUSINESS (325) (1 517) – –
Intangible assets and goodwill (325) (7 036) – –Trade receivables – (2 062) – –Vendor loan – 5 525 – –Trade payables – 58 – –Current interest-bearing liabilities – 1 965 – –Non-current interest-bearing liabilities – 33 – –
* Restated – refer note 39.

65ADCORPANNUAL REPORT 05
GROUP COMPANY
2005 2004* 2005 2004*R’000 R’000 R’000 R’000
49. CASH AND CASH EQUIVALENTSCash and cash equivalents includedin the cash flow statement comprise the following balance sheet amounts:Bank balances, cash and deposits 75 443 84 001 1 2Bank overdrafts (56 713) (85 345) (55 581) (83 388)
18 730 (1 344) (55 580) (83 386)
Bank overdrafts are considered as part of cash and cash equivalents as they form part of the cash managementsystem.
50. GROUP BANK OVERDRAFT FACILITIESThe group has the following overdraft facilitiesAbsa R30 millionFirst National Bank R45 millionTotal overdraft facility R75 million
These facilities are repayable on demand and bear interest at rates linked to the prime overdraft rate.
51. SUBSEQUENT EVENTSNo events took place subsequent to year-end which require any further information to be communicated.
* Restated – refer note 39.

66 ADCORPANNUAL REPORT 05
ANNEXURE ADETAILS OF SUBSIDIARIES AND ASSOCIATESfor the year ended 31 December 2005
Authorisedshare capital
R RName of subsidiary Nature of business 2005 2004
Adcorp Accountability (Pty) Ltd* Accounting 4 000 4 000Adcorp Communication Solutions (Pty) Ltd Holding company 10 000 10 000Adcorp Financial Graphics (Pty) Ltd Dormant 100 100Adcorp Flexible Staffing Solutions (Pty) Ltd Holding company 10 000 10 000Adcorp Grey Consulting (Pty) Ltd (previously Gobodo Grey) Recruitment 10 000 10 000Adcorp Investment Trading (Pty) Ltd Deregistered – 1 000Adcorp Management Services (Pty) Ltd Accounting 4 000 4 000Adcorp Mozambique (Pty) Ltd Deregistered – 24 000Adcorp Recruitment KZN (Pty) Ltd Dormant 1 000 1 000Adcorp Social Investment Trading Deregistered – 1 000Adcorp Staffing (Pty) Ltd* Flexible staffing 4 000 4 000Adcorp Staffing Solutions (Pty) Ltd Recruitment 4 000 4 000Adcorp UK Limited Dormant 3 384 3 384Admark Personnel Selection (Pty) Ltd Deregistered – 60 000Admark Recruitment Advertising (Pty) Ltd Dormant 30 000 30 000Admark Recruitment Advertising (Pty) Ltd – Namibia (Pty) Ltd Deregistered 1 000 1 000Altolevel Recruitment Advertising (Pty) Ltd Dormant 100 100Capacity Outsourcing (Pty) Ltd* Flexible staffing 4 000 4 000Charisma Healthcare Solutions (Pty) Ltd* Flexible staffing 1 000 1 000Charisma Management Services (Pty) Ltd* Dormant 1 000 –D/@bility (Pty) Limited Dormant 1 000 1 000DAV Professional Placement Group (Pty) Ltd Recruitment 1 000 1 000Effective Recruitment Advertising (Pty) Ltd Dormant 4 000 4 000Emmanuels Staffing Services (Pty) Ltd* Flexible staffing 1 000 1 000Ethoz Human Value (Pty) Ltd Dormant 1 000 1 000Graphicor (Pty) Ltd* Graphic design 100 100Ikhwezi Staffing Solutions (Pty) Ltd* Dormant 1 000 1 000International Centre for Management Development (Pty) Ltd Dormant 1 000 1 000JobVest (Pty) Ltd Recruitment 4 000 4 000Kit Hodge & Company (Pty) Ltd Deregistered – 1 000Knovation Consulting (Pty) Ltd Dormant 1 000 1 000Knovation (Pty) Ltd Training 200 000 200 000PR Connections (Pty) Ltd Sold – –Premier Personnel (Pty) Ltd Dormant 100 100PMI Learning Solutions (Pty) Ltd Dormant 100 –PMI of South Africa (Pty) Ltd Training 100 100Quest Flexible Staffing Solutions (Pty) Ltd* Flexible staffing 100 100Quest Holdings (Pty) Ltd Holding company 10 000 10 000Quest Permanent Appointments (Pty) Ltd Dormant 100 100Research Surveys (Pty) Ltd Market research 20 000 20 000Simeka TWS Communications (Pty) Ltd* Public relations 4 000 4 000Stand 948, Melville (Pty) Ltd Property 1 000 1 000The Design and Media Company (Pty) Ltd Design and media 4 000 4 000The Niche (Pty) Ltd Deregistered – 1 000
Subtotal negative – –Subtotal positive – –
Total subsidiaries – –
Name of associate
Career Junction (Pty) Ltd Recruitment 400 000 400 000Equitable Solutions (Pty) Ltd Dormant 1 000 1 000The Customer Equity Company (Pty) Ltd Market research 1 000 1 000Klatrade 200074 (Pty) Ltd Training 1 000 1 000Sandton Group Ltd Sold – 100 000Shopper Behaviour Research (Pty) Ltd Market research 1 000 1 000Sishayele Contact Centre Solutions (Pty) Ltd Outsourcing 1 000 1 000Thetha Call Centre Staffing (Pty) Ltd Staff placement 4 000 4 000
Subtotal negative – –Subtotal positive – –
Total associates – –
Name of joint venture
Knovation At Austral Deregistered – 4 000
* Owned by subsidiary companies

67ADCORPANNUAL REPORT 05
Issued share Number of Cost of investment Indebtedness (to)/ Attributablecapital shares held (net of write-downs) by the subsidiary profit/(loss)
R R R’000 R’000* R’000 R’000* R’000 R’000*2005 2004 2005 2004 2005 2004 2005 2004 2005 2004
200 200 200 200 – – 11 358 (728) (244) (35)10 000 10 000 7 500 7 500 13 334 27 380 990 991 (14 040) (9 301)
100 100 100 100 10 10 (10) (10) – 44710 000 1 000 7 500 7 500 332 564 329 734 – (1 524) (275) (23 235)
9 000 9 000 9 000 5 000 59 489 7 831 6 902 (993) (1 870)– 100 – 100 – – – – – –
400 400 400 400 – – 6 836 5 307 (296) (114)– 24 000 – 22 000 – – – – – –
100 100 100 100 – 117 – – – (805)– 100 – 100 – – – – – –1 1 1 1 – – 2 469 (1 487) 3 732 2 677
100 100 100 100 12 855 9 105 2 935 708 4 885 44 001308 308 308 308 – – – – – –
– 10 000 – 10 000 – – – – – –30 000 30 000 30 000 30 000 – – – – – (6 131)
1 1 1 1 – – – – – –100 100 100 100 – – – – – (2 480)
4 000 4 000 4 000 4 000 – – 11 006 6 148 18 566 25 918100 100 100 100 – – – 977 2 280 6 514100 – 100 – – – 6 632 – – –100 100 100 50 – – 1 913 1 941 – 219100 100 100 100 7 270 6 848 (544) (4 943) 6 067 5 209100 100 100 100 – 56 – – – (3 005)100 100 100 100 – – 7 902 (9 030) 16 436 16 975100 100 60 60 – 945 – – – 504100 100 100 100 – – (9 683) (8 829) 3 012 5 388100 100 100 100 – – – – – 709200 200 200 200 – – – – – (4 986)
2 000 2 000 1 000 1 000 1 1 16 885 5 851 1 179 795– 1 000 – 1 000 – 1 – – – –
100 100 100 100 – 23 (283) – 35 (10)200 000 200 000 200 000 200 000 3 015 2 349 28 170 28 602 1 989 2 114
– – – – – – – 1 039 – (475)100 100 100 100 1 946 3 355 – – – (3 719)100 – 100 – – – – – – –100 100 100 100 629 4 440 5 623 6 293 1 230 45 746100 100 100 100 – – 18 011 29 174 27 774 29 606
10 000 10 000 10 000 10 000 – 2 873 (197 031) (197 031) – (175)100 100 100 100 – – – – – 271200 200 200 200 7 790 7 722 (11 999) (7 691) 9 660 7 813
4 000 4 000 4 000 4 000 – – (3 484) (720) (3 580) (530)100 100 100 100 – – (2 491) 18 452 3 315 283
4 000 4 000 4 000 3 000 – 2 3 005 1 289 1 077 (23)– 100 – 100 – – – – – –
– – – – – – (225 525) (231 993) (19 428) (56 894)– – – – 379 473 395 450 131 566 113 674 101 237 195 189
– – – – 379 473 395 450 (93 959) (118 319) 81 809 138 295
50 000 50 000 12 500 12 500 1 636 1 098 – – 1 200 564490 490 40 40 40 40 (409) (409) – (409)400 400 100 100 2 022 1 849 311 – 2 223 1 418
1 000 1 000 500 500 439 931 21 (39) (162) 649– 1 000 – 333 – – – – – –
100 100 35 20 (26) 80 – – (26) –100 100 30 30 51 – – – 51 –
1 000 1 000 500 500 7 – – – 8 –
– – – – (26) – (409) (448) (188) (409)– – – – 4 195 3 998 332 – 3 482 2 631
– – – – 4 169 3 998 (77) (448) 3 294 2 222
– 4 000 – 2 040 – – – – – –
* Restated – refer note 39.

68 ADCORPANNUAL REPORT 05
NOTICE OF ANNUAL GENERAL MEETING
Adcorp Holdings Limited (Incorporated in the Republic of South Africa)(Registration number 1974/001804/06)Share code: ADRISIN: ZAE000000139(“Adcorp” or “the company”)
Notice is hereby given that the Annual General Meeting of the shareholders of Adcorp Holdings Limited will be held atBlock A, 28 on Sloane, Sloane Street, Bryanston, Johannesburg on Thursday, 29 June 2006 at 09:00 to consider and ifdeemed fit, to pass with or without modification the following resolutions:
As ordinary resolutions1. To receive, approve and adopt the audited annual financial statements for the year ended 31 December 2005.2. To re-elect Shepherd Shoniwa as a director of the company.3. To re-elect Rob McGregor as a director of the company.4. To re-elect Matodzi Liphosa as a director of the company.5. To re-elect Faith Khanyile as a director of the company.6. To re-elect Sonja Sebotsa as a director of the company.
7. To resolve that 3 000 000 ordinary shares in the authorised but unissued share capital of the company be and arehereby placed under the control of the directors of the company as a specific authority in terms of section 221(2) of the Companies Act, 61 of 1973, as amended (“the Act”). Of these ordinary shares 1 500 000 are for the allotmentand issue of shares in terms of the Adcorp Holdings Limited Share Purchase Scheme and 1 500 000 are in respect ofpossible acquisitions.
8. To transact such other business as may be transacted at an annual general meeting.
As special resolution9. Resolved that the directors of the company be and are hereby authorised by way of a general authority to
facilitate the repurchase by the company or any of its subsidiaries, of shares in the capital of the company, asthey in their discretion, from time to time, deem fit. The repurchase will be in accordance with the provisions ofthe Act, the JSE Listings Requirements and the articles of association of Adcorp, from time to time which are: – the repurchase of securities being affected through the order book operated by the JSE trading system and
done without any prior understanding or arrangement between the company and the counter party;– this general authority shall be valid only until the company's next annual general meeting, or for fifteen months
from the date of this special resolution, whichever period is shorter;– an announcement will be published as soon as the company has acquired ordinary shares constituting, on a
cumulative basis 3% or every 3% thereafter, of the number of ordinary shares in issue prior to the acquisitionpursuant to which the aforesaid 3% threshold is reached, containing full details of such shares;
– any general repurchase shall not in the aggregate in any one financial year exceed 20% of the company’sordinary issued share capital;
– in determining the price at which ordinary shares issued by the company will be acquired by the companyand/or its subsidiaries in terms of this general authority, the maximum premium at which such ordinary shares maybe acquired will be no more than 10% above the weighted average of the market value at which such ordinaryshares are traded on the JSE, as determined over the five trading days immediately preceding the date ofrepurchase of such ordinary shares by the company and/or its subsidiaries;
– the sponsor of the company provides a letter to the JSE on the adequacy of working capital in terms of section2.12 of the JSE Listings Requirements, before the share repurchase commences;
– at any point in time, may only appoint one agent to effect any repurchase on the company’s behalf;– the company may only undertake a repurchase of securities if, after such repurchase, it still complies with the
shareholder spread requirements as set out in the JSE Listings Requirements; and– the company or its subsidiaries may not repurchase securities during a prohibited period, as defined in the
JSE Listings Requirements.
The board of directors of Adcorp will use this authority as and when opportunities arise.
Voting and proxiesIf you are a certificated or own name dematerialised shareholder and unable to attend the annual general meeting ofordinary shareholders to be held on Thursday, 29 June 2006 at 09:00 at the premises of the company Block A, 28 onSloane, Sloane Street, Bryanston, Johannesburg and wish to be represented thereat, you must complete and return theattached forms of proxy in accordance with the instructions therein to be received by the transfer secretaries by not laterthan 09:00 on Wednesday, 28 June 2006.
If you have dematerialised your shares with a Central Securities Depository Participant (“CSDP”) or broker, other than withown name registration, you must arrange with them to provide you with the necessary authorisation to attend the annualgeneral meeting or you must instruct them as to how you wish to vote in this regard. This must be done in terms of theagreement entered into between you and the CSDP or broker, in the manner and cut-off time stipulated therein.
Additional proxy forms are obtainable from the company secretary and must be deposited at the transfer secretaries notless than 24 hours before the meeting.
By order of the board
Lyn SudburySecretary
26 May 2006

69ADCORPANNUAL REPORT 05
FORM OF PROXY
Adcorp Holdings Limited (Incorporated in the Republic of South Africa)(Registration number 1974/001804/06)Share code: ADRISIN: ZAE000000139(“Adcorp” or “the company”)
For use at the Annual General Meeting of shareholders of Adcorp Holdings Limited to be held at 09:00 on Thursday, 29 June 2006.
For use by the certificated holders or holders of dematerialised shares in their own name at the annual general meetingto be held at 09:00 on Thursday, 29 June 2006 at the premises of the company on Block A, 28 on Sloane, Sloane Street,Bryanston, Johannesburg.
If shareholders have dematerialised their shares with a Central Securities Depository Participant (“CSDP”) or broker, otherthan with own name registration, they must arrange with the CSDP or broker to provide them with the necessaryauthorisation to attend the annual general meeting or the shareholder must instruct them as to how they wish to vote inthis regard. This must be done in terms of the agreement entered into between the shareholder and the CSDP or broker, inthe manner and cut-off time stipulated therein.
For the annual general meeting
I/We
(Name/s in block letters)of
(Address in block letters)being a member/s of the abovementioned company and holding shares in Adcorp Holdings Limited,and entitled to vote, do hereby appoint (refer to note 1 on page 70):
or, failing him,
Dr F van Zyl Slabbert of Block A, 28 on Sloane, Sloane Street, Bryanston, Johannesburg or failing him, the chairman of themeeting as my/our proxy(ies) to vote on a poll on my/our behalf at the annual general meeting of the company to beheld at 09:00 on Thursday, 29 June 2006 and at any adjournment thereof.
Please indicate with an “X” in the spaces below how you wish your proxy to vote in respect of the resolutions to beproposed, as contained in the notice of the abovementioned annual general meeting.*I/We desire my/our proxy to vote on the resolutions to be proposed, as follows:
For Against Abstain
Ordinary resolution 1 (Adopt audited financial statements)
Ordinary resolution 2 (Re-elect Shepherd Shoniwa)
Ordinary resolution 3 (Re-elect Rob McGregor)
Ordinary resolution 4 (Re-elect Matodzi Liphosa)
Ordinary resolution 5 (Re-elect Faith Khanyile)
Ordinary resolution 6 (Re-elect Sonja Sebotsa)
Ordinary resolution 7 (Employee share scheme shares and possible acquisition shares placed under control of directors)
Ordinary resolution 8 (Transact other business)
Special resolution 9 (General authority to repurchase shares)
Signed by me/us this day of 2006
Signature
Assisted by me (where applicable) (refer to note 5 on page 70)
Full name/s of signatory if signing in a representative capacity (refer to note 4 on page 70)
* If this form of proxy is returned without any indication of how the proxy should vote, the proxy will exercise his/her discretion both as to how
he/she votes and as to whether or not he/she abstains from voting.

70 ADCORPANNUAL REPORT 05
NOTES
1. A member entitled to attend and vote at the above mentioned meeting is entitled to appoint one or more proxiesto attend, speak and, upon a poll, vote in his stead or abstain from voting. The proxy need not be a member ofthe company.
2. To be valid this form of proxy must be completed and returned to the company’s transfer secretaries, UltrashareRegistrars (Pty) Limited, 11 Diagonal Street, Johannesburg, 2001 (PO Box 4844, Johannesburg, 2000) to be receivedby not later than 09:00 on Wednesday, 28 June 2006.
3. In the case of a joint holding, the first-named only need sign.4. The authority of a person signing a proxy in a representative capacity must be attached to the proxy unless that
authority has already been recorded by the company.5. A minor or any other person under legal incapacity must be assisted by his/her parent or guardian as applicable,
unless the relevant documents establishing capacity are produced or have been registered with the transfersecretaries.

ADMINISTRATION
ADCORP HOLDINGS LIMITED Registration number 1974/001804/06 Founded 1968, listed 1987
SECRETARY AND REGISTERED OFFICE L SudburyBlock A, 28 on SloaneSloane StreetBryanston, 2021PO Box 7156, Johannesburg, 2000Tel 011 244 5300Fax 011 244 5310Email [email protected]
CORPORATE AND LEGAL ADVISORSNucleus Corporate Finance (Pty) LimitedRegistration number 1998/023924/0825 Rudd RoadIllovo, 2041Tel 011 268 0800Fax 011 268 0840
Roodt Inc AttorneysRegistration number 2003/016254/21Block A, Eton Road Office Park7 Eton RoadSandhurst, 2196PO Box 78894, Sandton, 2146
Prinsloo, Tindle & Andropoulous Inc.1st Floor, 17 Fricker RoadIllovo BoulevardIllovoJohannesburg, 2196Tel 011 268 6200Fax 011 268 6330
Larry A MarksExcel House10 Johannesburg RoadCorner Cross StreetGlenhazel, 2192PO Box 159, Highlands North, 2037Tel 011 386 8699Fax 011 887 5139
JOINT AUDITORS Deloitte & ToucheThe Woodlands20 Woodmead DriveGallo ManorSandtonPrivate Bag X6Gallo Manor, 2052Tel 011 806 5000Fax 011 806 5111
Charter Financial & Auditing IncorporatedRegistration number 1992/002371/2125 Plantation RoadNorwood, 2192PO Box 89438, Lyndhurst, 2106Tel 011 483 0911Fax 011 483 0936
TRANSFER SECRETARIES Ultrashare Registrars (Pty) LimitedRegistration number 2000/007239/0711 Diagonal StreetJohannesburg, 2001Tel 011 834 2266Fax 011 834 4398
COMMERCIAL BANKERS FirstRand Bank of Southern Africa LimitedRegistration number 1905/001225/06
ABSA Bank LimitedRegistration number 1986/004794/06
Standard Bank of SA LimitedRegistration number 1962/000738/06
Nedbank LimitedRegistration number 1951/000009/06
SPONSORSDeloitte & Touche Sponsor Services (Pty) LimitedThe Woodlands20 Woodmead DriveGallo ManorSandtonPrivate Bag X6Gallo Manor, 2052Tel 011 806 5614Fax 011 806 5666
G R A P H I C O R3 3 7 4 5

www.adcorp.co.za