adcorp employment index - vdwweb.vdw.co.za/portals/12/south african labour market trends -...
TRANSCRIPT

Adcorp Employment Index
2013 Labour Market Update
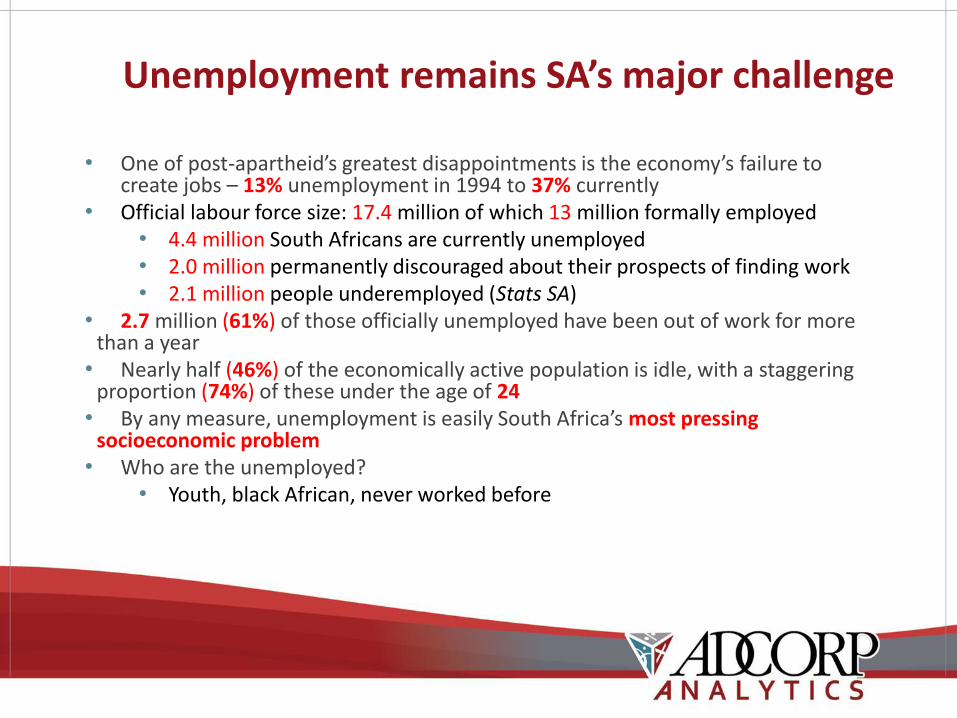
Unemployment remains SA’s major challenge
• One of post-apartheid’s greatest disappointments is the economy’s failure to create jobs – 13% unemployment in 1994 to 37% currently
• Official labour force size: 17.4 million of which 13 million formally employed• 4.4 million South Africans are currently unemployed• 2.0 million permanently discouraged about their prospects of finding work• 2.1 million people underemployed (Stats SA)
• 2.7 million (61%) of those officially unemployed have been out of work for more than a year• Nearly half (46%) of the economically active population is idle, with a staggering
proportion (74%) of these under the age of 24• By any measure, unemployment is easily South Africa’s most pressing
socioeconomic problem• Who are the unemployed?
• Youth, black African, never worked before

Real wages in South Africa
0
20
40
60
80
100
120
140
1970 1976 1982 1988 1994 2000 2006 2012
Rea
l wag
es, 1
96
0s=
10
0
Note: * After-inflation wages in the non-agricultural private sector. Source: South African Reserve Bank (2012).
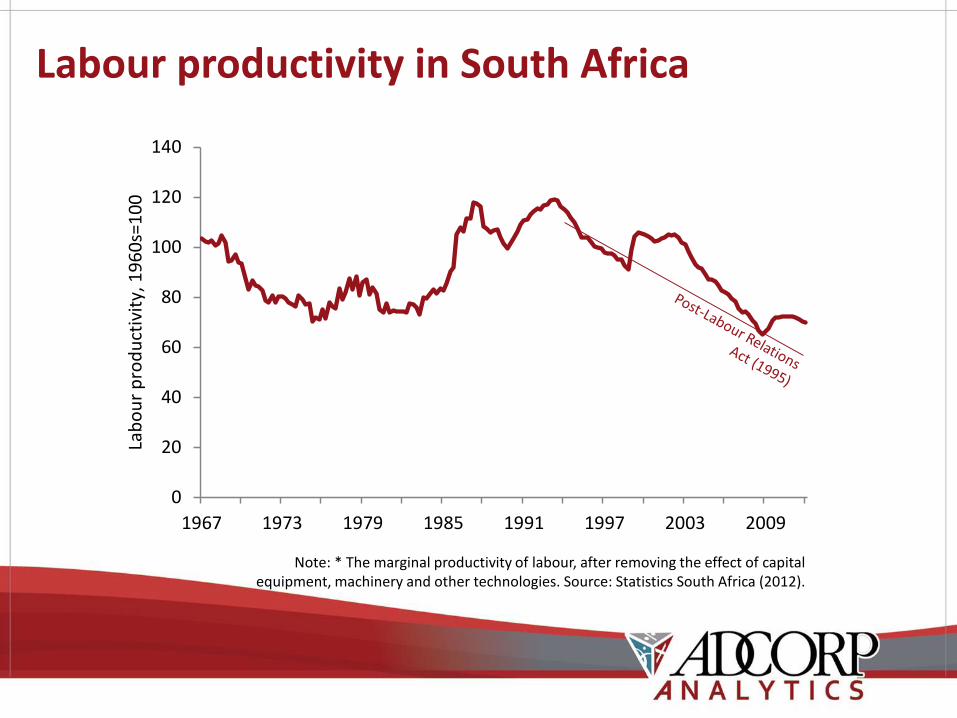
Labour productivity in South Africa
0
20
40
60
80
100
120
140
1967 1973 1979 1985 1991 1997 2003 2009
Lab
ou
r p
rod
uct
ivit
y, 1
96
0s=
10
0
Note: * The marginal productivity of labour, after removing the effect of capital equipment, machinery and other technologies. Source: Statistics South Africa (2012).
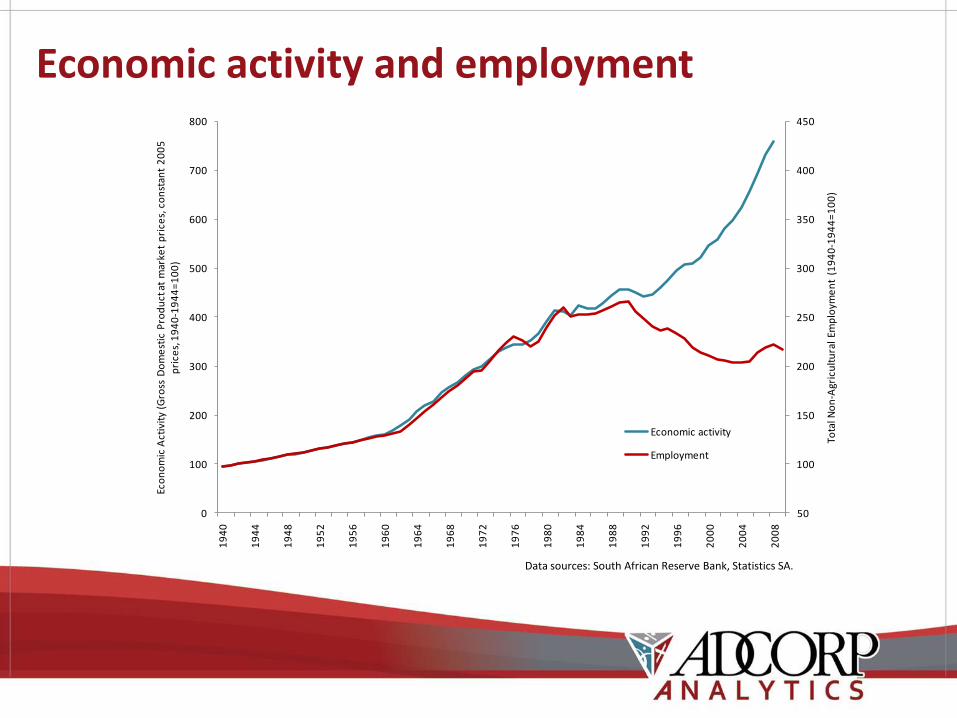
Economic activity and employment
Data sources: South African Reserve Bank, Statistics SA.
50
100
150
200
250
300
350
400
450
0
100
200
300
400
500
600
700
800
19
40
19
44
19
48
19
52
19
56
19
60
19
64
19
68
19
72
19
76
19
80
19
84
19
88
19
92
19
96
20
00
20
04
20
08
Tota
l No
n-A
gric
ult
ura
l Em
plo
yme
nt
(19
40
-19
44
=1
00
)
Eco
no
mic
Act
ivit
y (G
ross
Do
me
stic
Pro
du
ct a
t m
arke
t p
rice
s, c
on
stan
t 2
00
5
pri
ces,
19
40
-19
44
=1
00
)
Economic activity
Employment
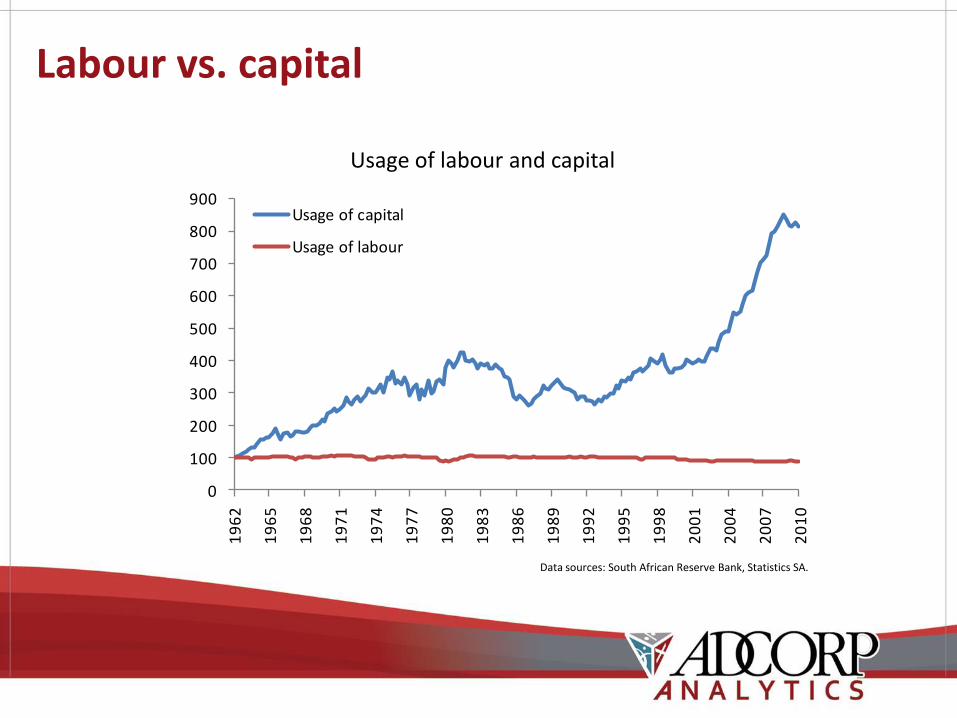
Labour vs. capital
Usage of labour and capital
Data sources: South African Reserve Bank, Statistics SA.
0
100
200
300
400
500
600
700
800
900
19
62
19
65
19
68
19
71
19
74
19
77
19
80
19
83
19
86
19
89
19
92
19
95
19
98
20
01
20
04
20
07
20
10
Usage of capital
Usage of labour
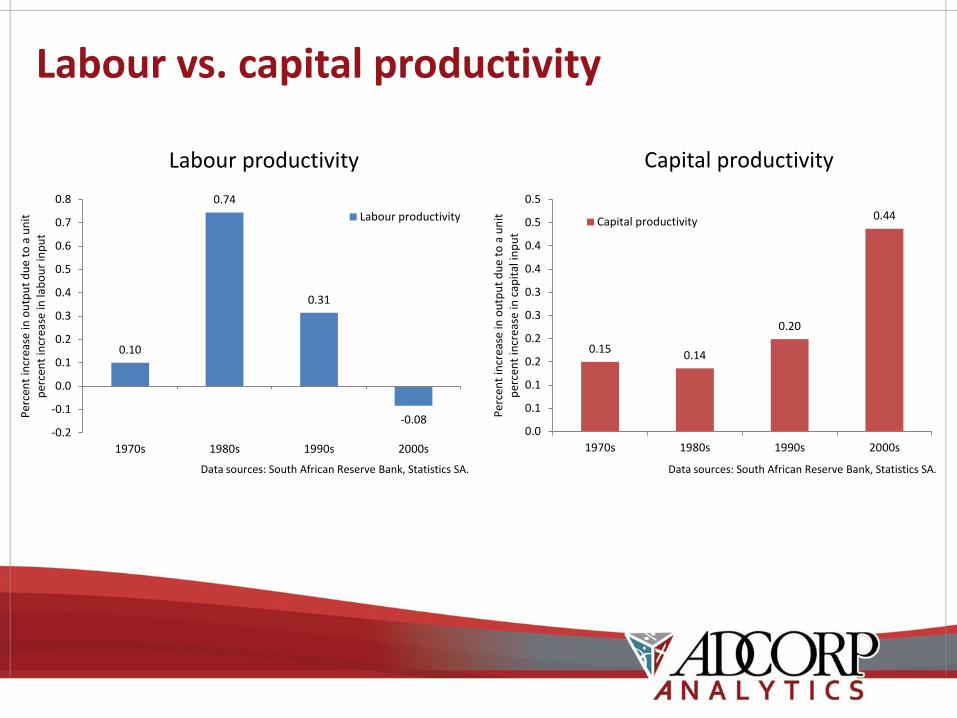
Labour vs. capital productivity
Labour productivity
Data sources: South African Reserve Bank, Statistics SA. Data sources: South African Reserve Bank, Statistics SA.
Capital productivity
0.10
0.74
0.31
-0.08-0.2
-0.1
0.0
0.1
0.2
0.3
0.4
0.5
0.6
0.7
0.8
1970s 1980s 1990s 2000s
Per
cen
t in
crea
se in
ou
tpu
t d
ue
to a
un
it
per
cen
t in
crea
se in
lab
ou
r in
pu
t
Labour productivity
0.150.14
0.20
0.44
0.0
0.1
0.1
0.2
0.2
0.3
0.3
0.4
0.4
0.5
0.5
1970s 1980s 1990s 2000s
Per
cen
t in
crea
se in
ou
tpu
t d
ue
to a
un
it
per
cen
t in
crea
se in
cap
ital
inp
ut
Capital productivity
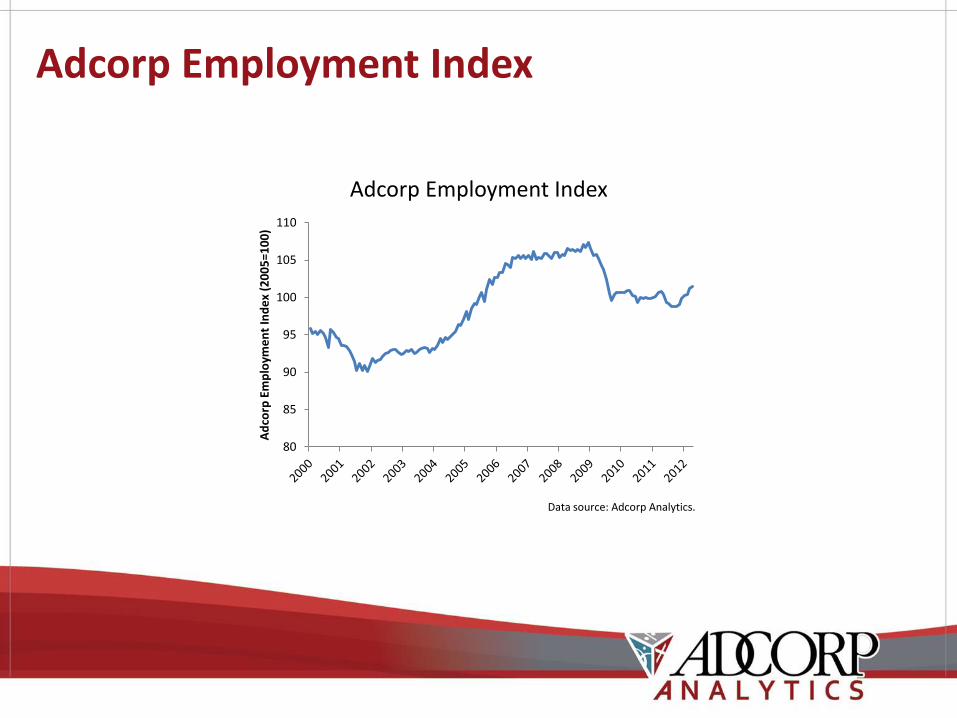
Adcorp Employment Index
Adcorp Employment Index
Data source: Adcorp Analytics.
80
85
90
95
100
105
110
Ad
corp
Em
plo
yme
nt
Ind
ex
(20
05
=10
0)

Typical and atypical employment
Typical employment
Data source: Adcorp Analytics. Data source: Adcorp Analytics.
Atypical employment
80
85
90
95
100
105
110
Per
man
ent
emp
loym
ent
(20
05
=10
0)
0
20
40
60
80
100
120
140
160
180
Tem
po
rary
em
plo
ymen
t (2
00
5=1
00
)
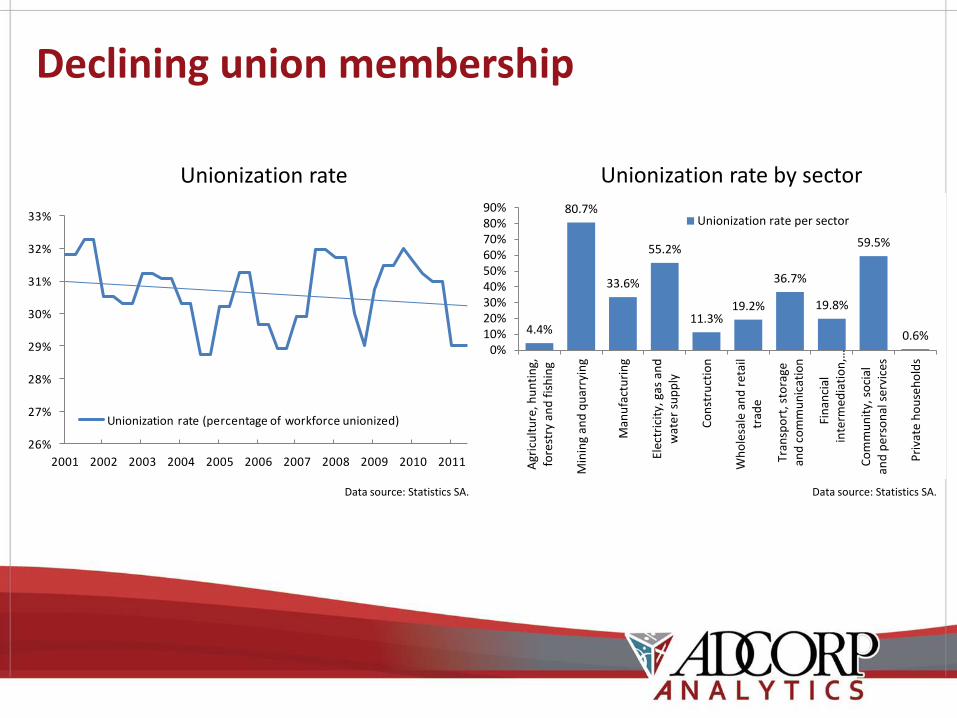
Declining union membership
Unionization rate
Data source: Statistics SA. Data source: Statistics SA.
Unionization rate by sector
26%
27%
28%
29%
30%
31%
32%
33%
2001 2002 2003 2004 2005 2006 2007 2008 2009 2010 2011
Unionization rate (percentage of workforce unionized)
4.4%
80.7%
33.6%
55.2%
11.3%19.2%
36.7%
19.8%
59.5%
0.6%0%
10%20%30%40%50%60%70%80%90%
Agr
icu
ltu
re, h
un
tin
g,fo
rest
ry a
nd
fis
hin
g
Min
ing
and
qu
arry
ing
Man
ufa
ctu
rin
g
Elec
tric
ity,
gas
an
dw
ate
r su
pp
ly
Co
nst
ruct
ion
Wh
ole
sale
an
d r
etai
ltr
ade
Tran
spo
rt, s
tora
gean
d c
om
mu
nic
atio
n
Fin
anci
alin
term
edia
tio
n,…
Co
mm
un
ity,
so
cial
and
pe
rso
nal
se
rvic
es
Pri
vate
ho
use
ho
lds
Unionization rate per sector

Strikes and intimidation
Data source: Statistics SA. Data source: Statistics SA.
Strike participation rate Intimidation-related absenteeism
0%
1%
2%
3%
4%
5%
6%
7%
8%
9%
10%
2006 2007 2008 2009 2010 2011
Strike participation rate (% of union members)
28 405
77 259
52 832
135 304
0
20 000
40 000
60 000
80 000
100 000
120 000
140 000
160 000
2008 2009 2010 2011
No. citing violence, unrest orintimidation as the primaryreason for not workingduring the year

Skills shortages
Skills shortage by occupation
Data source: Adcorp Analytics.
Data source: Adcorp Analytics.
Skilled workers’ remuneration
Occupation Skills
shortage (000s)*
Manager 216.2
Professional 178.4
Technician 432.1
Clerk 86.6
Sales and service worker 104.3
Skilled agriculture 3.1
Craft and related trade 65.5
Plant and machine operator 72.0
Elementary worker -967.6
Domestic worker -247.4
Total -56.8R 0
R 50 000
R 100 000
R 150 000
R 200 000
R 250 000
R 300 000
R 350 000
R 400 000
R 450 000
R 500 000
19
97
19
98
19
99
20
00
20
01
20
02
20
03
20
04
20
05
20
06
20
07
20
08
20
09
20
10
Average after-inflation remuneration -high-skilled workers (Rands)
Immigrations Act (2002)

Affirmative action
Number of high-income Blacks
Data source: Statistics SA. Data source: Statistics SA.
Average Black income
0
200 000
400 000
600 000
800 000
1 000 000
1 200 000
1 400 000
20
00
20
01
20
02
20
03
20
04
20
05
20
06
20
07
20
08
20
09
20
10
20
11
Number of high-income black South Africans (number earning more than the average white income)
0%
5%
10%
15%
20%
25%
30%
35%
40%
45%
20
00
20
01
20
02
20
03
20
04
20
05
20
06
20
07
20
08
20
09
20
10
20
11
Average black income (percentage of average white income)

The trouble with Statistics SA’s estimates
Variable
Statistics SA estimate (QLFS
Q4 2011)Actual/verified
figure Source for actual/verified figureUndercount
(percent)
No. of taxpayers (individuals and businesses) 7 263 092 7 998 794 SA Revenue Service Tax Statistics 2011 9.2%
No. of business owners 1 969 767 5 579 767 The Business Trust (2011) 64.7%
Net new business taxpayers 354 694 – SARS Tax Amnesty 2003-2010 17.1%
Net new individual taxpayers 2 512 397 – SARS Tax Amnesty 2003-2010 42.2%
No. of businesses registered for VAT (active businesses only) 574 928 664 267 SA Revenue Service Tax Statistics 2011 13.4%
Percent of employees reporting PAYE/SITE deductions by their employers 57.0% 70.0% SA Revenue Service Tax Statistics 2011 13.0%
Percent of employees reporting UIF deductions by their employers 58.0% 77.4% SA Revenue Service Tax Statistics 2011 19.4%
No. of individual UIF contributors 6 602 197 7 919 290 Unemployment Insurance Fund Annual Report 2011 16.6%
No. of UIF recipients 80 577 183 040 Unemployment Insurance Fund Annual Report 2011 56.0%
No. of medical aid or health insurance principal members 3 712 168 3 612 062 Council for Medical Schemes Annual Report 2011 -2.8%
Compensation of employees (R millions) 1 066 370 1 317 655 Statistics SA GDP Q4 2011 19.1%
No. reporting did not know/specify or refused to disclose income 1 045 730 – Statistics SA QLFS Q4 2011 23.7%
No. receiving wage increments in line with Bargaining Council agreements 1 035 320 1 765 230 National Association of Bargaining Councils (2011) 41.3%
No. receiving social grants (old age, veteran, child support, etc.) 11 500 132 15 028 969 SA Social Security Agency Statistical Report No. 41 (p. 8) 23.5%
No. underemployed (vs. no. willing to work additional hours/do extra work) 524 998 2 051 894 Statistics SA QLFS Q4 2011 74.4%
Average undercount (percent) 28.7%
Data sources: Statistics SA Quarterly Labour Force Survey (2001-2011). Other sources as indicated.
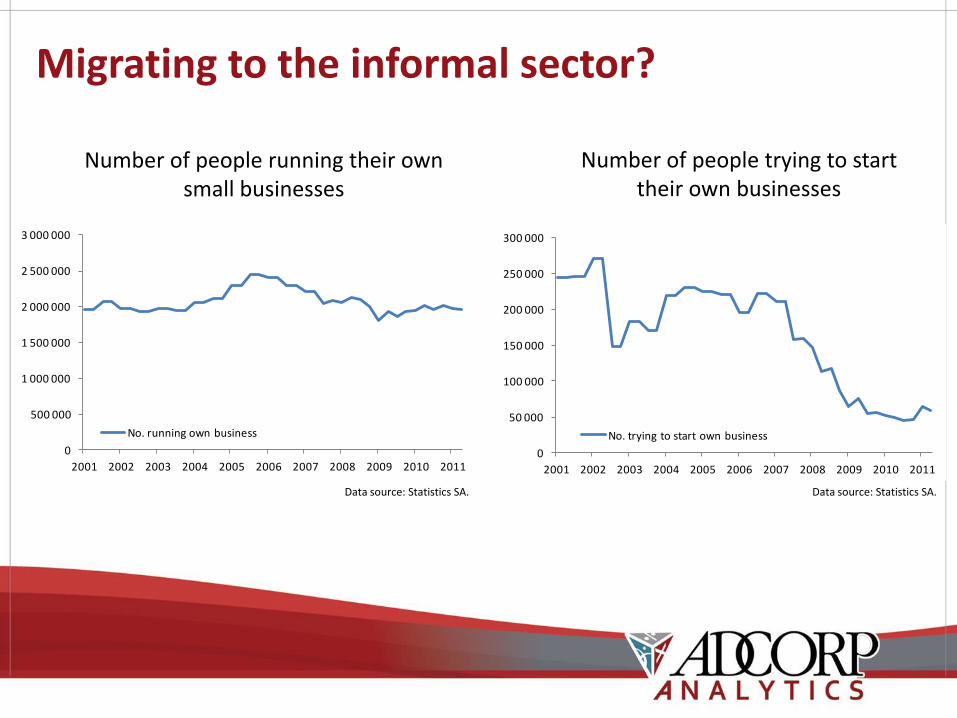
Migrating to the informal sector?
Number of people running their own small businesses
Data source: Statistics SA.
0
500 000
1 000 000
1 500 000
2 000 000
2 500 000
3 000 000
2001 2002 2003 2004 2005 2006 2007 2008 2009 2010 2011
No. running own business
0
50 000
100 000
150 000
200 000
250 000
300 000
2001 2002 2003 2004 2005 2006 2007 2008 2009 2010 2011
No. trying to start own business
Data source: Statistics SA.
Number of people trying to start their own businesses

The cash economy
0
50
100
150
200
250
300
350
400
19
70
19
74
19
78
19
82
19
86
19
90
19
94
19
98
20
02
20
06
20
10
Ban
k n
ote
s an
d c
oin
in
cir
cula
tio
n
ou
tsid
e t
he
ban
kin
g sy
ste
m /
Gro
ss
do
me
stic
exp
en
dit
ure
(all
con
stan
t
20
05
pri
ces,
ind
ex
19
70
=1
00
)
Bank notes and coin in circulation
Gross domestic expenditureLabour Relations Act (1995)
Notes and Coin in Circulation vs. Gross Domestic Expenditure
Source: South African Reserve Bank (2011)
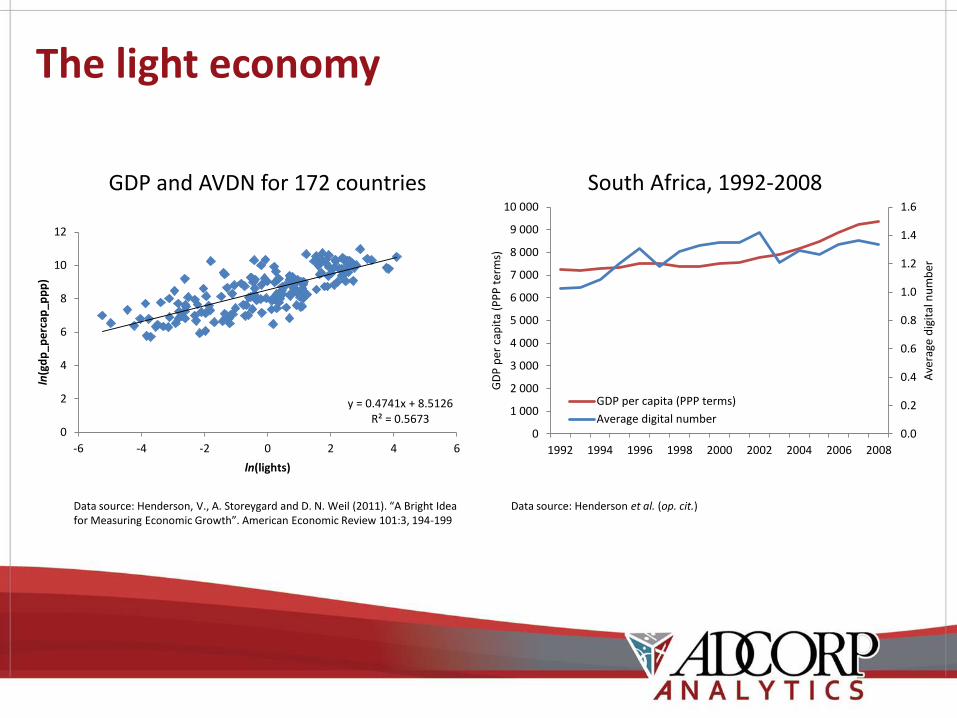
The light economy
y = 0.4741x + 8.5126R² = 0.5673
0
2
4
6
8
10
12
-6 -4 -2 0 2 4 6
ln(g
dp
_pe
rcap
_pp
p)
ln(lights)
Data source: Henderson, V., A. Storeygard and D. N. Weil (2011). “A Bright Idea for Measuring Economic Growth”. American Economic Review 101:3, 194-199
0.0
0.2
0.4
0.6
0.8
1.0
1.2
1.4
1.6
0
1 000
2 000
3 000
4 000
5 000
6 000
7 000
8 000
9 000
10 000
1992 1994 1996 1998 2000 2002 2004 2006 2008
Ave
rage
dig
ital
nu
mb
er
GD
P p
er c
apit
a (P
PP
ter
ms)
GDP per capita (PPP terms)
Average digital number
GDP and AVDN for 172 countries South Africa, 1992-2008
Data source: Henderson et al. (op. cit.)