adaptive shock control bumps - imperial college … p 0 = 1 y d p 0 1 r y d 0 p 1 + 1 2 m 2) 1 dy...
TRANSCRIPT

Adaptive Shock Control Bumps
E. Jinks∗, P. J. K. Bruce† and M. Santer‡
Department of Aeronautics, Imperial College London, London, SW7 2AZ
This paper describes a numerical investigation into the optimal design of adaptive shockcontrol bumps (SCB) for transonic wings. A multi-disciplinary approach to optimizationis utilized, combining structural and aerodynamic analysis to ensure that optimal adaptiveSCB do not exceed material constraints whilst maintaining aerodynamic qualities. It isfound that adaptive SCB can perform to within 95% of the non-structurally constrainedbumps but over a much wider flight envelope. Two dimensional single crest bumps havebeen shown to match the performance of table top bumps originating from three dimen-sional SCB. Total pressure recovery has been successfully used as a performance metric andwill provide valuable comparisons to wind tunnel experiments with a prototype adaptiveSCB.
I. Introduction
Flow control techniques have been an established part of aeronautics for many decades and have rangedfrom early stage wing fences to highly adaptable morphing wings. Shock control bumps (SCB), are one
such type of passive flow control device which have shown promise for use on conventional supercriticalwings and are particularly well-suited to natural laminar flow (NLF), wings. The large extent of favorablepressure gradient extending over the upper surface results in a large pocket of supersonic flow which isterminated by a strong near-normal shock wave at x/c ≈ 0.65. Compared with earlier transonic airfoildesigns the shockwave is further back to maximize the region of favourable pressure gradient. This increasesthe maximum Mach number on the upper surface to M ≈ 1.4, increasing the strength of the shock inducedadverse pressure gradient. This can negatively affect the health of the boundary layer and at worst, causethe flow to separate. The total pressure losses from a Mach 1.4 shock are significant and contribute to thewave-drag associated with transonic flight and form one of the bounds of cruise Mach number.
The SCB was a concept originally proposed in 19921 and in its original guise featured a flexible surfacethat could deform to create a bump beneath a shock. Throughout the EUROSHOCK II study, the adaptivebump idea was placed on hold whilst the aerodynamic characteristics of SCBs were explored. As an entirelystructural project there have been results presented with a new family of bumps based upon possible shapesof an adaptive plate with particular focus to spring loaded actuators. However, an experimental aerodynamicanalysis of these bumps was not carried out.2 The new SCB shape family aim was to minimize the energyterm in the small deflection, Euler-Bernoulli linear theory. Other objective functions included maximumforce criterion although there was only a slight difference in the force distribution. The geometries producedvia the actuator optimization technique did show significant drag reductions compared to the clean ADIFNLF (natural laminar flow) airfoil (14%) and similar reductions to the polynomial bump (15%). Structuralanalysis of adaptive bumps has taken various forms, from optimization with respect to actuators2 to tubesprings that generate suitable displacements.3 The designs stemmed from the need to bypass the poor off-design characteristics of NLF airfoils. Significant levels of work have been conducted ranging from the earlyairfoil scale experimental4 and numerical,5 studies to the most recent investigating of small-scale vorticalpatterns developed from 3D bumps.6,7
The shock structure shown in figure 1 is known as a bifurcated shock or λ-shock . The benefits of this typeof shock are that the two stage compression is more efficient in reducing the Mach number in terms of total
∗PhD Candidate, AIAA Member†Lecturer, AIAA Member‡Senior Lecturer, AIAA Member
1 of 15
American Institute of Aeronautics and Astronautics

p0/p0∞
Clean Airfoil
With bump
1.00.9
M < 1 M > 1 M < 1
Nearly Normal
Shock
Shock bump size exaggerated
Area to minimize
Figure 1. Typical shock structure and downstream total pressure recovery for transonic airfoil fitted withSCB. Shock bump enlarged for clarity.
pressure recovery. A close up of the structure is presented in figure 2; the increase in efficiency occurs becausethe strength of the normal shock at the rear leg is reduced. Typical bump heights are 0.4%c 6 hb 6 0.8%cwith lengths of roughly lb = 0.2c. To maximize this pressure recovery and hence decrease overall drag, theheight of the triple point needs to be as high as possible. Experiments8 have shown heights of up to 0.06c areachievable in wind tunnel tests.9 This is limited by the maximum turning angle of the upstream supersonicflow and feasible bump lengths.
Mach ~1.4 Mach < 1
Boundary layer
Front Leg Rear leg
Triple point
Figure 2. Typical λ-shock structure across an SCB
Much of the work regarding SCB has focussed upon static bumps and optimal design to ensure robustperformance over a wide range of operating conditions; particularly Cl and M∞. An SCB with suitableoff-design performance is yet to be found without a corresponding sacrifice to on-design flow conditions. Theadaptive SCB has the potential to negate the off-design performance drops associated with static bumpsthrough the use of a morphing surface. Combining an adaptable SCB with an optimal design study, aphysical wind tunnel model has been made for use in the supersonic facility at Imperial College London.
In this paper we aim to:
• Assess performance of bump shapes optimized for the mechanical limits of the material as well as theactuation system and aerodynamic performance;
• Discuss the relevant geometries for adaptable bump shapes.
These are carried out by means of a developed optimization framework that includes both aerodynamicand structural constraints.
2 of 15
American Institute of Aeronautics and Astronautics
II. Adaptive SCB Design
The general shape and positioning of SCB have always been considered important variables and the keybump scale parameters are initial ramp angle and crest height,10 these determine the structure of the λ-shockand hence the potential total pressure recovery.
There have been many optimization studies based upon buffet alleviation, L/D ratio and total pressurerecovery. As the technology becomes more practically feasible it is timely to consider structural behav-ior. Incorporating structural optimization in tandem with aerodynamic analysis aids the feasibility of thetechnology. Designs have been developed which permit structural morphing,2,11 but the transient effects ofbump deployment have not yet been considered.
A. Optimization
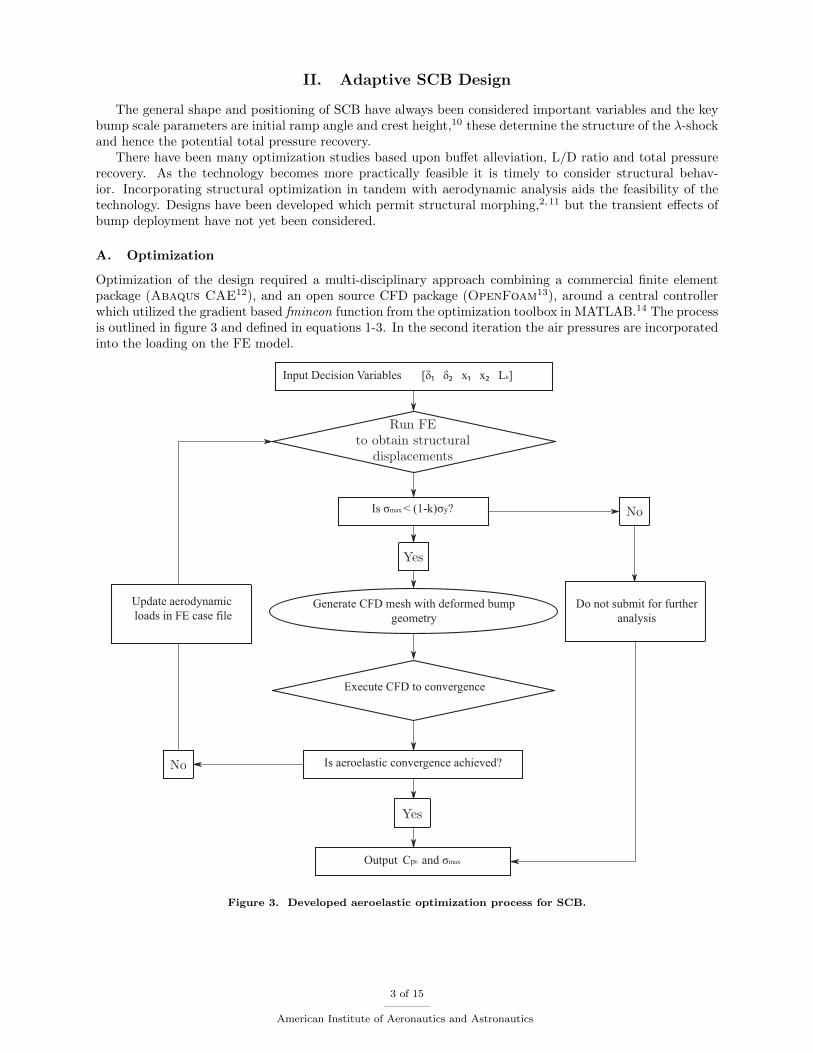
Optimization of the design required a multi-disciplinary approach combining a commercial finite elementpackage (Abaqus CAE12), and an open source CFD package (OpenFoam13), around a central controllerwhich utilized the gradient based fmincon function from the optimization toolbox in MATLAB.14 The processis outlined in figure 3 and defined in equations 1-3. In the second iteration the air pressures are incorporatedinto the loading on the FE model.
Input Decision Variables [δ1 δ2 x1 x2 Lb]
Generate CFD mesh with deformed bump
geometry
Execute CFD to convergence
Do not submit for further
analysis
Update aerodynamic
loads in FE case file
Is aeroelastic convergence achieved?
Output Cp0 and σmax
Is σmax < (1-k)σy?
Figure 3. Developed aeroelastic optimization process for SCB.
3 of 15
American Institute of Aeronautics and Astronautics

∆Cp0 = 1ydP0∞
∫ yd0P(
1 + γ−12 M2)
γγ−1
)dy (1)
min {∆Cp0} (2)
s.t.
σmax ≤ (1− k)σy (3)
In which ∆Cp0 is total pressure coefficient change between the free stream and a location downstream ofairfoil. yd the height of the CFD domain, σmax is maximum stress in FE analysis and σy is the yield stressof the material.
The aim of the optimization is to minimize the loss of total pressure caused by the shockwave andcompute optimum values for the decision variables listed in equation 4 and portrayed in Figure 4. Totalpressure recovery is chosen as the design metric as it allowed for greater distinction between viscous andwave drag effects than lift or drag based measurements. Total pressure measurements are also comparableto those taken from the wind tunnel described in Section IV. As adaptive SCB will be deployed in the cruiseregime of a transonic aircraft, there will always be a significant total pressure loss across the range of Machnumbers of cruise.
x1x2
Lb
δ1 δ2
Figure 4. SCB decision variables used in the aeroelastic optimization.
D = [δ1 δ2 x1 x2 X1] (4)
A 2D bump shape was chosen because of the superior on-design performance when compared to 3Dbumps.15 Off-design, the capabilities of 2D geometries deteriorate significantly when the shockwave movesfore and aft with unsteady freestream conditions. The extensive justifications throughout the EUROSHOCKII project16 also allude to the greater drag reduction potential of two dimensional bumps with three di-mensional bumps offering greater flow control characteristics. If the shape of the bump is to be adaptedthroughout flight with changing lift requirements during cruise then the potential drag savings are greaterwith a 2D bump as well as the reduction in computational cost.
The SCB were limited to shapes in within the loaded beam family: this ensures a shape that is physicallypossible within material and airframe integration constraints as well as meeting the geometrical requirementsof flow-structure interaction. Figure 517 nicely summarizes the number of bump families available with aminimal number of design variables, height and crest location are key with other variables reported tohave minor effects.9 The length of the bump was chosen to be lb = 0.2c based upon typical values foundpreviously.10,16 For a chord length of one metre this meant lb = 200 mm which is a suitable size for windtunnel testing, Section IV. The system has been artificially limited to two actuation points as the majorityof 2D bump shapes could be achieved without the complexity of more. The three stages created by twoloading points incorporate the initial ramp and two sections for the gradual turning of flow to return it toa stream-wise direction. An extensive experimental study9 suggested that this table-top design is amongthe most promising for drag reduction alone so will be used as a starting point for the optimization prior tomore specific designs.
B. Structural Analysis
Including a finite element analysis provides the structural constraint and ensures continuity if rotationbetween the airfoil and the modified bump section. An optimization study18 found the family of loaded beamgeometries offers a high enough wave drag reduction with minimal viscous drag increase when compared towedge type bumps, concave polynomials and high order polynomials. The shape continuity associated with
4 of 15
American Institute of Aeronautics and Astronautics

Loaded Beam Triangular Shape Polynomial Concave Polynomial
Figure 5. Minimal design variable bump shapes17
beam bending shapes led to less severe changes in pressure distribution along the top surface which will notonly lend itself to material constraints but also handling constraints of the aircraft when adaptive bumpsare deployed.
A geometrically nonlinear, quasi-static finite element analysis was setup to model the plate section withbuilt-in ends and constant loads across the span. A mesh convergence study was carried out and theresults presented in figure 6. The results show a significant number of elements are required in order toreach a satisfactory percentage of the analytical solution. The output consisted of deflection and von Misesequivalent stress for each shell element. The necessary repetition of deployment is essential and so thesystem must remain in the elastic regime to avoid plastic deformation of the material. The yield stress ofthe material represents the upper limit and is given at 525 MPa with a 10% safety margin correspondingto the material properties of AL-7075-T6. (E = 72 GPa, ν=0.33, t=0.6 mm). This was applied to ensurethat any imperfections within the material were accounted for as well as to help reduce the effects of cyclicloading when in potential airframe use. Bump shapes that met this criteria were then used to create themesh used for CFD.
500
400
300
200
30 00020 00010 0000
Number of elements
Max
imu
mst
ress
,σy
AnalyticalFE Solution
Figure 6. Finite Element mesh convergence
C. Aerodynamic Analysis
The CFD analysis was completed using the sonicFoam13 solver within OpenFoam that is designed forapplications to transonic flow. It solves the Reynolds Averaged Navier-Stokes equations through the finitevolume method. The turbulence model used is k-ω-SST, combining the near wall properties of K-ω and thefreestream handling of K-ε. The model also lends itself to the adverse pressure gradients apparent aroundthe shock region. The RAE2822 supercritical airfoil is used to provide a proven testbed for the aerodynamicaspect of the optimization. The curvature over the top surface of the airfoil is not particularly severe with a
5 of 15
American Institute of Aeronautics and Astronautics

maximum thickness of 0.121c occurring at x = 0.5c which lends itself to a larger variety of shock locationsfor subtle changes in pressure distribution than thicker airfoils.
Mesh refinements were added to the boundary layer and expected shock region to better capture theflow as shown in figure 7, in order to increase solution accuracy. Wall functions were avoided due to thehigh likelihood of bump induced separation which the k-ω-SST model should capture. In order to ensureindependence of the results from the mesh, numerous algorithms were employed to design a mesh tailoredto airfoils. The relatively small changes of airfoil geometry, typically 0.02%c between bump iterations,meant that mesh optimization could be completed outside of the aero-structural optimization resulting in areduction of the computational time. Mesh independence tests were carried out adjusting the cell density,airfoil surface coverage and overall domain size to ensure that the boundaries were sufficiently far away tonot interfere with the solution. A structured C-grid setup with quad-elements was chosen with upper andlower boundaries placed 7 chord lengths away with an outlet boundary condition placed 10 chords lengthsdownstream which allowed sufficient room for the wake to grow and pressure waves to propagate freely.
The mesh was first generated using a linear transfinite interpolation scheme to produce an initial gridbased upon the boundary grid node distribution at the surface of the airfoil.11 This basic mesh was thenelliptically refined based upon the solution of a set of partial differential equations which were known toproduce a grid with smoothly varying cell sizes and slopes of grid lines.19 The orthogonality of the gridlines at the airfoil can be controlled within the elliptic refinement alongside the implementation of Neumannorthogonality boundary conditions. This was done to calculate the position of the boundary node along theairfoil surface to ensure orthogonality. The mesh produced from this series of algorithms successfully passedopenfoam’s built in mesh checking function, checkMesh.
Mesh generation method Max non-Orthogonality Mean non-Orthogonality Max Skewness
Linear TFI 70.55 18.33 1.93
TFI + elliptical refinement 70.57 13.40 2.70
Neumann boundary conditions 23.30 5.96 0.30
Table 1. Mesh refinement effects11
The case was decomposed via the scotch decomposition method which evenly distributed cells acrossthe specified number of processors, this was deemed the most efficient method of decomposition withinopenfoam. A converged solution of the clean RAE2822 airfoil was used as an initial starting conditionfor each of the bump analyses which were then mapped to the new mesh at each iteration. Each CFDsimulation within the optimization was then run to convergence, the convergence criteria were set for whenthe residual for velocity fields were below 10−7 and pressure fields 10−18 for each time step. Post-processingof the solution required the computation of the total pressure field as this was not calculated or stored ateach time step in order to speed up the computation times.
This mesh, appropriate boundary conditions and the solver were combined in order to complete a study ofthe clean wing setup. The results have been compared to a NASA study on the same airfoil20 with comparableshock position and surface pressure distribution. In order to make best use of the SCB the freestream Machnumber was increased to M∞ = 0.78 which produced a strong shock Mshock = 1.4.4,1, 17,21,22 This strength ofshock wave was chosen as it represents a maximum upstream Mach number prior to downstream separation.Post-shock separation usually occurs with upstream Mach numbers around Msepn ≈ 1.5. The validationresults in figure 7 show that the model is a suitable representation to the experiment based upon the locationof the shockwave. The CFD placed the shock at xs = 0.582c calculated by the interpolation between thepre and post shock pressures. The experiment20 showed a more gradual pressure rise downstream whichhas lengthened the interaction region; with the same technique, the position of the shock was xs = 0.591c.This variation of less than 1%c is deemed sufficient with the majority of the cases20 placing the shock within2%c. The minimum pressure is within 7% of the experimental value which was measured to within 0.26%error. The validations in the previous studies also failed to capture this peak value however the remainder ofthe flow field was captured well.The region of low pressure at the nose was not captured well and so furtherwork is being carried out to evaluate this however the main criteria of shock location and strength are withinsuitable margins of the experimental data. These are the important criteria that must be upheld.
6 of 15
American Institute of Aeronautics and Astronautics

(a) (b) (c)
Figure 7. (a) Typical C-mesh for airfoil. (b) Refined mesh around shock location. (c) Refined mesh at noseof airfoil.
0 0.2 0.4 0.6 0.8 1
1.5
1
0.5
0
0.5
1
1.5
sonicFoamExperiment
Cp
x/c
Figure 8. Pressure profile comparison of RAE2822 airfoil M∞ = 0.73, α = 3.19◦
7 of 15
American Institute of Aeronautics and Astronautics

0.5 0.6 0.7 0.8 0.9 10
0.05
0.1Rear Half Airfoil with Bump
x/c
y/c
0.55 0.6 0.65 0.7 0.75
0.04
0.045
0.05
0.055
0.06
0.065Rear Half Airfoil with enlarged y−axis
x/c
y/c
Figure 9. Rear half of airfoil with optimal bump, (table 3 w/ Constraint).
III. Results for Static SCB
With the greater investigation of three dimensional bumps shapes in recent years,6,23,7 the simple SCBshapes shown in figure 5 have been expanded to include table tops and shoulder radii which are now recognizedas important design variables through experimental laser diagnostic methods, PIV and LDA. The flowstructure can be analysed around these complex three dimensional SCB with these methods and as suchthe fine tuning of these shapes can be investigated and validated. This has meant that it is now possible toevaluate much more of the flow field surrounding SCB and the purpose of bumps is moving away from onlyshock control devices but more general flow control.
The optimization stages now appear to be split into two scales, the first focussing on large-scale flowfeatures such as bump height and crest location and smaller scaled features such as shoulder ramp angle.This approach, necessary with 3D bumps, was applied to the infinite span adaptive 2D bumps in order toensure a suitable table top design in order to minimize the effects in the boundary layer whilst maintainingan efficient bump with respect to pressure. The health of the boundary layer after the bump is integral inorder to recover the maximum amount of total pressure downstream of the airfoil. This will be discussedfurther in Section III C.
In order to reduce computational time a pseudo-transient approach was employed which meant that theflow effects were not included in the structural analysis until a time-converged solution was found.
The original shock location for the free stream conditions M∞ = 0.78 α = 3.19 was located atxshock=0.68C. The results showed that the shock underwent an average movement of 1-2%C for an ar-bitrarily placed bump suggesting their suitability for shock holding.
Optimal Bump Geometry
The bump geometries produced by the optimization process were found to be heavily dependent upon theinitial conditions submitted to the process. The search criteria were then widened in order to explore therealm of the domain further however this still resulted in local minima very close to the initial conditions.The reason for such seemingly limiting behavior is that the structural constraint was limiting the height ofthe bumps to a level below that of aerodynamic optima shown previously.24 This opened a broad family ofoptimal bumps2 that offer the maximum aerodynamic benefits with feasible material constraints. For thestatic bumps the study had two aims, the first was identifying the behavior of the optimization process dueto the structural constraint and the second focussed upon the flow structure surrounding the bump.
8 of 15
American Institute of Aeronautics and Astronautics

A. Structural Constraint Limitations
The optimization process in figure 3 was completed with and without the structural constraint in order toview the effect directly. Starting from an initial condition as described in Table 2 the optimizer was allowedto explore the design space in order to minimize the total pressure lost downstream. The values of eachiteration are shown in figure 10 with the constrained problem converging to a local minima with a fewernumber of iterations. The final, optimal bumps are presented in Table 3 and the difference is appreciable.The sketch in figure 11 shows the change of the optimal SCB geometry with and without the materialrestriction.
1 2 3 4 5 6 7 8 9 10 11 120.85
0.9
0.95
1
1.05
Iteration Number
Rel
ativ
e ∆
Cp0
w/ Constraintw/o Constraint
∆Cp0=0.041
Figure 10. Total pressure loss, ∆Cp0, for optimizer iterations with and without the structural constraint.Iteration 1 represents the initial condition.
By comparing the crest height of these bumps it can be seen that they are both within the range ofpreviously found values, 0.4%c and 0.8%c.25,26 However these values did not take into account materiallimitations which have been shown in this study to restrict the crest height of the bumps.
x1 (%lb) x2 (%lb) δ1 (mm) δ2 (mm) X1 σmax (MPa) ∆Cp0
0.55 0.622 4.5 4.5 0.59 373.69 1
Table 2. Initial conditions for structural constraint test. The cases presented in Tables 3 and 5 are normalizedagainst these initial conditions
x1 (%lb) x2 (%lb) δ1(mm) δ2 (mm) X1 σmax (MPa) ∆Cp0
w/ Constraint 0.56 0.63 4.75 4.47 0.59 387.28 0.919
w/o Constraint 0.61 0.70 5.91 6.56 0.68 � σy 0.878
w/ Single Load 0.56 - 4.75 - 0.59 372.2 0.938
Table 3. Optimal bump shapes for structural constraint test. Plastic deformation and material failure werenot included in the FE model to speed up optimization.
During the iterations of the optimization process, the optimal bumps produced were seen to remain veryclose to the initial conditions. Manual tuning of the decision variables was undertaken to force the processto look further afield in order to explore the optimization domain. The optimal bump variables remainedclose to the initial conditions in all except the unconstrained case suggesting that the structural constraintis an important factor with respect to shaping the optimal bump geometry.
The movement of the unconstrained bump away from the initial condition highlights that a poorlydesigned and located unconstrained bump is worse than a poorly positioned constrained bump. Thereforethe tolerances for a structurally optimized bump seem far greater than a unconstrained bump. This largerenvelope for efficient design will be beneficial to the final applications on aircraft wings.
9 of 15
American Institute of Aeronautics and Astronautics

Initial Condition
w/o Constraintw Constraint
Figure 11. Sketch comparing bump shapes
The result produced from the unconstrained approach led to a bump with a larger front face for the shockto straddle and therefore a higher triple point and larger lambda. The effect of this can be seen in figure12 which shows the incremental increase in total pressure recovery as bump height is increase, particularlybetween 0 ≤ hd ≤ 0.05 where the larger the bump, the higher the total pressure recovery downstream of theairfoil. The relative area changes are measured by the ∆Cp0 value in Table 3 and against the datum case inTable 4.
From figure 12 the beneficial effects of SCB can be easily identified with the significant reduction in totalpressure loss. The area that represents the total pressure loss has been reduced by 15% with the constrainedbump and 19% without the structural constraint. However this was an expected result. If the flow were todeviate or Mcruise change as often required, the shock position would alter and the higher bump would havea much larger penalty due to its presence within the boundary layer. Not only would the smaller, constrainedbump have less of an effect due to the obstruction in the flow, the existence of many local minima nearbyoffers a very wide operating envelope for a given constrained bump design. As well as the lower bumpalleviating some of the off-design deterioration it is adaptive and would be able to adjust to the new flowconditions and perform to within 5% of a static bump that was optimised for the new flow conditions.
0.82 0.84 0.86 0.88 0.9 0.92 0.94 0.96 0.98 1−0.05
0
0.05
0.1
0.15
0.2
p02/p01
Non
−di
men
sion
aliz
edd
dist
ance
from
dom
ain
cent
re li
ne, h
_d
Datum
w/ Constraint
w/o Constraint
Figure 12. Downstream pressure profiles comparison between clean, constrained and unconstrained bumpcases.
Case ∆Cp0 Relative to Datum
Datum 0.0484 1
w/ Constraint 0.0414 0.85
w/o Constraint 0.0396 0.81
Table 4. Numerical values for ∆Cp0 with reference to M∞ = 0.78, α = 3.19◦
10 of 15
American Institute of Aeronautics and Astronautics

B. Single Crest SCB
The table top feature, which has been a significant feature of the most recent three dimensional bumps, hasbecome less prominent during the two dimensional optimizations which have converged to a near single peakgeometry. This suggests that not all design protocols are applicable to both sets of shock control bumps(2D/3D) and could be a characteristic of their differing roles. Figure 13 highlights the subtle differencesbetween a single load and the optimal design from Table 3. The differences in the diagram are slighthowever the crest of the optimal bump is located 5.4 mm further back and 0.03 mm higher due to theeffect of the second loading point. This results in a ∆Cp0 = 0.938 which means that less total pressure wasrecovered than the optimal constrained bump (0.919). The optimization process for a single crest bumpwould be significantly less computationally expensive and would lead to a simpler actuation system for theexperimental model.
The single crest concept supports the assertion that two dimensional bumps are control devices thatshould be used primarily to control the shock structure. This is in contrast to three dimensional bumpsthat are able to impart flow structures to the boundary layer much more readily, giving greater general flowcontrol over the rear half of the airfoil.
0 20 40 60 80 100 120 140 160 180 2000
1
2
3
4
5
x distance (mm)
he
igh
t (m
m)
Single Load
Table Top
Figure 13. Comparison between single displacement and table top design bump geometries
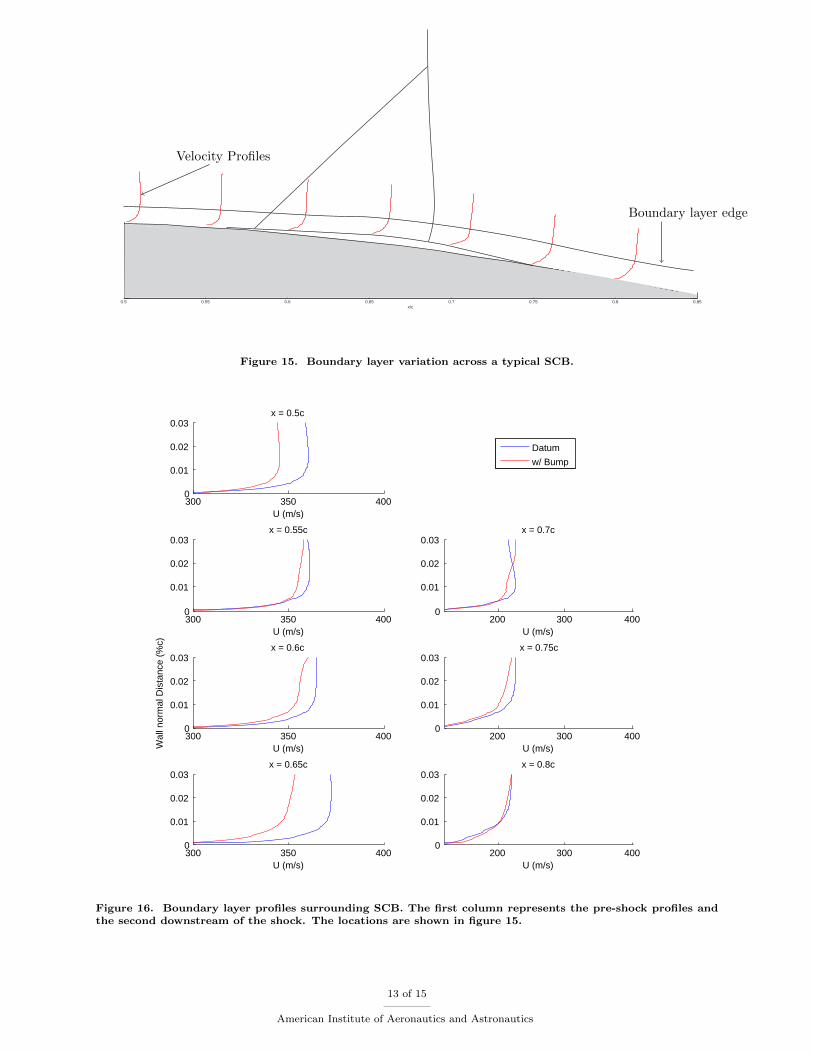
C. Boundary Layer Interaction
The boundary layer is a significant feature within the λ-shock and was subject to significant change whena bump is deployed. From a constrained bump optimization analysis with initial conditions, Table 5 theboundary layer profiles have been plotted in figure 16 alongside the datum airfoil case for comparison. Thislocal minimum has shown the potential of a lower bump a height similar to previous studies.25 Also ofnote is the initial table top condition having been removed in favour of a single crest SCB. The boundarylayer profile locations were selected for their positions with respect to key bump features. From the mostupstream location at x = 0.5c the velocity profile appears to have a very similar shape although lower freestream velocity than the datum case. This could be due to the presence of the bump being known byupstream propagation of pressure waves through the subsonic section of the boundary layer. In order toconfirm this idea high frequency pressure measurements at the wall are proposed as a measure to see if anysimilar fluctuation patterns are observed at the corresponding datum and bump shock conditions.
x1 (%lb) x2 (%lb) δ1 (mm) δ2 (mm) X1 σmax (MPa) ∆Cp0
Initial Condition 0.5 0.25 4.0 4.0 0.55 309.26 0.917
Local Minima 0.51 0.651 4.39 3.44 0.54 303.96 0.793
Table 5. Structural constraint at bump start location, X1 = 0.55c, reference to initial condition bump, table 2
The profile extracted prior to the bump at x = 0.55c sits at the starting position of the SCB, the smearingof the velocity away from the wall as the flow reacts to the initial change in slope and the correspondingpressure waves that reached the surface either side of the start point. At x = 0.6c after the front leg of theλ-shock the flow is subject to continuously changing slope up to a maximum of 3◦. The greater velocities atthe top of the x = 0.6c graph support the expected boundary layer compression as the flow adjusts to the
11 of 15
American Institute of Aeronautics and Astronautics

new direction as enforced by the bump . The profiles begin to become less full which indicates the boundarylayer energy moving further away from the wall. This was most likely a combination of boundary layerthickening due to the adverse pressure gradient across the shocks as well as the curvature of the geometry.
The curvature of the loaded beam family of geometries are much more sympathetic to boundary layersthan the sudden deformation of a triangular shape. The effect at location x = 0.55c would have been muchmore severe with a sudden angle change with a larger loss of momentum in the near wall region. Thegradual increase in curvature smoothes the adverse pressure gradient across the oblique shock. The effect ofthe smeared front leg shock is also beneficial to the material as the loading is spread across the built-in endsof the bump which are the most highly stressed regions. As the flow is compressed due to the turning, theskin friction increases27 on the front surface of the bump. This could potentially increase the viscous lossescaused by the bump which are visible in figure 12 in the region directly downstream of the airfoil.
The shockwave was located much further downstream on the bump than expected (figure 14) with thecrest of the bump preceding the rear leg of the shockwave. This was not something that conformed to previousliterature and could be attributed to the combination of an airfoil study with the goal of maximising totalpressure recovery. The arc of the sonic line and the surrounding pressures that define where the global sonicline is positioned could be too far into the freestream for the near-wall SCB to affect.
The area of supersonic flow around the crest of the SCB expands the flow and accelerates it to form anotherλ-shock structure at the foot of the main rear leg. This secondary λ-shock rear leg remains perpendicularto the wall for a distance of 0.03%c which coincides with an increase in p02/p01 recovery in figure 12. Thisdouble λ structure may be an effect of optimising the bump for maximum total pressure recovery. By holdingthe shock downstream of the crest it causes curvature of the shock as well as increasing the height of thetriple point. This would further increase total pressure recovery by covering a larger area into the freestream.Careful balancing would be required between the level of expansion and resultant boundary layer thickeningwith the increase in pressure recovery. Enforcing another λstructure post crest would reduce the adversepressure gradient further as long as the mach number in this region did not exceed that of the main rear leg,Mshock ≤ 1.4.
(a)
0.4
Mach
1.4
(b)
0.4
Mach
1.4
Figure 14. (a) Mach field view. (b) Zoom view of Bump region.
IV. Continuing Work: Experimental Adaptive Shock Control Bumps
Some of the issues presented in previously are more reliably evaluated experimentally where the restric-tions of computational models and resources are not an issue. Placing shock control bumps on the flatsurface of the wind tunnel makes it easier to take good quality measurements rather than being restricted tothe confined space within airfoils. The analysis of the near-bump flow can be investigated on a much smallerscale through the use of optical techniques and will aid the validation of optimal bump shapes.
Due to a combination of the findings in Section B and mechanical practicality a single crest beam shapewas created and the result is shown in Figure 17. The finite element analysis captures the shape of the bumpwell however there are some slight differences at approximately 0.65lb. This has been attributed to the edges
12 of 15
American Institute of Aeronautics and Astronautics
0.5 0.55 0.6 0.65 0.7 0.75 0.8 0.85
x/c
Boundary layer edge
Velocity Profiles
Figure 15. Boundary layer variation across a typical SCB.
300 350 4000
0.01
0.02
0.03
U (m/s)
x = 0.5c
Datum
w/ Bump
300 350 4000
0.01
0.02
0.03
U (m/s)
x = 0.55c
300 350 4000
0.01
0.02
0.03
U (m/s)
x = 0.6c
Wal
l nor
mal
Dis
tanc
e (%
c)
300 350 4000
0.01
0.02
0.03
U (m/s)
x = 0.65c
200 300 4000
0.01
0.02
0.03
U (m/s)
x = 0.7c
200 300 4000
0.01
0.02
0.03
U (m/s)
x = 0.75c
200 300 4000
0.01
0.02
0.03
U (m/s)
x = 0.8c
Figure 16. Boundary layer profiles surrounding SCB. The first column represents the pre-shock profiles andthe second downstream of the shock. The locations are shown in figure 15.
13 of 15
American Institute of Aeronautics and Astronautics

of the square rod that can be seen at 0.56lb, the shape of the corners will have to be analysed in order togive the most accurate displacements at various locations.
The adaptive SCB is fitted to the lower wall of the working section and consisted of a thin plate ofhigh-strength AL-7075-T6 (t = 0.6 mm, E = 72 GPa, ν = 0.33), which is to be deformed by a series of smallactuators positioned to replicate the geometries produced here. The captive linear actuators are capable ofproducing 80 N throughout the stroke of 13 mm. These can be seen in Figure 17 and will deform the 0.6mm sheet of aluminium to create the shape of the bump.
0 200100Streamwise distance along bump (mm)
Figure 17. Experimental model of single crest bump in Table 3. The finite element coordinates have beenoverlaid to compare the solutions.
Potential issues regarding the dissimilarity between the airfoil setup have been identified, in particularthe pressure difference between the low pressure supersonic air in the tunnel and the stationary ambient airoutside. This has been overcome with a sealing plate which will allow a pocket of air to remain under theflexible surface which will then equalize upon tunnel startup. The thickness of the sheet was tested for themaximum pressure difference of 0.6 Bar and should not suffer permanent deformation under loading.
By creating these bleed valves for the air under the bump to equalize upon startup they have also createda pathway for the high pressure air downstream of the shock to travel upstream, how much this affects theflow has yet to be seen however some sealing may be required even to limit the flow rather than eliminate itcompletely. The passage of these higher pressures may also have an effect on bump geometry and alter theshape with dependence upon the location of the rear leg of the shock and the corresponding pressure rise.This could then lead towards a passive flow control device whereby the thin sheet deforms creating a newfamily of SCB dependent entirely upon the shock location.
V. Conclusions and Continuing Work
The aero-structural optimization carried out has shown significant benefits when compared to the cleanairfoil with a marginal 5% decrease in performance when compared to the optimal unconstrained bump.These constrained bumps, due to the presence of many local minima, appear to be much more versatile fora wider range of shock positions. This work suggests that constrained SCB are able to achieve 95% of theunconstrained optimal performance across a wider envelope of shock locations due to flight conditions. Theadaptivity ensures that this positive influence is transferred beyond this range of small shock displacementsand can be applied to appreciable movements in shock position due to significant changes in flight conditions.
• Structural constraints do limit the height of achievable bumps but have a wider range of favorableoperating conditions even without adaptivity.
• Incorporation of adaptivity results in 95% of unconstrained optimal total pressure recovery over alarger flight envelope.
• Total pressure recovery has been successfully used as a performance metric and will provide a valuablecomparison with future experimental data.
• Differences have been found between 2D/3D design protocols, single crest bumps may be just as efficientas table top designs without the added complexity.
14 of 15
American Institute of Aeronautics and Astronautics
• Holding the shock position downstream of the crest increases triple point height and potentially in-creases total pressure recovery.
• A wind tunnel model has been developed for the experimental analysis of adaptive SCB with thecomputed geometry being very well replicated.
References
1Ashill, P., Fulker, J. L., and Shires, A., “A Novel Technique for Controllling Shock Strength of Laminar-Flow AerofoilSections,” First European Forum on Laminar Flow Technology, 1992, pp. 175–183.
2Wadehn, W., Sommerer, A., Lutz, T., Fokin, D., Pritschow, G., and S.Wagner, “Structural Concepts and AerodynamicDesign of Shock Control Bumps,” ICAS 2002 CONGRESS , 2002.
3Bein, T., Hanselka, H., and Breitbach, E., “An adaptive spoiler to control the transonic shock,” Smart Materials andStructures, Vol. 9, No. 2, April 2000, pp. 141–148.
4Dargel, G., “Assessment of the Capability of Drag Reduction of the Shock Control Device Shock Bump on Airfoil Flowsand Application Aspects on Wings,” IUTAM Symposium on Mechanics of Passive and Active Flow Control , 1999, pp. 57–62.
5Bohning, R. and Stern, D., “Shock/Boundary Layer Control by Various Concepts,” IUTAM Symposium on Mechanicsof Passive and Active Flow Control , 1999, pp. 23–28.
6Bruce, P. J. K. and Babinsky, H., “An experimental study into the flow physics of three-dimensional shock controlbumps,” Journal of Aircraft , Vol. 49, No. 5, 2012, pp. 1222–1233.
7Colliss, S. P., Babinsky, H., Nubler, K., and Lutz, T., “Vortical structures on three-dimensional shock control bumps,”51st AIAA Aerospace Sciences Meeting including the New Horizons Forum and Aerospace Exposition, No. January, AIAA,Grapevine (Dallas/Ft. Worth Region), Texas, 2013, pp. 1–15.
8Klemens, N., Lutz, T., Kramer, E., Colliss, S. P., and Babinsky, H., “Shock Control Bump Robustness Enhancement,”50th AIAA Aerospace Sciences Meeting including the New Horizons Forum and Aerospace Exposition 09 - 12 January 2012,Nashville, Tennessee, No. January, 2012.
9Ogawa, H., Experimental and Analytical Investigation of Transonic Shock-wave / Boundary-layer Interaction Controlwith Three-dimensional Bumps, Ph.D. thesis, Clare Hall College, Cambridge University, 2006.
10Rosemann, E. S. and H., “Active Flow Control Applied to Military and Civil Aircraft,” RTO AVT Symposium on ActiveControl Technology for Enhanced Performance Operational Capabilities of Military Aircraft, Land Vehicles and Sea Vehicles,held in Braunschweig, Germany, 8-11 May 2000 , No. May, 2000, pp. 8–11.
11Rhodes, O. and Santer, M., “Aeroelastic Optimization of a Morphing 2D Shock Control Bump,” 53rdAIAA/ASME/ASCE/AHS/ASC Structures, Structural Dynamics and Materials Conference 20th AI 23 - 26 April 2012,Honolulu, Hawaii AIAA 2012-1440 , 2012, pp. 1–17.
12“Abaqus CAE v6.10 DassaultSystemes,” 2007.13“OpenFoam ltd.” 2013.14“MATLAB and Statistics Toolbox Release 2012b Mathworks inc.” .15Eastwood, J. P. and Jarrett, J. P., “Toward Designing with Three-Dimensional Bumps for Lift/Drag Improvement and
Buffet Alleviation,” AIAA Journal , Vol. 50, No. 12, Dec. 2012, pp. 2882–2898.16Stanewsky, E., Delery, J., Fulker, J. L., and de Matteis, P., Drag Reduciton by Shock and Boundary Layer Control:
Results of the Project EUROSHOCK II , Springer, 2002.17Sommerer, A., Lutz, T., and Wagner, S., “Numerical Optimization of Adaptive Transonic Airfoils with Variable Camber,”
Proceedings 22nd ICAS Congress, Harrogate, UK , 2000.18Sommerer, A., Th., L., and Wagner, S., “Design of Adaptive transonic Airfoils by Means of Numerical Optimization,”
Proceedings ECCOMAS 2000: European Congress on Computational Methods in Applied Sciences and Engineering, 2000, p.379.
19Thompson, J. F., Warsi, Z. U. A., and Wayne Mastin, C., Numerical Grid Generation - Foundations and Applications,North-Holland, 1985.
20Cook, P., McDonald, M., and Firmin, M., “Aerofoil RAE 2822 - Pressure Distributions, and Boundary Layer and WakeMeasurements,” Experimental Data Base for Computer Program Assessment, AGARD Report AR 138., 1979.
21Wong, W., Qin, N., Sellars, N., Holden, H., and Babinsky, H., “A combined experimental and numerical study offlow structures over three-dimensional shock control bumps,” Aerospace Science and Technology, Vol. 12, No. 6, Sept. 2008,pp. 436–447.
22Qin, N., Wong, W. S., and Le Moigne, A., “Three-dimensional contour bumps for transonic wing drag reduction,”Proceedings of the Institution of Mechanical Engineers, Part G: Journal of Aerospace Engineering, Vol. 222, No. 5, Aug. 2008,pp. 619–629.
23Colliss, S. P. and Babinsky, H., “An experimental investigation of t hree-dimensional shock control bumps applied totransonic airfoils,” 50th AIAA Aerospace Sciences Meeting including the New Horizons Forum and Aerospace Exposition 09 -12 January 2012, Nashville, Tennessee, No. January, 2012, pp. 1–15.
24Birkemeyer, J., Rosemann, H., and Stanewsky, E., “Shock control on a swept wing,” Aerospace Science and Technology,Vol. 4, No. 3, April 2000, pp. 147–156.
25Patzold, M., Kramer, E., Lutz, T., and Wagner, S., “Numerical Optimization of finite Shock Control Bumps,” 44thAerospace Sciences Meeting and Exhibit, 9 12 January 2006, Reno, Nevada, No. January, 2006.
26Lee, D., Bugeda, G., Periaux, J., and Onate, E., “Robust active shock control bump design optimisation using hybridparallel MOGA,” Computers & Fluids, March 2012.
15 of 15
American Institute of Aeronautics and Astronautics
27Donovan, J. F., Spina, E. F., and Smits, A. J., “The structure of a supersonic turbulent boundary layer subjected toconcave surface curvature,” Journal of Fluid Mechanics, Vol. 259, 1994, pp. 1–24.
16 of 15
American Institute of Aeronautics and Astronautics