adaptive-optic system requirements to mitigate aero
TRANSCRIPT

Adaptive-optic system requirements tomitigate aero-optical aberrations as afunction of viewing angle
Shaddy AbadoStanislav GordeyevEric Jumper
Adaptive-optic system requirements to mitigateaero-optical aberrations as a function of viewing angle
Shaddy Abado,*,† Stanislav Gordeyev, and Eric JumperaUniversity of Notre Dame, Institute for Flow Physics and Control, Department of Aerospace and Mechanical Engineering, Notre Dame,Indiana 46556, United States
Abstract. A comparison between the spatial and temporal requirements for designing adaptive-optic correctionsystems for aero-optical turbulence over the pupil of a turret on the side of an airborne platform is presented.These systems are necessary to mitigate the deleterious aero-optic effects on an optical beam and to reopenthe field of regard. The derived technique makes use of the two-dimensional proper orthogonal decomposition tocharacterize the spatial and temporal frequencies of in-flight measured data from the Airborne Aero-OpticsLaboratory. For this study, 13 different viewing angles, which represent various flow topologies around theairborne turret, were chosen. The paper concludes with a discussion that points out the usefulness of the derivedtechnique in characterizing the aero-optical disturbances of various aero-optical environments at differentviewing angles and different turret configurations. © 2014 Society of Photo-Optical Instrumentation Engineers (SPIE) [DOI: 10.1117/1.OE.53.10.103103]
Keywords: aero-optics; adaptive-optics; proper orthogonal decomposition; airborne aero-optics laboratory; wavefront sensor; deform-able mirror; hemisphere-on-cylinder turret; flat windowed turret.
Paper 140941 received Jun. 11, 2014; revised manuscript received Aug. 26, 2014; accepted for publication Sep. 4, 2014; publishedonline Oct. 7, 2014.
1 IntroductionAero-optics1,2 refers to the aberrations imposed on an other-wise-planar wavefront of a laser propagated through near-field turbulence in flows over and around a turret on anairborne laser platform. The magnitude of these aberrationscan be quite large depending on the flight altitude and Machnumber as well as the pointing direction, which is commonlydescribed with the azimuthal (AZ) and elevation (EL) anglesof the outgoing beam, referenced to the angle of the flightrelative wind (i.e., Az 0.0 deg, El 0.0 deg being directlyinto the flight direction).3 The magnitude of these aberrationscan be sufficiently large to greatly reduce the system’s usefulfield of regard. Adaptive-optics,4 which attempts to placea conjugate wavefront on the beam before it propagatesthrough the turbulence, could theoretically reopen the fieldof regard; however, both the spatial and temporal frequenciescontained in the aberrations make conventional adaptive-optic approaches minimally effective and often cause worseaberrations than are present with no “correction.”5
Until recently, the only available experimental wavefrontmeasurements of aero-optical disturbances around airborneturrets have come from wind-tunnel experiments6 andnumerical simulations,7 and no flight-tests were available toverify if the aero-optical disturbances are also present to thesame degree in flight conditions. To address this need, anAirborne Aero-Optical Laboratory (AAOL) was designed,and a series of experiments were carried out.8
As shown in Ref. 9, the flow topology characteristicsaround the airborne turret and consequently the adaptive-opticssystem requirement are wavefront-dependent. Therefore, to
fully characterize the adaptive-optics system’s requirementfor an airborne turret, an analysis of the system’s require-ments for different viewing angles is necessary.
An initial analysis of the AAOL dataset was presented inour previous paper,10 where a four beam Malley probe tech-nique was derived and applied to two wavefront datasets todetermine the two-dimensional (2-D) velocity distributionsacross the beam’s aperture. The research described in thispaper expands this initial research by exploring new analysistechniques for analyzing and manipulating the in-flightmeasured wavefronts. This technique begins with applyingthe 2-D proper orthogonal decomposition (POD)11 to thein-flight measured datasets to characterize the nature of theaberration field around the airborne turret due to flow struc-tures convecting over the aperture. The analysis techniquespresented in this paper for determining the basic character ofthe aberrations were also shown to be helpful in determiningthe spatial and temporal requirements of deformable mirrorsin an adaptive-optics correction system at various viewingangles. The datasets analyzed in this paper were acquiredto capture the aero-optical aberrations around a flat-win-dowed, hemisphere-on-cylinder turret. In the presence orabsence of flow control, this sort of information should behelpful in developing a set of simplified benchmarks andguidelines for determining the minimum requirements anadaptive-optics system needs to meet to effectively mitigatethe deleterious aero-optic effects on the beam.
The paper is structured as follows: A description of the in-flight measured dataset and the scaling laws is presented inSec. 2. An analysis of the nondimensional, time-averaged,root-mean-square optical path difference, OPDND
rms, as a func-tion of viewing angle is presented in Sec. 3. An analysis ofthe aperture-averaged subaperture power spectral density as
*Address all correspondence to: Shaddy Abado, E-mail: [email protected]
†This work was performed while the author was a graduate student at theDepartment of Aerospace and Mechanical Engineering, University of NotreDame. 0091-3286/2014/$25.00 © 2014 SPIE
Optical Engineering 103103-1 October 2014 • Vol. 53(10)
Optical Engineering 53(10), 103103 (October 2014)
a function of viewing angle is presented in Sec. 4. A sum-mary of the POD application to the AAOL is presented inSec. 5. In Sec. 6, the POD’s energies as a function of theviewing angle are presented. A brief description of the pro-posed methodology to determine the spatial and temporalfrequencies for aero-optics correction based on the PODanalysis is presented in Sec. 7. The spatial and temporalrequirements of the adaptive-optics system as a function ofviewing angle are presented in Sec. 8. Finally, the paperconcludes with a brief discussion of the results.
2 Viewing Angle, Modified Elevation Angle, andApplication Flight Scenario
As mentioned in Sec. 1, the direction of the outgoing laserbeam emerging from the optical-window relative to theincoming freestream flow is typically described using theAZ, αAz, and EL, αEl, angles coordinate system. However,from a flow-physics point of view, it is more convenientto introduce a viewing angle, αVi, and a modified EL angle,αmEl, coordinate system to describe the beam direction. Theviewing angle is defined as the angle between the flow direc-tion and beam direction vectors, whereas the modified ELangle is defined as the angle between the junction plane join-ing the hemisphere to the cylinder and the plane formed bythe flow direction and the beam direction vectors.3 These twoangles are calculated from the AZ and the EL angles throughthe following two equations
cosðαViÞ ¼ cosðαElÞ · cosðαAzÞ; (1)
tanðαmElÞ ¼tanðαElÞsinðαAzÞ
: (2)
If the AZ angle is 0 deg, then the viewing angle coincideswith the EL angle (αVi ¼ αEl), and if the AZ angle is180 deg, then αVi ¼ 180 deg−αEl.
It is common to present wavefront results in nondimen-sional quantities for scaling to any relevant flight conditionsand turret configurations different in dimensions than thoseexperienced during the in-flight data collection. As such, the
optical path difference (OPD),4 spatial frequency, and tem-poral frequency presented in this paper were first nondimen-sionalized similar to the scaling laws proposed in Refs. 9 and12. For the purpose of this study, we chose to re-scale theAAOL experimental data to an application flight at 25 kft,Mach of 0.5, turret diameter of Dt ¼ 1 m, aperture diameterof DAp ¼ Dt∕3 ¼ 1∕3 m, and 1-μm wavelength laser. Thewavefront data was collected with a high-speed Shack–Hartmann4 wavefront sensor framing at 20 kHz.
3 Nondimensional, Time-Averaged, Root-Mean-Square OPD as a Function of Viewing Angle
The nondimensional, time-averaged, root-mean-square OPD,OPDND
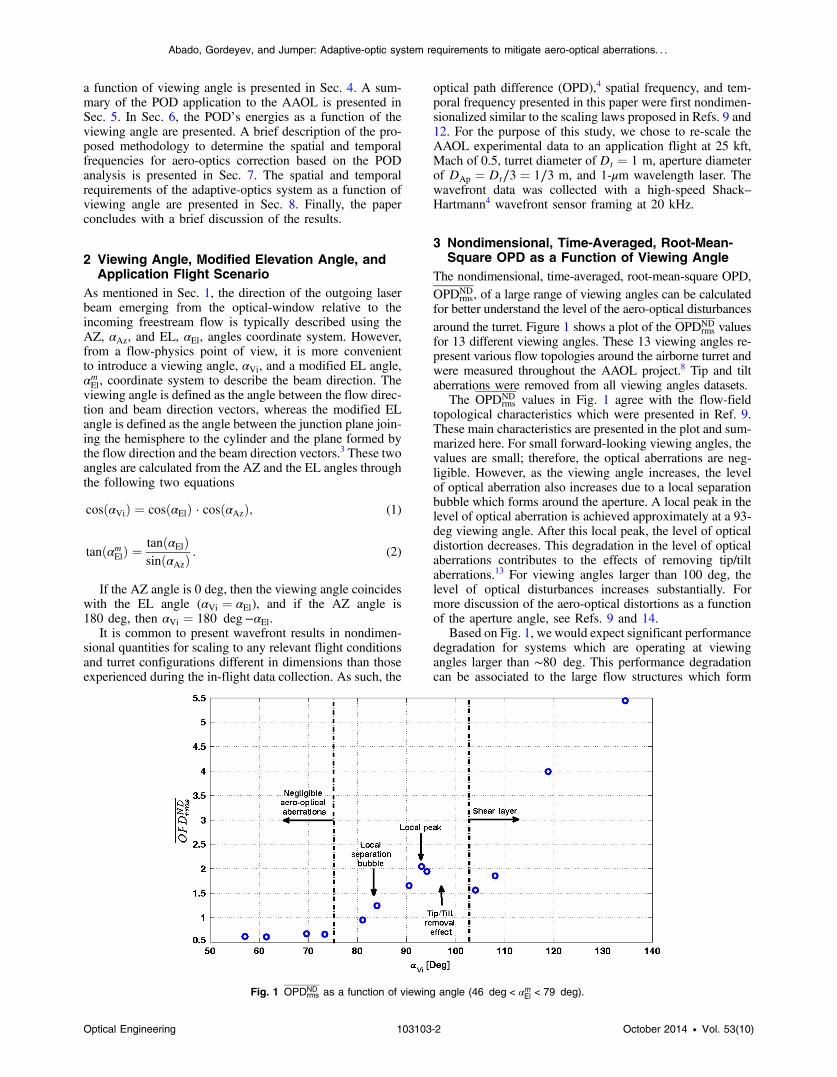
rms, of a large range of viewing angles can be calculatedfor better understand the level of the aero-optical disturbancesaround the turret. Figure 1 shows a plot of the OPDND
rms valuesfor 13 different viewing angles. These 13 viewing angles re-present various flow topologies around the airborne turret andwere measured throughout the AAOL project.8 Tip and tiltaberrations were removed from all viewing angles datasets.
The OPDNDrms values in Fig. 1 agree with the flow-field
topological characteristics which were presented in Ref. 9.These main characteristics are presented in the plot and sum-marized here. For small forward-looking viewing angles, thevalues are small; therefore, the optical aberrations are neg-ligible. However, as the viewing angle increases, the levelof optical aberration also increases due to a local separationbubble which forms around the aperture. A local peak in thelevel of optical aberration is achieved approximately at a 93-deg viewing angle. After this local peak, the level of opticaldistortion decreases. This degradation in the level of opticalaberrations contributes to the effects of removing tip/tiltaberrations.13 For viewing angles larger than 100 deg, thelevel of optical disturbances increases substantially. Formore discussion of the aero-optical distortions as a functionof the aperture angle, see Refs. 9 and 14.
Based on Fig. 1, we would expect significant performancedegradation for systems which are operating at viewingangles larger than ∼80 deg. This performance degradationcan be associated to the large flow structures which form
Fig. 1 OPDNDrms as a function of viewing angle (46 deg < αmEl < 79 deg).
Optical Engineering 103103-2 October 2014 • Vol. 53(10)
Abado, Gordeyev, and Jumper: Adaptive-optic system requirements to mitigate aero-optical aberrations. . .

at this viewing angle range. The main characteristics of theaero-optical disturbances discussed in this section will beused to explain the major results presented in this paper.
4 Power Spectral Density as a Function ofViewing Angle
The temporal spectral analysis can be used to characterizethe flow-field’s topology at various viewing angles. In thissection, the aperture-averaged subaperture power spectraldensity (PSD), as it was defined in Ref. 10, is calculatedfor various viewing angles to validate the flow-field’s topol-ogy characteristics which were presented in Sec. 3.
Figure 2 shows PSD plots of different viewing angles.The PSD curves were vertically shifted to reflect the viewingangle of each in-flight measured dataset. The spectrum curvecan be loosely interpreted in terms of the energy associatedwith eddies of various sizes.15 For small forward-lookingviewing angles, the spectra are quite uniform and are notdominated by specific features. This indicates that theaero-optical disturbances at these forward-looking viewingangles are not affected by higher-order aero-optical aberra-tions and are characterized by small size eddies. These smalleddies contribute to the large frequency components of thespectrum. As the viewing angle increases, a broadband humpappears in the spectra at an ∼104- deg viewing angle. Thistrend is expected if the aero-optical disturbance is producedby coherent structures, which are associated with the shearlayer due to a separated flow.16 These large coherent struc-tures contribute to the low frequency components of thespectrum. As the viewing angle increases, the broadbandhump’s magnitude increases and it can be seen shifting tolower frequencies in the spectra.
5 Application of POD to the AAOLThe POD is a linear procedure which decomposes a set ofdata signals (snapshots) which are varying in both spaceand time into the optimal linear basis (modes) possible.Hence, it can find a new set of dimensions that better capturethe variability of the data. The POD was developed byseveral people and can be traced back to Karhunen17 andLoève.18 A comprehensive discussion of the POD techniquecan be found in Ref. 11. In the context of turbulence,the POD was introduced by Lumley.19 The useful aspect
about using POD is that it separates the modal structuresby their contribution to the overall aero-optical “energy”or OPD2
rms, providing a quantitative measure of the aberra-tions due to that mode.12 The POD analysis splits the spa-tiotemporal field into a series of statistically-independent,stationary, spatial patterns (spatial modes), φnðx; yÞ, andcorresponding time-dependent coefficients (temporal coeffi-cients), anðtÞ. This split simplifies the interpretation of thedominant wavefront structures and their characteristics.Based on this, the temporal coefficients and the spatialmodes can be used to reconstruct the original in-flight mea-sured wavefronts-field, OPDOrg
n ðt; x; yÞ. The reconstructedwavefronts-field can be expressed as
OPDRe cn ðt; x; yÞ ¼
Xn
i¼1
aiðtÞ · φiðx; yÞ; (3)
where n is the number of modes used to reconstruct thewavefronts’ dataset.
The residual error of comparing the reconstructed wave-fronts’ dataset and the original in-flight measured wave-fronts’ dataset can be defined as
OPDErrorn ðt; x; yÞ ¼ OPDOrgðt; x; yÞ − OPDRe c
n ðt; x; yÞ: (4)
An initial application of the POD to the AAOL data waspresented in Ref. 10, where it was shown that the overallamplitude of the temporal coefficients, and hence theirrelative contribution to the total “energy,” decreases as themode number increases. There would be no reason to expecta priori that the temporal coefficients would have the samefrequency content as the original dataset. However, both thein-flight measured OPD’s dataset, OPDOrgðt; x; yÞ, and thetemporal coefficients are driven by the same mechanismwithin the flow, namely the largest, coherent structures.Therefore, the wavefronts’ time evolution characterizationcan be identified in the temporal frequency spectra of thePOD temporal coefficients.
Let ΨnðftÞ be the temporal PSD of POD temporal coef-ficient anðtÞ. Then, the PSDs of the sum of temporal coef-ficients starting from the first mode until mode n, ΨPn
i¼1aiðtÞ,
are shown in Fig. 3 for αVi ∼ 134 deg and n ¼ 1, 2, 3, 4, 10
Fig. 2 Aperture-averaged subaperture power spectral density as a function of viewing angle.
Optical Engineering 103103-3 October 2014 • Vol. 53(10)
Abado, Gordeyev, and Jumper: Adaptive-optic system requirements to mitigate aero-optical aberrations. . .

and 20. Each PSD is compared with the PSD of the sum of alltemporal coefficients, ΨPNtotal
i¼1aiðtÞ. As expected, it can be
clearly noticed that as more temporal coefficients areadded, the more ΨPn
i¼1aiðtÞ resembles ΨPNtotal
i¼1aiðtÞ. In addi-
tion, the low-order temporal coefficients reflect the lowtemporal frequency content of the wavefronts’ disturbances,whereas the high-order temporal coefficients reflect the hightemporal frequency content of the wavefronts’ disturbances.Furthermore, the sum of the first four temporal coefficients issufficient to resolve the broadband hump, which indicatesthe presence of large-scale coherent structures due to thepresence of a shear layer.10,16 This shear layer developsfrom the separation point on the turret and dominates theseparated flow at large aft-looking viewing angles, similar tothe angle presented here.
It was shown in Ref. 10 that the first four spatial modesreflect the presence of large-scale coherent structures.Similarly, we can conclude, based on Fig. 2, that it takesfour temporal coefficients to resolve the broadband humpin terms of energy. In addition, the convective nature ofthese four modes, which was presented in our previouspaper,10 is consistent with the local phase convective velocitymapping which also was presented in the same paper and wasperformed over the same broadband hump frequency range.
6 POD “Energy” as a Function of Viewing AngleThe POD can be used to separate the aero-optical disturbanceinto modal structures ordered according to their contributionto the overall aero-optical “energy” or OPD2
rms, providingthe quantitative measure of the aberrations due to thatmode.12 In this section, the POD technique is applied to vari-ous viewing angles to analyze and compare between theirmodal “energy” content.
The number of modes required to resolve 50% (∼3 dB),75% (∼12 dB), and 90% (∼0.45 dB) of the disturbance“energy” as a function of viewing angle is shown inFig. 4(b). Due to the slightly different test configurationof each viewing angle’s dataset, the number of subaperturesanalyzed varied between the tests; therefore, the total numberof POD modes at each dataset was also different. The per-centage of the number of modes required to resolve thesepercentages of “energy” is shown in Fig. 4(a).
As expected, the percentage of the number of modesrequired to resolve a certain percentage of “energy” increasesas the required percentage of “energy” increases; however;this increase is not linear. For example, the increase in theadditional percentage of modes which is necessary toincrease the required percentage of resolved “energy” from75% to 90% is larger than the increase in the additional per-centage of modes which is necessary to increase the requiredpercentage of resolved “energy” from 50% to 75%. Thisobservation indicates that for almost all viewing angles,the majority of the “energy” is in the content of the smallorder modes; therefore, a small increase in the number ofmodes significantly increases the resolved “energy.”
It can be also seen that the shapes of the curves in Fig. 4are correlated with the shape of the curve in Fig. 1. For exam-ple, for forward-looking viewing angles, the percentageof the number of modes increases as the viewing angleincreases. The percentage of the number of modes reachesa local maximum value at the same viewing angle rangewhere a local separation bubble starts forming at approxi-mately αVi ¼ 80 deg. This increase in the percentage ofnumber of modes for the forward-looking viewing anglescan be related to the fact that, for these viewing angles,the flow-field creates pseudosteady-lensing aberrations, suchas defocus and coma, which are left after removing themean aberrations. Also, as the viewing angle increases,
Fig. 3 Power spectral density of ΨPni¼1
ai ðtÞ αVi ∼ 134 deg and n ¼ 1, 2, 3, 4, 10, 20.
Optical Engineering 103103-4 October 2014 • Vol. 53(10)
Abado, Gordeyev, and Jumper: Adaptive-optic system requirements to mitigate aero-optical aberrations. . .

the complexity of these aberrations also increases;9 therefore,a large number of POD modes are required to resolve thesestructures.
As the local separation bubble increases beyondαVi ∼ 80 deg, the coherent structures over the beam’s aper-ture become larger and more dominant; therefore, less PODmodes are required to resolve these structures, and hencethe decrease in the curves’ values in Fig. 4.
The required percentage of the “energy” curve in Fig. 4reaches a minimum at approximately αVi ∼ 90 deg, which isthe same viewing angle where the OPDND
rms curve in Fig. 1reaches its local peak value. Afterward, the curves inFig. 4 exhibit an increase in the percentage of the numberof modes. This increase can be attributed to the effects ofremoving tip/tilt aberrations, where, because of the removalof large structures by Z-tilt correction, smaller coherentstructures are left to be resolved.13 Resolving these smallercoherent structures requires more POD modes, and hencethe increase in the curves’ values.
It was shown in Fig. 4 that for backward-looking viewingangles, the level of optical disturbance increases substan-tially. This increase is due to large, energetic, coherentstructures which dominate the flow-field. The POD analysisresolves the majority of these coherent structures in a fewPOD modes; therefore, fewer modes are required to resolvea given percentage of “energy,” and the curves’ values inFig. 4 decrease as the viewing angle increases.
Based on all of the conclusions presented above, onlya few modes relative to the total number of possible PODmodes are required to resolve and compensate for the major-ity of the spatial and temporal contents of the aero-opticaldisturbances. This observation is especially true for the back-ward-looking viewing angles, which impose the most con-straining aero-optical disturbances.
7 Approach to Spatial and Temporal Frequenciesfor Aero-Optics Correction Based on the POD
The results of Sec. 6 indicate that when correcting for aero-optical disturbances, the primary correction should accountfor the low-order modes as they contain the most dominant
and energetic spatial and temporal features of the flow-field.It can also be shown that the efficiency of the adaptive-opticscorrection depends upon various parameters,4 such as thetype of spatial correction applied, the resolution of the spatialcorrection, and the correction-update rate. The spatial andtemporal requirements to mitigate aero-optical aberrationsusing adaptive-optics system, and the influence of the sys-tems’ parameters on its performance, will be analyzed anddiscussed further in this section.
7.1 Spatial Requirements
The spatial resolution of the adaptive-optics correction is lim-ited by the deformable mirror, which is used to imprint theconjugate wavefront phase onto the optical beam. In our pre-vious paper,10 it was shown that it is possible to characterizethe spatial extent of the coherent structures and to obtain thespecific spatial requirements in the flow and cross-flow direc-tions by calculating the correlation length of each spatial PODmode. For the purpose of our analysis, the correlation lengthwas defined as the location of the auto-correlation function’sfirst minimum.20,21 Denoting the correlation length of the spa-tial POD mode n as C:L:n, then its spatial frequency, fns , canbe defined as
fns ¼ 1∕C:L:n; (5)
and the number of periods of aberrations per aperture,1∕Aperture, can be defined as
1∕Aperture ¼ DAp · fns : (6)
Once the coherent structures have been identified basedon the POD technique and characterized by their correlationlengths, it is possible to determine the spatial requirements ofan adaptive-optics system for aero-optical disturbances. Toanalyze the spatial requirements of the system, it is necessaryto define the number of required actuators per apertureparameter, Actuators∕Aperture, as
Fig. 4 Number of proper orthogonal decomposition modes required to resolve 50%, 75%, and 90% of the“energy:” (a) percentage of number of modes versus viewing angle; (b) number of modes versus viewingangle.
Optical Engineering 103103-5 October 2014 • Vol. 53(10)
Abado, Gordeyev, and Jumper: Adaptive-optic system requirements to mitigate aero-optical aberrations. . .

NnRe q ¼ 2 · DAp · fns : (7)
This parameter is the minimum number of deformablemirror actuators per turret’s aperture which are required tocompensate for the coherent structure of the POD moden. Based on Eq. (7), the number of required actuators peraperture can be calculated to determine the spatial require-ments as a function of a mode number.
It was shown in Sec. 5 that it is possible to calculatethe time-averaged, root-mean-squares, residual error of thereconstructed wavefronts’ dataset, OPDError
rms , as a functionof mode number n, where the reconstruction residual wasdefined in Eq. (4). Based on this, it is possible to relatethe number of actuators per aperture of the deformablemirror to a correction residual error value, where eachmode number is replaced with its associate OPDError
rms value.Knowing the time-averaged, root-mean-squares, residualerrors, it is possible to calculate the Strehl ratio22 basedon the large aperture approximation.4,22,23
7.2 Temporal Requirements
After analyzing the spatial requirements that the aero-opticaldisturbances impose on an adaptive-optics corrective system,the temporal requirements need to be analyzed. The spatialanalysis, which was discussed above, assumed no timelatency in applying the aero-optical correction. In this sec-tion, a perfect spatial adaptive-optic correction is assumedto investigate the effects of time latency, temporal samplingfrequency, and loop gain on the corrective adaptive-opticssystem’s performance.
As was discussed in Sec. 5, the temporal coefficients ofthe POD analysis contain the temporal characteristics of theaero-optical disturbances. Based on these temporal coeffi-cients, it is possible to simulate the response of a close-loop, conventional adaptive-optics system to disturbancesby applying a filter in the frequency domain. The response
of the close-loop control system to disturbances in the fre-quency domain can be considered to be a function of FS, thediscrete-time sampling frequency, β, the loop gain, and Δt,the net latency of the control system. If each temporal coef-ficient contains different spectral features, then applying thefilter to each temporal coefficient will reject different spectralcontent from each mode. A summary of this correction pro-cedure is available in Ref. 12.
It is possible to perform various simulations to demon-strate the effects of varying the three closed-loop system’sparameters (FS, β, and Δt) on the adaptive-optics systemperformance. Figure 5 presents a simulation to assess therelationship between the Strehl ratio and the loop gain forfour values of 0.25, 0.5, 0.75, and 1 frame latencies. Foreach value of frame latency, four temporal sampling frequen-cies were tested. Here, an application flight scenario at αVi ∼134 deg is assumed. It can be concluded from Fig. 5 that fora constant time latency value, the system’s performanceimproves as the temporal sampling frequency increases. Itcan also be concluded that for a constant temporal samplingfrequency value, the system’s performance improves as thetime latency decreases.
8 Spatial and Temporal Requirements asa Function of Viewing Angle
After analyzing the datasets of the various viewing anglesusing the PSD and POD analyses and linking the PODparameters (temporal coefficients and spatial modes) tothe adaptive-optics system required specifications, thePOD technique will be used to determine the spatial and tem-poral requirements of the adaptive-optics system as a func-tion of the viewing angle. For the analysis in this section, weattempt to investigate the system’s requirements at the mostdemanding viewing angles; therefore, viewing anglessmaller than 81 deg will not be considered in the analysis.
Fig. 5 Strehl ratio versus loop gain for 0.25, 0.5, 0.75, and 1 frames of latency for an application flightscenario at αVi ∼ 134 deg.
Optical Engineering 103103-6 October 2014 • Vol. 53(10)
Abado, Gordeyev, and Jumper: Adaptive-optic system requirements to mitigate aero-optical aberrations. . .

8.1 Spatial Requirements
The number of actuators per aperture required to achieveStrehl ratio22 values of 0.7 (∼1.5 dB), 0.8 (∼0.96 dB),and 0.9 (∼0.45 dB) as a function of the viewing angle areshown in Fig. 6 for the streamwise and spanwise directionsin the turret frame of reference. This number of actuators peraperture was calculated based on the approach derived inSec. 7. The values in the plots are scaled to an applicationflight scenario as it was defined in Sec. 2. As expected,for a constant viewing angle, the number of required actua-tors per aperture increases as the Strehl ratio increases.This observation is true for both flow directions. In addition,for a constant Strehl ratio and a constant viewing angle,the number of required actuators per aperture is larger forthe streamwise direction than for the spanwise direction.These two observations are consistent with the resultsreported in Ref. 10.
The shape of the curves in Fig. 6 can be related to theshape of the curve in Fig. 1. Based on Fig. 1, it was con-cluded that the level of aero-optical disturbances increasesas the local separation bubble develops. In Fig. 6, thisincrease in the level of aero-optical disturbances correspondsto an increase in the number of required actuators peraperture due to the higher spatial resolution required toresolve the aero-optical disturbances; however, at a certainviewing angle, the spatial system requirements decrease.This decrease is due to the removal of tip/tilt aberrationswhich compensate for the dominant aero-optical disturb-ances; therefore, we are left to correct for less demandingaero-optical disturbances. For backward-looking viewingangles, the sharp increase in the level of aero-optical disturb-ances due to the shear layer corresponds to an increase in thenumber of required actuators per aperture. It is interesting tonote here that the number of required actuators per aperturefor the backward-looking viewing angles is not much largerthan the number of required actuators per aperture for theseparation bubble viewing angle range. This observationindicates that while the sources of aero-optical disturbancesare different, the spatial requirements of both flow regimesare very similar.
Plots of the Strehl ratio as a function of the viewing anglefor 10, 15, and 20 actuators per aperture are shown in Fig. 7for the streamwise and spanwise directions. The values inthe plots are scaled to an application flight scenario. It isinteresting to note that for almost all viewing angles, andespecially for the backward-looking viewing angles, increas-ing the number of actuators per aperture from 10 to 15improves the Strehl ratio value more significantly thanincreasing the number of actuators per aperture from 15to 20. This observation indicates that once the dominant,low spatial frequency, coherent structures are corrected thenthe uncorrected, high spatial frequency, coherent structuresimpose less demanding aero-optical disturbances. In addi-tion, it can be noticed that for backward-looking viewingangles, a deformable mirror with at least 20 actuators peraperture is required to achieve a decent correction.
8.2 Temporal Requirements
It was concluded in Ref. 5 that the dominant system require-ments are set by the temporal frequencies of the aero-opticaldisturbance. In this section, we attempt to re-verify this con-clusion and compare the system’s temporal requirements fordifferent viewing angles.
For this subsection, we chose to analyze an adaptive-optics system with zero time latency and 0.5 loop gain. Plotsof the Strehl ratio as a function of temporal sampling fre-quency for different viewing angles are shown in Fig. 8.Based on this figure, it can be concluded that for a constanttemporal sampling frequency, the Strehl ratio decreases asthe viewing angle increases, excluding the viewing angles’range of 90 to 94 deg, where a local peak in the level ofoptical aberration is achieved due to the effects of removingtip/tilt aberrations.13 Similar to the spatial analysis figures,the order of the curves in Fig. 8 can be related to the levelof the aero-optical disturbances’ curve in Fig. 1. For exam-ple, we can notice that for forward-looking viewing angles(the upper four curves), a Strehl ratio larger than 0.8can be achieved with relatively low temporal samplingfrequencies. These temporal requirements are related tothe low level of aero-optical disturbances at forward-lookingviewing angles, where the flow-field is dominated by a thin
Fig. 6 Number of required actuators per aperture as a function of viewing angle for Strehl ratios of 0.7,0.8, and 0.9 (application flight scenario).
Optical Engineering 103103-7 October 2014 • Vol. 53(10)
Abado, Gordeyev, and Jumper: Adaptive-optic system requirements to mitigate aero-optical aberrations. . .

attached boundary layer due to the favorable pressuregradient.
As the viewing angle increases, the Strehl ratio for a con-stant temporal sampling frequency decreases, reaching aminimum at a ∼94- deg viewing angle. This decrease inthe system’s performance is related to the increase in thelevel of aero-optical disturbances due to the local separationbubble. Based on Fig. 2, we concluded that the developmentof the local separation bubble across the beam’s aperture isassociated with an increase in the temporal frequency con-tent. This conclusion explains the significant increase in thesystem’s temporal requirement at this viewing angle’s range.As the viewing angle increases past this range, the system’sperformance exhibits an improvement for a small range of
viewing angles due to the tip/tilt correction. However, forbackward-looking viewing angles larger than αVi ∼ 110 deg,the system’s performance decreases significantly (the lowertwo curves). Therefore, this viewing angle’s range imposesthe most demanding system requirements.
To better evaluate the temporal performance of an adap-tive-optics system as a function of the viewing angle, it ispossible to perform an analysis based on Fig. 8 where thetemporal sampling frequency is set to a constant valueand the Strehl ratio at this temporal sampling frequencyvalue is determined for each viewing angle. Figure 9 presentsthe Strehl ratio as a function of the viewing angle for 10, 50,and 100-kHz temporal sampling frequencies. We can noticethat each of the curves in the figure is almost identical to theconjugate image of the level of aero-optical disturbances
Fig. 8 Strehl ratio as a function of temporal sampling frequency fordifferent viewing angles (application flight scenario).
Fig. 9 Strehl ratio as a function of viewing angle for temporal sam-pling frequencies of: 10, 50, and 100 kHz (application flight scenario).
Fig. 7 Strehl ratio as a function of viewing angle for number of required actuators per aperture of 10, 15,and 20 (application flight scenario).
Optical Engineering 103103-8 October 2014 • Vol. 53(10)
Abado, Gordeyev, and Jumper: Adaptive-optic system requirements to mitigate aero-optical aberrations. . .
curve in Fig. 1. As expected from Fig. 8, for forward-lookingviewing angles, the increase in sampling frequency hasa negligible effect on the system’s performance. However,as the viewing angle increases, the increase in the temporalsampling frequency notably improves the system’s perfor-mance. This observation especially holds for backward-look-ing viewing angles.
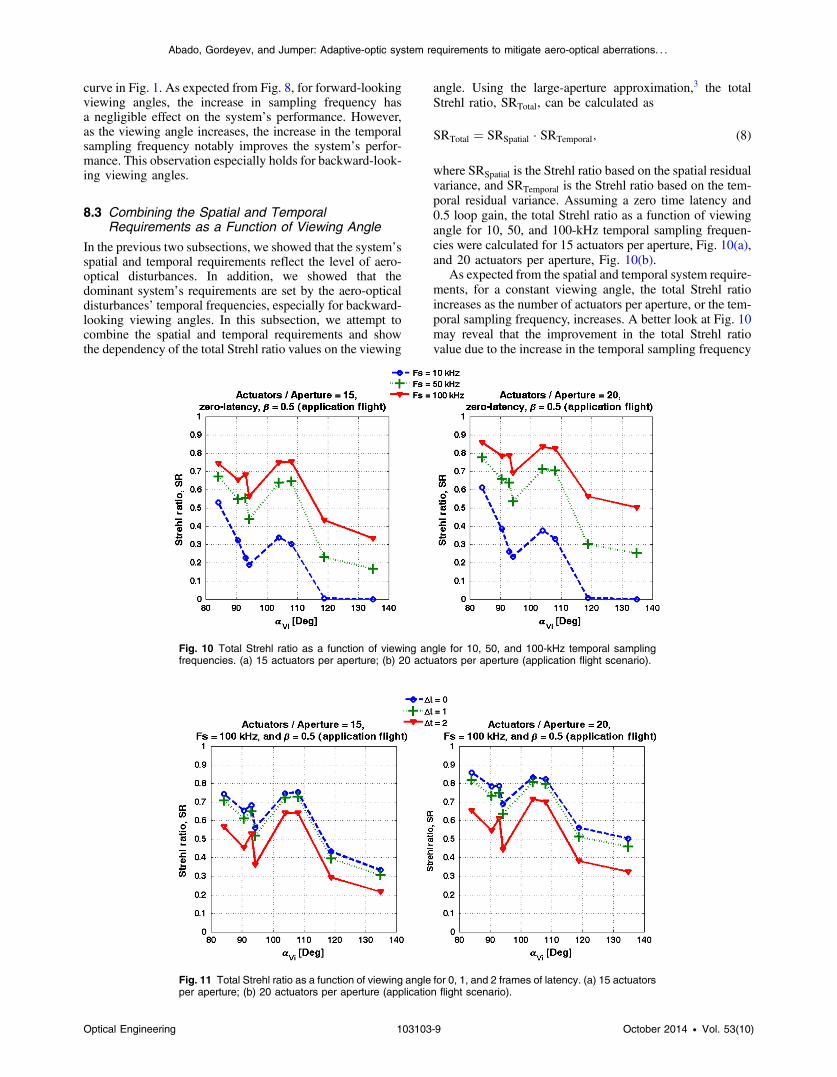
8.3 Combining the Spatial and TemporalRequirements as a Function of Viewing Angle
In the previous two subsections, we showed that the system’sspatial and temporal requirements reflect the level of aero-optical disturbances. In addition, we showed that thedominant system’s requirements are set by the aero-opticaldisturbances’ temporal frequencies, especially for backward-looking viewing angles. In this subsection, we attempt tocombine the spatial and temporal requirements and showthe dependency of the total Strehl ratio values on the viewing
angle. Using the large-aperture approximation,3 the totalStrehl ratio, SRTotal, can be calculated as
SRTotal ¼ SRSpatial · SRTemporal; (8)
where SRSpatial is the Strehl ratio based on the spatial residualvariance, and SRTemporal is the Strehl ratio based on the tem-poral residual variance. Assuming a zero time latency and0.5 loop gain, the total Strehl ratio as a function of viewingangle for 10, 50, and 100-kHz temporal sampling frequen-cies were calculated for 15 actuators per aperture, Fig. 10(a),and 20 actuators per aperture, Fig. 10(b).
As expected from the spatial and temporal system require-ments, for a constant viewing angle, the total Strehl ratioincreases as the number of actuators per aperture, or the tem-poral sampling frequency, increases. A better look at Fig. 10may reveal that the improvement in the total Strehl ratiovalue due to the increase in the temporal sampling frequency
Fig. 10 Total Strehl ratio as a function of viewing angle for 10, 50, and 100-kHz temporal samplingfrequencies. (a) 15 actuators per aperture; (b) 20 actuators per aperture (application flight scenario).
Fig. 11 Total Strehl ratio as a function of viewing angle for 0, 1, and 2 frames of latency. (a) 15 actuatorsper aperture; (b) 20 actuators per aperture (application flight scenario).
Optical Engineering 103103-9 October 2014 • Vol. 53(10)
Abado, Gordeyev, and Jumper: Adaptive-optic system requirements to mitigate aero-optical aberrations. . .
is more significant for backward-looking viewing anglesthan it is for forward-looking viewing angles.
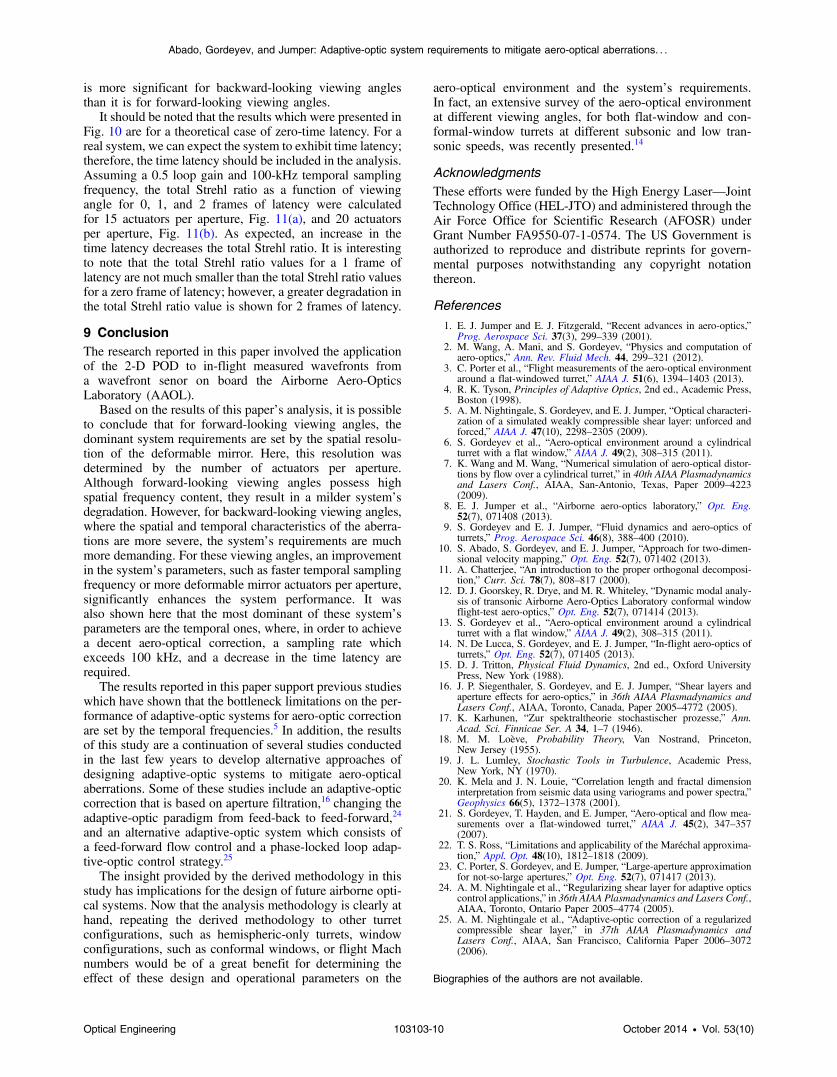
It should be noted that the results which were presented inFig. 10 are for a theoretical case of zero-time latency. For areal system, we can expect the system to exhibit time latency;therefore, the time latency should be included in the analysis.Assuming a 0.5 loop gain and 100-kHz temporal samplingfrequency, the total Strehl ratio as a function of viewingangle for 0, 1, and 2 frames of latency were calculatedfor 15 actuators per aperture, Fig. 11(a), and 20 actuatorsper aperture, Fig. 11(b). As expected, an increase in thetime latency decreases the total Strehl ratio. It is interestingto note that the total Strehl ratio values for a 1 frame oflatency are not much smaller than the total Strehl ratio valuesfor a zero frame of latency; however, a greater degradation inthe total Strehl ratio value is shown for 2 frames of latency.
9 ConclusionThe research reported in this paper involved the applicationof the 2-D POD to in-flight measured wavefronts froma wavefront senor on board the Airborne Aero-OpticsLaboratory (AAOL).
Based on the results of this paper’s analysis, it is possibleto conclude that for forward-looking viewing angles, thedominant system requirements are set by the spatial resolu-tion of the deformable mirror. Here, this resolution wasdetermined by the number of actuators per aperture.Although forward-looking viewing angles possess highspatial frequency content, they result in a milder system’sdegradation. However, for backward-looking viewing angles,where the spatial and temporal characteristics of the aberra-tions are more severe, the system’s requirements are muchmore demanding. For these viewing angles, an improvementin the system’s parameters, such as faster temporal samplingfrequency or more deformable mirror actuators per aperture,significantly enhances the system performance. It wasalso shown here that the most dominant of these system’sparameters are the temporal ones, where, in order to achievea decent aero-optical correction, a sampling rate whichexceeds 100 kHz, and a decrease in the time latency arerequired.
The results reported in this paper support previous studieswhich have shown that the bottleneck limitations on the per-formance of adaptive-optic systems for aero-optic correctionare set by the temporal frequencies.5 In addition, the resultsof this study are a continuation of several studies conductedin the last few years to develop alternative approaches ofdesigning adaptive-optic systems to mitigate aero-opticalaberrations. Some of these studies include an adaptive-opticcorrection that is based on aperture filtration,16 changing theadaptive-optic paradigm from feed-back to feed-forward,24
and an alternative adaptive-optic system which consists ofa feed-forward flow control and a phase-locked loop adap-tive-optic control strategy.25
The insight provided by the derived methodology in thisstudy has implications for the design of future airborne opti-cal systems. Now that the analysis methodology is clearly athand, repeating the derived methodology to other turretconfigurations, such as hemispheric-only turrets, windowconfigurations, such as conformal windows, or flight Machnumbers would be of a great benefit for determining theeffect of these design and operational parameters on the
aero-optical environment and the system’s requirements.In fact, an extensive survey of the aero-optical environmentat different viewing angles, for both flat-window and con-formal-window turrets at different subsonic and low tran-sonic speeds, was recently presented.14
AcknowledgmentsThese efforts were funded by the High Energy Laser—JointTechnology Office (HEL-JTO) and administered through theAir Force Office for Scientific Research (AFOSR) underGrant Number FA9550-07-1-0574. The US Government isauthorized to reproduce and distribute reprints for govern-mental purposes notwithstanding any copyright notationthereon.
References
1. E. J. Jumper and E. J. Fitzgerald, “Recent advances in aero-optics,”Prog. Aerospace Sci. 37(3), 299–339 (2001).
2. M. Wang, A. Mani, and S. Gordeyev, “Physics and computation ofaero-optics,” Ann. Rev. Fluid Mech. 44, 299–321 (2012).
3. C. Porter et al., “Flight measurements of the aero-optical environmentaround a flat-windowed turret,” AIAA J. 51(6), 1394–1403 (2013).
4. R. K. Tyson, Principles of Adaptive Optics, 2nd ed., Academic Press,Boston (1998).
5. A. M. Nightingale, S. Gordeyev, and E. J. Jumper, “Optical characteri-zation of a simulated weakly compressible shear layer: unforced andforced,” AIAA J. 47(10), 2298–2305 (2009).
6. S. Gordeyev et al., “Aero-optical environment around a cylindricalturret with a flat window,” AIAA J. 49(2), 308–315 (2011).
7. K. Wang and M. Wang, “Numerical simulation of aero-optical distor-tions by flow over a cylindrical turret,” in 40th AIAA Plasmadynamicsand Lasers Conf., AIAA, San-Antonio, Texas, Paper 2009–4223(2009).
8. E. J. Jumper et al., “Airborne aero-optics laboratory,” Opt. Eng.52(7), 071408 (2013).
9. S. Gordeyev and E. J. Jumper, “Fluid dynamics and aero-optics ofturrets,” Prog. Aerospace Sci. 46(8), 388–400 (2010).
10. S. Abado, S. Gordeyev, and E. J. Jumper, “Approach for two-dimen-sional velocity mapping,” Opt. Eng. 52(7), 071402 (2013).
11. A. Chatterjee, “An introduction to the proper orthogonal decomposi-tion,” Curr. Sci. 78(7), 808–817 (2000).
12. D. J. Goorskey, R. Drye, and M. R. Whiteley, “Dynamic modal analy-sis of transonic Airborne Aero-Optics Laboratory conformal windowflight-test aero-optics,” Opt. Eng. 52(7), 071414 (2013).
13. S. Gordeyev et al., “Aero-optical environment around a cylindricalturret with a flat window,” AIAA J. 49(2), 308–315 (2011).
14. N. De Lucca, S. Gordeyev, and E. J. Jumper, “In-flight aero-optics ofturrets,” Opt. Eng. 52(7), 071405 (2013).
15. D. J. Tritton, Physical Fluid Dynamics, 2nd ed., Oxford UniversityPress, New York (1988).
16. J. P. Siegenthaler, S. Gordeyev, and E. J. Jumper, “Shear layers andaperture effects for aero-optics,” in 36th AIAA Plasmadynamics andLasers Conf., AIAA, Toronto, Canada, Paper 2005–4772 (2005).
17. K. Karhunen, “Zur spektraltheorie stochastischer prozesse,” Ann.Acad. Sci. Finnicae Ser. A 34, 1–7 (1946).
18. M. M. Loève, Probability Theory, Van Nostrand, Princeton,New Jersey (1955).
19. J. L. Lumley, Stochastic Tools in Turbulence, Academic Press,New York, NY (1970).
20. K. Mela and J. N. Louie, “Correlation length and fractal dimensioninterpretation from seismic data using variograms and power spectra,”Geophysics 66(5), 1372–1378 (2001).
21. S. Gordeyev, T. Hayden, and E. Jumper, “Aero-optical and flow mea-surements over a flat-windowed turret,” AIAA J. 45(2), 347–357(2007).
22. T. S. Ross, “Limitations and applicability of the Maréchal approxima-tion,” Appl. Opt. 48(10), 1812–1818 (2009).
23. C. Porter, S. Gordeyev, and E. Jumper, “Large-aperture approximationfor not-so-large apertures,” Opt. Eng. 52(7), 071417 (2013).
24. A. M. Nightingale et al., “Regularizing shear layer for adaptive opticscontrol applications,” in 36th AIAA Plasmadynamics and Lasers Conf.,AIAA, Toronto, Ontario Paper 2005–4774 (2005).
25. A. M. Nightingale et al., “Adaptive-optic correction of a regularizedcompressible shear layer,” in 37th AIAA Plasmadynamics andLasers Conf., AIAA, San Francisco, California Paper 2006–3072(2006).
Biographies of the authors are not available.
Optical Engineering 103103-10 October 2014 • Vol. 53(10)
Abado, Gordeyev, and Jumper: Adaptive-optic system requirements to mitigate aero-optical aberrations. . .