adaptive evolution drives the diversification of zinc-finger
TRANSCRIPT

1
Adaptive evolution drives the diversification
of zinc-finger binding domains.
Deena Schmidt and Rick Durrett*,
Center for Applied Mathematics and Department of Mathematics
Cornell University
Key words: tandem gene duplication, adaptive evolution, zinc-finger genes Running Head: Adaptive evolution of zinc-finger genes * Corresponding Author: 523 Malott Hall, Cornell U. Ithaca NY 14853
Phone: (607) 255-8282, FAX: 255-7149, email: [email protected]

2
ABSTRACT
The human genome is estimated to contain 700 zinc finger genes, which perform
many key functions including regulating transcription. The dramatic increase in the
number of these genes as we move from yeast to C. elegans to Drosophila and to humans,
as well as the clustered organization of these genes in humans suggests that gene
duplication has played an important role in expanding this family of genes. Using
likelihood methods developed by Yang and parsimony methods introduced by Suzuki
and Gojobori, we have investigated four clusters of zinc finger genes on human
chromosome 19 and found evidence that positive selection was involved in diversifying
the family of zinc finger binding motifs.

3
INTRODUCTION
In the human genome there are hundreds of zinc finger genes organized into more
than a dozen different families. (Gell, Crossley, and Mackay 2003). Here, we will
concentrate on the C2H2 type, a 28 amino acid motif that is named for the two Cysteines
and two Histidines that form a tetrahedral complex around a zinc ion to produce the
finger structure (Miller, McLachan, and Klug 1985). See Figure 1. Zinc fingers are
tandemly repeated at the end of zinc finger genes. The number of repeats ranges from two
up to three dozen or more. In rodents and in humans about one third of the zinc finger
genes carry the Krüppel-associated box (KRAB), a potent repressor of transcription
(Margolin et al. 1994), which is named for the Drosophila segmentation gene Krüppel
(Schuch, Aichler, and Gaul 1986, Bellefroid et al. 1991). There are more than 200 KRAB
containing zinc finger genes in the human genome, about 40% of which reside on
chromosome 19 and show a clustered organization suggesting an evolutionary history of
duplication events (Dehal et al. 2001).
The total number of zinc finger genes appears to have increased through
evolution. There are 564-706 in humans compared to 234-357 in D. melanogaster, 68-
151 in C. elegans, and 34-48 in S. cerevisiae. (Lander et al. 2001 and Venter et al. 2001).
The average number of fingers per gene has increased, being 8, 3.5, 2.5, and 1.5
respectively in the four species just mentioned (Looman 2003).
In addition to a general increase in the number of zinc finger genes, some regions
of the human genome contain many such genes with no homologs in rodents. Bellefroid
et al. (1995) studied the ZNF91 gene family on human chromosome 19p12-p13.1. They
found ZNF91 family members in a number of primate species but could find no murine

4
gene with sequence similarity to ZNF91. They concluded that this cluster resulted from
duplication events some 55 million years ago.
The structure and binding properties of zinc finger genes have been extensively
studied, see Wolfe, Nekludova, and Pabo (1999) for a review. A C2H2 zinc finger consists
of an α-helix that begins between the first two asterisks in Figure 1 and continues to the
first Histidine. The remainder of the finger consists of two anti-parallel β sheets. The
amino acids at positions -1, 3, and 6 with respect to the α-helix make contacts to bases 3,
2 and 1 in the primary DNA strand, whereas the amino acid at α-helix position 2 makes
contact to the complement of base 4. The recognition code for zinc finger binding has
been widely studied (Choo and Klug 1997). However recent research (Benos, Lapedes,
and Stromo 2002) suggests that no simple 1-1 relationship exists, but that different amino
acid sequences bind to target nucleotide sequences with different efficiencies.
The H/C link TGEKPY/F separating adjacent fingers (dark gray in Figure 1), the
two C and two H positions bound to the zinc atom to make the finger, as well as the
hydrophobic Phenyalanine (F) and Leucine (L) are highly conserved. However, the four
sites involved in binding the protein to DNA indicated by asterisks in Figure 1 are highly
variable.
These observations and the fact that even closely related genes display distinct
patterns of tissue-specific expression (Shannon et al. 2003) suggest that gene duplication
has aided in the diversification of zinc finger binding motifs. Shannon et al. (2003) used
pairwise /N Sd d comparisons to examine selective pressures in what we will call clusters
I and II below. The goal of this paper is to use the methods of Yang et al. (2000), Yang

5
and Swanson (2002), and Suzuki and Gojobori (1999) to look for signs of positive
selection in these clusters and others on human chromosome 19.
MATERIALS AND METHODS
Using the Human Genome Resources on the NCBI web site
http://www.ncbi.nlm.nih.gov/genome/guide/human/ we downloaded sequences for all
genes on chromosome 19 that were described as zinc finger genes. In regions where these
genes clustered we examined the Locus Link entries for nearby predicted genes and
included those annotated as having C2H2 zinc fingers or KRAB domains, resulting in a
total of 173 genes. To complete our data set, we found the annotated mouse (29) and rat
(20) orthologs of the human genes.
To examine the relationship between zinc finger genes, we aligned the KRAB
domains and spacer sequences of our genes using ClustalW. We did not use the zinc
fingers in the alignment because the number varied considerably between genes, and the
repetitive zinc finger structure resulted in the alignment of fingers with much
dissimilarity. Alignments were done using the European Bioinformatics Institute’s server
(http://www.ebi.ac.uk/clustalw/) with default parameters. As described in Thompson,
Higgins, and Gibson (1994), ClustalW (i) performs a pairwise alignment of all sequences,
(ii) computes a distance matrix based on the percentage of identities between the two
aligned sequences, (iii) produces a tree by the neighbor joining algorithm and then (iv)
uses the tree to guide the multiple alignment.

6
Using the clustering of genes on the tree and a comparison of their α-helix
sequences (see results for more details) we identified four sets of genes for study. For
each gene cluster we obtained the mRNA sequences from the NCBI web site and located
the fingers that were common to all of the genes to make our comparison data set. In each
case, alignment of the selected fingers using ClustalW resulted in an alignment with no
gaps in any sequence, and trees that agreed with those that had been constructed from the
alignment of KRAB domains and spacer sequences. To further confirm the phylogenies,
we built trees using parsimony and neighbor joining methods implemented in PHYLIP
using the web server at http://bioweb.pasteur.fr/seqanal/phylogeny/phylip-uk.html. In
clusters II-IV, the trees from all methods were identical. In cluster I, we found two tree
topologies that differed in the positions of ZNF 224 and 225 which are almost equidistant
from the pair ZNF 155 and 221, so we analyzed this cluster under both trees. Results of
subsequent tests were very similar for the two trees. To look for signs of positive
selection in our four clusters, we used the following three approaches.
Site-specific models. Nielsen and Yang (1998) and Yang et al. (2000) introduced
various models to study how the distribution of ω = dN/dS varies along sequences. Model
M7 has an ω for each site drawn from a beta distribution with parameters p and q. Model
M8 uses the M7 recipe for a fraction 0p of the sites and assigns another ω to the
remaining fraction. M7 and M8 are nested models so they can be compared using a
likelihood ratio test (LRT). Twice the difference in log likelihood between models is
compared with the value obtained under a χ2 distribution with degrees of freedom equal
to the difference in number of parameters between models (in this case 2). When M8 fits
the data significantly better than M7 and the ω ratio estimated under model M8 is greater

7
than 1, we need to ask if it is significantly greater than 1. To do this, we recalculate the
log likelihood value in M8 while fixing ω to be 1 (model M8A from Swanson et al.
2003), and compare the change in likelihood with a χ2 distribution with one degree of
freedom.
Fixed-sites models. The approach in the last paragraph does not take into account
the fact that zinc fingers are periodic, so we will also use a method developed by Yang
and Swanson (2002) that allows us to take advantage of a priori knowledge. We divide
the sites into 3 classes: constrained sites (finger positions 1, 2, 4, 7, 11, 17, 20, 24, 25, 26,
27, 28), the binding sites (13, 15, 16, 19), and the remaining “unconstrained” sites. We
have used quotation marks since it will turn out that these sites have ω’s significantly
smaller than 1.
Let κ be the transition/transversion ratio, iπ the frequency of amino acid i, and let
jr denote the ratio of substitution rates for the jth site class to that of the first, with 1 1r = .
Yang and Swanson (2002) introduced the following models. In model A, there is only
one rate class and all sites use the same κ, ω, and π’s. In model B, the r’s are different but
all sites use the same κ, ω, and π’s. In model C, the r’s and π’s are different, but all sites
use the same κ and ω. In model D, the r’s, κ’s, and ω’s are different, but all sites use the
same π’s. In model E, each class has a different set of parameters. In model F, the sites
are divided into three groups and analyzed separately. Tests were carried out using
version 3.14 of PAML, software introduced by Yang (1997).
Parsimony analysis. Finally, at the request of two referees, we used Suzuki and
Gojobori’s (1999) method as implemented in ADAPTSITE.p version 1.3
(http://mep.bio.psu.edu/adaptivevol.html) to look for positive selection in our four

8
clusters. The test is based on comparing the observed total number of synonymous (sc)
and nonsynonymous (nc) substitutions for a codon, to the Binomial with tc trials and
success probability p, where tc is the total number of changes and p is the fraction of
synonymous changes expected in the tree. There are several reasons not to use this test.
The first is that the distribution of sc conditioned on the observed values of tc and p is not
Binomial, see Durrett (2004). The second is that the test has very low power unless the
number of sequences compared is large, see Wong et al. (2004). Suzuki and Gojobori
(1999) say that a tree length of at least 2.5 nucleotide changes per codon site is needed to
detect positive selection. Adding the branch lengths of the maximum parsimony trees
shows that our clusters range from 0.45 to 0.6 changes per site. However, we can remedy
this problem by taking advantage of the periodic structure of zinc finger genes and
grouping codons together by position in the 9-10 fingers being compared. This is similar
to our second PAML analysis but now our groups are the 28 finger positions rather than
the 3 classes of sites. Due to our a priori beliefs, we performed one tailed tests of positive
selection at the four binding sites and of negative selection at the other sites.
RESULTS
Statistical analysis. Figure 2 displays a histogram of the number of zinc fingers,
defined as a sequence of 28 amino acids having C’s, H’s, F’s and L’s in the expected
location. The average number of fingers for genes in our data set is 10.92. The five genes
with the largest number are LOC126502(28), LOC25893(29), ZNF91(31),
LOC126494(34), and its mouse ortholog MMU380856(30). Here and in what follows we

9
will replace LOC in the name of mouse and rat genes by MMU and RNO to make it clear
what species they come from.
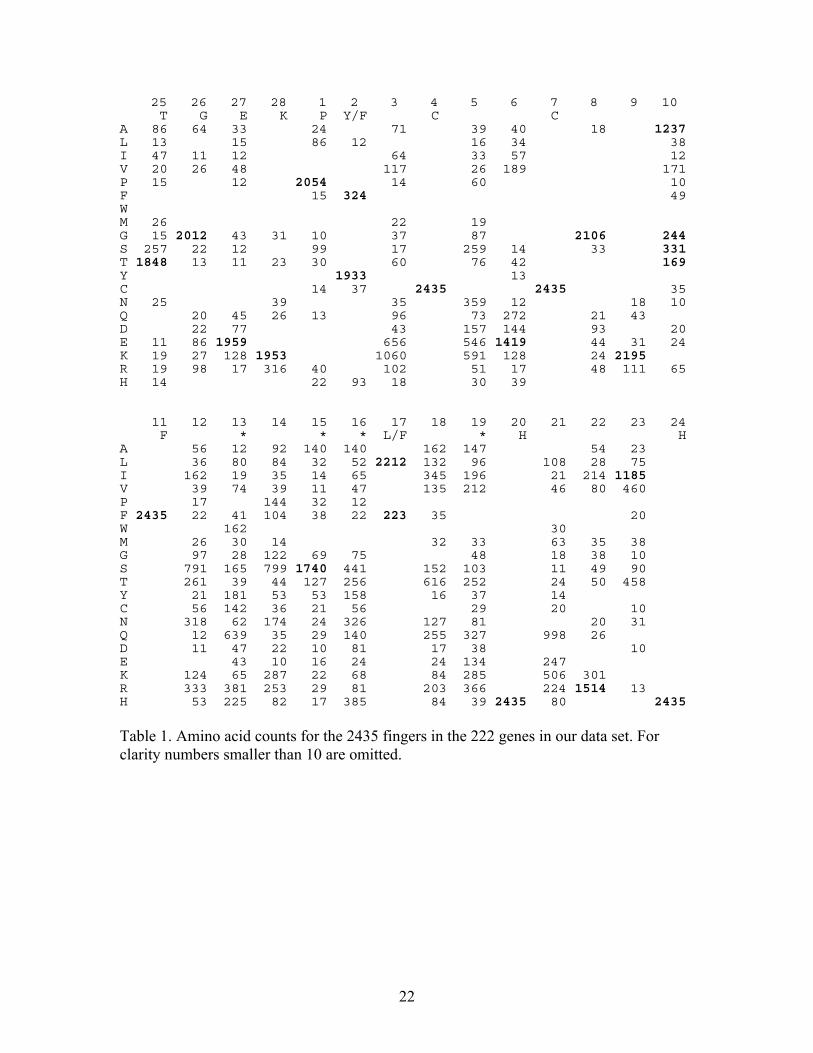
Table 1 gives amino acid usage by position in the finger. Numbers at the top of
each column refer to the positions and letters in the second row of each column give the
predicted residue for each location, with *’s indicating the four DNA binding sites. The
predicted residues in the H/C link all appear in at least 1848 of the 2435 cases. We also
note that the second binding site (position 15) is Serine in 1740 cases, but all the binding
sites are clearly variable.
Clustering of genes. Figure 3 illustrates the tree for genes on the p arm of
chromosome 19. The number after the human gene name locates the start of the gene in
megabases. It is visually obvious that the tree structure reflects the geographic structure
of genes on chromosome 19. For example, if we sever one arc of the tree then we
separate the 23 genes that reside at 2.79-12.40 megabases from the 18 genes at 20.07-
24.06 megabases. The probability we could get this result by cutting one of 40 arcs in the
tree is at most 1041,2340 / 1.98 10C −= × , where 41,23C is the number of ways of choosing 23
objects from a set of 41. There are 14 pairs of genes that are adjacent on the tree, i.e.,
both are connected to the same interior node. 11 of these 14 genes are adjacent on the
chromosome suggesting tandem duplication events. If we keep the tree fixed and
randomly reshuffle the labels then the probability we would see this pattern is at most
1114,11 (2 / 40) (2 / 38) (2 / 20) 5.43 10C −⋅ ⋅ ⋅ ⋅ ⋅ = × .
Figure 4 shows zinc finger genes on the q arm of chromosome 19 that reside in
the clusters at 49 and 58 megabases, which were earlier identified by Dehal et al. (2001).
The ten zinc finger genes at 49.14-49.36 megabases are adjacent on the chromosome and

10
can be separated from the rest of the tree by cutting one arc, an event of probability at
most 844,1043 / 1.73 10C −= × . Tang, Waterman, and Yooseph (2002) studied the pattern of
duplication in this cluster of human genes using specialized phylogenetic methods.
Shannon et al. (2003) investigated this group of genes and also those that appear in the
corresponding part of mouse chromosome 7, Zfp genes 61, 93, 108, 109, 111, and 235.
Figure 5 in Shannon et al. (2003) indicates the relationship between the last five
Zfp genes and the trio Zfp61, ZNF226 and ZNF234 by representing fingers as boxes with
various shading. That picture and the reasons for considering fingers to be similar
become clearer if we list the α-helix sequence for each finger, the seven amino acid
sequence containing the four binding sites as shown in Tables 2 and 3. A square bracket
indicates a finger that has lost one of its critically important C, H, F or L residues, and a
number indicates that insertions or deletions have changed the length from 28. As also
indicated in Figure 5 of Shannon et al. (2003), Table 2 reveals that the fingers in columns
5-9 and 18-19 of Zfp61, ZNF226 and ZNF234 are closely related, while the fingers in
columns 10-17 seem to have been added in the lineage leading to ZNF 226 and 234. To
have genes with comparable fingers we choose ZNF 230, 222, 223, 221, 155, 224, and
225 to be cluster I.
Table 3 lays out the α-helix sequences for six of the genes considered in the left
half of Figure 5 of Shannon et al. (2003), and two rat genes that Locus Link once
reported as being orthologs of Zfp93 and Zfp108, but which have recently been removed
as being “pseudogenes” (NCBI Help Desk email correspondence). Many of the
relationships depicted in Table 2 of Shannon et al. (2003) are visible in ours. However, it
is not clear why they concluded that the fingers in columns 17-19 of Zfp111 are

11
duplicates of those in columns 13-15, and are in turn homologous to columns 11-12 of
ZNF235 and Zfp235, 93, and 108. To have similar finger structures we choose ZNF235,
Zfp235, Zfp93, Zfp108, RNO308423, and RNO308422 to be cluster II.
We examined α-helix sequences for all of our zinc finger genes to identify other
groups. Here and in what follows the numbers in parentheses indicate the start of the gene
in megabases. As shown in Table 4, the α-helix sequences of ZNF440(11.78) and
ZNF439(11.83) show strong signs of tandem duplication, as do ZNF44(12.22),
LOC147837(12.28), ZNF442(12.36), LOC90576(12.36) and ZNF443(12.40). From the
five intervening genes we choose ZNF20(12.10) to complete cluster III. Notice that these
genes appear together in the tree in Figure 3. Our fourth and final cluster IV, consists of
ZNF90(20.07), LOC163233(20.51), ZNF85(20.89), ZNF430(20.99), LOC148206(21.04),
ZNF431(21.11), and LOC163227(21.69). These genes appear in two groups in the tree
(Figure 3) but their α-helix sequences given in Table 5 are very similar to the others in
the group.
In contrast to the four clusters considered above, one that occurs at the telomere
of chromosome 19, which we will call Cluster V, has been very stable. Table 6 lists the
NCBI annotated genes in this region and their orthologs in mouse and rat as given in
NCBI’s Locus Link. Apart from the somewhat unexpected location of Zfp35 on mouse
chromosome 18 and of the AIBG orthologs on mouse chromosome 15 and rat
chromosome 7, there has been little rearrangement. If one inverts the order of the last
eight genes on the rat chromosome, then the order and orientation of the genes agree with
the exception of the two FLJ’s on lines 6 and 7. Figure 5 illustrates the relationship
between genes in Table 6 as inferred by ClustalW. In contrast to the other clusters

12
considered earlier there is no evidence of duplication since the divergence of humans
from rodents.
Tests for positive selection. Using the codeml program in PAML, we first applied
the LRT M7 vs. M8 to our four zinc finger clusters. As Table 7 shows, we reject the null
hypothesis of no sites under positive selection in clusters I, III, and IV, with the Bayesian
posterior pointing to several sites potentially under positive selection. In the case of
cluster IV, the test statistic is 2∆l = 2(lM8 – lM7) = 47.910, which is compared to χ2 with df
= 2, so P < 0.0001. Parameter estimates in cluster IV suggest that 5% of sites are under
positive selection with ω = 6.58. There are seven sites for which their posterior
probability of ω >1 is greater than 0.95. Four of these appear at the first binding site
(finger position 13) and three at the third binding site (16). In each of clusters I and III,
PAML identifies a number of sites with posterior probability > 0.5 of positive selection
but there is only one site with a significant (> 0.95) posterior probability of positive
selection. These appear at sequence positions 1 (in the H/C link) in cluster I and 182
(finger position 14 in the binding region) in cluster III. The fitted values of ω in clusters
I, III, and IV are 2.42, 1.53, and 6.58 respectively. To test if these are significantly > 1,
we perform the LRT M8 vs. M8A. Clusters I and IV yield significant results, but cluster
III just misses the cutoff with P = 0.07.
In our second analysis of these models, we divide the sites into constrained,
binding, and unconstrained sites as described above. Results of the fixed-sites models are
given in Table 8. It should not be surprising that model B which allows the mutation rate
to vary between classes and model D which allows κ (transition/transversion ratio) and ω

13
to vary among partitions, in all cases emerge as significant improvements (P < 0.001) in
the comparisons A vs. B and B vs. D.
Models C and E allow the amino acid frequencies to vary between classes. This
introduces a large number of additional parameters, but paradoxically, in most cases
results in fits that have a much worse likelihood than their simpler counterparts B and D.
For example in cluster I, model C is 45.9 units worse than B and E is 43.8 units worse
than D. Our best guess for the cause of this phenomenon is that when the sites are divided
into classes, the observed frequencies of amino acids at the constrained sites differ
considerably from the overall usage of amino acids in the protein and this causes trouble
for the mutation model in PAML.
Model F is a separate analysis of the three partitions, i.e., it runs model A for
each partition separately. As expected the estimated ω ratios at the constrained sites are
small in all four clusters 0.20, 0.02, 0.16, 0.48 and the unconstrained sites are larger 0.66,
0.23, 0.55, and 0.48. For the class of binding sites we get ω values larger than 1 in
clusters I, III, and IV: 1.14, 2.22, and 2.10. However, in cluster II our ω estimate is 0.34.
To test if the values observed at the binding sites are significantly different from 1, we
recalculate the log likelihood values in model F by fixing ω1 to be 1, and perform the
LRT as described above. Cluster I is not significant but clusters III, IV, and II are
significant with P values 0.05, 0.01, and 0.001 respectively.
In the last analysis of our four clusters, we applied the parsimony based program
ADAPTSITE.p (Suzuki and Gojobori 1999) to look for selection at individual codon
sites. No positively selected sites are identified in any cluster, but several nonbinding

14
sites turn out to be under negative selection at the 5% significance level in clusters I (15
sites), II (24 sites), III (17), and IV (5 sites).
Results of our analysis using ADAPTSITE.p with data pooled by finger position
are given in Table 9. There are three binding sites with significant positive selection,
finger position 13 in Cluster III (P < 0.0004), and positions 16 and 19 in Cluster IV (P <
0.0046 and P < 0.0458 respectively), but only the first two are smaller than the threshold
of 0.0178 demanded by the Bonferroni correction for our 28 tests. Again, there are a large
number of nonbinding sites that show negative selection at this level. In cluster II this
occurs for 21 of the 24 nonbinding sites, with four of the P values smaller than 10-6.
Indeed two of the binding sites, positions 15 and 16, show negative selection with P
values < 0.0013 and < 0.00008 respectively, consistent with previous PAML analysis.
DISCUSSION
Our study of four clusters of zinc finger genes on human chromosome 19 has
shown significant evidence for positive selection in cluster IV in all three analyses. In
cluster III, the P values are borderline in the first PAML analysis (site-specific models),
but significant in the second (fixed-sites models), and there is strong support for binding
site position 13 being under positive selection in the third (parsimony analysis). In the
case of cluster I, the significant result from the first test is not supported by the second
and third. Finally, for cluster II, the second and third analyses show significant evidence
of negative selection at the binding sites.

15
The results for cluster II are consistent with those of Shannon et al. (2003), who
examined /N Sd d ratios at three of the binding sites (our finger positions 13, 16, and 19)
and found no evidence of positive selection in cluster II genes but significant evidence of
purifying selection in pairwise comparisons of ZNF235 with Zfp235, Zfp93, and Zfp109,
see their Table 2. In ZNF genes near our cluster I they find significant evidence of
positive selection in comparisons of 226 with 230, 223, 284, and 222; 234 with 221; and
284 with 230. In no case are both of their compared genes within our cluster I (which
consists of 155, 221-225 and 230). Some of the comparisons that Shannon et al. (2003)
find significant are quite curious in view of the data presented in Table 2. ZNF223 has 9
zinc fingers versus 17 in ZNF226 and the overlapping fingers do not align well. ZNF284
and ZNF230 are more similar in length (11 versus 9 fingers) but comparison of the α-
helix sequences reveals very little overall similarity.
Tandemly duplicated genes are subject to gene conversion events. Given the
ability of gene conversion to homogenize gene families (see e.g., Chapter 11 of Li), it is
natural to ask if concerted evolution can introduce correlated changes in different
lineages and hence invalidates the use of Yang’s and Suzuki and Gojobori’s methods
which assume independent substitutions. We cannot rule out the possibility that gene
conversion acted soon after duplication to protect the duplicated copies from becoming
pseudogenes (see Walsh 1987), an effect that can cause the underestimation of
divergence times (see Teshima and Innan 2004). However, there are two reasons to doubt
that this force has acted in the recent past.
First we observe that gene conversion acts to homogenize genes that perform the
same function. Yet, Shannon et al.’s (2003) study of cluster I show that these genes have

16
different tissue specific expression patterns. The second obvious point is that if gene
conversion is still acting, it is not doing a very good job. At a gross level, the numbers of
zinc fingers of the genes in cluster I are 9, 9, 9, 15, 11, 19, and 17 respectively (the first
three appear to be recent duplicates). Within clusters there is considerable divergence
between sequences. For example in cluster IV, 23 synonymous and 36 nonsynonymous
differences separate the 840 nucleotides in the most closely related pair (ZNF431 and
LOC148206), and there are more than 100 differences between a typical pair of genes.
Several studies have presented evidence of gene conversion by examining
patterns in the differences between genes and pointing out regions of unusually high
similarity. See Figure 5 in Sharon et al. (1999), Figure 6 in Lazarro and Clark (2001), and
Figure 6 in Bettencourt and Feder (2001). To look for similar signals in our data, we
conducted an analysis (Figure 6) in which we calculated the number of nucleotide
differences in a 168 nucleotide window (the length of two fingers) between adjacent
genes in each cluster, advancing the window by 7 nucleotides until the end of the
sequence is reached. Successive differences in each cluster are indicated by hollow
squares, diamonds, and triangles, followed by filled versions of the symbols, and an X for
the 7th comparison. We find a lot of variability in divergence, but with the exception of
one gene pair at the end of cluster III, no other regions dip below 5 nucleotide differences
and most are above 10, which represents 6% divergence in the window. Assuming a
mutation rate of 2 x 10⁻⁸ per nucleotide per generation, this suggests that gene conversion
has not acted on these clusters in the last 3 million generations.
One of the disappointing aspects of our research is that although there are other
groups of zinc finger genes on human chromosome 19 showing visible signs of a close

17
relationship, we have found only two new clusters of genes where positive selection can
be demonstrated. There is a large group of genes near the centromere on the p-arm of
chromosome 19 with no orthologs in rodents, but the reasons for the explosive growth of
this gene family remain a mystery.
18
LITERATURE CITED
Bellefroid, E. J., D. A. Poncelet, P. J. Lecocq, O. Relevant, and J. M. Martial. 1991. The
evolutionarily conserved Krüppel-associated box domain defines a subfamily of
eukaryotic multifingered proteins. Proc. Natl. Acad. Sci. 88:3608-3612.
Bellefroid, E. J., J. C. Marine, A. G. Matera, C. Bourginion, T. Desai, K. C. Healy, P.
Bray-Ward, J. A. Martial, J. N. Ihle, and D. C. Ward. 1995. Emergence of the
ZNF91 Krüppel-associated box-containing zinc finger gene family in the last
common ancestor of the Anthropedia. Proc. Natl. Acad. Sci. 92:10757-10761.
Benos, P. V., A. S. Lapedes, and G. D. Stormo. 2002. Probabilistic code for DNA
recognition by proteins of the EGR family. J. Mol. Biol. 323:701-727.
Bettencourt, B. R., and M. E. Feder. 2001. Hsp70 duplication in the Drosophila
melanogaster species group: How and when did two become five? Mol. Biol.
Evol. 18:1272-1282.
Choo, Y., and A. Klug. 1997. Physical basis of a protein-DNA recognition code. Curr.
Opinion. Struct. Biol.7:117-125.
Dehal, P., P. Predki, A. S. Olsen et al. (21 co-authors). 2001. Human chromosome 19 and
related regions in mouse: Conservative and lineage specific evolution. Science
293:104-111.
Gell, D., M. Crossley, and J. Mackay. 2003. Zinc-finger genes. Pages 823-828 in Volume
5 of the Nature Encyclopedia of the Human Genome. MacMillan Publishers.
Innan, H. 2003. The coalescent and infinite-site model of a small multigene family.
Genetics 163:803-810.

19
Lander, E. S., L. M. Linton, B. Birren et al. (256 co-authors). 2001. Initial sequencing
and analysis of the human genome. Nature 409:860-921.
Lazzaro, B. P., and A. G. Clark. 2001. Evidence for recurrent paralogous gene conversion
and exceptional allelic divergence in the Attacin genes of Drosophila
melanogaster. Genetics 159:659-671.
Li, W. H. 1997. Molecular Evolution. Sinauer, Sunderland, MA.
Looman, C. 2003. The ABC of KRAB Zinc Finger Proteins. Comprehensive Summaries
of Uppsala Dissertations, 864. Acta Universitatis Upsalenis.
Looman, C., M. Ǻbrink, C. Mark, and L. Hellman. 2002. KRAB zinc finger proteins: An
analysis of molecular mechanisms governing their increase in complexity during
evolution. Mol. Biol. Evol. 19:2118-2130.
Margolin, J. F., J. R. Friedman, W. K. Meyer, H. Vissing, H. J. Thiesen, and F. J.
Rauscher, III. 1994. Krüppel-associated boxes are potent transcriptional repressor
domains. Proc. Nat. Acad. Sci. 91:4509-4513.
Miller J., A. McLachan, and A. Klug. 1985. Repetitive zinc-binding domains in the
protein transcription factor IIA from Xenopus oocytes. EMBO J. 4:1609-1614.
Nielsen R., and Z. Yang. 1998. Likelihood models for detecting positively selected amino
acid sites and applications to the HIV-1 envelope gene. Genetics 148:929-936.
Schuh, R., W. Aichler, U. Gaul et al. 1986. A conserved family of nuclear proteins
containing structural elements of Krüppel, a Drosophila segmentation gene. Cell
47:1025-1032.

20
Shannon, M., A. T. Hamilton, L. Gordon, E. Branscomb, and L. Stubbs. 2003.
Differential expansion of zinc-finger transcription factor loci in homologous
human and mouse gene clusters. Genome Research 13:1097-1110.
Sharon, D., G. Glusman, Y. Pilpel, M. Khen, F. Gruetzner, T. Haaf, and D. Lancet. 1999.
Primate evolution of an olfactory receptor cluster: Diversification by gene
conversion and recent emergence of pseudogenes. Genomics 61:24-36.
Swanson, W. J., R. Nielsen, and Q. Yang, 2003. Pervasive adaptive evolution in
mammalian fertilization proteins. Mol. Biol. Evol. 20:18-20.
Tang, M., M. Waterman, and S. Yooseph. 2002. Zinc finger clusters and tandem gene
duplication. J. Comp. Biol. 9:429-446.
Teshima, K. M., and H. Innan. 2004. The effect of gene conversion on the divergence
between duplicated genes. Genetics 166:1553-1560.
Thompson, J. D., D. G. Higgins, and T. J. Gibson. 1994 CLUSTAL W: improving the
sensitivity of progressive multiple sequence alignment through sequence
weighting, position specific gap penalties and weight matrix choice. Nucleic
Acids Research 22:4673-4680.
Venter, J. C., M. D. Adams, E. W. Myers et al. (274 co-authors). 2001. The sequence of
the human genome. Science 291:1304-1351.
Walsh, J. B. 1987. Sequence-dependent gene conversion: Can duplicated genes diverge
fast enough to escape conversion? Genetics 117:543-557.
Wolfe, S. A., L. Nekludova, and C. O. Pabo. 1999. DNA recognition by Cys2His2 zinc
finger proteins. Annu. Rev. Biophys. Biomol. Struct. 3:183-212.

21
Wong, W. S. W., Yang, Z., Goldman, N., and Nielsen, R. 2004. Accuracy and power of
statistical methods for detecting adaptive evolution in protein coding sequences
and for identifying positively selected sites. (to appear)
Yang, Z. 1997. PAML: a program package for phylogenetic analysis by maximum
likelihood. CABIOS 13:555-556.
http://abacus.gene.ucl.ac.uk./software/paml.html.
Yang, Z., R. Nielsen, N. Goldman, and A. M. K. Pedersen. 2000. Codon-substitution
models for heterogeneous selection pressure at amino acid sites. Genetics
155:431-449.
Yang, Z., and W. J. Swanson. 2002. Codon-substitution models to detect adaptive
evolution that account for heterogeneous selective pressures among site classes.
Mol. Biol. Evol. 19:49-57.
22
25 26 27 28 1 2 3 4 5 6 7 8 9 10 T G E K P Y/F C C A 86 64 33 24 71 39 40 18 1237 L 13 15 86 12 16 34 38 I 47 11 12 64 33 57 12 V 20 26 48 117 26 189 171 P 15 12 2054 14 60 10 F 15 324 49 W M 26 22 19 G 15 2012 43 31 10 37 87 2106 244 S 257 22 12 99 17 259 14 33 331 T 1848 13 11 23 30 60 76 42 169 Y 1933 13 C 14 37 2435 2435 35 N 25 39 35 359 12 18 10 Q 20 45 26 13 96 73 272 21 43 D 22 77 43 157 144 93 20 E 11 86 1959 656 546 1419 44 31 24 K 19 27 128 1953 1060 591 128 24 2195 R 19 98 17 316 40 102 51 17 48 111 65 H 14 22 93 18 30 39 11 12 13 14 15 16 17 18 19 20 21 22 23 24 F * * * L/F * H H A 56 12 92 140 140 162 147 54 23 L 36 80 84 32 52 2212 132 96 108 28 75 I 162 19 35 14 65 345 196 21 214 1185 V 39 74 39 11 47 135 212 46 80 460 P 17 144 32 12 F 2435 22 41 104 38 22 223 35 20 W 162 30 M 26 30 14 32 33 63 35 38 G 97 28 122 69 75 48 18 38 10 S 791 165 799 1740 441 152 103 11 49 90 T 261 39 44 127 256 616 252 24 50 458 Y 21 181 53 53 158 16 37 14 C 56 142 36 21 56 29 20 10 N 318 62 174 24 326 127 81 20 31 Q 12 639 35 29 140 255 327 998 26 D 11 47 22 10 81 17 38 10 E 43 10 16 24 24 134 247 K 124 65 287 22 68 84 285 506 301 R 333 381 253 29 81 203 366 224 1514 13 H 53 225 82 17 385 84 39 2435 80 2435 Table 1. Amino acid counts for the 2435 fingers in the 222 genes in our data set. For clarity numbers smaller than 10 are omitted.

23
1 2 3 4 5 6 7 ZNF284 qnsqlqt rrsgmyv hnsqlre srsnlnr qrsalns ZNF230 yisalri qssclqt crailqv hdlklqk lrsslnr dsldlhk ZNF222 yisalhi qssrlqt crsalkv hnfqlqk lrsslnr [drldlhk] ZNF223 yisalhi qslhlqt crsaltv hdfqlqk lrsslnr [drldlhk] ZNF221 dvsvfdl yspalhi qsshlqt [srsalnv] hdsqlqe vrsrlnr qrsalns ZNF155 yisalhv qsshlqt rrsalnv hdsqlke frsrlks qrsalnr ZNF224 yisalri qsshlqt rrsalnv hdsqlqe grsrlnr qrsalns ZNF225 yssalri qsshqqi rrsglyv hdsqlqe sranlnr lksalns ZNF234 yisalhi qsshlqt rrstltv hashlqe rrsalnn cssnlri ZNF226 qgahlqt rrsalnv qashlqd rnshlqs cssnlyi Zfp61 vdqhlms qashlqd rsshlrs cssnlyi 8 9 10 11 12 13 14 ZNF284 crqdlck wssclsr [mnsqghs] skfnldl wasgilr ensklrf ZNF230 wssylli sksglnl rassiln ZNF222 wssyllv sksgldf hassiln ZNF223 wssyllv sksgldl qassiln ZNF221 crrdfck wssclln tnsrrss rrldlef wascllk qstqlhs skfnldm ZNF155 grldfyk wssclln tnsqlss tkfnldl rassiln ZNF224 crrdlyt wascllk tnsqcys rrldldf rapcllk qnshlhs skfnldm ZNF225 yrqdlyk wasglsr tnsqrys rrldldf wasclln qnsqlyt qnsqlys ZNF234 qpsqfqa ysssfqa mkihyqv qssylki qssrlqi rradlki qashllt ZNF226 rpsslqa lssnlqa rnshyqv qssylqi qssrlqi rradlki qasnlla Zfp61 rpsslqa lnsnlqv 15 16 17 18 19 20 ZNF221 wascllk ZNF224 [wascllk] qnsqlhs wsstrlt [qnsfskv] rrlnldm qasslrl ZNF225 skfnldm rassiln ensqlhs wasthlt ZNF234 rsahlqa wslnldm qasslql rssqlqy wrsnlvs ZNF226 rsahlqa wslnldm qasslql rssqlqs wrsnltv Zfp61 rssqlqs wrsnlii Table 2. Alpha helix sequences for the cluster of human zinc finger genes at 49 megabases on chromosome 19, including cluster I. Here and in the next three tables, brackets indicate fingers that have lost one of the critical C, H, F or L residues, and numbers indicate fingers with length different from 28 amino acids.

24
1 2 3 4 5 6 Zfp109 qssalqt qwsvlha fssnlhi 26 sasnvkv rsfhlht ZNF235 qssnlqt qsshlya rstdlni qrshlqa cssnlht Zfp235 qssnlqt qsshlya rstdlni qrshlqa cssnlht Zfp93 qssalqt rssdlni qwahlqa cssnlht RNO308423 hsstlqt rssdlni qwahlqa cssnlht Zfp108 hsstlqt rssdlni kwdhlqi [cswnlht] RNO308422 qssalqt rnsdlni kwdhlqi cswnlht Zfp111 qssalqt [rssdlni] qcsllqa cisnfhi 27 RNO292703 qssalqt [rssglsi] rwshlqa cisnlht lnfnlhi 7 8 9 10 11 12 Zfp109 qrsslqv sassfqg rssylqi qrahlqv qrsglss ZNF235 lsfnlhs sassfqs qssyfqa wslnlhn qasnlqa qashlqa Zfp235 lsfnlhs sassfqs qssyfqa wslnlhn qasnlqa qashlqa Zfp93 lsgnldi sassfqs rsshfld wslslhs hasslqa ktsnlqa RNO308423 lsgnldi sassfrg rsshfld wslslhs hasslqa kasnlqa Zfp108 lsfnlhs sassfqr qssnfqa 26 hasslqa qasilqd RNO308422 lsfnlhs sassfqr qssnfqa 26 hawslqv qasilqd Zfp111 sassfqr rtsylqt qlshlqa cssnlht RNO292703 lsfnlhs sassfqr [rdsnlqt] csmdlni ylshlqa yssnlht 13 14 15 16 Zfp109 qpslfer qrshlvk ZNF235 qrsnlqv wsaglsa qashfht qrshliy Zfp235 qrsnlqv wsaglta qashfht qrshlvy Zfp93 qksslqv wsvglss qasyfhm RNO308423 qrsslqv wsaglta qasyfht qashfht Zfp108 qrsglqv wnsglss qashfht RNO308422 qrsglqv Zfp111 [lvsglqa] qawnlha qrsglqi lnsglia RNO292703 [lasslqa] qawnlqa qrsslqi lnsglta 17 18 19 20 Zfp111 lasslrt qvshlqs qksglqv wssglsa RNO292703 lasslrt qvshlqs qksglqv wssglsa
Table 3. Alpha helix sequences for mouse and rat genes that are related to ZNF235, including cluster II.

25
1 2 3 4 5 6 ZNF440 shssvrr clrlyli ysathri [sprsyrr] cpryvri sltsfqt ZNF439 yhssiqr clslyli ysathri sprschr cpryvrr sltsfqt ZNF20 flnlcli rsttlpv fpseirr sfssiqy cgshlqk ctsdlqr ZNF44 wpsllrm vyssylr dyssylr vsgslrv hlgsfqr LOC147837 wpsllrm fyssyrr dsssyir vssslrr hlgsfqi ZNF442 wpslfrm iyssylr dyssyvr vssslri hlgsfqr LOC90576 wpsllhm fyssylr dyssclr astslrr hlgsfqr ZNF443 wpsllhm fyssylr fyssylr dssscli vsgslqr hlgsfqr 7 8 9 10 11 12 ZNF440 svnsfqr hssslry sashlrv 34 cpksfqr ZNF439 saksfqr rsgsfry sapnlql sasqlri ZNF20 casqlqi yfsslri yfsslhi csssiry ZNF44 fpgsari hrssfrr spsvfqr tssslrk 27 sfkyfcr LOC147837 rpslvry hsssfrr ypsvcqr hsssfrr ypsvcqr ZNF442 cpsslqs hhssfrs ypsvfqg issslrr 27 cftylsq LOC90576 cpsslks hsssfrr ypsvfqr issslrr 27 cfqylsq ZNF443 cpsslqs hrssfrs ypsvfqr issslrr 27 rfrylsr 13 14 15 16 17 ZNF44 rfsylkt wpsfllr rssfcre ZNF442 hfgnlkv wltcllr rsrflrg LOC90576 hfgnlkv wltcflr hsrflqg slsslhr slsslhr ZNF443 hydnlkv wltcflr hsrflqg slsslhr 5 slsslhr Table 4. Alpha helix sequences of Cluster III.

26
1 2 3 4 5 6 ZNF90 qsstlat rsshlts ysstlta ysstlta sssilyv lssilst LOC163233 qsstltt wsshltt rfsylta rssnltt rssilta hpsvltt ZNF85 misclte wsstltk qssnlik rfstltt rsstltt qssnltt ZNF430 mllhltq wfstltr qsstltt rsshltt rsshltt qsstltt LOC148206 mllhlhq rfstltr hsstltt hsshltt hpsaltt rfsyltk ZNF431 mllhlsq wfstltr qsstltt rsshltt qsstlst rfsyltk LOC163227 mllhltq wfstltt rsshltt rsshltt rsshltt qsstltt 7 8 9 10 11 12 ZNF90 rslvlrt sssllyk rsstlti rssalst rssnltt yssalst LOC163233 yfssltt wsshltt ysssltt cfsiltt ssshlta rsfiltr ZNF85 qsahltt hfshltt hsstltk [qssklte] qssnltr wpstlti ZNF430 rfsyltk wsstltk essnlta rspklta qfsnltk LOC148206 wsstltk vsshltt hssklti qssnltk rssnltt rssnltk ZNF431 wsstltk essnltt rspqlta qssiltt rssnltk qsstltk LOC163227 rfsylik wssaltk essnltt rssqlta rsstltk 13 14 15 ZNF90 rssvlsk rssqlts lssdlnt LOC163233 cpstltt ZNF85 qsskltk qssnltk wssvltk Table 5. Alpha helix sequences of Cluster IV.

27
Human gene Mouse gene Rat gene 63.161 - MGC41906 2900092C05Rik 7-9.674 – 63.180 - FLJ14260 2410024M24Rik 7-9.768 - LOC292610 1-72.660 + 63.215 - LOC376552 63.237 + FLJ33779 63.270 + ZNF135 Zfp35 18-24.530 63.287 - FLJ12895 LOC232875 7-10.095 - LOC292615 1-73.191 - 63.329 - FLJ12586 2810439M05Rik 7-10.386 + LOC308361 1-72.777 - 63.382 + ZNF274 Zfp110 7-10.336 + LOC308362 1-72.813 + 63.419 + LOC125910 63.432 + AF20591 63.482 + ZNF8 Zfp128 7-10.118 + LOC308363 1-72.866 + 63.530 + HKR2 D530006B18Rik 7-10.135 + LOC308364 1-72.890 + 63.548 - A1BG LOC223599 15-62.029 A1bg 7-97.803 63.559 - LOC162968 63.570 - LOC116412 63.590 + RPS5 Rps5 7-10.159 + Rps5 1-72.906 + 63.602 - FLJ39005 63.611 + LOC201514 63.636 - ZNF132 Zfp132 cyto only 63.670 + ZF5128 D430030K24Rik 7-10.218 + LOC365192 1-73.032 - 63.679 + FLJ20626 A630035I11Rik 7-10.230 + LOC308365 1-73.022 - 63.701 - SLC27A5 Slc27a5 7-10.240 - LOC79111 1-73.002 + 63.716 - FLJ14486 LOC232879 7-10.258 - LOC308366 1-72.990 + 63.747 + TRIM28 Trim28 7-10.275 + Trim28 1-72.970 - 63.754 - BC-2 1500016L11Rik 7-10.283 - LOC365191 1-72.968 + 63.758 - UBE2M Ubc-rs2 7-10.286 - LOC361509 1-72.963 + 63.765 - ZNF42 Zfp98 7-10.294 - LOC361508 1-72.931 + Table 6. Cluster V and orthologous genes in mouse and rat. Positions are indicated in megabases, with the first number in the mouse and rat columns specifying the chromosome and signs giving the orientation of the gene.

28
Table 7. Log-likelihood values and fitted parameters for site-specific models. For each LRT, 2∆l is compared to χ2 with df = 2. Boldface indicates significant results.
Model Cluster I Cluster II Cluster III Cluster IV
M7 (beta) -3005.662 -2654.088 -3483.110 -3172.882
M8A -3004.938 -2653.128 -3480.784 -3167.185
M8 (beta & ω) -3002.171 p1 = 0.074 ω = 2.419
-2652.101 p1 = 0.004 ω = 16.143
-3479.158 p1 = 0.195 ω = 1.526
-3148.927 p1 = 0.052 ω = 6.582
M7 vs. M8 2∆l = 6.982 P < 0.05
2∆l = 3.974 P = 0.14
2∆l = 7.904 P < 0.05
2∆l = 47.910 P < 0.0001
M8 vs. M8A 2∆l = 5.534 P < 0.05
2∆l = 2.054 P = 0.15
2∆l = 3.252 P = 0.07
2∆l = 36.516 P < 0.0001

29
Model Cluster I
Cluster II Cluster III Cluster IV
A (homogeneous) -3046.741 -2681.407 -3555.517 -3233.715
B (different rs) -3028.001 -2670.099 -3505.481 -3138.739
C (different rs & πs ) -3073.979 -2674.725 -3551.098 -3140.110
D (different rs, κ and ω) -3011.958 -2634.975 -3473.532 -3110.030
E (different rs, κ and ω, & πs) -3055.735 -2634.275 -3521.239 -3112.362
F (separate analysis) -3040.904 Binding sites: -495.440
-2608.443 Binding sites: -467.418
-3497.644 Binding sites: -614.180
-3092.701 Binding sites: -669.518
Fixing ω=1: -495.535
Fixing ω=1: -475.595
Fixing ω=1: -616.614
Fixing ω=1: -702.968
2∆l = 0.190 2∆l = 16.354 2∆l = 4.868 2∆l = 6.900 P ~ 0.66 P < 0.001 P < 0.05 P < 0.01
ω1 (binding sites) 1.14 0.34 2.215 2.10 ω2 (constrained sites) 0.20 0.02 0.160 0.14 ω3 (all else) 0.66 0.23 0.545 0.48 Table 8. Log-likelihood values for fixed-sites models and fitted values of /N Sd dω = . Here the LRT focuses on the binding sites analyzed using model F where 2∆l is compared to χ2 with df = 1. Again boldface indicates significant results.

30
I II III IV 4 C 0.000021 0.000025 7 C 0.000004 20 H 0.000017 0 0.000017 0.001372 24 H 0 0.000092 11 F 0.000012 0.001372 0.000032 0 17 L 0 25 T 0 26 G 0.000007 27 E 0.001895 0.000012 0.008111 28 K 0.000072 0.000001 1 P 0.000001 0.000409 0.011906 2 Y 0.000162 3 0.011503 5 0.016277 0.009948 0.000001 6 0.017349 0.00074 0.002185 8 0.005389 0.003090 0.011941 9 0.001263 0 10 0.015824 0.000075 12 0.001935 14 0.004581 18 0.000068 21 0.001331 22 0.006919 23 0.011867 13 * 0.590508 0.840180 0.000375 0.665060 15 * 0.695631 0.999695 0.163579 0.983200 16 * 0.755179 0.999989 0.742808 0.004593 19 * 0.288510 0.956726 0.095662 0.045765 Table 9. One sided P values for negative selection at nonbinding sites and positive selection at binding sites. All P values are given for binding sites but in other cases only P values significant after Bonferroni correction are shown. Here 0 indicates a P value smaller than 10-6. Boldface indicates significant results for positive selection.

31
Figure 1. Structure of a zinc finger. Stars indicate sites involved in DNA binding.

32
0
5
10
15
20
25
30
1 2 3 4 5 6 7 8 9 10 11 12 13 14 15 16 17 18 19 20 21 22 23 24 25 26 27 28 29 30 31 32 33 34
number of fingers
num
ber o
f gen
es
Figure 2. Histogram of the number of fingers in the 222 genes in our data set.

33
0.1
ZNF208 21.94 FLJ11637 2.81
MGC26707 2.79 LOC126295 2.85 ZNF77 2.88
LOC374879 9.26 LOC342970 11.61
LOC199692 11.56 ZNF136 12.13
ZNF44 12.22 IIILOC147837 12.28 III
ZNF442 12.32 IIILOC90576 12.36 III
ZNF443 12.40 IIIZNF20 12.10 III
ZNF440 11.78 IIIZNF439 11.83 III
ZNF433 11.98 LOC342972 12.01
ZNF317 9.11 ZNF177 9.33
MGC13105 9.29 ZNF426 9.49
LOC162993 9.72 LOC126494 22.23 LOC126502 22.67 ZNF43 21.78
ZNF85 20.89 IVZNF90 20.07 IV
LOC163233 20.51 IVLOC374889 21.48
ZNF257 22.02 LOC148198 22.36
LOC126504 22.81 ZNF430 20.99 IVLOC163227 21.69 IV
LOC148206 21.04 IVZNF431 21.11 IV
ZNF91 23.33 LOC376506 23.85
ZNF254 24.06
Figure 3. Tree for KRAB containing zinc finger genes on human chromosome 19p. Numbers give their chromosomal location in megabases. Clusters III and IV are indicated. Note the close relationship of genes at 20-24 megabases.

34
0.1
ZNF45 49.10 Zfp94 49.10
Zfp61ZNF284 49.26
ZNF221 49.14 IZNF224 49.29 I
ZNF225 49.30 IZNF155 49.18 I
ZNF230 49.19 IZNF222 49.22 I
ZNF223 49.24 IZNF234 49.33
ZNF226 49.36 ZNF235 49.48 II
Zfp235 49.48 IIZfp108 II
Zfp93 IIRNO308422 II
RNO308423 IIZfp109 II
Zfp114Zfp111
RNOzfp111ZNF229 49.62
ZNF285 49.58 LOC14771 49.65 ZNF180 49.67
Zfp180 49.67 rKr1 49.67
MGC48625 58.43 LOC162966 57.96 FLJ10891 57.76
LOC125893 58.10 ZNF28 57.99
LOC90333 58.03 ZNF83 57.80
LOC376544 58.39 ZNF415 58.30
ZNF347 58.33 KR18 58.26
FLJ14345 58.35 ZNF228 49.52
Zfp112 49.52 RNO308420 49.52
Figure 4. Tree for zinc finger genes in clusters at 49 and 58 megabases on human chromosome 19q along with related mouse and rat genes. Numbers give their chromosomal location in megabases of the gene or of its human ortholog. Clusters I and II are indicated.

35
0.1
FLJ14260 63.18
2410024M24Rik 63.18
RNO292610 63.18
ZNF135 63.27
Zfp35 63.27
ZNF274 63.38
Zfp110 63.38
RNO308362 63.38
HKR2 63.53
D530006B18Rik 63.53
RNO308364 63.53
ZNF42 63.76
Zfp98 63.76
RNO361508 63.76
ZNF8 63.48
Zfp128 63.48
RNO308363 63.48
ZF5128 63.67
D430030K24Rik 63.67
RNO365192 63.67
Figure 5. Genes near the telomere of human chromosome 19 that have orthologs in rat and mouse. Human genes are numbered by their chromosomal location in megabases, rat and mouse genes by the location of their human ortholog. The structure of the tree suggests that all of these genes were present in the common ancestor of humans and rodents.

36
Cluster I
0
10
20
30
40
50
60
70
80
1 3 5 7 9 11 13 15 17 19 21 23 25 27 29 31 33 35 37 39 41 43 45 47 49 51 53 55 57 59 61 63 65 67 69 71 73 75 77 79 81 83 85
Sliding window number
Pairw
ise
diffe
renc
es
Cluster II
0
10
20
30
40
50
60
70
1 4 7 10 13 16 19 22 25 28 31 34 37 40 43 46 49 52 55 58 61 64 67 70 73 76 79 82 85 88 91 94 97
Sliding window number
Pairw
ise
diffe
renc
es

37
Cluster III
0
10
20
30
40
50
60
70
80
1 3 5 7 9 11 13 15 17 19 21 23 25 27 29 31 33 35 37 39 41 43 45 47 49 51 53 55 57 59 61 63 65 67 69 71 73 75 77 79 81 83 85
Sliding window number
Pairw
ise
diffe
renc
es
Cluster IV
0
5
10
15
20
25
30
35
40
1 4 7 10 13 16 19 22 25 28 31 34 37 40 43 46 49 52 55 58 61 64 67 70 73 76 79 82 85 88 91 94 97
Sliding window number
Pariw
ise
diffe
renc
es
Figure 6. A sliding window analysis calculates the number of nucleotide differences between successive sequences in the cluster. We use a 168 nucleotide window (the length of two zinc fingers) that advances by 7 nucleotides in each step.