adapting to the work-life interface: the influence of individual differences, work...
TRANSCRIPT

i
Adapting to the work-life interface: The influence of individual differences, work
and family on well-being, mental health and work engagement.
By
Prudence M. R. Millear
B. Sc. Ag. (Hons), Grad. Dip Psych, B. Psych. (Hons)
A thesis submitted in fulfilment of the requirements of the degree of
Doctor of Philosophy
School of Psychology and Counselling
Faculty of Health
Queensland University of Technology
February 2010

ii

iii
Keywords
Bronfenbrenner, dispositional optimism, coping self-efficacy, affective commitment,
skill discretion, job autonomy, life satisfaction, psychological well-being, mental
health, work engagement, burnout, longitudinal modelling, gain spirals, loss spirals,
Conservation of Resources, resource caravans, working adults

iv

v
Statement of Original Authorship
The work contained in this thesis has not been previously submitted to meet
requirements for an award at this or any other higher education institution. To the
best of my knowledge and belief, this thesis contains no material previously
published or written by another person except where due reference is made.
Signature ……………………………………………………………………………
Date …………………………………………………………………………………

vi

vii
Publications and presentations arising from the PhD research
Journal articles
1. Millear, P.M & Liossis, P.L., Gain spirals and resource caravans: An integrated
longitudinal model of well-being, mental health and work engagement among
Australian workers, under review, Journal of Occupational and
Organizational Psychology
Book Chapters
1 Millear, P.M. & Liossis, P.L. (2010) Longitudinal modelling of individual
differences and the workplace: well-being and work engagement. Chapter 18
in Hicks, R.E. (Ed.) Personality and Individual Differences: Current
Directions. Brisbane, Australia: Australian Academic Press
2. Millear, P.M. & Liossis, P.L. Doing it for yourself: The choices and strategies of
managing the work-life challenge, accepted for publication, Wayfinding
through life‟s challenges: Coping and survival, Nova Science Publishers, NY,
K. Gow & M. Celinski (Eds)
Conference Presentations
2008 European Academy of Occupational Health Psychology conference at the
University of Valencia, November 2008, 2 presentations: 1 Longitudinal
modelling of well-being and mental health in Australian workers; 2 Exploring
burnout and work engagement in diverse occupations: A continuum or two
separate factors?

viii
2008 Australian Conference for Personality and Individual Differences (ACPID),
Bond University, (November, 2008) “Longitudinal modelling of the influence
of individual differences and the workplace on well-being and work
engagement”
2009 8th
Industrial and Organizational Psychology conference, Sydney (June
2009), Paper Presentation, “An integrated longitudinal model of well-being,
mental health and work engagement among Australian workers”

ix
Acknowledgements
I would like to acknowledge and sincerely thank my supervisors, Dr Poppy
Liossis, my Principal Supervisor and Professor Ian Shochet, my Associate
Supervisor for the guidance and support that they have provided throughout my
candidature. I would also like to thank Dr Cameron Hurst and Dr Trish Obst for their
assistance with the Structural Equation Modelling that I undertook and thank
Cameron particularly for deciphering the process of longitudinal modelling. I would
like to thank my postgraduate friends for their unstinting support, coffee and
sympathy and thank my family and friends for helping where they could.
My greatest thanks are to my husband and children for bearing with me and
understanding the work involved in completing my thesis, in the middle of family
life, rugby and the house renovations. We have done this together.

x

xi
Abstract
Bronfenbrenner‟s Bioecological Model, expressed as the developmental equation, D
f PPCT, is the theoretical framework for two studies that bring together diverse
strands of psychology to study the work-life interface of working adults.
Occupational and organizational psychology is focused on the demands and
resources of work and family, without emphasising the individual in detail. Health
and personality psychology examine the individual but without emphasis on the
individual‟s work and family roles. The current research used Bronfenbrenner‟s
theoretical framework to combine individual differences, work and family to
understand how these factors influence the working adult‟s psychological
functioning. Competent development has been defined as high well-being (measured
as life satisfaction and psychological well-being) and high work engagement (as
work vigour, work dedication and absorption in work) and as the absence of mental
illness (as depression, anxiety and stress) and the absence of burnout (as emotional
exhaustion, cynicism and professional efficacy).
Study 1 and 2 were linked, with Study 1 as a cross-sectional survey and Study
2, a prospective panel study that followed on from the data used in Study1.
Participants were recruited from a university and from a large public hospital to take
part in a 3-wave, online study where they completed identical surveys at 3-4 month
intervals (N = 470 at Time 1 and N = 198 at Time 3). In Study 1, hierarchical
multiple regressions were used to assess the effects of individual differences (Block
1, e.g. dispositional optimism, coping self-efficacy, perceived control of time,
humour), work and family variables (Block 2, e.g. affective commitment, skill
discretion, work hours, children, marital status, family demands) and the work-life
interface (Block 3, e.g. direction and quality of spillover between roles, work-life

xii
balance) on the outcomes. There were a mosaic of predictors of the outcomes with a
group of seven that were the most frequent significant predictors and which
represented the individual (dispositional optimism and coping self-efficacy), the
workplace (skill discretion, affective commitment and job autonomy) and the work-
life interface (negative work-to-family spillover and negative family-to-work
spillover). Interestingly, gender and working hours were not important predictors.
The effects of job social support, generally and for work-life issues, perceived
control of time and egalitarian gender roles on the outcomes were mediated by
negative work-to-family spillover, particularly for emotional exhaustion. Further, the
effect of negative spillover on depression, anxiety and work engagement was
moderated by the individual‟s personal and workplace resources.
Study 2 modelled the longitudinal relationships between the group of the
seven most frequent predictors and the outcomes. Using a set of non-nested models,
the relative influences of concurrent functioning, stability and change over time were
assessed. The modelling began with models at Time 1, which formed the basis for
confirmatory factor analysis (CFA) to establish the underlying relationships between
the variables and calculate the composite variables for the longitudinal models. The
CFAs were well fitting with few modifications to ensure good fit. However, using
burnout and work engagement together required additional analyses to resolve poor
fit, with one factor (representing a continuum from burnout to work engagement)
being the only acceptable solution. Five different longitudinal models were
investigated as the Well-Being, Mental Distress, Well-Being-Mental Health, Work
Engagement and Integrated models using differing combinations of the outcomes.
The best fitting model for each was a reciprocal model that was trimmed of trivial
paths. The strongest paths were the synchronous correlations and the paths within

xiii
variables over time. The reciprocal paths were more variable with weak to mild
effects. There was evidence of gain and loss spirals between the variables over time,
with a slight net gain in resources that may provide the mechanism for the
accumulation of psychological advantage over a lifetime. The longitudinal models
also showed that there are leverage points at which personal, psychological and
managerial interventions can be targeted to bolster the individual and provide
supportive workplace conditions that also minimise negative spillover.
Bronfenbrenner‟s developmental equation has been a useful framework for
the current research, showing the importance of the person as central to the
individual‟s experience of the work-life interface. By taking control of their own life,
the individual can craft a life path that is most suited to their own needs. Competent
developmental outcomes were most likely where the person was optimistic and had
high self-efficacy, worked in a job that they were attached to and which allowed
them to use their talents and without too much negative spillover between their work
and family domains. In this way, individuals had greater well-being, better mental
health and greater work engagement at any one time and across time.

xiv
Table of Contents
Keywords .................................................................................................................... iii Statement of Original Authorship ................................................................................ v
Publications and presentations arising from the PhD research .................................. vii Acknowledgements ..................................................................................................... ix Abstract ....................................................................................................................... xi Table of Contents ...................................................................................................... xiv List of Tables ............................................................................................................. xix
List of Figures .......................................................................................................... xxii List of Appendices .................................................................................................. xxiii Chapter 1: Theories and literature review of Bronfenbrenner‟s developmental
equation, applied to individuals and the work-life interface ........................................ 1 1.1 Bronfenbrenner‟s Bioecological Model of Human Development ..................... 2
1.2 Theories for D, the developmental outcomes, defined by well-being, mental
health, burnout and work engagement ..................................................................... 9
1.2.1 Well-being ................................................................................................... 9 1.2.1.1 Prevalence. ......................................................................................... 12 1.2.1.2 Stability of well-being ........................................................................ 14 1.2.1.3 Australian health and working provisions .......................................... 14
1.2.2 Mental health, as the absence of mental illnesses ..................................... 15 1.2.2.1 Costs and prevalence .......................................................................... 18
1.2.3 Burnout and work engagement ................................................................. 22
1.2.4 Bringing together well-being, mental health, burnout and engagement ... 26 1.3 Understanding the person, P, in the developmental equation .......................... 29
1.3.1 Generative dispositions and demand characteristics ................................. 29 1.3.2 Theories of the generative disposition of P, the person occupying and
managing multiple roles ..................................................................................... 30 1.3.3 Linkages between the generative disposition and positive affect, positive
psychology and resilience .................................................................................. 34 1.3.4 Gender and the generative disposition of the active participant, P ........... 39 1.3.5 Gender ....................................................................................................... 40
1.3.5.1 Gender and the work environment ..................................................... 41 1.3.5.2 Gender and parenting ......................................................................... 46
1.3.5.3 Gender and house work. ..................................................................... 48 1.3.6 Dispositional optimism ............................................................................. 50 1.3.7 Self-efficacy, as coping self-efficacy ........................................................ 56 1.3.8 Perceived control of time .......................................................................... 58 1.3.9 Theories of the demand characteristics of P, the person occupying and
managing multiple roles ..................................................................................... 60
1.3.10 Humour .................................................................................................... 64
1.3.11 Social skills and relationships ................................................................. 69 1.3.12 Conclusion for P, the Person ................................................................... 73
1.4 Understanding C, the Context for multiple roles ............................................. 75 1.4.1 Theories and models of C, the Context for multiple roles ........................ 75 1.4.2 Direction for the literature review of C, the context ................................. 80
1.4.3 Working hours and schedules ................................................................... 82 1.4.4 Demands and resources ............................................................................. 87 1.4.5 Affective commitment ............................................................................... 93
1.4.6 Managerial support of work-life issues ..................................................... 95

xv
1.4.7 Family characteristics................................................................................ 99
1.4.8 Multiple roles and spillover .................................................................... 104 1.4.9 Exploring the interactions between work and non-work domains .......... 106
1.4.9.1 Comparing types of jobs .................................................................. 108
1.4.9.2 Importance of roles .......................................................................... 110 1.4.9.3 Individual factors ............................................................................. 112 1.4.9.4 Workplace and family factors .......................................................... 113
1.4.10 Exploring work-life balance and work-life fit ...................................... 120 1.4.11 Conclusions of the Context of the work-life interface .......................... 122
1.5 T, the time frame over which multiple roles develop and occur .................... 124 1.5.1 Longitudinal studies from a developmental perspective ......................... 130 1.5.2 Longitudinal studies from an organizational perspective ....................... 136 1.5.3 Conclusions for Time in the developmental equation............................. 142
1.6 Proposed research program ............................................................................ 143
1.6.2 Study 1 .................................................................................................... 143 1.6.3 Study 2 .................................................................................................... 145
Chapter 2, Study 1: Using hierarchical multiple regressions to explore the predictors
of well-being, mental illness, burnout and work engagement of working adults .... 147 2.1.1 Hypothesis for Study 1. ........................................................................... 148
2.2 Methods .............................................................................................................. 149
2.2.1 Participants .............................................................................................. 149 2.2.1.1 Recruitment ...................................................................................... 149
2.2.2 Internet survey development ................................................................... 150
2.2.3 Internet survey methodology .................................................................. 151 2.2.4 Measures ................................................................................................. 155
2.2.4.1 Demographics .................................................................................. 155 2.2.4.2 Schedules, education, job conditions and income. ........................... 156
2.2.4.3 Work-life fit, work-life balance, feeling busy and personal problems.
...................................................................................................................... 157
2.2.5 Reliabilities and details of the measures ................................................. 157 2.2.6 P, the Person: Generative disposition variables ...................................... 158
2.2.6.1 Dispositional optimism. ................................................................... 158
2.2.6.2 Coping self-efficacy ......................................................................... 158 2.2.6.3 Control ............................................................................................. 159
2.2.7 P, the Person: Demand characteristic variables ...................................... 161 2.2.8 C, the Context: Workplace conditions .................................................... 161
2.2.8.4 Managerial support for work-life issues .......................................... 162 2.2.8.5 Affective commitment ..................................................................... 162
2.2.9 C, the Context: The work-life interface .................................................. 163
2.2.10 Well-being, mental illness, burnout and work engagement .................. 164
2.2.10.3 Satisfaction with life domains ........................................................ 165
2.2.10.5 Burnout ........................................................................................... 166 2.2.10.6 Work Engagement .......................................................................... 166
2.2.11 Procedure............................................................................................... 167 2.2.12 Analytical strategy for the hierarchical multiple regression (HMR)
analyses ............................................................................................................ 169
2.3 Results ................................................................................................................ 174 2.3.1 Data cleaning and screening.................................................................... 174 2.3.2 Demographics ......................................................................................... 176
2.3.3 Scale construction and sample size ......................................................... 179
xvi
2.3.4 Means, standard deviations and correlations between the variables ....... 180
2.3.5 Presentation of the results of the HMR ................................................... 189 2.3.6 Life satisfaction ....................................................................................... 191 2.3.7 Psychological well-being ........................................................................ 193
2.3.8 Satisfaction with work ............................................................................. 194 2.3.9 Work vigour ............................................................................................ 198 2.3.10 Work dedication .................................................................................... 200 2.3.11 Work absorption .................................................................................... 201 2.3.12 Depression ............................................................................................. 205
2.3.13 Anxiety .................................................................................................. 207 2.3.14 Stress ..................................................................................................... 210 2.3.15 Emotional exhaustion ............................................................................ 212 2.3.16 Cynicism ................................................................................................ 215 2.3.17 Professional efficacy ............................................................................. 218
2.3.18 Summary of the significant predictors of the hierarchical multiple
regressions ........................................................................................................ 220
2.3.19 Post-hoc analysis: Examining moderation between the most common
predictors for the outcomes .............................................................................. 224 2.3.20 Post-hoc analysis: What happened to humour? ..................................... 230 2.3.21 Post-hoc analysis: An examination of gender ....................................... 232
2.3.22 Post-hoc analysis: What predicts negative spillover? ........................... 234 2.3.23 Post-hoc analysis: Understanding positive spillover ............................. 236
2.4 Discussion .......................................................................................................... 238
2.4.1 Limitations and strengths of Study 1....................................................... 255 Chapter 3, Study 2: Longitudinal modelling ............................................................ 257
3.1.1 Hypothesis for Study 2 ............................................................................ 259 3.2 Methods .............................................................................................................. 259
3.2.1 Participants .............................................................................................. 259 3.2.2 Recruitment of participants, survey methods and materials ................... 260
3.2.3 General process for longitudinal modelling ............................................ 260 3.2.4 Introduction to SEM and associated terminology ................................... 261 3.2.5 Assessing model fit ................................................................................. 263
3.2.5.1 Normed Chi-Squared statistic. ......................................................... 264 3.2.5.2 Root Mean Square Error of Approximation (RMSEA). .................. 265
3.2.5.3 Akaike Information Criteria (AIC). ................................................. 267 3.2.5.4 Comparative Fit Index (CFI) ............................................................ 267 3.2.5.5 Expected Cross-Validation Index (ECVI). ....................................... 268
3.2.6 Early SEM models .................................................................................. 269 3.2.7 Confirmatory Factor Analysis (CFA) ..................................................... 270
3.2.8 Models to be considered in the CFAs and for longitudinal modeling .... 271
3.2.9 Constructing composite variables for the longitudinal models ............... 273
3.2.10 Naming the composite variables ........................................................... 275 3.2.11 Calculations of the composite variables ................................................ 276 3.2.12 Analytical strategy for longitudinal modelling ..................................... 276
3.2.12.2 Model trimming. ............................................................................. 280 3.2.13 Summary of methods used for the longitudinal modeling .................... 281
3.3 Results of the Longitudinal Modeling ................................................................ 282 3.3.1 Sample size and characteristics ............................................................... 282
3.4 Time 1 SEMs as a basis for longitudinal models ............................................... 286
3.5 Confirmatory factor analyses (CFAs) ................................................................ 288

xvii
3.5.1 Confirmatory factor analysis of Well-Being model ................................ 289
3.5.2 Factor Score Weights for Well-Being model .......................................... 290 3.5.3 Confirmatory factor analysis of the Mental Distress model ................... 292 3.5.4 Factor score weights for the Mental Distress model ............................... 294
3.5.5 Confirmatory factor analysis for the Well-Being-Mental Health model 295 3.5.6 Factor score weights for the Well-Being – Mental Health model .......... 297 3.5.7 Confirmatory factor analysis for the Work Engagement model, based on
the scales of burnout and work engagement .................................................... 297 3.5.8 CFA for Burnout and Engagement alone ................................................ 299
3.5.8.1 One-factor CFA. ............................................................................... 299 3.5.8.2 Two factor CFA. .............................................................................. 300
3.5.9 Confirmatory Factor Analysis for the Work Engagement model ........... 301 3.5.10 Factor score weights for the Work Engagement model ........................ 302 3.5.11 Confirmatory factor analysis of the Integrated model .......................... 303
3.5.12 Factor score weights for the Integrated model ...................................... 308 3.6 Comparing the longitudinal models ................................................................... 310
3.6.1 Competing sets of longitudinal models ................................................... 310 3.6.2 The longitudinal Well-Being Model ....................................................... 313 3.6.3 The longitudinal Mental Distress model ................................................. 316 3.6.4 The longitudinal Well-Being – Mental Health model............................. 318
3.6.5 The longitudinal Work Engagement model ............................................ 319 3.6.6 The longitudinal Integrated model .......................................................... 323 3.6.7 Synchronous correlations, standardized regression weights and
significance of paths in the longitudinal models .............................................. 325 3.4.8 Individual Factors in the longitudinal models ......................................... 330
3.6.9 Positive Workplace Factors in the longitudinal models .......................... 330 3.6.10 Negative Spillover in the longitudinal models ...................................... 331
3.6.11 Overall Well-Being in the longitudinal models .................................... 331 3.6.12 Mental Illness in the longitudinal models ............................................. 334
3.6.13 Work Engagement in the longitudinal models ...................................... 335 3.6.14 Gain and loss spirals.............................................................................. 336 3.6.15 Squared multiple correlations from the models .................................... 340
3.6.16 Summary of the results of the longitudinal models .............................. 340 3.7 Discussion of the longitudinal models ............................................................... 343
3.7.1 Discussion of the Time 1 SEMs .............................................................. 344 3.7.2 Confirmatory factor analyses .................................................................. 346 3.7.3 Factor score weight from the CFAs ........................................................ 352 3.7.4 How factor score weights explain the relationships of the Integrated model
.......................................................................................................................... 355
3.7.5 The longitudinal models .......................................................................... 357
3.7.6 Stability and change in the longitudinal models ..................................... 359
3.7.6.1 Stability in the longitudinal models ................................................. 359 3.7.6.2 Change in the longitudinal models ................................................... 362
3.7.7. Limitations and strengths of Study 2 ..................................................... 370 3.7.8 Conclusions ............................................................................................. 371
Chapter 4: Discussion of research findings and conclusions ................................... 375
4.1 The developmental equation, D f PPCT ........................................................ 376 4.1.1 P, the person: The generative disposition ............................................... 376 4.1.2 P, the person: Their demand characteristics ............................................ 376
4.1.3 C, the context. ......................................................................................... 377

xviii
4.1.4 T, Time. ................................................................................................... 377
4.1.5 Summary of D f PPCT. ........................................................................... 378 4.2 Major findings ................................................................................................ 378 4.3 Interesting non-findings ................................................................................. 384
4.4 Applications of the research ........................................................................... 385 4.5 Future research ............................................................................................... 388 4.6 A final word ................................................................................................... 393
References ................................................................................................................ 395 Appendices ............................................................................................................... 442
Appendix A: Call for volunteers from the university alumni .................................. 442 Appendix B: Call for volunteers from the public hospital ....................................... 443 Appendix C. Time 2 Call to action .......................................................................... 444 Appendix D: Time 3 Call to action .......................................................................... 445 Appendix E: Second and third reminder calls to action ........................................... 446
Appendix F: Measures used in Study 1 and 2 .......................................................... 447 Appendix G: Simple slopes of the moderated regression analyses .......................... 454
Appendix H: Results of the Time 1structural equation modelling ........................... 457 Appendix I: Confirmatory Factor Analyses for the longitudinal models ................. 469 Appendix J: Results of the longitudinal models....................................................... 483 Appendix K: Terms and glossary for Study 2, Longitudinal modelling .................. 510

xix
List of Tables
Table 2.1 Variables in each block as blocks are entered into hierarchical multiple
regressions …………………………………………………………………170
Table 2.2 Retention of participants over time, with percentages of original sample of
participants ………………………………………………………………...176
Table 2.3 Correlations between the variables included in the hierarchical multiple
regressions ……………………………………………………………182-188
Table 2.4 Results for the three steps of hierarchical multiple regressions for life
satisfaction ………………………………………………………………...192
Table 2.5 Results for the three steps for the hierarchical multiple regression for
psychological well-being ………………………………………………….195
Table 2.6 Results for the three steps for the hierarchical multiple regression for
satisfaction with work ……………………………………………………..197
Table 2.7 Results for the three steps for the hierarchical multiple regression for work
vigour ……………………………………………………………………...199
Table 2.8 Results for the three steps for the hierarchical multiple regression for work
dedication ………………………………………………………………….202
Table 2.9 Results for the three steps for the hierarchical multiple regression for work
absorption …………………………………………………………………204
Table 2.10 Results for the three steps for the hierarchical multiple regression for
depression………………………………………………………………….206
Table 2.11 Results for the three steps for the hierarchical multiple regression for
anxiety ……………………………………………………………………..208
Table 2.12 Results for the three steps for the hierarchical multiple regression for
stress ……………………………………………………………………….211

xx
Table 2.13 Results for the three steps for the hierarchical multiple regression for
emotional exhaustion ……………………………………………………...214
Table 2.14 Results for the three steps for the hierarchical multiple regression for
cynicism ……………………………………………………………...……217
Table 2.15 Results for the three steps for the hierarchical multiple regression for
professional efficacy ………………………………………………………219
Table 2.16 Summary of beta weights or the predictor variables for the hierarchical
multiple regressions..………………………………………………………223
Table 2.17 Results at Step 2, showing the significant interactions in the moderated
regression analyses……...…………………………………….……………227
Table 2.18 Simple slopes for the predictor variable (X1) and the criterion variable (Y)
at Low and High levels of the second moderating variable (X2).………….228
Table 2.19 Z scores for the indirect effects between humour and the outcomes,
through dispositional optimism and coping self-efficacy as the
mediators…………………………………………………………………...231
Table 3.1 Latent and observed variables used in confirmatory factor analyses
……………………………………………………………………………...272
Table 3.2 Factor Score weights for composite variables for the Well-Being model
…………………………………………………………………………………292
Table 3.3 Factor Score weights for composite variables for the Mental Distress
model ………………………………………………………………….…...295
Table 3.4 Factor Score weights for composite variables for the Well-Being – Mental
Health model……………………………………………………………….298
Table 3.5 Factor Score weights for composite variables for the Work Engagement
model……………………………………………………………………….303

xxi
Table 3.6 Factor score weights for the composite variables for the Integrated
model…………………………………………………………………….…309
Table 3.7 Improvement in the fit of models in the Well-Being model by including the
auto-lagged pathways from Time 1 to Time 3…………………………….311
Table 3.8 Results of longitudinal model testing for Well-Being Model…………..315
Table 3.9 Results of longitudinal model testing for Mental Distress Model ……..317
Table 3.10 Results of longitudinal model testing for Well-Being-Mental Health
models ………………………………………………………………….….320
Table 3.11 Results of longitudinal model testing for the Work Engagement model
……………………….……………………………………………………..322
Table 3.12 Results of longitudinal model testing for the Integrated model……….324
Table 3.13 Effect sizes of the standardized regression weights for the auto-lagged
and cross-lagged paths for all the longitudinal models ………….….332-333
Table 3.14 Squared Multiple Correlations for all models for Time 2 and Time 3
composite variables ……………………………………………………..…341

xxii
List of Figures
Figure 3.1 Simplified representation of the components used in SEM …………..262
Figure 3.2 Simplified representation of the confirmatory factor analyses………..271
Figure 3.3 Representation of the basic relationships to be tested in the longitudinal
analyses…………………………………………………………………….277
Figure 3.4 The best fitting model for the Well-Being model, E, the Trimmed
Reciprocal………………………………………………………………….315
Figure 3.5 The best fitting of Mental Distress model, E, the Trimmed Reciprocal
………………………………………………………………………….…..317
Figure 3.6 The best fitting of the Well-Being-Mental Health model, E, the Trimmed
Reciprocal ………………………………………………………………....320
Figure 3.7 The best fitting of the Work Engagement model, E, the Trimmed
Reciprocal …………………………………………………………………322
Figure 3.8 The best fitting of the Integrated models, E, the Trimmed Reciprocal
model…………………………………………………………………….....324
Figure 3.9 Weighting of the auto-lagged and cross-lagged paths in the Integrated
model.............................................................................................................339
Figure 4.1 Proposed cusp catastrophe for the relationship between work engagement
and burnout……………………………………………………………..….391

xxiii
List of Appendices
Appendix A: Call for volunteers from the university alumni ………………….….441
Appendix B: Call for volunteers from the public hospital …………………….…..442
Appendix C. Time 2 Call to action ………………………..…………….………...443
Appendix D: Time 3 Call to action ………………………………………………..444
Appendix E: Second and third reminder calls to action……………….…………..445
Appendix F: Measures for Study 1 and 2 ……………………………..…………..446
Appendix G: Simple slopes of moderated regression analyses…..….....………….453
Appendix H: Results of the early structural equation modelling ………………….456
Appendix I: Confirmatory Factor Analyses for the longitudinal models.…………468
Appendix J: Results of the longitudinal models…………………………….……..482
Appendix K: Terms and glossary for Study 2, Longitudinal modelling …….…….510

xxiv

1
Chapter 1: Theories and literature review of Bronfenbrenner‟s developmental
equation, applied to individuals and the work-life interface
The fullness of life is not just our working selves but also our non-work or
family selves. It is difficult to explain an individual‟s well-being and mental health
by only exploring the workplace factors that influence well-being and mental health,
without considering the individual‟s out-of-work responsibilities and activities,
whether any or all of these factors can have positive or negative influences, and
without considering the person engaged in all these roles. Yet much of the
organizational psychology literature has only recently included the positive effects of
work and without any particular focus on the „person‟ who is doing the work (Frone,
2003). Working adults are treated as a homogenous group of individuals, upon whom
workplace factors, such as working hours, have similar results. Where individual
differences are introduced, these are often limited to age, gender and negative affect
(for example, de Jonge et al., 2001). Whilst men and women are dissimilar in
obvious ways, such as the ability to bear children, gender is not the major difference
as this demarcation suggests (Barnett & Rivers, 2004). Similarly, using age reflects
chronological differences, but does not account for the current life stage of an
individual. For example, later childbearing in women could mean that comparing 40
year old women may not account for one having a teenage child, another a two year
old child, and another who has not had children. In the positive psychology literature,
whilst the characteristics and strengths of the individual are explored, individuals are
not studied in their usual context as working adults, or parents, or adult children
caring for aging parents.
In order to fully account for all influences on the working adult,
Bronfenbrenner‟s Bioecological Model of human development will form the

2
framework of this thesis. This theoretical perspective will allow person-environment
interactions (proximal and distal) to be implicitly explored, across the lifespan and at
different lifestages, and with the multiple roles of work and family. Whilst
Bronfenbrenner‟s model was originally formulated to account for child development
(Bronfenbrenner, 1979; Bronfenbrenner & Morris, 1998) and applied to successfully
understand the processes of child development (Steinberg, Darling, Fletcher, Brown,
& Dornbusch, 1995), it has also been applied to adult development. The ecological
framework adds to the explanatory power for the work-life interface, by including
more breadth to the factors to be considered as important to the work-life interface
(Barnett, 1998; Grzywacz & Marks, 2000b). There is a similarity of
Bronfenbrenner‟s model to Bandura‟s social learning and behaviour (Bandura,
1986), although Bronfenbrenner has broader outcomes about lifelong development,
rather than being focused on learning outcomes.
This chapter will start with an outline of Bronfenbrenner‟s bioecological
model, and his conceptualisation of the model‟s components. The components of the
person, their context and time frame will then be examined, examining the relevant
theoretical bases and research literature for the component that will be used to
understand how competent development would occur over time. For example, when
considering the person, self-regulation can explain how individual differences lead to
higher well-being and mental health. Similarly, when considering the context in
which the person is active, role theory can explain how spillover, gender role
attitudes, and role salience influence an individual‟s enactment of their life‟s roles.
1.1 Bronfenbrenner’s Bioecological Model of Human Development
Bronfenbrenner‟s bioecological systems theory states that competent
development is the outcome of the bidirectional interactions between an active

3
individual and a dynamic environment. As it began with understanding child
development, it was framed in terms appropriate for the settings in which a child
develops (Bronfenbrenner, 1979), the principles and hypotheses that Bronfenbrenner
gave can be equally applied to adult development in the work and family settings of
adult life, as shown in research by Barnett (1998) and Grzywacz and colleagues
(Grzywacz & Bass, 2003; Grzywacz & Marks, 2000b). The formulations of
organizational stress (Kahn, Wolfe, Quinn, Snoek, & Rosenthal, 1964) and social
cognitive theories (Bandura, 1986) have similar bases to Bronfenbrenner. Both
theories include the characteristics of the individual and their environment when
considering how the relevant outcomes are achieved, as the response to stress or
learning outcomes, respectively. The bioecological model accounts for each setting
within which the individual acts and the dynamic relationships between the settings
(Bronfenbrenner & Morris, 1998, 2006).
For the purposes of this thesis, the effective and competent development in
Bronfenbrenner‟s model is viewed as the outcomes of maximising gains and
minimising the loses that occur throughout the life span and the resilience of
maintaining functioning in the face of challenge (P.B. Baltes, Lindberger, &
Staudinger, 1998; Bronfenbrenner, 1979; Masten, 2001). The best outcomes of
competent development and highest levels of psychological functioning over time
lead to mature adults as healthy and fit, with an alert and vital mind, maintaining
meaningful roles, either in a continuing vocation or in new activities, maintaining
relationships with family and friends and involvement with the community, and
finally, to be effective and wise problem-solvers (Csikszentmihalyi & Rathunde,
1998). Given the diversity of these outcomes, effective and competent development
will be measured in this thesis in a number of ways that reflect the long term balance

4
of gains and losses and maintenance of positive functioning, being measured as well-
being, mental health (or the absence of mental illness), burnout, and work
engagement. Well-being and work engagement fit together as the positive markers of
competent development, whilst mental illness and burnout fit together as the negative
markers. Well-being will be measured as both subjective well-being (Diener, Lucas,
& Oishi, 2002; Diener, Suh, Lucas, & Smith, 1999) and psychological well-being
(Ryff, 1989; Ryff & Keyes, 1995). Mental health will be taken as the absence of
depression, anxiety, and stress (Beck, 2002; P. F. Lovibond & S. H. Lovibond,
1995). Burnout will be measured as exhaustion, cynicism and the loss of professional
efficacy (Maslach, Schaufeli, & Leiter, 2001) and work engagement will be
measured with the dimensions of vigour, dedication and absorption (Gonzalez-Roma,
Schaufeli, Bakker, & Lloret, 2006; Schaufeli, Salanova, Gonzalez-Roma, & Bakker,
2002). By considering a broad range of outcomes, a better understanding of
competent outcomes can be achieved. It should be noted that the genetic component
of development is implied in this model and is understood to be expressed only as a
function of the individual‟s environment (Bronfenbrenner & Ceci, 1994). As such the
genetic component is beyond the scope of the current research project.
The first description of the ecological system focused on the context of
development in great depth, which allowed researchers to pinpoint the factors, both
proximal and distal, that are of importance to an individual‟s development. This
ecological environment was conceived as a set of concentric spheres, nested within
each other, similar to a set of Russian dolls (Bronfenbrenner, 1979). The individual
sits at the centre of their life domains, or spheres of influence which grow larger and
more distant from the individual. The closest is the microsystem, the immediate
settings in which the individual operates. Next is the mesosystem, where two

5
microsystems interact, then the exosystem of indirect influences, for instance of a
partner‟s job or government policy, followed by the macrosystem, as the influence of
society or culture, and finally, the chronosystem, which defines the particular point in
history (Bronfenbrenner, 1979; Bronfenbrenner & Morris, 1998). Each domain in
which the individual operates contain the specific roles, activities and relationships.
For example, the individual can operate as spouse or partner and/or parent in their
household setting (one microsystem), as an employee (a second microsystem),
balancing commitments to home and work (the mesosystem), as a citizen of
Australia (the macrosystem) in the early years of the 21st century (the chronosystem).
Whilst other individuals may have the same macrosystem (Australia) and same
chronosystem (current time frame), differing personal circumstances, such as divorce
or self-employment will change the experiences within the microsystems and how
those microsystems interact. These elements provide the experiences that the
individual has in the domain or microsystem and provide a way in which to capture
the development influences around the individual. By specifying the nature of each
element, a richer understanding of the dynamic processes between individual and
environment can be gained. Similarly, appreciating the changing nature of roles,
activities and relationships can reflect how different lifestages influence
developmental outcomes over time, as the individual masters new skills and
situations across the lifespan (Bronfenbrenner, 1979).
Most of the research on work-life issues focuses on the mesosystem of the
individual‟s work and home domains and the nature of the boundary and balance
between the demands and needs of the two microsystems (Barnett, 1998; Voydanoff,
2002).Whether the time and commitment required for participation in a role leads to
strain and conflict with other roles in other settings (Goode, 1960; Greenhaus &

6
Beutell, 1985) or enhancement and facilitation with the other roles (Frone, 2003;
Greenhaus & Powell, 2006; Marks, 1977; Marks & MacDermid, 1996) depends on
the dynamics of the individual interacting with the components of each setting.
When the expanded formulation of the bioecological model was published
in1998, Bronfenbrenner noted that this emphasis on context obscured a necessary
and essential component of the process, that of the individual (Bronfenbrenner &
Morris, 1998). The extension of the original model, now called the bioecological
model has the individual as an active participant engaged in bidirectional
relationships with a dynamic environment. The equation (1),
D ƒ PPCT (1)
conceptualises these relationships where the developmental outcome, D, is a function
ƒ of the interactions or proximal processes, P, between the person‟s characteristics,
P, and their context or environment, C, that occur with time, T. The characteristics of
the person are based on their disposition, gender and resources and their demand
characteristics.
The proximal processes that occur between the person and their environment
are considered to be the drivers of development and involve activities which occur
regularly and with increasing complexity. These activities are reciprocal exchanges
and interactions with people and symbols and can be moderated by the individual‟s
developmental capacity and the influence by significant others. Examples of
activities that increase in complexity over time are parenting, developing a career,
learning skills, problem solving and managing multiple roles. These processes are
those that an active, competent person would use in managing and adapting to the
maturation of roles and responsibilities are fundamental to competent development
(Bronfenbrenner & Morris, 1998). These bidirectional influences form a systems

7
approach to development where each level, whether it is genetic, neural, behavioural,
or environmental, is interconnected (Gottlieb, Wahlsten, & Lickliter, 1998). Each
part of the equation can operate at the micro-, meso- or macrosystem level in such a
way that the potential for development of the individual can be accounted for. For
example, time can be regarded in the microsystem by whether or not proximal
processes are continuous in the mesosystem by the periodicity of the proximal
processes and in the macrosystem by changes in the broader community
(Bronfenbrenner & Morris, 1998).
Specifically, proximal processes between the active individual and their
dynamic environment involve activities which occur regularly and with increasing
complexity over time. The processes that are involved in managing and adapting to
the maturation of roles and responsibilities are fundamental to competent
development and can be moderated by the individual‟s developmental state and the
influence by significant others (Bronfenbrenner, 1979; Bronfenbrenner & Morris,
1998, 2006). Some examples of the activities that increase in complexity over time
are parenting, developing a career, learning recreational or sporting skills, problem
solving, and managing multiple roles. Similarly, implicit in career development is
that the individual‟s job description becomes more complicated and involved over
time, such that early career jobs involve less responsibility and input than senior
positions that oversee many employees and require detailed knowledge of the many
facets of the relevant business situation or management goals. The active individual
therefore uses available skills and their personal and environmental resources to
successfully make the transitions from lower levels to higher levels of complexity
and ability in their lives. Proximal processes are therefore reliant on the individual‟s
characteristics and their particular situation in life and can be many and varied,

8
making the processes difficult to define. As such, the focus in the thesis will be
directly on the individual and their context. Rather than attempting to specify directly
which processes are involved or how exactly an interaction may occur between
individual characteristics and contextual factors, it is taken that these processes can
be implied from the influential personal and contextual factors. As such, proximal
process will be implied from the results of the research, rather than explicitly stated.
Understanding the individual, their family and their work and spillover
between roles will identify the factors that are most important to well-being at the
work-life interface. In the current research, explicitly using the ecological equation
will highlight the individual as an active participant of the system and in the
interactions between important life spheres. Positive person-environment interactions
contribute to competent and resourceful outcomes. In the face of adversity,
competence and the adaptive use of personal and environmental resources foster the
development of resilient children (Kumpfer, 1999; Yates & Masten, 2004).
Resilience can also be considered the actions of a competent person when facing
risky or adverse situations (Masten & Reed, 2002). Likewise, in adults the ability to
use personal and environmental resources facilitates well-being and role balance
(Barnett, 1998; Voydanoff, 2005b) and in families, it allows adjustment and
adaptation to strains caused by demands on the family unit (J. M. Patterson, 2002).
Negative person-environment interactions hinder well-being by increasing
dysfunctional behaviours, for example, when problem drinking is exacerbated by
increasing pressure from home and work (Grzywacz, 2000; Grzywacz & Marks,
2000a).
The purpose of the current research is to combine knowledge from diverse
strands of psychology, such as from the health and organizational domains and from

9
positive psychology, in a form that weighs the person and context components of the
work-life puzzle. By basing the research on Bronfenbrenner‟s bioecological model,
neither part can be overlooked. The research to be conducted in the current thesis
will use a variety of analyses to understand the competent individual. The first study
will involve regression analyses and the second study will involve longitudinal
modelling to explore and model the predictors of competent behaviour. This research
program will explore the working individual from different viewpoints: how
individuals understand themselves and how outcomes can be understood in a large
sample at one time and across time.
1.2 Theories for D, the developmental outcomes, defined by well-being,
mental health, burnout and work engagement
A range of outcomes will be used to describe competent development and to
reflect the diversity of outcomes used in the literature. The markers of competent and
successful individual development and management of multiple roles will be defined
as first, well-being, as life satisfaction and psychological well-being, second, mental
health (as the absence of depression, anxiety and stress) and third, as the affective
work state of burnout and it‟s recently quantified opposite engagement.
Bronfenbrenner describes competent outcomes as the result of the individual‟s
actions in each of the domains, or microsystems, in which they have roles, activities
and relationships (Bronfenbrenner, 1979).
1.2.1 Well-being
Well-being will be measured by subjective well-being, as life satisfaction
(Diener, Emmons, Larsen, & Griffin, 1985) and psychological well-being, as the
components described by Ryff (1989). Whilst subjective well-being has been factor
analysed into the three components of life satisfaction, positive affect and negative
10
affect (Arthaud-Day, Rode, Mooney, & Near, 2005), only life satisfaction will be
considered in this thesis as there is issue of whether affect should be treated as a state
or trait of the individual, which blurs the construct that is being measured and studied
(Wainwright & Calnan, 2002).
Psychological well-being is amongst the loosest and poorly defined terms
used for outcome measures in the research literature on personality, health and work-
life issues. It is used as an umbrella term rather than a specific construct and can be
taken as any positive outcome or the absence of negative outcomes. For example, in
a review of 25 studies on the benefits of optimism, Scheier, Carver and Bridges
(2002) reported „psychological well-being‟ had been measured as lower depression,
less anger, less loneliness, anxiety and distress, fewer perceived hassles, less negative
mood, and lower stress levels, in addition to higher life satisfaction, higher job
satisfaction, and higher self-esteem. Given that psychological well-being is central to
the conception of competent development in this thesis, it shall be defined only as
described by Ryff, (1989) as the six components that measure challenged thriving
and are based on ethical and philosophical traditions. These components are
autonomy, environmental mastery, personal growth, positive relations with others,
purpose in life, and self-acceptance (Ryff, 1989; Ryff & Keyes, 1995) and represent
the conception of the good life, full of meaning and worthwhile activities and
relationships.
By including both life satisfaction and psychological well-being in well-
being, this thesis brings together recent research that shows that these constructs are
separate and together add valuable information about the individual‟s mental state
(Ryan & Deci, 2001). Life satisfaction can be viewed as hedonia, as happiness and
pleasure in life, the „happy life‟, whilst psychological well-being, eudaimonia,

11
defines the purpose and markers of challenged thriving, the „good life‟ (Keyes,
Shmotkin, & Ryff, 2002).The combination brings together measurement of a happy
and meaningful life.
The theoretical explanations of well-being considers the influences of
objective conditions or the circumstances around the person (bottom-up), such as
age, gender, income, life domains and culture, and of subjective conditions, such as
the person‟s disposition/personality (top-down) to be the „cause‟ of the person‟s
well-being, along with adaptation and goals (Diener & Lucas, 2000; Diener et al.,
1999). Using an ecological framework, however, allows all of these theoretical
inputs to be acknowledged and accounted for, however limited the input may be.
Whilst the situation factors have limited influence on well-being, i.e. demographics
account for only 15% of variance (Argyle, 1999, in Diener & Lucas 2002), Easterlin
(2006) calculated that life satisfaction across the life span was the sum of satisfaction
with various life domains, such as work, family and financial, rather than due to
personality factors. However, given the high correlation between overall life
satisfaction and domain satisfactions, these calculations may reflect how these
relationships ebb and flow over time, rather than how domain satisfaction „causes‟
life satisfaction over time.
The subjective or top-down influences on well-being are more varied, with
the theories about personality explaining how well-being is achieved. Personality
influences are explained by temperament (hereditability of happiness) (Lykken &
Tellegen, 1996), traits (DeNeve & Cooper, 1998) and dispositions, such as optimism
(Armor & Taylor, 1998) and self-efficacy (Schwarzer & Renner, 2000). These
personality theories will be explored as part of discussions later in this chapter on
understanding the person who is occupying and managing multiple roles‟.

12
Adaptation to change and goals are also considered as precursors to well-
being. Adaptation to changing circumstances, such as widowhood or winning the
lottery, are evidence that there is a set point for well-being, that despite good or bad
fortune, an individual will return to previous levels of happiness after a period of
time (Fujita & Diener, 2005; Shmotkin, 2005). This hedonic treadmill can explain
the stability of well-being over time, although the expectation that an individual
inevitably returns to their original functioning, revisions take into account that whilst
individuals are mostly happy, they also have multiple set points for different domains
and there are individual differences in the way people react to similar situations
(Diener, Lucas, & Scollon, 2006). Goals can be seen as the way by which individuals
conceive their future, defining the direction and focus of all that individual‟s actions
(Emmons, 2003). Expectations about the outcomes of goals are also important in
how likely the individual is to persist toward their goals and whether the individual
will disengage from insoluble problems (Aspinwall, 2001; Carver & Scheier, 1998).
The adaptive value of persistence and disengagement will be explored further
through the effects of dispositional optimism on competent development.
1.2.1.1 Prevalence. Given the historical focus of psychology on pathology
(Seligman & Csikszentmihalyi, 2000) it may be surprising to consider that across
many studies in large populations, most people are happy most of the time. Although
many different scales can be used to measure well-being, the results are remarkably
consistent. By bringing together the results of almost 916 studies, with over 1 million
participants in total in 45 countries, Myers and Diener (1996) calculated that the
mean „happiness‟ rating, on a scale of 0 to 10, was 6.75, with most surveys reporting
ratings between 5.5 and 7.75, and very few surveys where people rated their
happiness at less than 5.

13
In Australia, the Australian Quality of Life Index has been calculated in a
large representative sample several times each year from 2001 onwards. The 18th
edition shows that within that time frame, the Personal Well-being Index (PWI) scale
has been remarkably stable in that time. The mean has ranged only between 73.4 and
76.4, on a scale of 0 to 100 that rates satisfaction with life as a whole. The authors
believe that this level of stability represents normal well-being (or homeostasis)
where people manage their lives successfully and are optimistic about the future
(Cummins, Woerner et al., 2007). The greatest PWI (i.e. PWI > 79) was associated
with high levels of income and the presence of a partner, whilst those with the lowest
PWI (i.e. PWI < 70), and most at risk of homeostatic failure are unemployed, have a
low income (under $15,000 pa) and live without a partner.
With regards to work status, not earning an income was particularly adverse
for the well-being of men between 26 and 55 years of age (Cummins et al., 2003;
Cummins, Woerner et al., 2007). Interestingly, whilst many people note that they
would like to reduce their working hours, this did not translate into greatly reduced
rating of their well-being. Rather it was insufficient work, not too much work, which
had the stronger, more detrimental effect on individual‟s PWI. Underemployment is
linked to lower incomes, a lower sense of achievement in life and boredom and
among men between 35 and 55 years of age (Cummins, Woerner et al., 2007). In
addition, looking for a job, whether employed or unemployed, reduced satisfaction
with life‟s achievements whilst being engaged in work gave a sense of purpose to life
and was central to overall well-being (Cummins, Woerner et al., 2007). The specific
predictors of well-being, measured as life satisfaction and psychological well-being,
will be considered in the later sections of this chapter when the effects of the person
and the context are considered.

14
1.2.1.2 Stability of well-being. Given the focus of research on over-work as a
stressor, this finding that lack of work reduced quality of life should make easy
acceptance of the „work-life imbalance‟ mantra less likely. Has feeling busy been
transformed into being pressured? By interpreting emotional distress as a possible
loss of efficacy, the individual could be underestimating how well they do actually
manage their role demands (Llorens, Schaufeli, Bakker, & Salanova, 2007),
unrealistically comparing themselves to an ideal worker/parent ideal, or not
questioning the media representations of „having it all‟. Despite the widespread
media preoccupation with negative outcomes, the stability of well-being is important
as it denotes a substantial level of happiness that buffers individuals without their
being particularly aware of that happiness. Longitudinal studies show that mature
coping mechanisms, good relationships, particularly marriage, having sufficient
income to meet one‟s needs and having meaningful work all contribute to well-being
across the lifespan (Howard, 1992; Vaillant, 2000, 2002). Well-being is reduced by
excessive alcohol use, maladaptive coping mechanisms (Vaillant, 2000, 2002) and by
materialism, which is associated with reduced relationship and family satisfaction
(Nickerson, Schwartz, Diener, & Kahneman, 2003; Solberg, Diener, & Robinson,
2004). Similarly, a focus on extrinsic goals was associated with more narcissism and
depression than the pursuit of intrinsic goals (Kasser & Ryan, 1996).
1.2.1.3 Australian health and working provisions. There are two important
caveats, particularly in comparison to the USA that must be taken into account when
studying the well-being and mental health of Australian workers. Socioeconomic
status (which includes job status) has been associated with poorer health and well-
being outcomes in the USA because of the link between the provision of health care
and employment (for example, Adler et al., 1994). However in Australia, every
15
person, regardless of employment status or income has access to government funded
heath care with access to general practioners and public hospital services at little or
no cost. Similarly, Australian Federal Government regulations (available at
www.workplace.gov.au) include provision of sick leave and minimum four weeks‟
holidays in employment contracts to provide a safety net for employees. These
provisions mean that Australian employees have medical advantages that are not tied
to any employment and employment conditions that may not be available to US
employees. These Australian conditions could therefore limit the importance of SES
as a predictor of health and well-being outcomes.
1.2.2 Mental health, as the absence of mental illnesses
This thesis will focus on the cognitive models of mental health rather than
any biological basis. Whilst a link between genetic factors and environment has been
shown in a longitudinal study of Australian teachers, depression was more strongly
linked to multiple adverse life events, rather than susceptible genetic subtype
(Wilhelm et al., 2006). As noted previously, the link between genetics and
environment is beyond the scope of this thesis, although this may provide an
interesting avenue for future research. Further, the focus of the current thesis is on
the individual difference, work and family variables (to be defined and described
later in this chapter) that are risk and protective factors for mental illness, rather than
a wider range of variables that have been examined in previous research.
The cognitive model of depression (Beck, 2002) has been remarkably
successful in explaining the underlying processes involved in depression and many
other mental disorders, such as anxiety disorders, panic disorders, and personality
disorders and their successful treatment (Beck, 1991). The maladaptive schemas that
the individual use to process the positive and negative events around lead to

16
dysfunctional cognitive styles, which in turn lead to a specific vulnerability to
developing depression (Alloy et al., 2000). Alongside the schemas that give rise to
cognitive vulnerability, behavioural and verbal interactions with other people can
reinforce and intensify depression which can lessen the social support available to
individuals. These individuals not only believe that they have poorer social skills, but
also exhibit behaviours, such as a monotonous tone of voice and avoiding eye
contact, that provoke negative responses in other people (Segrin & Abramson, 1994).
Excessively seeking reassurance from family and friends can hamper interpersonal
relationships, as does the tendency to seek negative feedback about oneself.
Vacillating between seeking reassurance and seeking negative feedback leads to
rejection from peers (Joiner & Metalsky, 1995) and excessive reassurance seeking
has been specifically linked to depressive symptoms (Burns, Brown, Plant, Sachs-
Ericcson, & Joiner, 2006).
The role of cognition in mental health is formalised by Beck‟s cognitive
models of depression. Seen as the way in which individuals process information
about themselves, their world and their future, negativity is shown by selective
abstraction, overgeneralization, dichotomous categorisation and personalization of
the problems that occur to the individual and resulting in distorted and depressive
cognitions (Beck, 2002). This altered thinking changes the way that individual‟s
view the world, resulting in sensitivity to negative or ambiguous cues (Wilkinson &
Blackburn, 1981), differences in depressed and non-depressed thinking (Alloy et al.,
1999) and differences in interpersonal relationships (Joiner & Metalsky, 1995).
There can also be changes in cognitions that are rational or irrational and changing
such cognitive patterns requires challenging the irrational thoughts to find more
logical and reasonable rational replacements (Ellis, 2004). Beck‟s cognitive models
17
of depression include the schemas that underpin automatic thoughts and are a
personal encyclopaedia of themselves and the world around the individual. Schemas
are shaped by the life stage when they are formed, vary functionally with the
situation, can be pervasive and a core feature of the individual (James & Blackburn,
2004). Schemas can give rise to a cognitive bias, both negative (Beck, 2002) and
positive (Cummins & Nistico, 2002), with the positive bias having the greater benefit
for mental health and well-being. The interpersonal causes of depression will be
discussed in the section on social support, as these involve the dysfunctional
interactions between the individual and people in their environment. The success of
cognitive therapy to change thinking patterns and depressive symptoms has been
shown with many years of successful therapeutic outcomes and these outcomes also
include problems with anxiety states, eating disorders, and marital problems (Beck,
2004; Hawton, Salkovskis, Kirk, & Clark, 2000; Kwon & Oei, 2003).
The theoretical understanding of stressors (precipitating events) and stress
(reactions) follow from the early research by Selye on the General Adaptation
Syndrome (Selye, 1976), which emphasized the individual‟s physiological response
to threatening events, with the process following from alarm to resistance and finally
to exhaustion, where further stress would lead to health problems. However,
inconsistent definitions and assumptions did not advance the understanding of stress.
Common to all and basic to the stress process is the interaction between the
individual and their environment and subsequent appraisals and actions, although the
emphasis may differ between the individual or the context (Wainwright & Calnan,
2002). From the individual‟s perspective, role theory (Goode, 1960; Kahn et al.,
1964), conservation of resources (Hobfoll, 2002) and coping with stress (Lazarus,
1993) are focused on the roles, resources and emotions, respectively, of the

18
individual, their characteristics and resources and how they navigate stressful
situations and relationships. The environmental factors, however, are explained
through the Demand-Control-Support (DCS) model (Karasek & Theorell, 1990),
where strain and poor health results from high work demands, limited workplace
control and low social support from co-workers. The difference in focus however
does not obscure the outcomes of mental health problems and poor health that arise
from not meeting environmental demands. The cognitive model, as applied to mood
and anxiety disorders has also been applied to stress and the prevention of stress,
with the focus on how schemas influence each individual‟s appraisal. Importantly,
the processes of appraisal and responses that follow from stress in the cognitive
model remain similar to other theories (Pretzer, Beck, & Newman, 2002).
Further to the analyses of subjective and psychological well-being, Keyes
(2002, 2005) has also shown that the absence of mental health is not the opposite of
well-being and is better considered as a separate factor. Whilst well-being, as
measured by the Australian Quality of Life surveys and as summarized by Meyer and
Diener (1996) is stable over time and among many people, mental health problems
are of significant concern to the community. In this thesis, mental health problems or
more precisely mental illness, will be considered as depression, anxiety and stress, as
more serious mental illnesses are beyond the scope of this research and are less likely
to be prevalent in the population of interest, that of working adults.
1.2.2.1 Costs and prevalence. The World Health Organization estimates that
10% of adults will have mental health problems at any given time, with individuals
having a 25% chance of developing mental health problems in their lifetime (World
Health Organization, 2001), which represents a substantial burden on the health
services of many countries (Reijneveld, 2005). In the Australian National Mental

19
Health Survey, 15.5% of the population met the DSM-IV criteria for affective,
anxiety and substance use disorders, although only 35% of individuals reporting a
mental disorder sought assistance for their problems, with general practitioners
providing most mental health services (Andrews, Henderson, & Hall, 2001).
Unfortunately, if depression, for example, is not treated, it can reoccur and become a
chronic disability over time. As a result, these individuals have a lower level of
overall health compared to individuals with chronic diseases, such as asthma or
diabetes. Where depression and a chronic disease are comorbid, the overall health for
that person is worse than having a chronic disease alone or depression alone (World
Health Organization, 2007).
In a review of the costs of mental health problems in Europe, McDaid, Curran
and Knapp (2005) reported that in Sweden, 27% of long-term sick leave is due to
mental health problems, whilst it was estimated that 0.5% of Dutch GDP was lost by
employees retiring early or becoming disabled, due to mental health problems. The
costs of mental health problems come from the direct costs of treatment, the indirect
economic costs from increased mortality, and the indirect economic burden that is
due to the loss in productivity (Wang & Kessler, 2006). Economic losses in
productivity are the greatest of these costs although there are differing calculations as
the full extent of the losses, whether only lost productivity was considered or both
paid and unpaid work was included (Luppa, Heinrich, Angermeyer, Konig, &
Riedel-Heller, 2007). In a population-based sample in South Australia, data from the
Health Omnibus Survey found 7% of South Australians had major depression and
11% had dysthymia, minor depression or partial remission from depression. The
Survey also calculated that of the $1921 million/year spent on health costs in total,
$1506 million (78%) could be attributed to lost productivity due to lost days at work

20
(absenteeism) or days of reduced work effort (presenteeism) (Hawthorne, Cheok,
Goldney, & Fisher, 2003). In the U.S.A., Kessler and Frank (1997) calculated that
the days that workers did not go to work due to an affective disorder (i.e.
absenteeism) was increased by co-morbidity with another affective, anxiety or
substance use disorder, rising from 4 million days lost per year to 15 million work
days lost per year. Where work impairment as considered, the days where work was
limited (i.e. presenteeism) rose from 20 million to 110 million days per year. When
physical health was added to mental health in the Midlife in the US (MIDUS) study,
the results showed that completely unhealthy individuals put less effort into their
work, were eight times more likely to have cutbacks on work days and six times
more likely to miss work days (Keyes & Grzywacz, 2005).
When Generalized Anxiety Disorders (GAD) were considered in conjunction
with Major Depressive Disorders (MDD) in two population-based studies in the
U.S., the MIDUS and the National Comorbidity Study, individuals showed similar
levels of impairment to social and work roles when suffering either disorder. There
was considerable overlap between the disorders, with many individuals with GAD
also having MDD and a large minority of individuals with MDD also having GAD.
Where individuals had comorbid disorders, the impairment, particularly to work
roles, experienced by the individuals substantially increased (Kessler, DuPont,
Berglund, & Wittchen, 1999). Depression was found to be more likely among
women, among individuals who are less educated, unemployed, have low incomes,
have poor health or are separated or divorced (Andrews et al., 2001; Hawthorne et
al., 2003). As the economy is increasingly reliant on the individual‟s mental output,
as the „knowledge economy‟, the losses from being physically absent, mentally
absent, or in poor health represent substantial costs to all levels of society, from the

21
individual, their families, their employers and to the wider community (de Vries &
Wilkerson, 2003). The loss of work to provide structure and identity for an individual
is seen in the higher levels of mental health problems among unemployed people
(Hawthorne et al., 2003).
Similarly, for individuals at work, the satisfaction they feel about their jobs is
linked to mental and physical health outcomes and follow similar trends of the
outcomes shown here. In a meta-analysis of 500 studies published after 1970,
Faragher, Cass and Cooper (2005) found the strongest relationships, measured as the
corrected combined correlations (similar in meaning to effect sizes), were between
job satisfaction and negatively, burnout (ř =.46), depression (ř = .41) and anxiety (ř =
.38) and positively, self-esteem (ř = .44). The lowest relationships were between job
satisfaction and cardiovascular disease (ř = .16) and musculoskeletal disorders (ř =
.08) (Faragher et al., 2005). Given the time and importance of role of work in the
individual‟s life, many hours spent each day in a role that is dissatisfactory can be
expected to have psychological consequences, which the meta-analysis shows has
occurred (Faragher et al., 2005). Conversely, where there is greater job satisfaction,
the individual is more likely to have better self-esteem and better mental health, as
they have less depression, anxiety and less burnout. The effect of the combination of
mental illnesses, as depression, anxiety and stress, reduces both productivity and
satisfaction with work, which would reinforce the negative outcomes. From these
studies, understanding the work-life conditions and individual characteristics that
most predict mental illnesses will assist in reducing the impact of mental illness on
the individual‟s effectiveness at work, therefore offering avenues to reduce those
losses and minimise the negative effects on productivity.
22
1.2.3 Burnout and work engagement
The construct of burnout and the related construct of work engagement will
also be included in the measurement of competent development in this thesis. Whilst
similar to stress, these constructs are regarded as the consequence of working
conditions, which in turn influence the individual‟s motivational-affective response
to their job, rather than a physiological or distress reaction implied by the stress
response. Burnout is multidimensional, characterised by emotional exhaustion,
cynicism, and the loss of professional efficacy (Maslach et al., 2001), whilst work
engagement is characterised by absorption, dedication and vigorous involvement
with one‟s job (Schaufeli et al., 2002). Interestingly, burnout and engagement are
used as the outcome measure more often by European researchers, whereas stress is
favoured by US and English researchers.
Whilst there are similarities, burnout is differentiated from stress by the
emphasis on interpersonal relations in the workplace as the basis for the development
of burnout (Maslach et al., 2001) whereas stress is more often framed as the response
to role stressors (Beehr & Glazer, 2005) or challenges to resources (Hobfoll, 1989).
Burnout also reflects the negative response an individual has to their job and the
disengagement from that job as opposed to the distress that the individual
experiences (Maslach et al., 2001). The balance between the demands and resources
in a job are seen as crucial to the development of burnout. This is theoretically
explained by the Job Demand-Resources (JD-R) model (Bakker, Demerouti, &
Verbeke, 2004; Bakker & Geurts, 2004), using the conception of resources as
defined by Hobfall‟s conservation of resources theory (Hobfoll, 1989). The Job
Demand-Resources model has broader definitions of the work conditions considered
as both demands and resources than the Demand-Control-Support model (Karasek &
23
Theorell, 1990), whilst leading to similar outcomes of burnout and poorer work
performance. As the relationship between job demands and resources underpins
burnout, there is a link to the concept of flow, which is an optimal or desired
experience arising from immersion in a task, lying between distress and boredom.
Challenges that are well in excess of the individual‟s skills and resources lead to
distress, whilst challenges that are considerably less than available resources lead to
boredom. Flow emerges from the happy medium, where challenges and skills are
well matched (Csikszentmihalyi, 2002). Flow shares similarities with work
engagement, although flow is regarded as a focused or creative state whereas
engagement is a general affective state around one‟s work.
The study of burnout began as the study of emotions in the workplace, with
interviews with human service workers identifying that intense involvement in the
problems and lives of other people lead helping professionals to exhibit emotional
exhaustion, cynicism and the loss of a sense of personal accomplishment. The
emotional exhaustion came from demanding workloads and conflict in relationships
at work, whilst the cynicism or depersonalization allowed distance and detachment to
cope with the intensity of emotional arousal from the work, and accompanied by a
loss of confidence in how well one is performing at work (Maslach, 1998; Maslach
& Jackson, 1981; Schaufeli & Buunk, 1996). At the centre of burnout is the
constancy of dealing intensely with another person‟s problems, where causes are
ambiguous or conflicted, solutions are difficult to achieve and the process is often
frustrated by lack of resources or long standing inequalities (Maslach & Jackson,
1981). Professionals can feel that there is little they can do to change the outcomes
for their clients, that the problems stay the same although the actual client with the
problem may change and that they lack support from their supervisors.

24
In contrast to research on stress and the individual‟s response to stressors,
burnout occurs in a workplace social context (Maslach, 1998) and occurs more
frequently or contagiously in work teams that already experience burnout. For
example, among Dutch police officers, when burnout was measured collectively at
the team level, individual members of that team were much more likely to have
burnout, indicating that the attitudes of one‟s co-workers can provide a barometer of
organization commitment and personal enthusiasm. Interestingly, in the same
population of police officers, work engagement in teams was similarly boosted by
individual work engagement (Bakker, van Emmerik, & Euwema, 2006).
Maslach and colleagues proposed that burnout came from a mismatch
between the person and their job and was increased by work overload (as jobs have
increasing intensity, take more time and become more complex); by lack of
appropriate control over work tasks and resources; by insufficient rewards both in
monetary terms and as recognition of effort; by the breakdown of community and
loss of support of managers and co-workers; by the absence of fairness in
organizational practices; and by a conflict in values between the individual and the
organization (Maslach & Leiter, 1997; Maslach et al., 2001). There is support for
these proposed factors. For example, increasing workload, job insecurity and the
problems associated with a hospital restructuring significantly increased the
exhaustion and cynicism in hospital workers, whilst personal resources such as self-
efficacy bolstered professional efficacy and buffered the individual against
exhaustion and cynicism (Greenglass & Burke, 2002). Among teachers and bank
workers, where employees had more work that they could complete, these greater
workloads increased emotional exhaustion whilst social support from co-workers
reduced the exhaustion they felt. Social support also reduced the likelihood that

25
employees wanted to leave their current employment (Houkes, Janssen, De Jonge, &
Nijhuis, 2001). In addition, being able to control work schedules to fit with family
responsibilities mediated between hours worked and burnout among married doctors
(Barnett, Gareis, & Brennan, 1999).
Expanding the burnout construct in recent years to work engagement reflects
how psychology is turning its attention to positive states, as shown by the influence
of positive psychology challenging the focus on mental illness and exploring well-
being and positive attributes (Seligman & Csikszentmihalyi, 2000). Recently,
research has begun to explore the affect and motivation of employees before burnout
develops with a continuum between fully engaged workers to those with burnout. By
framing burnout as the disengagement from previously meaningful and important
work, work engagement can be seen as the opposite of burnout. Vigour or energy is
considered opposite to exhaustion, dedication is opposite to cynicism, and absorption
is opposite to the loss of professional efficacy (Maslach et al., 2001). Engagement is
therefore the state of mind where work is seen as interesting, fulfilling and
worthwhile and where the individual is prepared to invest time and energy in their
job and separate from burnout (Bakker et al., 2006; Schaufeli et al., 2002). Work
engagement also represents an individual who is full of energy, fully involved in
their work and confident of their professional capabilities (Maslach et al., 2001).
The continuum has also been conceived to describe the phased development
of burnout, with the progressive onset of exhaustion then cynicism and finally the
loss of professional efficacy (Golembiewski, Boudreau, Munzenrider, & Luo, 1996).
However, recent European research has taken the view that work engagement is a
separate, although close related construct. Using the Maslach Burnout Inventory
(MBI, Maslach, Jackson, & Leiter, 1996) as a base, the Utrecht Work Engagement
26
Scale (UWES, Schaufeli et al., 2002) was developed with the components of work
vigour, work dedication and work absorption. Whilst subsequent research has shown
that the UWES and the MBI are separate and highly correlated in teachers (Hakanen,
Bakker, & Schaufeli, 2006), company managers and executives (Schaufeli, Taris, &
van Rhenen, 2008) and in hospitality workers (Pienaar & Willemse, 2007), it should
be noted that in the original study (Schaufeli et al., 2002), the fit indices of the
measurement models were only just acceptable (Browne & Cudeck, 1993). Indeed,
the best fitting model showed that Burnout was better as only exhaustion and
cynicism, with Work Engagement comprising work vigour, work dedication, work
absorption and professional efficacy. Closer examination of the other factorial
analyses of Burnout and Work Engagement showed similar results among Dutch
executives and employees (Schaufeli & Bakker, 2004; Schaufeli et al., 2008). It is
necessary to further explore the factorial structure of the burnout-work engagement
to establish whether one or two factors better describes the construct. The research to
date on engagement, alone and in relation to burnout, is not extensive and further
studies, including this thesis, are necessary to confirm these relationships.
1.2.4 Bringing together well-being, mental health, burnout and engagement
There is limited research that considers the similarities and differences of
well-being and mental health (as the absence of mental illness) (Keyes, 2002, 2005;
Ryan & Deci, 2001). As noted previously, work engagement as used in this thesis,
arose out of the research on burnout, so these constructs are reasonably understood as
opposite ends of a continuum that lies between high energy and identification
(engagement) and low energy and identification (burnout) for one‟s job. The
theoretical understanding of how the latent structures of well-being and mental
health/illness are related has been explored in the research of Keyes (2002, 2005).

27
Testing of the latent relationships found that well-being and mental health/illness
formed two separate but strongly related factors, as shown by better fit of the oblique
(related axes), rather than the orthogonal (unrelated axes) rotation of the factors in
the model (Keyes, 2005). Therefore, rather than the dichotomy of mentally healthy or
mentally ill, Keyes categorised individuals as flourishing, moderately mentally
healthy, languishing or having pure depression. Flourishing individuals have high
well-being (top third on well-being scales) and low mental illness; the moderately
mentally healthy fell in the middle third of the well-being scales; and the languishing
have low well-being (bottom third of well-being scales, yet without symptoms of
mental illness). Individuals could be further categorized as having a mental illness,
as pure depression, or in combination with low well-being, as depressed and
languishing (Keyes, 2002).
Within the stress literature, there is an acknowledgement that the stress
reaction is not necessarily negative, as shown by Selye‟s (1976) conception of
eustress and the Yerkes Dodson law (Le Fevre, Matheny, & Kolt, 2003). It is the
individual‟s appraisal or the stressor that makes it distressing or an exciting
challenge; as such, adaptive coping represents a positive response to stressors
(Folkman & Moskowitz, 2004). In addition, considering the likelihood and
consequences of future events allows an individual to be proactive about their goals
and well-being and applies coping to a future context, rather than being seen as on a
reactive skill (Aspinwall, 2005; Schwarzer & Taubert, 2002). As noted previously,
the process of a stressful situation links the event, the appraisal, the response and
outcome. Rather than seeing only negative response of distress and negative
outcomes on health and work performance, a balanced model of stress would include
positive reactions (for example, engagement and positive affect), known as „eustress‟

28
(Selye, 1976), so that the benefits of managing and overcoming difficult or
challenging situations can be acknowledged and build the individual‟s resources for
the future (Simmons & Nelson, 2001). Therefore, competent development that gives
the individual the skills and resources to manage and adapt to their environment,
respond in an appropriate and functional way to the situations and events that occur
in their lives will result in higher levels of well-being and mental health. Given the
prevalence of mental health problems (World Health Organization, 2001), it is
important to understand how well-being and mental health/illness, the person and
their environment interact and further, that interaction in the context of working
adults.
The developmental outcomes to be considered in the current thesis include
both positive and negative functioning, so that all the experiences of the individual
can be better understood. Acknowledging that life is neither all good nor all difficult
situations can bring together the relative balance that individuals find in their lives.
From the Personal Well-Being Index and other studies, this balance is often
positively skewed, with most people indicating that they are mostly happy. Happy
people have more positive self-reflection, less negative social comparison and
expressed less regret when their decisions do not turn as well as they expected
(Abbe, Tkack, & Lyubormirsky, 2003). They also respond and interpret negative
events with more positive strategies, reinforcing their beneficial affective responses
to the situations (Lyubormirsky & Tucker, 1998) and becoming better problem
solvers (Thoits, 1994). However, the consequences for individuals who have mental
health problems extend to their work and family relationships, leading to less
satisfaction in all domains. This thesis brings together the research outcomes often
used in the U.S.A., as well-being (life and job satisfaction and psychological well-

29
being) and mental health (the absence of depression, anxiety and stress) with
outcomes most often used in European research, burnout and work engagement. In
this way, understanding of the work-life interface can be expanded, as can the
relationships between these outcomes, which are less well researched. Keyes (Keyes,
2002, 2005) has analysed well-being and mental health, finding that these are related
by separate factors, whilst Schaufeli and colleagues (for example, Bakker et al.,
2006; Schaufeli et al., 2002) have explored burnout and work engagement, as
separate factors. As such, this thesis will bring together these outcomes in a way that
has not been reported previously in the literature.
1.3 Understanding the person, P, in the developmental equation
1.3.1 Generative dispositions and demand characteristics
The active participant, P, in the bioecological model is defined by
characteristics that assist and lead to the proximal processes occurring. These
characteristics are a generative disposition, physical and intellectual resources and
the individual‟s demand characteristics. The generative disposition is defined by the
individual‟s selective responsiveness to the social and physical environment, how the
individual engages and persists with complex tasks, and their belief systems such as
self-efficacy and locus of control that direct their behaviour, and which contribute to
the individual‟s ability to undertake more complex tasks over time. The individual‟s
physical and intellectual resources develop across the lifespan and can foster
development or place limits on how well an individual is equipped to deal with a fast
paced and rapidly changing world. Lastly, the demand characteristics show how the
individual relates to other people and whether the interpersonal relationships are
positive or negative (Bronfenbrenner & Morris, 1998, 2006). As noted previously,
dysfunctional relationship styles are found with depression and can lead to the

30
individual being rejected by their peers (Joiner & Metalsky, 1995). The current thesis
will define the active participant by first, their generative disposition and second, by
their demand characteristics.
1.3.2 Theories of the generative disposition of P, the person occupying and
managing multiple roles
Self-regulation is the basis of the how the generative disposition of the active
individual will be defined in this thesis, with the main driver of self-regulation taken
as dispositional optimism which is the generalized expectations for good future
outcomes (Carver & Scheier, 1998; Scheier, Carver, & Bridges, 1994). Rather than a
fixed response to all situations, adaptive self-regulation by competent individuals is
more flexible in the way that they approach the world, being both active and
selective about their environment. In a longitudinal study of children‟s temperament,
feedback from one‟s actions provided continuity of behavioural responses, with the
accumulation of consequences building the subsequent life path. Shy children
become shy adults, whilst angry children grew into angry adults (1989). The growing
and developing person represents a self-organizing system, which adapts and selects
the best available options across time that will allow desired goals to be achieved
(Csikszentmihalyi & Rathunde, 1998). As the future is unknown, being able to adapt
to uncertainties and make decisions without complete knowledge of all eventualities
can allow the individual be to happier with their choices and not regret their
decisions (Abbe et al., 2003).
Personality psychology has many ways to describe and analyse the
individual, all of which contribute to the understanding of how the individual‟s
characteristics can be stable and yet change over time (Carver & Scheier, 2000). This
thesis will primarily use the self-regulation view of personality (Carver & Scheier,
31
1998) to define the generative disposition, as self-regulation links with
Bronfenbrenner‟s conception of the active participant selectively responding to the
situations in their life and provides a way of capturing the dynamic nature of
navigating everyday life, between competing goals and roles. Whilst the Big Five has
been developed from a lexical approach to describe traits (John & Srivastava, 1999),
meta-analysis of the „happy personality‟ found that extraversion was too broad in its
conception to have a strong correlation to subjective well-being (DeNeve & Cooper,
1998). Similarly, whilst there is a relationship between the Big Five and Ryff‟s
construct of psychological well-being (Schmutte & Ryff, 1997), these are broad
groupings of relationships rather than specific points. For example, extraversion and
neuroticism are strongly predictive of the psychological well-being components, self-
acceptance and environmental mastery. However, the broad definitions of
extraversion and neuroticism do not allow specification of which particular facet of
the traits that is most relevant to achieving self-acceptance or environmental mastery
(Schmutte & Ryff, 1997). Ego-resiliency comes from the neoanalytic perspective and
focuses on how the individual adapts to external forces (Block & Kremen, 1996).
However, for the purposes of this thesis, the constructs are either too broad or too
narrow in their measurements to cover the actions of the active participant.
The self-regulation of behaviour proposes that an individual‟s behaviour is
guided by their goals, whether these are goals that being pursued or avoided. The
individual adjusts their behaviour based on feedback loops which assess their rate of
progress and the continued likelihood of success. The primary driver of this goal
directed behaviour is seen as dispositional optimism, which captures the individual‟s
beliefs and expectations about the future as positive and successful and goals as
achievable (Scheier & Carver, 1992). Self-regulation also fits with Bronfenbrenner‟s

32
conception of the active person, as the processes of goal directed behaviour are
similar to the actions of the generative disposition to be selectively responsive to the
environment and having attractive demand characteristics. Optimistic people have
been shown to persist longer at solvable puzzles, break off from unsolvable puzzles
more rapidly, are pleasant people to deal with and have better relationships with
other people (Armor & Taylor, 1998; Aspinwall & Brunhart, 2000).
In addition to the self-regulation model, the resources of the individual will
also include self-efficacy as the mastery component from Bandura‟s Social Cognitive
Theory, where behaviour is guided by the individual‟s expectancies and the
incentives that accrue when behaviours are performed (Bandura, 1986). Self-efficacy
is an important part of the expectancies of this model and emphasizes the
individual‟s agency toward desired outcomes (Bandura, 1997, 2001). The situation-
specific self-efficacy originally proposed by Bandura (1997) has been widened to
include coping self-efficacy (Chesney, Chambers, Taylor, Johnson, & Folkman,
2003) and general self-efficacy (Scholz, Gutierrez, Sud, & Schwarzer, 2002),
reflecting the usefulness of self-efficacy as a resource for the individual. Self-
efficacy has also been applied to understanding the adoption of health behaviours,
with this health behaviour model known as the Health Action Process model
(Schwarzer, 1992). Self-efficacy expectancies are used in combination with outcome
expectancies (similar to dispositional optimism) to influence the individual‟s
intention and action toward healthy behaviours. Individuals with greater self-efficacy
and outcome expectancies have an increased likelihood of maintaining and
implementing healthy behaviours (Schwarzer, 1992).
Self-regulation extends the health action process model as it takes the
outcome to a wider field, where the latter has health as the outcome, the former can
33
be applied to all life domains. It also acknowledges the dynamic and changeable
nature of life‟s goals. The general direction of life (to live a good life/to be successful
at work and at home) needs to be monitored with many sub-goals shifting in
importance depending on the season (in summer, allocate time to watering the
garden), career status (new job requires extra attention), and family stage (young
children need time). Each individual has their own set of circumstances and their
diverse individual goals as such will not be considered. Rather it is the underlying
processes of pursuing goals that will be the focus of this thesis as these will be
common across individuals.
Finally, the individual‟s gender will be considered through role theory (Kahn
et al., 1964), which is tied to the socialization of roles which in turn explain both role
salience and gender role attitude. How valuable a role is considered, that of a worker,
parent or within a marriage, along with a consideration of what roles are appropriate
for an individual are the result of both the individual‟s inclinations, learning
experiences and the prevailing cultural norms (Bussey & Bandura, 1999). The social
cognitive theory of gender development (Bussey & Bandura, 1999) combines the
perspectives of the influence of biological differences, how gender schemas are
developed (Bem, 1974; C. L. Martin & Halverson, 1981), gender identity as a result
of cognitive-developmental maturity (Kohlberg, 1966, cited by Bussey & Bandura,
1999) and the understanding of the differences that exist within genders as well as
between genders. Learning from observations leads to an understanding of valued
outcomes associated with gendered behaviours and with subsequent internalization
of the gender roles. Self and social sanctions follow to maintain valued behaviours
and avoid aversive behaviours, reinforcing stereotypes of what is normal for each
gender (Bussey & Bandura, 1999). The changes in employment patterns however
34
challenge these gender roles. For example, the attitudes to female employment are
vastly different in the current time compared to 30 or 40 years ago and there has been
a shift in the focus of who is likely to experience conflict between work and family
(or any non-work) roles. Initially, this was considered to be only a concern for
working mothers (Moen, 1992), whereas now it is recognised that both women and
men can be affected (Hill, 2005). The question that must be addressed here is
whether the social construction of gender influences the well-being and mental health
of working adults, regardless of the roles they fulfil or how gender is socialized.
1.3.3 Linkages between the generative disposition and positive affect, positive
psychology and resilience
By extending the ecological view of work-life issues (Grzywacz & Bass,
2003; Hill, 2005; Voydanoff, 2002) to include the personal characteristics of the
person who is balancing their work and non-work roles, Bronfenbrenner‟s
bioecological model is now being explicitly invoked (Bronfenbrenner & Morris,
1998). This addition is important to fully understanding how an individual negotiates
the various domains of their life and achieves good mental health and well-being.
Much of the research on the work-life interface does not include a detailed
account of how the individual differences are involved in managing the diverse roles
associated with the work-life interface (Frone, 2003). Yet where such research does
include individual differences, a broader understanding of the factors associated with
well-being is found. In a study of U.S. government workers, burnout in employees
has been shown to be negatively associated with job satisfaction, with burnout
predicted by increased organizational constraints toward customer relations and
lower self-esteem, self-efficacy, and emotional stability and an external locus of
control (Best, Stapleton, & Downey, 2005). The direct link between the individual‟s

35
positive disposition and their perceptions of lesser workplace constraints highlight
the importance of including individual differences in the study of work-life and well-
being. When problem-solving responses at work are explored, individuals who were
successful at reducing the stressors confronting them showed greater mastery and
self-esteem, with lower psychological distress than individuals who made
unsuccessful attempts or no effort to solve their problems (Thoits, 1994). These
findings highlight the importance of considering the individual as an active
participant within their lives, rather than a passive recipient of life stressors.
It is through the adaptive use of available resources that competent
development underpins the successful and positive outcomes that are achieved by the
developing individual (Bronfenbrenner & Morris, 1998; Yates & Masten, 2004). The
framework that guides the broad definition of optimal functioning is derived from
previous research, which includes principally the self-regulation of behaviour
(Carver & Scheier, 1998; Csikszentmihalyi & Rathunde, 1998) in conjunction with
models of action in health psychology (Bandura, 2005; Schwarzer, 1992; Schwarzer
& Taubert, 2002), the emerging study of positive psychology (Carlson, Kacmar,
Wayne, & Grzywacz, 2006; Carr, 2004; Emmons, 2003; Fredrickson & Joiner, 2002;
Grzywacz & Butler, 2005; Peterson & Chang, 2003; Seligman, 2002), and previous
resilience research (Kumpfer, 1999; Masten, 2001; Ryff, Singer, Love, & Essex,
1998). Rather than a fixed response to all situations, competent individuals are more
flexible in the way that they approach the world, being both active and selective.
Feedback from one‟s actions provides continuity of behavioural responses, with the
accumulation of consequences building the subsequent life path (Caspi et al., 1989).
The growing and developing person represents a self-organizing system, which
adapts and selects the best available options across time that will allow desired goals

36
to be achieved (Csikszentmihalyi & Rathunde, 1998). As the future is unknown,
being able to adapt to uncertainties and make decisions without complete knowledge
of all eventualities can allow the individual be to happier with their choices and not
regret their decisions (Abbe et al., 2003).
Self-regulation, the basis of dispositional optimism, focuses on feedback
loops, where the individual is motivated to take actions that reduce discrepancies
between their actual progress and their desired outcomes or goals. These feedback
loops can be are negative, discrepancy-reducing loops, whereas positive discrepancy-
increasing loops take the individual away from undesired outcomes (Carver &
Scheier, 1998). The ecological and life span view of human development involves
reciprocal or bidirectional relationships between the individual and their environment
(Bronfenbrenner & Evans, 2000; Csikszentmihalyi & Rathunde, 1998). This „loop‟ is
implicit in self-regulation, when individuals are motivated to move toward and focus
on desired goals and use their progress as the reference point in this process.
However, feedback loops can also be considered as a developmental or learning
response to contextual cues, rather than only as motivation toward action. As such,
positive feedback loops occur when behaviours that reinforce desirable behaviours
are maintained and strengthened, whilst negative feedback loops are likely to
dampen and inhibit behaviours that are detrimental to the individual (Lewis, 1995).
Whether regarded as motivation (negative loop, moving toward a goal) or as
reinforcement (positive loop, increasing desired action), feedback loops allow the
individual to achieve positive outcomes in their lives.
Successful problem solving at work leads to increases in mastery and self-
esteem in time (Thoits, 1994), whilst higher positive affect is linked to broad-minded
coping, followed by greater positive affect over time (Fredrickson & Joiner, 2002).

37
The latter effect is explained by the Broaden and Build theory of positive emotions
which contends that positive emotions, such as joy and interest, builds action
repertoires and enduring resources that are used in the future, which give rise to more
positive affect (Fredrickson, 1998). The Health Action Process model, which
includes the individual difference variables, self-efficacy and dispositional optimism,
has also increased the understanding of health behaviours in response to threats or
challenges to the individual‟s health (Schwarzer, 1992). In essence, the individual
will take actions that reduce the health threats to themselves, based on their sense of
competence to change their health outcomes, their expectations of having success at
changing their outcomes and their perceptions of the risks involved and the cost of
any such action would be (Schwarzer, 1992). In the model, expectations for change
and dispositional optimism achieve similar results, which Schwarzer acknowledges
and which links self-regulation and behaviours that lead to healthy outcomes.
Positive psychology involves the study of strengths and functional behaviour
rather than dysfunction and illness (Seligman & Csikszentmihalyi, 2000), which can
expand understanding of human development and the nature of well-being. As noted
previously, well-being in the work-life areas is often taken as the absence of negative
symptoms, such as depression and stress, rather than the presence of satisfaction and
happiness. Positive psychology can also offer new directions for interventions to
improve functioning. Strategies that increase gratitude and count blessings (Emmons
& McCullough, 2003) place a focus of developing strengths rather than overcoming
weaknesses (Hodges & Clifton, 2004) and personal strengths and practice acts of
kindness (Lyubormirsky, Sheldon, & Schkade, 2005) have been shown to improve
positive functioning and well-being. By including factors that lead to fulfilling goals,
engaging in challenging and stimulating work, and caring for others, well-being can

38
be understood in terms of flourishing and optimal functioning.
In addition, a resilience framework can set out the way that environmental
factors are filtered by personal responses (Kumpfer, 1999). Resilience is the process
and protective factors involved in good adjustment and development under adverse
conditions are more commonly used to understand child and youth development
(Masten & Reed, 2002). In later life, resilience has been defined as the „maintenance,
recovery, and improvement in mental and psychological health following challenge‟
(Ryff et al., 1998, p74). Based on the level of adversity or risk faced (low to high)
and the individual‟s level of competence or adaptation (competent or vulnerable),
when the level of risk or adversity increases from low to high, those with low levels
of competence move from being vulnerable to having maladaptive responses to
adversity. For those with high levels of competence, changes from low to high levels
of risk move these individuals from being competent and unchallenged to being
resilient to adversity (Masten & Reed, 2002). The perception of risk will also differ
between individuals.
The resilience framework proposed by Kumpfer (1999) has similarities to
Bronfenbrenner‟s bioecological model. The process of resilience involves the
stressor being framed by the environmental context (with the relevant risk and
protective factors), filtered by the person-environmental processes (perception,
reframing, and active coping) and interpreted by the individual‟s internal resources
(cognitive, emotional, behavioural, physical and spiritual) to produce the resiliency
strategies that lead to adaptation and positive outcomes (Kumpfer, 1999). By
specifying the components of the process, each can be explored as is the case with
the work-life interface. Of particular interest to the current research are the ways in
which the resilience process and the work-life interface overlap. The environmental

39
context contains risks and protective factors relevant to the individual and the
stressor, and relate to the demands and resources of the individual‟s work-life
situation. The internal self-resilience factors, cognitive, affective and behavioural can
be readily transferred to the active participant and the person-environment and
resilience strategies link to Bronfenbrenner‟s proximal process.
With regards to the individual differences that are amenable to personal
control, resilience is seen as „ordinary magic‟ as the use of these adaptive strategies
are available to all people, through nurturing relationships, safe and supportive
environments and personal resourcefulness (Masten, 2001). The importance of
positive cognitive styles to mental health is shown through Beck‟s models of
depression (Beck, 2002), whereas negative cognitive styles imply a vulnerability to
depression (Alloy et al., 1999). Optimism and pessimism are also implicated in the
self-regulation of goal-directed behaviour as optimistic individuals are more likely to
persist with solvable tasks whilst withdrawing from unsolvable tasks more readily.
Persistence toward goals has been shown to be dependent on the individual‟s
expectations of the likely outcome, such that optimistic individuals have more
positive expectations for the future (Armor & Taylor, 1998; Carver & Scheier, 2002).
In a study that examined effect of changing stressor levels on optimism over time,
increasing stressors among employee and spouse/mother roles reduced dispositional
optimism over time in some women. This finding highlights the complex and
reciprocal relationship between optimism and the individual‟s environment and
challenges the notion that optimism is a fixed trait (Atienza, Stephens, & Townsend,
2004).
1.3.4 Gender and the generative disposition of the active participant, P
The cornerstone of the bioecological model is the active participant. The

40
characteristics of the individual that lead to competence are the individual‟s gender
and behavioural disposition, their biopsychosocial resources and the reactions
elicited by their demand characteristics (Bronfenbrenner & Evans, 2000). An
individual‟s gender leads to particular developmental niches and pathways, due to
the historical context of their life and external societal norms and expectations
(Bianchi, Milkie, Sayer, & Robinson, 2000; Bronfenbrenner & Evans, 2000;
Bronfenbrenner & Morris, 1998). However, the individual‟s intrapersonal
characteristics allow the individual to construct their own life course. As noted
previously, the individual who has a generative disposition will use constructive and
persistent behaviours to engage with life, whereas a disruptive disposition will lack
control and has dysfunctional emotions and behaviours (Bronfenbrenner & Morris,
1998). In the current thesis, the influence of a resilient, adaptive and competent
personality on the interaction of working conditions and mental health will be
operationalised in the resources of a generative disposition in everyday life, as
dispositional optimism (Scheier et al., 1994), self-efficacy (Scholz et al., 2002) and
perceived control of time (Macan, Shahani, Dipboye, & Phillips, 1990). However,
before considering these individual difference variables, the fundamental difference
of the individual‟s gender will be considered.
1.3.5 Gender
Gender can proscribe the pathways of an individual‟s life and influences the
distribution of roles, as social role stereotypes can narrowly define relationships and
individual roles (Bianchi et al., 2000; Bussey & Bandura, 1999). Biological
stereotypes about gender can imply that one gender is more suited than the other to
certain roles, for example, that only women can be nurturing and only men can be
leaders. However, an extensive review of the many studies showed that rather than

41
polarity between the genders, there are more similarities than differences (Barnett &
Rivers, 2004). The biological differences between men and women, most obvious in
the ability to have children should not limit what roles either gender can occupy as
the differences within a gender on most abilities are greater than the differences
between genders for those abilities. Rather than stereotyping what is appropriate for
either gender based on gender alone, accepting the overlap between the genders
would pave the way for a greater equality in all areas of life (Barnett & Rivers,
2004).
The differences in how social roles are experienced by working adults will be
explored to understand whether these different experiences result in men and women
having different well-being and mental health outcomes. From the Australian Quality
of Life surveys, men were more vulnerable to low income, unemployment and lack
of partner reducing their personal well-being (Cummins, Woerner et al., 2007).
Research on the prevalence of depression found that women are more likely to be
depressed, as were individuals with less education, low income and poor health
(Andrews et al., 2001; Hawthorne et al., 2003). These poorer outcomes may be
associated with limited resources; for men, there is an inability to fulfil their social
role of breadwinner, whilst for individuals generally, and for women in particular,
the lack the opportunities to develop the resources that protect against affective
disorders. It would be expected therefore, that for individuals who are employed and
have sufficient income to meet their needs, gender would have limited influence of
well-being and mental health, despite the different experiences of working and
family conditions. Stereotypes of leaderships, occupations and breadwinners will be
explored before examining gender and parenting.
1.3.5.1 Gender and the work environment. When gender stereotypes are

42
applied to how men and women are considered in leadership roles of work teams,
studies using undergraduate students find that men are more favourably rated than
women as leaders as leadership emphasizes masculine traits. Men were expected to
be strong, whilst women had to be both strong and sensitive to be considered
effective and likeable leaders (S. K. Johnson, Murphy, Zewdie, & Reichard, 2008).
An early meta-analysis found gender differences only in laboratory situations, but
not in work settings, for leadership satisfaction, and no gender differences when
leader behaviour and employee satisfaction were rated (Dobbins & Platz, 1986).
Similarly, a series of meta-analyses on leadership effectiveness found that students
rated men as more effective, particularly for masculine (i.e. task orientated)
behaviours (Eagly, Makhijani, & Klonsky, 1992) but in work roles, both genders
were considered effective leaders (Eagly, Karau, & Makhijani, 1995). Interestingly,
this effectiveness was somewhat tempered by the level of leadership, with men
considered more effective in areas requiring technical skill (i.e. production
managers), whilst women were considered more effective where interpersonal skills
were more necessary (i.e. middle management) (Eagly et al., 1995).
When teams are based in working populations and task-related information
and knowledge of the competence of team members is established, it is the
individual‟s abilities, not their gender that is important to their leadership rating
(Powell & Graves, 2003). Organizational roles may be more salient to performance
and acceptance amongst the working population than simply considering
stereotypical gender roles, as the relationships are more established and not bound by
gender heuristics (Eagly & Johnson, 1990). When non-verbal behaviour is
considered in the interactions between high and low status employees within a
company, high status employees whether male or female, were positive and

43
supportive to the lower status employee, although this was expressed slightly
differently for either gender. Men used fewer interruptions and more facilitators (i.e.
responses such as „umms‟ that show interest and encouragement), whilst women
were open, confident and supportive (Hall & Friedman, 1999). Whilst gender
stereotypes can be a useful heuristic initially, the individual becomes more important
once they are known to their co-workers and the basis of leadership remains the
same, with different nuances.
Interestingly, when job satisfaction is compared between the genders, there is
a paradox as women are happier with their work than men as an overall rating and on
each facet of the work environment (A. E. Clark, 1997). Further, women valued their
relationships with their managers, the actual work they did and the hours they
worked, whereas men valued promotion, their pay and their job security as the most
important parts of their jobs. In this large sample of the British workers, women‟s
jobs were not objectively better than men‟s; rather women were more satisfied with
the same conditions, perhaps because their expectations of work were not as great.
The effect of higher education on job satisfaction supported this contention, as there
were no gender differences in job satisfaction among the better educated (A. E.
Clark, 1997). Different expectations and values about one‟s own business were also
apparent in recent research that compared the business satisfaction and success of
entrepreneurial university graduates in the US (Powell & Eddlestone, 2008). Firms
run by men were more successful, both in sales and performance than women and
men worked more hours per week than women, although both were equally satisfied
with their business successes. Women did not place value on business and sales
performance to judge the success of their businesses as men did although how
women did quantify their success was not explored by the study. Men however did

44
report increasing satisfaction with their business success as performance compared to
other similar firms improved, implying that external comparisons were important to
men. However, higher sales did not lead to satisfaction with business success and the
authors proposed that increasing sales may not have matched increased profits,
reducing perceptions of business success (Powell & Eddlestone, 2008). The central
part of the paradox appears to be differing values between the genders on what
constitutes „success‟, as it is possible that women don‟t need as much external
validation of themselves, whereas men may view their success through their
achievements in the breadwinner role (Burke & Nelson, 2001). This thesis will
explore how gender role attitudes may underlie this difference by including an
analysis of gender, job satisfaction and gender role attitudes.
For men who are employed in non-traditional occupations (for example,
nursing or primary school teaching), there was a tendency for a lack of acceptance
from their male friends for their choices, although their families may be largely
accepting of their choice (Simpson, 2005). However, the men could and did take
steps to reduce negative perceptions of their work by emphasising masculine aspects
(such as sporting roles for the primary teachers). Interestingly, the men who had
actively chosen their non-traditional work reported higher job satisfaction and greater
intrinsic reward from their work than when the men had been employed in more
„masculine‟ occupations (Simpson, 2005).
Women who work in male-dominated occupations face different challenges,
as they seek access to flexible work practices which allow them to pursue a career
and have family responsibilities. Rather than friends who do not support career
choices, it is the corporate ethos that is inimical to primary care responsibilities. For
example, in the large, corporate legal and accountancy firms, time spent maintaining
45
client relationships (usually after hours, at sporting events) and long working hours is
considered as „face time‟ and is considered crucial to career advancement (Thornton
& Bagust, 2007). If women are childless by choice, then they have less loneliness
and depression in later life than women who would rather have had children but did
not for whatever reason (Koropeckyj-Cox, 2002). Fairly or unfairly, parenthood in
women can be taken as disinterest in career development, leaving women in these
high status and very high income positions with the choice to postpone motherhood
or forgo it completely. Unless society considers success in more than monetary terms
and the firms change their view of the ideal employee as working very long hours to
the exclusion of all else, this area of gender inequality is likely to remain, until
perhaps the next generation does not accept the status quo (Thornton & Bagust,
2007). Ambition, however, is common in every generation and it is likely that a
small proportion of men and women will chose to work very long hours for the
income and status that these jobs bring and will accept the consequences of limited
opportunities for family responsibilities (Hewlett & Luce, 2006). For women then,
trading career success, a masculine role model, for becoming a mother, a feminine
role model, may be problematic for mental health in later life unless the individual
makes their own clear choice of their life path.
Among self-employed individuals, social roles gave a sense of purpose in
their work activities. In interviews with middle aged business owners, the men saw
their traditional breadwinner role as an important contribution to their family‟s
financial well-being. Being a good provider was important for both self-employed
men and women and how attached women were to their parental role influenced how
much work was changed to accommodate family needs. The women who strongly
identified with their parenting role changed their work schedules to look after their

46
children, whilst those who were more focused on their work role, had to make
arrangements that provided care for their children in their absence, such as reliable
babysitters or family to care for the children (Loscoco, 1997). When a couple has
flexible attitudes and behaviours toward gender-based roles, the results are mutually
beneficial and satisfying for both men and women (Barnett & Hyde, 2001; Loscoco,
1997; Milkie & Peltola, 1999). Although the roles that each gender is balancing can
be different, the resultant work-life balance is the same (Eagle, Miles, & Icenogle,
1997; Milkie & Peltola, 1999). The influence of demands and resources of the work-
life interface on both genders will be considered further in the sections on C, the
context of the individual‟s life.
1.3.5.2 Gender and parenting. In comparison with previous generations,
women have greater work opportunities and men have greater involvement with their
families (Bianchi et al., 2000; Burke & Nelson, 2001; Milkie & Peltola, 1999) and
share mutual appreciation of their employment needs (Eagle et al., 1997). The
presence of young children however can limit the priority of the work role for
women. When priority was given to family responsibilities, which are greater when
there are young children in the family, the mobility and career progression among
doctoral graduates was reduced, although women were more likely to chose jobs that
offered work-life balance then men. Having another parent to care for their children
allowed both genders to focus on their work roles (Kirchmeyer, 2006).
In a study of new mothers, most women felt that their role was as the primary
carer of the new child, whilst their partners provided a very valuable role of
providing for the family. This sharing of roles was for the most part not an explicit
discussion, rather something that they both agreed on, despite any financial strain
(Hand, 2006). Among mothers of children of different ages, most mothers recognised

47
that there was no one way to manage work and family roles and that different
families had different needs to meet. Finding a compromise between family and
work roles and therefore increasing the income of the household can be difficult
because there is no easy, neat solution that allows both roles to be fully expressed
(Hand & Hughes, 2004).
For employers, marriage and children highlight perceived differences
between men and women. Women, as mothers were expected to have more non-
work distractions and men, as fathers were expected to increase their efforts at work
to look after their families and this difference is reflected in an advantage in wages
for men across all types of jobs. In this way, women with family responsibilities do
not fit the „ideal worker‟ mould of the traditional breadwinner (Budig, 2002).
However, as noted previously, income over the level of meeting needs does not
guarantee well-being or mental health and may be problematic when the emphasis is
on materialistic goals.
When work performance is rated, conforming to gender stereotypes gained
more favourable ratings than when gendered expectations were ignored. Employed
individuals, when given vignettes of the performance of a supervisor, were more
critical of the planning and gave less rewards for males who took time off for family
matters (i.e. caring for a sick child) than for women, although both were rated lower
on planning evaluations when they had family to work conflict (Butler & Skattebo,
2004). Childcare and eldercare have additive effects on men and women‟s
satisfactions with work, although women with preschool children have the lowest
work-life balance and women with school aged children have the least satisfaction
with leave entitlements. Individuals of both genders with eldercare responsibilities
had less perceived organizational support, less work-life balance and less satisfaction

48
with their leave arrangements and their pay (Buffardi, Smith, O'Brien, & Erdwins,
1999). The detrimental effects of caring for elderly relatives may reflect a lack of
community awareness of what such care involves, whereas childcare needs are more
well-known and are more widely available.
1.3.5.3 Gender and house work. Sharing work and family roles within a
couple involve trade-offs for both men and women. Whilst women may do more of
the daily care of household and children than men (Bianchi et al., 2000; Liossis &
Noller, 2004), men work longer hours on average than women and more men than
women work very long hours (>50 hours) each week (Australian Bureau of Statistics,
2006a). How household tasks are divided remains a contentious issue, although
overall perceived fairness of household work and equity in the relationship tasks
reduces the impact upon the relationship (Coltrane, 2000).
The way that gender affects the combination of paid and family work can be
viewed in a number of ways. First, that women take on the ‟second shift‟ of family
work to accomplish both roles (Hochschild, 1997), although this carries the
implication that women have a far greater burden than men and men are not doing
their „fair share‟. Second, house work can be seen as an emotion-free transaction
between the partners, based on the power balance between them (i.e. their relative
resources, usually income), as a time differential (i.e. who works longer hours), or as
gendered social roles (e.g. that housework is „women‟s work) (Bianchi et al., 2000).
Whilst women did between two and three more hours per week than their husbands,
comparing these proposals using time diaries and large national samples, found that
time availability and relative resources change the proportions of time spent on
household tasks. As a woman‟s work hours and level of education increase and with
fewer children, she spent significantly less hours and her husband more hours doing
49
house work, which supports both the time availability and relative resource
viewpoints. Gender role attitudes have less effect however, than resources or time,
with egalitarian gender ideology not affecting men‟s hours at all and decreasing the
hours for women (Bianchi et al., 2000).
However, the third viewpoint considers that family work, of which household
labour is part is emotional labour and should be viewed as an expression of authentic
self-hood, rather than as just another chore to be done (Coltrane, 2000; R. J.
Erickson, 2005). In the study by Bianchi et al. (2000), the rational allocation of time
could not explain how the presence of children increased their mothers‟ non-work
hours. It is possible that the gendered identity associated with being a good mother or
father brings with it a set of behaviours that guides the enactment of roles to provide
for their children. Women then continue to invest more in family work to fulfil their
feminine and expressive identities (R. J. Erickson, 2005) and men would invest more
in the roles of breadwinner (Pleck & Stueve, 2001). Considering how fair the
partners feel their distribution of the family work, given the emotional meaning of
what each does may therefore be more important that simply adding up hours. In this
way, men‟s perception of themselves as breadwinners and the time that they spend at
work (for example, Loscoco, 1997; Maurer & Pleck, 2006) can be valued equally or
as fair recompense for the trade-off in working hours and additional family work
that women do.
For men and women who may have different roles, work different hours, and
do more or less household labour, the current research will explore whether the
perception of fairness of household labour, rather than hours per se, will lead to
gender differences in the well-being and mental health, and burnout and work
engagement of working adults. Gender will be further considered when the

50
differences in family roles are explored in the following section on Family
characteristics (Section 1.4.7). The next sections about the Person will discuss the
generative disposition (as dispositional optimism, self-efficacy and perceived sense
of control) and the individual‟s demand characteristics (as humour and social skills
and relationships).
1.3.6 Dispositional optimism
Whilst dispositional optimism is the expression of self-regulation, it is
important to consider why optimistic people have better outcomes. Dispositional
optimism is defined as the expectation of good outcomes for future goals (Carver &
Scheier, 2002; Scheier et al., 2002). The importance of these goals motivates self-
regulation, behaviour and the positive expectations of successful outcomes produce
coping patterns that ensure persistence until the goals are achieved (Aspinwall,
Richter, & Hoffman, 2002; Carver & Scheier, 2002; Diener et al., 1999).
Dispositional optimism for both genders is also associated with more active coping
strategies, better reconciliation with stressors, early recognition and disengagement
of intractable problems and focus on solvable situations (Aspinwall et al., 2002;
Iwanaga, Yokoyama, & Seiwa, 2004).
Dispositional optimism has been studied extensively in health-related
outcomes and less widely in work-related situations. In reviews of health-related
outcomes, optimism has been linked in many studies to faster recovery from breast
cancer and heart surgery (for example, see early reviews by Scheier & Carver, 1992;
Scheier et al., 1994). In a sample of women assessed after an abortion, optimism as a
part of a resilient personality (Marshall & Lang, 1990) reduced the women‟s stressful
appraisal of their situation, leading to less residual distress and greater well-being
(Major, Richards, Cooper, Cozzarelli, & Zubek, 1998). Women who were more

51
optimistic worried less about their perceived risk of breast cancer because they
believed that they had, in general, a lower risk of the disease (McGregor et al., 2004).
Menopausal women, who were more optimistic reduced their experience of
vasomotor symptoms (e.g. hot flushes), although not of somatic complaints (e.g.
headaches) after a fitness program for sedentary women (Elavsky & McAuley,
2009). After treatment for depression, patients with multiple sclerosis had increased
levels of benefit-finding about their illness, with decreases in depression mediated by
increased optimism and positive affect (Hart, Vella, & Mohr, 2008). Further, when
more optimistic individuals were involved in psychotherapy, they persisted longer
with therapy and their counsellors believed that they would show greater
improvement and used more task-orientated coping (Hatchett & Park, 2004).
Among doctors and nurses working with chronically and terminally ill
paediatric patients, greater optimism, as well as professional self-esteem (similar to
professional efficacy) was linked to the medical staff finding more meaning in their
working lives (Taubman-Ben-Ari & Weintroub, 2008). Further, among rural
adolescents, greater optimism was associated with a greater ability to control their
anger as well as the adolescents expressing less physical and verbal anger (Puskar,
Ren, Bernardo, Haley, & Stark, 2008). Greater dispositional optimism in Japanese
women is associated with more social support, less perceived stress and greater well-
being (Sumi, 1997). After the first year at college, more optimistic students had
larger friendship networks and had gained more social support from their peers on
campus. By using more positive reinterpretation and growth to cope with the
experiences, they also reported less stress and depression than their less optimistic
peers (Brissette, Scheier, & Carver, 2002). Similarly, optimism moderated the
relationship between undergraduates‟ perceived stress and their life satisfaction and

52
depressive symptoms (Chang, 1998). However, increasing stressors among employee
and spouse/mother roles can reduce dispositional optimism over time in some
women, highlighting the complex and reciprocal relationship between optimism and
the individual‟s environment (Atienza et al., 2004).
Research of optimism in the workplace is more limited. Including optimism,
as a personal resource, in the Job Demands-Resources model, showed that personal
resources partially mediated between job resources, such as autonomy, and work
engagement and reduced the impact of job demands, such as workload, that would
otherwise increase emotional exhaustion (Xanthopoulou, Bakker, Demerouti, &
Schaufeli, 2007). Optimism was also found to moderate the effects of time pressure
and organizational climate on mental distress over time, with women with high
optimism having less distress when time pressure was high and organizational
climate was poor. Among men in the same sample, being optimistic predicted less
exhaustion 12 months later (Makikangas & Kinnunen, 2003). In the workplace, as
with health and social relationships, dispositional optimism is a personal resource
that individuals can use to maintain and bolster their well-being and mental health.
Whilst not used in the current thesis, optimism and pessimism are also
explanatory styles, which reflect the attributions that an individual makes about the
causes of events in relation to themselves, the world and the future (Peterson, 1999).
Explanatory styles are pessimistic if a negative events are due to internal (self),
global (world) and stable (future) causes and are predictive of hopelessness and poor
functioning (Abramson, Metalsky, & Alloy, 1989; Needles & Abramson, 1990).
Among the participants of the Harvard study, pessimistic explanatory styles at age 25
years prospectively predicted poorer mental and physical health from age 45 to 60
years and greater mortality of the men (Peterson, Seligman, & Vaillant, 1988).

53
However, in the current thesis, the focus will be on dispositional optimism, rather
than explanatory style. The Attribution Styles Questionnaire (Peterson et al., 1982) is
a long instrument that measures explanatory styles and can be more cumbersome to
administer to participants than the short, more commonly and widely used Life
Orientation Test – Revised (Scheier et al., 1994).
Results from a study of Swedish twins raised together or apart found that
there is a moderate genetic component (23%) in the development of dispositional
optimism. The environment, therefore, in which children were raised was important,
as the shared family environment is a significant part of the optimism of the twins as
adults. More optimistic twins also reported less depression and paranoid hostility and
greater life satisfaction (Plomin et al., 1992). Authoritative parenting, by providing
experiences of mastery and understanding of life‟s rules and boundaries, fosters the
experiences that lead to effective self-regulation. The children of authoritative
parents as adolescents and college students were more optimistic which led to better
adjustment: greater self-esteem, less depression and better outcomes from their
studies at school and at university (Jackson, Pratt, & Pancer, 2005). Optimism was
seen as the way that the benefits of authoritative parenting could be translated into
healthy outcomes, giving the developing child the resources to manage their world.
How then does optimism operate? Dispositional optimism is important to the
current research as the link between positive expectations, persistence toward
favourable outcomes, and recognition of challenges allows working adults to be
proactive in managing their roles (Aspinwall & Taylor, 1997). When faced with
challenges of balancing work and family roles, an individual‟s behaviours toward
achieved the desired balance are firmly embedded in their expectations of the likely
outcomes (Armor & Taylor, 1998).

54
From the studies described above and extensive reviews of the effect of
dispositional optimism on coping with health problems and the effect on mental
health (Culver, Carver, & Scheier, 2003; Scheier et al., 2002), there are general
trends in the way in which optimists approach novel or challenging situations and
adaptively cope with their problems. Optimists are more likely to seek information
about the situation, be active in planning and coping, reframe their situation in a
more positive light, look for the benefits or „silver lining‟, use humour and finally
accept the reality of what has occurred to them (Scheier et al., 2002). This repertoire
of behaviours brings to mind the Serenity prayer (Aspinwall et al., 2002), in that an
optimist would try to change what can be changed, accept what can‟t be changed and
understand the difference between these situations.
Optimistic individuals believe that they are more likely to experience positive
events than negative events, with pessimistic individuals believing the opposite. Both
types of events were personal experiences with positive events such as getting a good
job offer, having good luck or being healthy and negative events such as
experiencing prejudice or crime, not getting a desired job or conflict with friends
(Lipkus, Martz, Panter, Drigotas, & Feaganes, 1992). However, optimism is not as
pronounced for future world events, such as possible future economic crises,
environmental problems than for personal events (Wenglert & Rosen, 2000). In this
way, optimistic expectations may be better expressed in areas where there is personal
experience rather than extending to broad and diffuse areas of where knowledge may
be limited. Realistic optimism is based on knowledge about oneself and about one‟s
environment and where actions are sensitive to environmental cues and responses
(Schneider, 2001). By accepting that there are fuzzy boundaries (and no absolutes) to
the accuracy of the knowledge about self and environment, realistic optimism can be

55
lenient in the positive reinterpretation of experiences whilst still seeking good
outcomes in the future (Schneider, 2001). Such strategic behaviour can protect self-
esteem and help overcome initial failures as the individual works toward later
success (T. Thompson & le Fevre, 1999). However, if the individual does not know
what competence involves, such as knowledge to pass exams or performance relative
to others, the individual is in effect unrealistically optimistic. Because of these
unknowns, the less competent can inflate their assessment of how well they would do
on the tasks under consideration (Erhlinger, Johnson, Banner, Dunning, & Kruger,
2008).
Over-optimistic estimates of performance can also be reduced when the task
is more realistic rather than hypothetical and the contexts are well-specified. In these
situations, individuals are reasonably accurate in their predictions (Armor & Sackett,
2006). Optimism is this way is not indiscriminate or unwarranted as predictions or
outcomes can be confirmed by events over time (Aspinwall et al., 2002). As such,
optimistic beliefs are bounded within reality, strategic in helping the individual to
achieve their desired goals and responsive to the unfolding situation (Armor &
Taylor, 1998; Aspinwall et al., 2002). There is the balance between persistence
toward goals and recognising when a goal is not achievable. The recognition of the
current situation, to find the „wisdom‟ in the serenity prayer to know the difference
between what can and cannot be changed, is crucial to flexible self-regulation.
Dispositional optimists disengaged from unsolvable tasks and spent more time on
alternative tasks where available, while persisting longer on solvable tasks they were
given. When there was no alternative task available, the dispositional optimists
disengaged faster from the unsolvable tasks than less optimistic study participants
(Aspinwall & Richter, 1999). Giving up can improve well-being and quality of life

56
where there is a meaningful alternative in which the individual can re-engage their
efforts (Wrosch, Scheier, Carver, & Schulz, 2003; Wrosch, Scheier, Miller, Schulz,
& Carver, 2003).
In conclusion, dispositional optimism is important to the current study of the
work-life interface because it provides a mechanism where by working adults can
manage the demands of their lives. By having positive expectations about their lives,
dispositionally optimistic individuals will be adaptable, flexible and responsive to
their situation, persisting in what they can do, retreating from the unsolvable
problems and taking steps to plan proactively increase their future resources to buffer
them in difficult or uncertain times. Recognition of possible futures allows the
individual to take action to secure the assistance of the people and materials to
manage these perceived future concerns or threats (Aspinwall, 2005; Aspinwall &
Taylor, 1997). By being pragmatic about the reality of the working-personal life
intersection, a focus on dispositional optimism will reflect the individual‟s self-
regulatory efforts. Such positive self-regulation will be important to optimal
functioning.
1.3.7 Self-efficacy, as coping self-efficacy
Models of health behaviours focus on the way in which individuals perceive
threats toward their health and what will motivate them into action. A number of
models are used in this field such as the Health Belief Model, the Theory of
Reasoned Behaviour and the Theory of Planned Behaviour, although these models
do not focus on individual difference in health actions. The model of relevance to the
current research is the Health Action Process Model in which self-efficacy is
considered central to perception of risk and prediction of action and self-efficacy
provides feedback to intention and action plans. When expectations of self-efficacy

57
and of likely outcomes increase, so do intentions to act on health action plans. Self-
efficacy and action expectancies, the equivalent to the general expectations of
dispositional optimism, increase the understanding of health actions (Schwarzer,
1992). In this way, actions and expectations can reduce risks of poor health and it
would be reasonable to extend this linkage to actions and expectations that could
reduce the risks from role demands. Similarly, optimism and self-mastery (conceived
as similar to self-efficacy) were found to be distinct constructs that, whilst they
overlapped, separately predicted the absence of depression in married professional
women (Marshall & Lang, 1990).
Self-efficacy indicates the confidence that men and women have in their
personal capabilities to achieve behavioural outcomes with high self-efficacy
equating to feelings of competence and effort and persistence toward goals
(DiBartolo, 2002; Ryff et al., 1998; Semmer, 2003). As noted previously, self-
efficacy has been understood in relation to health outcomes, with behavioural change
such as weight loss indicating how self-efficacy beliefs motivate the individual
toward adopting and maintaining behaviours that bring the desired outcome
(Schwarzer, 2001; Schwarzer & Renner, 2000). Self-efficacy is important to
successful transitions out of the military (Gowan, Craft, & Zimmerman, 2000) and
among teachers (Tang, Au, Schwarzer, & Schmitz, 2001), leading to reductions in
depressive symptoms in women professionals (Marshall & Lang, 1990) and
buffering of work-place stress and rigidity (Jex & Bliese, 1999; Jex, Bliese, Buzzell,
& Primeau, 2001; Jimmieson, 2000; Schaubroeck, Jones, & Xie, 2001). Parental
academic self-efficacy and aspiration are important for their children‟s own self-
efficacy and academic achievements (Bandura, Bardaranelli, Caprara, & Pastorelli,
1996).

58
Although Bandura (1997) considered the construct as domain-specific,
general self-efficacy in men and women acknowledges the individual‟s broader sense
of competence across work and personal domains to handle unusual or difficult
situations (Scholz et al., 2002) in addition to balancing everyday life. Managing
difficult situations also relies on self-efficacy where one is capable and competent to
deal with whatever is required, whether coping with AIDS (Chesney et al., 2003) or
maintaining job satisfaction whilst working long hours and having a high workload
(Jex & Bliese, 1999). As part of a core self-evaluation, self-efficacy is also linked to
job and life satisfaction over and above the influence of job conditions (Judge,
Locke, Durham, & Kluger, 1998).
The role of self-efficacy in health behaviours and as a sense of competence
and outcomes of intended actions indicates that self-efficacy is an important
component of the adaptive and purposeful individual. Framing the measurement of
self-efficacy in the current research project through the lens of coping self-efficacy
reflects the need to manage and adapt everyday to the demands of work and personal
domains. This is a further link to the individual‟s demand characteristics, described
in Section 1.3.9. Daily life is a dynamic process of dealing with minor hassles,
maintaining routines and fulfilling role expectations. An individual that feels more
able to utilize their internal and external resources will maintain their well-being and
reduce any strain felt by not meeting those daily requirements.
1.3.8 Perceived control of time
Perceived control of time is the result of an individual‟s time management
behaviours, such as scheduling, setting goals and priorities and having a preference
for being organized, and the outcome of control is reduced tensions on the job and
increased job satisfaction (Macan, 1994) and is shown to be important in reducing

59
work-family conflict in full-time employees, who were also part-time students
(Adams & Jex, 1999). Locus of control was originally considered as a personality
trait and the way an individual viewed events, whether the cause of an event had an
internal cause, was due to powerful others, or a chance event. However, research has
shown that a sense of control should be considered within the context and
reinforcements of the situation (Fournier & Jeanrie, 2003).
Having control over one‟s job is central to the job demand-control model
(Karasek & Theorell, 1990), and the subsequent research has explored the effect of
decision latitude (Demerouti, Geurts, & Kompier, 2004), autonomy (Baard, Deci, &
Ryan, 2004) and control (S. C. Clark, 2002) in the workplace. Being able to control
the pace or one‟s work, how and when decisions are made and how skills are used
increases job satisfaction and reduces the incidences of burnout in employees
(Bakker et al., 2004; Grandey, Fisk, & Steiner, 2005; Karasek & Theorell, 1990;
Prottas & Thompson, 2006; Theorell, 2003).
A sense of control also links to the need for autonomy for general well-being
(Hahn & Oishi, 2006) and personal mastery (Lachman & Firth, 2004; Moen et al.,
2004). Dealing with stressors requires a sense of control over oneself and the
situation, with authority over decisions, the ability to use one‟s skills and the choice
of when to deploy those skills components of that process (Lachman & Firth, 2004;
Theorell, 2003). Having flexibility in when and where a role is enacted is part of the
resources that a role can generate, allowing individuals to feel that they can control
the timing of their activities (Greenhaus & Powell, 2006). In the study of self-
reported time management behaviours, setting goals and priorities, using the
mechanics of time management and a preference for organization were significantly
related to perceived control of time (Macan, 1994; Macan et al., 1990). In working

60
adults who were part time university students, increased perceived control of time
decreased the interference from work-to-home and from home-to-work and resulted
in better health and greater job satisfaction (Adams & Jex, 1999). Locus of control is
regarded as an important part of adaptive and competent life (Lachman & Firth,
2004), yet research on the perceived control of time is limited. Given the scarcity of
time reported anecdotally with regards to work-life balance, further research to
understand perceived control of time as part of a sense of control will be a useful
addition to the research literature.
In summary, the generative disposition can be seen through the self-
regulation that the active person interacts with their environment. The way in which
individuals pursue their goals, by using feedback loops to assess their progress
(Carver & Scheier, 1998) and using the positive affect generated by reaching their
goals to maintain their interest and reinforce their actions (Fredrickson, 1998) is
readily understood as a logical extension of the person themself. The dynamic nature
of self-regulation is implicit in the proximal processes driving development and the
role of the generative disposition in shaping those proximal processes. Dispositional
optimism, coping self-efficacy and control of time will capture the way that
individuals are working towards their goals, whether internal or externally motivated.
Succeeding at those goals will encourage persistence in the future toward goals that
are relevant at that time.
1.3.9 Theories of the demand characteristics of P, the person occupying and
managing multiple roles
The second component of Bronfenbrenner‟s active participant that will be
considered and measured in the current thesis is the individuals‟ demand
characteristics, as the ways in which the active participants cope, manage and
61
interact with their environment. Demand characteristics will be considered as
humour (Abel, 2002; Lefcourt, Davidson, Prkachin, & Mills, 1997; R. A. Martin,
Puhlik-Doris, Larsen, Gray, & Weir, 2003) and social skills and support (Ferris,
Witt, & Hochwarter, 2001; van Ypern & Hagedoorn, 2003). These characteristics
have been shown to improve coping with life stressors through effective problem
solving and stronger interpersonal relationships and also are similar to the resilient
personality associated with personality traits (John & Srivastava, 1999), but more
specifically defined.
The behaviours associated with demand characteristics are viewed in the
current thesis as the ways in which individuals react and deal with other people in
their daily life. Adaptation and coping as ways to manage the increasing complexity
of life as one ages and matures and has more responsibility at home and at work.
Problem solving becomes an increasing complex activity as the individual gains
increasing experience with situations and relationships as they age. The adaptive
strategies that adults develop to cope and manage start in childhood and become
increasingly sophisticated in adulthood (Skinner, Edge, Altman, & Sherwood, 2003;
Skinner & Zimmer-Gembeck, 2007), with the ultimate aim of achieving a wise old
age (P.B. Baltes et al., 1998). Viewed in this way, coping with stressors is seen as
reacting to what has occurred (Folkman & Moskowitz, 2004), whilst forward
planning, looking for possible pitfalls and opportunities, and taking suitable
precautions is proactive coping (Aspinwall & Taylor, 1997; Schwarzer & Taubert,
2002). Coping is most often framed as the response to significant, catastrophic events
such as the loss of loved one, whilst everyday life is more of chronic stressors within
the home or workplace, which could be, within reason, thought of, foreseen and
planned for in some way. For example, it is difficult to prepare for a sudden accident
62
or loss, but easier to prepare for the daily routine and work commitments by
marshalling resources and planning to facilitate the smooth running of these routines
and commitments. By foreseeing likely or possible difficulties and challenges and
making appropriate plans, proactive coping brings to mind the adage, „a stitch in time
saves nine‟ (Aspinwall & Taylor, 1997).
For the purposes of the current thesis, the ability to cope and manage
interactions will be taken as humour and social skills. The first component of the
demand characteristics, humour is seen as a multi-dimensional construct of related
traits, such as making and appreciating jokes, laughing easily, being cheerful and
looking at the world positively, and lastly, using humour in response to stressful
situations (R. A. Martin et al., 2003). In the current thesis, the use of humour will be
limited to its use as a coping strategy.
Freud saw humour and joking as the ego‟s defense against distressing events,
replacing unpleasant affect with pleasant affect (Freud, 1995). These unconscious
ego defenses were considered rigid, under little volitional control and resulted in
anxiety when defensive behaviours were blocked, whereas coping strategies were
consciously used and more flexible in solving problems (Plutchnik, 1995). Vaillant
(2002) concluded that defense mechanisms could be graded maladaptive/immature or
adaptive/mature with the adaptive defense mechanisms being humour, altruism,
suppression, sublimation and anticipation. Mature defenses describe how individuals
„turn lemons into lemonade and not turn molehills into mountains‟ (p206). In the
context of the mature defenses, humour allows the individual to confront and face
uncomfortable situations in ways that make the situation less painful and easier for
the individual and others to deal with (Vaillant, 2000). Measuring defense
mechanisms is proposed for future editions of the Diagnostic and Statistical Manual
63
of Mental Disorders, to be added to Axis V to expand the information available on
client functioning (American Psychiatric Association, 2009).
Using humour to manage stress appears to rest with the cognitive shift in
perspective, which leads to a shift in affect (R. A. Martin & Lefcourt, 1983). Of
course, humour in response to a stressful situation is more acceptable than anger or
violence toward the stressor (person or object) (Lefcourt, 2002a)! Humour can also
act as an interpersonal tool, making the individual more pleasant company through
their jokes or humourous views, although humour can be used in a derogatory or
self-deprecating way that is hostile to others (Lefcourt, 2002b; R. A. Martin et al.,
2003). However, the focus in the current thesis will remain with humour as a coping
strategy, rather than as an interpersonal style. By recognising that humour is highly
adaptive, a pathology-based view of human functioning can be broadened to include
human strengths, ensuring that the value of humour will be more widely recognised.
The second component of the demand characteristics is the importance of the
relationships between the individual and those around them and the social support
and well-being that these relationships bring (Reis, Collins, & Berscheid, 2000).
Social support can be considered as instrumental (as in material aid), informational
(as in relevant solutions) or emotional (S. Cohen, 2004). As noted for depression,
poor interpersonal styles and social skills contribute to depressive symptoms whilst
social support is well known to buffer the individual from the effects of stressful
situations (S. Cohen & Wills, 1985). Interestingly, along with the social support that
derives from close family and friends, giving social support to those around one is
beneficial for the individual‟s well-being (Brown, Nesse, Vinokur, & Smith, 2003).
Social integration with people outside the strong ties of one‟s close relationships is
also important and these weak ties are important for social cohesion and a sense of a

64
civil society (Granovetter, 1973). The loss of weak ties fragments the community, as
shown in former communist East Germany where distrust of causal interactions for
fear of political betrayal undermined the casual goodwill and reduced social
integration under communism (Volker & Flap, 2001). A sense of trust within the
information that these weak ties can bring enables transfer of useful knowledge
within a business setting (Levin & Cross, 2004) whilst improving the likelihood of
finding jobs for women (Crowell, 2004) and finding gigs for rock and roll bands
(Reed, Heppard, & Corbett, 2004).
In summary, the active individual‟s demand characteristics are the processes
that underpin the actions and adaptations that an adult makes in order for their life to
function in a meaningful and purposeful way. Using the self-regulation model as a
basis for study allows for the inclusion of interpersonal actions, as the humour which
the individual uses and the social skills with which they deal with other people. More
positive interpersonal skills are expected to increase the well-being and mental health
of individuals, adding to the benefits of the active participant, outlined in the
previous section.
1.3.10 Humour
Including humour as a method that individual can bolster their personal
resources allows the many ways in which humour can aid positive mental
functioning to be explored. For example, humour is involved in stress relief (Abel,
2002; Seaward, 2004), in improving learning outcomes (Tamblyn, 2003), in
increasing positive affect (Larsen & Prizmic, 2004) and buffering the effect of
rumination in dysphoric individuals (Olsen, Hugelshofer, Kwon, & Reff, 2005).
Humour may not seem a „serious‟ component of psychological functioning but it
permeates everyday life. It is so commonplace in social interactions and managing

65
distress that humour appears to be almost invisible as a factor that should be included
in understanding how individuals successfully manage their work and family lives.
From Freud to current research, adaptive humour has been shown to smooth
interpersonal relations and buffer negative emotions.
After considering the growth and maturity of the participants of the Study of
Adult Development, Vaillant (2002) concluded that defense mechanisms could be
graded maladaptive/immature or adaptive/mature, with the adaptive defense
mechanisms being humour, altruism, suppression, sublimation and anticipation.
Mature defenses describe how individuals „turn lemons into lemonade and not turn
molehills into mountains‟ (p206). In the context of the mature defenses, humour
allows the individual to confront and face uncomfortable situations in ways that
make the situation less painful and easier for the individual and others to deal with
(Vaillant, 2000). For the participants of Vaillant‟s study, having mature defenses at
age 50 was the second strongest predictor (after non-smoking or early cessation of
smoking) of psychosocial health and being „Happy-Well‟ (literally happy and well)
at age 75-80. Those individuals who were classed as „Sad-Sick‟ (literally
sad/unhappy and sick /unwell) used very few mature defenses and had poorer
outcomes as a result (Vaillant, 2002). Similarly, among employees of organizations
undergoing major changes, those with higher levels of humour (as an adaptive
defense) were less likely to resist the changes that were occurring and have better
mental health (Bovey & Hede, 2001).
It is interesting to note that the description of humour as a defense mechanism
(American Psychiatric Association, 2000) are similar to the wording used in the in
the Coping Humour Scale (CHS, R. A. Martin & Lefcourt, 1983) and to the
affiliative, self-enhancing and aggressive styles of the Humor Styles Questionnaire

66
(HSQ, R. A. Martin et al., 2003). Among adolescents, there were significant positive
correlations between humour as a defense and affiliative and self-enhancing styles
and significant negative correlations with the aggressive style (S. J. Erickson &
Feldstein, 2007). Defense mechanisms are proposed for future editions of the
Diagnostic and Statistical Manual of Mental Disorders, to be added to Axis V to
expand the information available on client functioning (American Psychiatric
Association, 2009). By recognising that humour is highly adaptive, a pathology-
based view of human functioning can be broadened to include human strengths,
ensuring that the value of humour will be more widely recognised.
Following on from the psychodynamic viewpoint, humour can then be
considered as part of Bronfenbrenner‟s conception of the developing person‟s
demand characteristic. As such, humour influences the way that individuals interact
with the world around them and manage the situations they face. Humour represents
cognitive-affective reappraisals that makes situations less threatening and is therefore
important to stress relief (Abel, 2002), maintaining relationships and resolving
conflict (D. W. Johnson, 2003), reducing negative affect and increasing positive
affect (Larsen & Prizmic, 2004), resilience (Kumpfer, 1999) and enjoyment in life
(R. A. Martin, 2001).
Recent research on the interpersonal use of humour has highlighted the
adaptive and maladaptive aspects of humour as the individual uses humour upon
themselves or others which has greater predictive power and usefulness to research
(R. A. Martin et al., 2003), overcoming conflicting and ambiguous results about
humour‟s role in health and well-being in research (R. A. Martin, 2001). The
Humour Styles Questionnaire details the interpersonal use of humour. Adaptive
humour directed towards self is self-enhancing and is a humorous view of life and

67
adaptive humour directed toward others is affiliative, fostering relationships,
reducing tension and providing amusement. Maladaptive humour directed toward
others, however does not provide amusement as it is expressed as sarcasm and
teasing and as humour that is intended to hurt and ridicule. When maladaptive
humour is used toward oneself, the humour is self-defeating and involves excessive
self-criticism to make others laugh and is linked to depression, anxiety, and hostility
(R. A. Martin et al., 2003). The distinction between adaptive and maladaptive can be
fine, however with care needed to avoid disrespectful humour taking hold within
relationships, changing affiliative humour into aggressive humour. In the workplace,
maintaining this distinction maintains team cohesion, promoting creativity and
problem solving, without causing offence or reducing managerial effectiveness
(Lyttle, 2007).
Humour, measured as sense of humour, moderated the perception of stress
among college students (Abel, 2002). Whilst women reported they had more
problems than men, there was no interaction between gender and humour on
perception of stress. Where there were few problems in the students‟ daily lives,
students with a better sense of humour perceived that they had less stress than did
those with a lesser sense of humour. The high humour group also reported using
more planning and problem solving to overcome their problems. These results
indicate that, despite having the same number of problems, the high sense of humour
group perceived that they were significantly less stressed than the students with a
lower sense of humour. Similarly, students with a stronger sense of humour used
positive action toward problems in everyday life, which is likely to have lead to the
perception that they have less stress in their life (Abel, 2002).
A study of the interaction between gender, humour (as the Coping Humour

68
Scale) and blood pressure following stressful tasks (e.g. a Favourable Impressions
task) found that men and women had different patterns of responses (Lefcourt et al.,
1997). Women with greater humour had lower blood pressure across all tasks, whilst
among men greater humour was associated with higher blood pressure. The authors
proposed that the results reflected gender differences in the way that humour was
expressed; women used humour as a coping strategy to laugh at their efforts in
attempting the difficult tasks, whereas men were possibly more competitive and
joking, as a way to use humour was less appropriate or useful to moderate their stress
responses (Lefcourt et al., 1997).
Similar results were found among students solving puzzles, where women
with greater trait humour in the high stress condition had lower anxiety and greater
positive affect, whereas the men did not have the same relationship (Abel &
Maxwell, 2002). Using humour in social situations improved the enjoyment and
confidence that students had in their social interactions, as well as the length of
interaction with their peers, particularly when students had low levels of depression
(Nezlek & Derks, 2001). Humour has roles in group solidarity and courtship
(Weisfeld, 1993) with greater humour is associated with less depression, anxiety and
negative affect (Kuiper, Grimshaw, Leite, & Kirsh, 2004; Thorson, Powell,
Sarmany-Schuller, & Hampes, 1997) and greater levels of global and social self-
esteem and more positive affect (Kuiper et al., 2004). The benefits of humour can be
increased by deliberately increasing one‟s enjoyment from watching an amusing
film. Female students reported greater enjoyment and laughed and smiled more when
instructed to see the films in the funniest possible way and physiological responses
were also increased (Giuliani, McRae, & Gross, 2008). The results are consistent
with the use of humour to increase positive affect (Larsen & Prizmic, 2004) and

69
indicate that deliberate positive cognitive reappraisals offer a way to manage difficult
situations (Giuliani et al., 2008).
In considering which of the measures of humour to use for the current thesis,
two measures were considered, the Coping Humour Scale (CHS, R. A. Martin &
Lefcourt, 1983) and the Humour Styles Questionnaire (HSQ, R. A. Martin et al.,
2003). There were strong relationships between the Coping Humour Scale and
positively, the affiliative and self-enhancing scales and negatively the aggressive
scales but not with the self-defeating scale (R. A. Martin et al., 2003). The CHS and
the HSQ also overlap in their associations with mental health and well-being. The
CHS was chosen as it was shorter (7 items) and gave similar outcomes to the much
longer HSQ (32 items). As the focus of this thesis on adults managing their everyday
lives, measuring humour as coping, rather than interpersonal use, becomes more
appropriate in this case. As adaptive humour is ubiquitous to positive psychological
outcomes, the current research will investigate the extent and nature of the influence
of humour as a coping mechanism on well-being and the work-life interface.
1.3.11 Social skills and relationships
Relationships give rich meaning of life as the need to belong is a fundamental
human motivation. Satisfying, long term relationships provide positive experiences
and emotions, which protect against mental distress (Baumeister & Leary, 1995),
depression (Lin, Ye, & Ensel, 1999) and ill health (S. Cohen, 2004) and underpin
happiness and life satisfaction across cultures (Haller & Hadler, 2006). Social
support can operate directly, through membership of social networks and indirectly,
through the buffering of stress by providing functional support to deal with stressors
(S. Cohen & Wills, 1985). In this way, there are interconnections between perceived
social support, supportive relationships and supportive networks that benefit the

70
individual in the way that they cope with threats or challenges in their lives (Pierce,
Sarason, & Sarason, 1996). For low income families in the US, greater social support
reduced their perception and actual experience of economic hardship and reduced the
need to seek help from outside means, such as pawning their goods. This support
allowed these individuals and families to manage their everyday needs without
falling into further hardship (Henley, Danziger, & Offer, 2005).
As an extension of this conception of social support, the roles that an
individual occupies then provide social capital which is another resource that the
individual can draw upon in challenging times (Greenhaus & Powell, 2006; Hobfoll,
2002), with more social roles also protecting the individual from ill health (S. Cohen,
2004). Because social relationships involve more than just the individual,
relationships act as powerful drivers for development. Social relationships change
over time and are dependent of life stage and age (Moen, 2003; Reis et al., 2000).
For example, parent-child relationships, marriage (or long-term commitments), long
term friendships and working relationships can all promote close personal bonds and
relationships that will lead to greater happiness and more competent development
over time (Reis et al., 2000).
Of interest to the current research is the manner in which individuals interact
with the people around them to explore the effects of the active participant‟s demand
characteristics. Interpersonal skills are implicated in the development and
maintenance of depression. Excessive reassurance seeking in mildly dysphoric
individuals create negative interpersonal situations with others which can intensify
depressive symptoms (Joiner & Metalsky, 2001), whilst young college men with
dysphoria and poorer social skills were more likely to be rejected by their room
mates (Joiner & Metalsky, 1995). The room mates of depressed students were also

71
more likely to become depressed themselves, indicating that poor interpersonal skills
can make depression contagious (Joiner, 1994), while students who were highly
dependent on others were more likely to become more depressed when they had
more interpersonal stressors (Shahar, Joiner, Zuroff, & Blatt, 2004). In the opposite
way, the individual who has better social skills can improve their job performance in
situations where organization support is limited (Hochwarter, Witt, Treadway, &
Ferris, 2006).
The availability of social support from one‟s partner and family has been
shown to reduce work-family conflict and moderate the effect of parental overload
among Indian employees (Aryee, Luk, Leung, & Lo, 1999). Among employees
working in remote Australian mining communities, isolation from family reduced job
and family satisfaction whilst community involvement and kinship support benefited
job and life satisfaction (Iverson & Macguire, 2000). Seeking social support helped
police officers reduce the psychological distress felt from their work, as did problem-
focused coping (G. T. Patterson, 2003). In the workplace, informal support from
managers and supervisors is critical to the implementation of family-friendly work
policies, as without the daily compliance and belief in these policies, conflict
between roles is almost inevitable (Behson, 2002, 2005; Dikkers, Geurts, den Dulk,
Peper, & Kompier, 2004; C. A. Thompson, Beauvais, & Lyness, 1999). In a daily
diary study, the most frequent cause of distress in the workplace was interpersonal
conflict, accounting for three quarters of the reported negative incidents, whilst
workload accounted for only a small proportion reported (Schwartz & Stone, 1993).
Similarly, the support from spouse, children, family and kin are keys to the resources
of the home domain, whilst a safe neighbourhood and supportive friends are
resources of the community (Voydanoff, 2005a). Interestingly, longitudinal research

72
found that giving instrumental support to friends, relatives and neighbours and
emotional support to one‟s spouse associated with reduced mortality among older
adults (Brown et al., 2003). Therefore, it is possible that it is the act of helping that
brings the benefits of being actively engaged and connected with people.
Feeling connected with other people, either at home, at work or in the larger
community, has the potential to be a protective factor to promote resilient
development (Donald & Dower, 2002), and is based on the how a person rates
themselves in relation to others, as a sense of belonging and assurance (Lee &
Robbins, 1995). It is not only the direct and strong relationships that provide social
support but the looser, weak ties of casual relationships within the community that
can assist the individual (Granovetter, 1973). As noted in the previous paragraphs,
poorer interpersonal skills limit interpersonal relationships and therefore the
opportunities for weak ties to operate and increase available opportunities. For
example among rock musicians, emerging artists used social networks to finance
their early efforts, gather fans and find gigs (Reed et al., 2004). Having trust in the
competence of these casual networks allows useful knowledge to be disseminated
throughout companies (Levin & Cross, 2004), whilst the absence of trust, as shown
in former Communist countries, diminished social integration as weak ties were a
liability rather than an asset (Volker & Flap, 2001). Weak ties are an asset because
acquaintances move in different social groups and therefore have access to different
information than one‟s close friends, who are in the same social group. In this way,
acquaintances can become better and varied sources of job information (Krauth,
2004) as well as acting as conduits between different groups (Kavanaugh, Reece,
Carroll, & Rosson, 2005). Increasing the number of women in the working
population also increased their opportunities to access the information and
73
opportunities provided by weak ties (Crowell, 2004).
In the current research, interpersonal processes will be measured both as
social skills and social support. Social skills will be measured to capture the ability of
the individual to deal effectively with other people. By including the individual‟s
social skill in the study of the work-life interface, the component of the individual‟s
demand characteristics can be included to fully understand the individual‟s life. The
social support available from work colleagues and the support of managers for work-
life initiative will also be measured and will be discussed in the following section on
the context of the work-life interface.
1.3.12 Conclusion for P, the Person
Optimal functioning relies on the strategies that the active individual uses to
organise their life as defined by Bronfenbrenner (Bronfenbrenner & Morris, 1998,
2006) and indicated in the resilience framework (Kumpfer, 1999). In the current
thesis, self-regulation (Carver & Scheier, 1998; Scheier et al., 1994) is considered the
predominant way in which the individual will enact their lives. As the work-life
interface requires the individual to fulfil competing demands, problem solving,
emotional and avoidant styles of coping can be both helpful and dysfunctional for the
individual, depending on the context and the individual‟s appraisal (Folkman &
Moskowitz, 2004). As a way of action regulation, the choice of strategy relies on the
nature of the stressor (challenge or threat), to whom the stressor related (self or other)
and which of three needs, autonomy, relatedness and competence is being stressed
(Skinner et al., 2003). Optimism increases the attention that the individual pays to
challenges that are relevant to them and increases the use of proactive behaviours to
manage the challenges (Armor & Taylor, 1998; Aspinwall & Brunhart, 2000). The
needs that these coping strategies seek to maintain are essential for personal growth
74
and happiness and are shared across cultures (Baard et al., 2004; Hahn & Oishi,
2006). As noted previously, competence is the need to successfully meet the
challenges of life and have positive outcomes. Autonomy is the ability to choose
one‟s action and make one‟s own decisions and relatedness is the desire for
reciprocal and meaningful relationships (Baard et al., 2004; Ryan & Deci, 2000). It is
expected that in the multiple regression analyses of Study 1, that the characteristics
of a generative disposition and positive demand characteristics will be predictive of
greater well-being and work engagement, better mental health and less burnout.
The longitudinal nature of the current research project, explored in Study 2,
will be able to examine whether there is any causal link between individual
differences, the work-life interface, and well-being and mental health, and test the
relationships between engagement and burnout. In the work-life interface, both loss
and gain spirals of resources have been found, with exhaustion and work-home
interference having reciprocal, reinforcing relationships over time (Demerouti,
Bakker, & Bulters, 2004) whilst engagement at work increased professional efficacy
which in turn fostered perceptions of greater work resources (Llorens et al., 2007).
Whilst resilience in childhood and later life are well understood, resilience in adults,
in the context of their working lives is more often framed as coping with work stress.
The link between resilience and competence can be understood as the well adapted
child‟s functioning under high to low adversity, respectively (Masten & Reed, 2002).
As such, resilience could be seen as the actions of competent individuals when they
are challenged. The development of competence and optimal functioning is relatively
unexplored in adulthood, where work and life conditions are more likely to be
chronically challenging, rather than traumatic (Beasley, Thompson, & Davidson,
2003; Grzywacz, 2000). In this way, the current research will add to the literature by

75
bringing the individual, as defined by their gender and generative disposition
(measured by their dispositional optimism, self-efficacy and sense of control) and
their demand characteristics (measured as their humour and social skills) into
understanding the well-being, mental health, burnout and work engagement of
working adults.
1.4 Understanding C, the Context for multiple roles
1.4.1 Theories and models of C, the Context for multiple roles
In the discussion of the bioecological theory, the elements of the context were
described by the roles, activities and relationships that the individual engaged in
within each setting (Bronfenbrenner, 1979). The theoretical underpinning of C, the
context, then will be taken as those theories that surround these roles, activities and
relationships with the understanding that each of these are also influenced at the level
of the microsystem, mesosystem or macrosystem. Roles, for example, can be
explored through Role Theory which can have several outcomes. The first outcome
is the salience of occupational or parental roles (microsystems), the second as
spillover between roles (mesosystem) and last as socialization of gender role
attitudes that arise from the cultural expectations of the macrosystem. As noted in the
discussion on the individual‟s demand characteristics, relationships can be explained
through social support and family systems. The activities within and between
domains can be explored through job conditions, family structure and recreational
activities. The theories about the work-life interface reflect the first and last
components; with much of the U.S.-led research based on the consequences of
occupational roles whilst the European research focuses on the effects of the
occupational activities such as the demands and resources available through a job.
The importance of relationships in the workplace is acknowledged in the European

76
research, with the expansion of the Demand-Control model (Karasek & Theorell,
1990) to become the Demand-Control-Support (DCS) model (Van Der Doef &
Maes, 1999) to include the beneficial influence of the social support received from
managers and co-workers.
There are a number of models and theories around the work-life interface, of
which role theory (Greenhaus & Beutell, 1985; Kahn et al., 1964), spillover (Frone,
Russell, & Cooper, 1992a), ecological systems theory (Grzywacz and Marks, 2000),
the demand-resource models (Bakker & Geurts, 2004; Demerouti, Geurts et al.,
2004; Van Der Doef & Maes, 1999), and the work-life interface model (Voydanoff,
2002, 2005b) will be considered. Role theory has given rise to spillover, ecological
and work-life interface models and all these models of work and non-work settings
have common features of demands and resources, but emphasize different aspects of
role involvement and outcome. The following discussion will examine the divergent
views on the work-life interface, although these strands are becoming more similar
today.
Role theory (Goode, 1960; Kahn et al., 1964) has formed the basis for much
of the U.S. led research on the work-life interface with the expectations and activities
associated with occupational roles long being considered important to an individual‟s
well-being and mental health (Bronfenbrenner, 1979; Katz & Kahn, 1978).
Considerable research about work-life issues has followed from Greenhaus and
Beutell‟s (1985) definition of work-life conflict, as „a form of inter-role conflict in
which the role pressures from the work and family domains are mutually
incompatible in some respect‟ (p77). Inter-role conflict was seen as being time-
based, strain-based and behaviour-based, with sources of conflict coming from both
work and family roles and defined by working conditions and/or family structure.

77
Specifically, that the time devoted to one role prevented participation in another role,
that the strain (measured as anxiety, fatigue or depression) resulting from one role
made it difficult to fulfil other roles, and last and least common, that the behaviour
required by one role was incompatible with the behaviour needed to fulfil another
role (Greenhaus & Beutell, 1985). There is an extensive and exhaustive research
literature on the sources of work-life conflict and decreased well-being that follows
many years of investigation (Bruck, Allen, & Spector, 2002; Butler, Grzywacz, Bass,
& Linney, 2005; Byron, 2005; Carlson, Kacmar, & Williams, 2000; W.J. Casper,
Martin, Buffardi, & Erdwins, 2002; Cinamon & Rich, 2005; Eby, Casper,
Lockwood, Bordeaux, & Brinley, 2005; Kinnunen, Vermulst, Gerris, & Makikangas,
2003; Kossek & Ozeki, 1998).
However, focusing only on conflict can obscure the beneficial aspects of
combining occupational and personal roles. Expanding role involvement and
commitment to enjoyable and meaningful activities, and through social relationships,
can increase an individual‟s time and energy (Marks, 1977). Role balance occurs
then when role quality and enjoyment meet and individuals experience more ease
and less strain in performing their roles (Marks & MacDermid, 1996). For example,
when the negative and positive sides of roles were considered together in a national
survey, the most positive outcomes such as better mental health and reduced alcohol
dependence were associated with lower work-family conflict and greater work-
family facilitation (Grzywacz & Bass, 2003).
Spillover between work and family lives combines both conflict and balance
views. Research by Frone and colleagues has established an integrated four factor
model of spillover that formed work-family balance, with the direction of influence,
either work-to-home or home-to-work, and the quality of influence, either conflict or

78
facilitation, explaining the work-life interface (Frone, 2003; Frone, Yardley, &
Markel, 1997). This typology can be known by other names, for example, work-
family conflict described as negative work-family spillover and family-work
facilitation described as positive family-work spillover. The relevant designation has
the quality of the interaction, positive or negative, followed by the direction of the
spillover, either work-to-family or family-to-work (Grzywacz & Marks, 2000b;
Kinnunen, Feldt, Geurts, & Pulkkinen, 2006). As with the predictors of conflict,
facilitation of work is associated with work-domain factors, such as supervisor
support, and facilitation in the personal domain is associated with personal-domain
factors, such as spousal support (Frone, 2003; Grzywacz & Butler, 2005; Grzywacz
& Marks, 2000b).
The ecological system approach of Grzywacz and colleagues uses
Bronfenbrenner (1979) to address contextual factors of work-life and successfully
replicates the four-fold taxonomy of Frone and colleagues (Frone et al., 1997). The
person factors however are less well explored as the person is narrowly defined by
gender, neuroticism, and extroversion. Resources in both domains, such as decision
latitude or spouse support, reduced negative spillover and increased positive spillover
in either direction (Grzywacz & Marks, 2000b). Recent research has extended the
role theories to account for the demands and resources in each setting that lead to
conflict and facilitation (Voydanoff, 2002, 2004b) and further elaborate how
enrichment can occur (Carlson et al., 2006; Greenhaus & Powell, 2006). These
developments address shortfalls in previous conceptualisations of the work-life
interface and account for the both positive and negative aspects of working life.
In Europe, the major focus of the work-life interface has been the Demand-
Resource-Support model (Geurts & Demerouti, 2003; Geurts, Kompier, Roxburgh,

79
& Houtman, 2003) as an extension of the Demand-Control-Support model of healthy
work (Karasek & Theorell, 1990). Sharing similarities with the model proposed by
Frone and colleagues (1997), interference (positive or negative) between work and
home is considered the result of the interaction of work and family characteristics,
which included both demands and resources within the domain. In a sample of postal
workers in Holland, for both genders the strongest association for negative
interference from work-to-home was with job demands, whilst job support predicted
positive interference for work-to-home (Demerouti, Geurts et al., 2004) and in call
centre workers, job resources reduced the impact of job demands and burnout
(Bakker, Demerouti, & Euwema, 2005).
There is a convergence of the ecological systems approach (Grzywacz &
Marks, 2000b), the European demand-resource-support approach (Bakker,
Demerouti, & Schaufeli, 2003; Demerouti, Geurts et al., 2004), and the expansion of
work-life conflict to enrichment (Carlson et al., 2006; Greenhaus & Powell, 2006) in
the conceptual models proposed by Voydanoff (Voydanoff, 2002, 2005b). The
ecological systems serve as the framework, with role theories providing the direct
and indirect linkages as demands and resources between the work-family interface
and the outcomes and stress theory giving guidance to the adaptive strategies that
may use be used (Voydanoff, 2005). Work demands are to be offset by family
resources, and vice versa, whilst boundary-spanning strategies are aimed at reducing
demands and increasing resources available to the individual. Whilst Voydanoff‟s
model is theoretical and as yet untested directly, many of the variables listed have
been empirically tested in other research and the model brings together a number of
theoretically similar but differently worded models from other researchers, such as
Frone, Grzywacz, Barnett, Geurts, Demerouti, and Bakker.

80
The disadvantage of Voydanoff‟s model, however, is that the individual is not
deeply ingrained in the process, being only slightly described first by gender, social
class, and race and second as self-esteem and mastery associated with coping
strategies. The active participant is not accounted for and Voydanoff acknowledges
that such research is limited. Frone (2003) also notes that personal characteristics
have had only limited inclusion in the variables studied around the work-life
interface, and this lack hampers a full understanding of work-life issues.
Designing a research framework that incorporates both the active participant
with a broad and inclusive understanding of the work-life interface will address these
shortcomings and fill a gap in the work-life literature. Understanding the factors that
an individual can change themselves could inform future intervention programs. If
only workplace or organizational factors are important, then the individual is passive
and may have no recourse to changing their work-life interface. If as hypothesised,
individual differences are important to well-being of working adults, then the
participant can be active in managing and adapting their circumstances to best suit
their particular situation and needs.
1.4.2 Direction for the literature review of C, the context
From these theories, the work-life interface can be understood as a balance
between the demands and resources upon the individual and actioned by the
strategies that reduce demands and increase resources. Voydanoff (Voydanoff,
2005b) summarized the extensive research on the work-life arena to show that
demands and resources are both within each domain and span the boundaries
between domains. Much of the US research is based on the Michigan Organizational
Stress model (Kahn et al., 1964), whilst the European research perspective comes
from the Job Demand-Control-Support model (Karasek & Theorell, 1990) and the

81
Jobs Demand-Resources (Demerouti, Bakker, Nachreiner, & Schaufeli, 2001)
models. The latter European perspectives will be the framework for the workplace
factors used in this thesis, whilst the US research based on roles will be the
framework for the spillover between roles. The negative discourse of early research
on the work-life interface (Greenhaus & Beutell, 1985) has been expanded to include
the positive interactions (Greenhaus & Powell, 2006) between work and family
domains which will be considered here as the quality and direction of the spillover
between roles (Grzywacz & Marks, 2000b).
Across the different research paradigms, there is general agreement on what
constitutes the demands and resources of the work-life interface. Work demands
within the domain include work hours (paid and overtime), workload and job
insecurity, whilst the border-spanning demands include travelling away from home
for work and working at home. Family domain demands can include care for young
children or elderly relatives, household chores and responsibilities, whilst boundary-
spanning demands are the commute to work and family responsibilities that intrude
on the work day. Resources on the other hand are the things that make life function
more easily, such as autonomy at work, the support of supervisors and co-workers, as
well as support from family and relatives, the activities that give rewards for the
efforts that are made, such as pride in one‟s work or parental rewards. Boundary-
spanning resources include spousal employment, assistance from partner and family
with family responsibilities (Voydanoff, 2005b). The Conservation of Resources
theory (Hobfoll, 1989, 2001, 2002) views resources of primary importance to stress
and burnout processes. Ii is proposed that individuals will be distressed by the loss,
the threatened loss or the failure to gain resources after appropriate effort. Hobfoll
(Hobfoll, 2001) lists the resources that individuals value in their own right and as

82
ways to accrue more resources over time which he proposed that individuals will
strive to do, to act as buffers in future challenging times. Examples of these resources
include sense of optimism, time for work, time with loved ones, positive challenging
routine, personal health, feelings of control over life, and the ability to organize tasks
(Hobfoll, 2001). In line with Bronfenbrenner‟s model, such actions to accumulate
resources would lead the active individual to interact with their environment in ways
that promote their competent development in the longer term.
The following review will highlight the factors that will be considered in the
analyses to be conducted in the thesis, with the emphasis on workplace resources.
From the theories outlined in the previous section, these factors will represent the
roles, activities and relationships that the individual has in their environment, to
capture Bronfenbrenner‟s Context. Working hours will be considered first as the
length of the working week is often considered as a major source of conflict for the
work-life interface. A discussion of the factors of the Demand-Control-Support
(Karasek & Theorell, 1990) model and the Demand-Resources model (Demerouti et
al., 2001) will follow, then affective commitment, managerial support and family
characteristics will complete this section. Finally, a consideration of multiple roles
and spillover will be given, including a comparison of job types, the importance of
roles (and some more about gender) and the influence of workplace and family
factors on spillover. The section finishes with a comparison of the different methods
of measuring and conceiving work-life balance and work-life fit which is
surprisingly not the same as work-family spillover.
1.4.3 Working hours and schedules
As noted in the section about gender and working, there are differing views
on working hours, such that long hours are a „work-life collision‟ (Pocock, 2003) or

83
are „extreme jobs‟ of great allure (Hewlett & Luce, 2006). Time-based conflict
between work and family roles has been a major focus of research since the early
conception by Greenhaus and Powell (1985), where inadequate time for both roles
was considered to be a significant source of strain for working adults. This section
will cover the length of the working week in Australia, consider the impact of
preferences and choice for working hours and choice, commuting (as part of the time
committed to work), whether the choice to work long hours is more important than
actual hours as choice is about personal flexibility of time rather than being the
organization being flexible for their clients, which is client-focused but not
necessarily employee-friendly.
In Australia, the Australian Bureau of Statistics (2006a) report that the
average working hours had fallen slightly from 39.7 hours per week in 1985 to 39.3
hours in 2005 for men and similarly for women, from 29.4 to 29.0 hours per week.
The standard week is defined as 35 to 40 hours per week, with full-time work as
greater than 35 hours per week. The decline in working hours reflects the increase in
both men and women who are working part-time. For full-time workers, the average
working week increased from 1985 to 2005 from 41.3 hours per week to 43.2 hours
for men and 37.6 to 39.3 hours per week for women. However, it should be noted
that the length of the working week peaked around the year 2000, at around 44 hours
per week before falling to the 2005 levels (Australian Bureau of Statistics, 2006a). In
the work-life literature, there is an extensive focus on the individual‟s who work very
long hours, which is considered to be those who work more than 50 hours per week.
The ABS data reports that 30 % of men and 16% of women work very long hours
and these people are in occupations that have high levels of self-employment, as
professionals, tradespeople, or sole-traders; managers and administrators; employers;

84
and employees in the mining industry. Longer working hours are also associated with
occupations or industries where part-time work is limited or practically difficult to
implement, such as for a self-employed person (Australian Bureau of Statistics,
2006a). It should also be noted that longer hours are usually associated with the
ability to earn greater incomes and more complexity than those who work less hours
(Barnett, 1998).
The debate about the effects of working hours on mental health and well-
being can be summarized as either a wholly negative influence, as a tragedy
(Relationships forum Australia, 2007) and a collision between work and family
(Pocock, 2003) or a more balanced understanding that working hours can be positive
and negative for the individual, labelling workers „conscripts or volunteers‟ (Drago,
Wooden, & Black, 2006, 2007) or wildly exciting, as an „extreme job‟ (Hewlett &
Luce, 2006). The differences may lie as much in the research paradigms of the
authors as consideration of the effects of work schedules. Whilst research has shown
that working schedules can be detrimental to mental health and well-being, it is
important to consider the role of the individual in choosing their occupation and
whether they take steps to take control of their situation and leave a job that is
counterproductive to their family responsibilities. The time demands of some jobs,
such as those in the multinational legal and accounting firms are well known and it
seems unreasonable to complain about work schedules whilst collecting an
enormously large pay packet. It is likely that for some people, the lure of wealth and
status could outweigh the appeal of close, personal relationships and they feel this is
an acceptable trade-off.
Whilst longer working hours are associated with more stress and feelings of
being overworked, compared to those working many fewer hours, this was often as a

85
result of immediate job demands rather than ongoing situation of high job demands
(Galinsky, Kim, & Bond, 2001). Care should be taken when simplistically comparing
employees on less than 20 hours per week and those working over 50 hours per
week, as two points are missed. First that people who are working part-time may
have very different life situations and motivations than those working full-time.
Second and perhaps more fundamentally, merely measuring long hours does not
determine whether the person has chosen their hours or it is a requirement of their
employment.
Employees who believe that they can not change their schedules or have little
flexibility are more likely to feel overworked than those with flexibility in their
schedule (Galinsky et al., 2001). Analysis of Waves 2 and 4 of the Household,
Income and Labour Dynamics (HILDA) study (Drago et al., 2007) classified
individuals working over 50 hours either as volunteers (who preferred their long
hours) or conscripts (who preferred less hours) and then compared both groups with
those people working less than 50 hours per week over two waves of data collection.
People who were long work hour volunteers over time recorded the highest wages
and were more than four times more likely to be self-employed whilst public servants
were significantly less likely to work long hours for whatever reason (Drago et al.,
2007). Being promoted and being self-employed, however, gave mixed outcomes as
both were associated with voluntarily working longer and with being conscripted to
work longer. The extra responsibilities of one‟s own business as well as a new
position mean that extra hours can be a burden as well as a challenge. Debt was
associated with the conscript groups, perhaps indicating that „work and spend‟ is a
persistent cycle over time although a significant number of former conscripts with
debt do become volunteers for longer hours (Drago et al., 2007). Interestingly,
86
women, either as parents or non-parents were less likely to work voluntarily or
involuntarily work longer hours over time (Drago et al., 2007) which confirms the
ABS data that only 16% of women work over 50 hours per week (Australian Bureau
of Statistics, 2006a). For mothers, combining their work, their partner‟s work and
family and children activities, it was the time pressure of these schedules and
achieving the necessary family flexibility to maintain these schedules that was
problematic rather than work hours per se (Baldock & Hadlow, 2004).
Is it reasonable to conclude that there a „time squeeze‟ happening?
Hochschild (1997) interviewed middle and upper management of a large Fortune 500
corporation and stated that for most, work felt like home and home felt like (hard)
work. Employees therefore preferred working long hours, as their home life was less
attractive than their work role. However, research from the Survey of Ohio‟s
Working Families tested this view in a community sample and did not support
Hochschild‟s proposition that workers unhappy at home would work longer hours.
Rather the survey found that demanding immediate supervisors but not
organizational policies predicted longer work hours, as did having a higher
education, working for a larger organization, being at a higher level of management,
having a professional occupation or being male (Maume & Bellas, 2001). In the
National Study of Families and Households in the USA, working hours for couples
was based on whether both spouses worked (for example, traditional or dual career
couples), employer demands, and the nature of the work involved (Clarkberg &
Moen, 2001). Traditional couples (husband full-time, wife at home) and dual-career
couples were more likely than neo-traditional couples (husband full-time, wife part-
time) to have schedules that they preferred. For this sample, the work was „pre-
packaged‟ and „institutionalized‟ such that jobs come with expectations of workloads

87
and time commitments, particularly for professional and managerial appointments
that did not allow sufficient part-time work to satisfy employee requirements
(Clarkberg & Moen, 2001). Number of hours when considered alone, does not
provide sufficient information to determine if they are problematic as it is necessary
to understand more of the organizational context and the timing of working hours
before judging that.
There are also the individuals that choose to work very long hours, who work
in „extreme jobs‟. Whilst this is a very small proportion of working adults, there
seems to be many who are highly committed to their work for themselves or their
employers, earning very large incomes and thriving on the challenges that their work
brings (Hewlett & Luce, 2006) Rather than just consider hours, it is important to
consider the individual‟s preferred working hours. It is choice that is important, as an
aspect of control, as will be seen in the Job Demand-Control-Support model and the
Jobs Demand-Resources model that makes the difference with the effect of working
hours on mental health and burnout.
1.4.4 Demands and resources
Rather than discuss the separate elements of these two models of the
workplace, in this section the review will consider demands and resources together,
as this is way that this research is structured. It is interesting to note that European
research does not consider mental health outcomes, being concerned mainly with the
outcomes of burnout and work engagement, with the addition of ill health and the
intention to look for another job. From the perspective of research in the USA, rather
than use the terms, „demands‟ and „resources‟, factors of the workplace and family
are referred to as stressors and are applied largely to the work-life interface, rather
than the workplace alone, as is the case with a substantial portion of the European

88
research that is outlined here. As noted in the review by Voydanoff (2005b), there is
a convergence of research to understand that stressors and demands and resources are
essentially one and the same thing.
The research for the Job Demands-Resources model mostly consists of
structural equation models where the demands and resources are the latent variables
and the indicator variables are the individual components such as job autonomy, skill
discretion and psychological job demands. The Job Demand-Control-Support (DCS)
model arose from early research about the effect of poor working conditions on
cardiovascular disease among Swedish and American employees (J. V. Johnson &
Hall, 1988; Karasek, 1979; Karasek & Theorell, 1990). The model has three axes:
first, the psychological demands of a job; second, the decision latitude available (i.e.
control); and third, the social support from those in the workplace. Job demands are
restricted to the psychological demands whilst control is limited to skill discretion
and decision authority. High demand, high control jobs were active and lead to
mastery, reducing perceptions of job strain and leading to reduced rates of heart
attacks (Theorell et al., 1998). Whilst the combination of five human sector work
groups (for example, health care and retail) found that there was no interaction
between demands and control, when health care, transport and warehouse employees
were considered separately there was an interaction present as predicted by the
model. Specifically, high job demands and low job control increased emotional
exhaustion and health complaints, whilst high demands and control lead to greater
job satisfaction among these employees (de Jonge, Dollard, Dormann, Le Blanc, &
Houtman, 2000).
When nurses were studied, fatigue was predicted by greater job demands, less
control and less social support with greater fatigue found in those nurses with higher

89
job demands and low job control (van Ypern & Hagedoorn, 2003). Similarly, among
health care workers, greater job autonomy increased job satisfaction when
psychological job demands were high and increased job involvement when physical
demands were higher (de Jonge, Mulder, & Nijhuis, 1999). It is also interesting to
note that low autonomy blunted the effect of emotional demands on psychosomatic
health complaints (e.g. headaches), contrary to the expectations of the model. These
results suggest that being able to attribute lack of control over patient outcomes,
rather than being able to „cure‟ each and every patient may be protective for
healthcare workers (de Jonge et al., 1999).
A review of the Job Demand-Control-Support (DCS) model (Van Der Doef
& Maes, 1999), however found that there is limited support for the buffering effect
(job control and support reducing job demands) for psychological outcomes. Rather,
the strain (high demand, low control) and iso-strain (high demand, low control, and
low support) hypotheses of health impairment were supported in about half of the
studies and for cross-sectional studies rather than longitudinal studies (Van Der Doef
& Maes, 1999). The authors noted that is significant variation in the definitions,
measurements and samples which contributed to the lack of confirmation for the
DCS model. Expanding the extent of job demands to include organizational risk
factors (Akerboom & Maes, 2006) and adding physical and emotional job demands
(de Jonge et al., 1999) accounted for additional variance in the analyses of job
satisfaction, emotional exhaustion and somatic health complaints which indicates
that the factors that influence employee well-being may have initially been too
narrow.
The Job Demands-Resources (JD-R, Bakker et al., 2003; Demerouti et al.,
2001) model builds on, but is separate from the JDCS model by expanding the

90
workplace characteristics that could be considered as demands and resources. In the
Demands-Resources model, demands sap energy, whilst resources build motivation.
Specifically, job demands require sustained physical and mental efforts that drain the
individual‟s energy and lead to burnout, especially emotional exhaustion. Resources,
on the other hand are the social, psychological and physical aspects of work that can
reduce the effect of job demands, help achieve work goals, and assist personal
growth and development which in turn increase the individual‟s work engagement
(Bakker et al., 2003; Demerouti et al., 2001).
The research based on the JD-R model is largely analysed with SEM, with
demands, resources and the outcomes used as the latent variables in the modelling.
Demands are mostly conceived as the job‟s workload, emotional demands, and
physical demands with resources measured broadly as social support from co-
workers, supervisor support, time control and organizational climate, with the
outcomes ranging from burnout, work engagement, ill health and absenteeism to
organizational commitment (Bakker et al., 2005; Bakker et al., 2003; Bakker et al.,
2006; Hakanen et al., 2006; Schaufeli & Bakker, 2004). In these analyses, the SEM
pathways confirmed the hypothesised relationships. Among call centre workers,
demands lead to poorer health and then to greater absenteeism whilst resources lead
to greater job involvement and less intention to leave their current job (Bakker et al.,
2003). Across four different occupational groups (i.e. insurance, occupational health
and safety, pension fund, and home-care), job demands increased burnout which
increased health problems, whereas job resources increased work engagement and
employees were more likely to stay in the jobs (Schaufeli & Bakker, 2004).
There were similar outcomes for Finnish teachers, with their increased work
engagement lead to greater organizational commitment (Hakanen et al., 2006). Using

91
moderated SEM, in another sample if Finnish teachers, there were significant
interactions between student misbehaviour and the teachers‟ job resources (e.g.
control, social support, and organizational climate). For teachers with high levels of
resources, increasingly poor student behaviour has little effect on their work
engagement whereas teachers with less resources showed significant reductions in
the measure of teacher engagement (Bakker, Hakanen, Demerouti, & Xanthopoulou,
2007). For German teachers, exhaustion was also increased by poorer student
discipline, in addition to teaching more classes and having less social support from
family and friends. Engagement in this study was considered as career ambitions and
exertion at work and was greater with the support of the teachers‟ principal and
among younger staff (Klusmann, Kunter, Trautwein, Ludtke, & Baumert, 2008a).
Among university staff, job resources buffered the effect of job demands on burnout,
particularly where staff had greater levels of resources (Bakker et al., 2005). From
another perspective, resources can lead to more positive experiences such as flow (as
absorption, enjoyment and intrinsic motivation) at work. Among music teachers,
greater job resources, such as autonomy and social and supervisor support, led to a
greater balance between work challenges and the use of the individual‟s skills which
in turn increased the teachers‟ experience of flow in their work. Teachers who
experienced more flow also had students who were more likely to experience flow
during their music lessons (Bakker, 2005).
For Dutch police officers, excessive job demands led to burnout. Multi-level
analysis also found that individual-level burnout was predictive of belonging to a
work teams with greater burnout, with similar findings for work engagement. As
such, the social context of work teams is important to individual energy and
motivation, suggesting that either could be reinforced by the nature of the work team

92
or environment (Bakker et al., 2006). Among Norwegian police officers, social
support reduced the officers‟ burnout whilst work-family interference increased their
burnout. Burnout was predictive of lower job and life satisfaction and poorer health
(Martinussen, Richardsen, & Burke, 2007). Unfortunately, the analysis article did not
consider mediation (Baron & Kenny, 1986) so it is unclear if the effect of burnout
mediated between work conditions and job and life satisfaction and health.
These studies use the Maslach Burnout Inventory (MBI, Maslach et al., 1996)
and similar findings arise in studies using the Oldenburg Burnout Inventory (OBI).
The MBI has three factors, exhaustion, cynicism, and professional efficacy and the
OBI has two factors, exhaustion and disengagement, which is similar to cynicism in
the MBI. Among German nurses, job demands (e.g. workload, shiftwork, and time
pressure) led to exhaustion and job resources (e.g. supervisor support, feedback, and
control) reduced the nurses‟ disengagement, with both exhaustion and
disengagement being negatively related to the nurses‟ life satisfaction (Demerouti,
Bakker, Nachreiner, & Schaufeli, 2000). Finally, in a diverse sample of European
employees, job demands lead to exhaustion and reduced the employees‟ in-role
performance whilst job resources reduced both exhaustion and disengagement with
disengagement leading to a reduction in extra-role performance (i.e. doing more than
is required for one‟s job) (Bakker et al., 2004).
From these studies, the importance of resources to the positive outcomes can
be seen. The resources available from the workplace maintain motivation and
prevent the loss of energy, buffering the demands upon the individual. Having
control of ones‟ activities and the ability to use one‟s talents, having the support of
supervisors and co-workers underpins engagement and good physical health. The
resources available from the workplace are an important buffer for the demands on

93
the individual, and the role of individual characteristics is not generally considered.
Only in the article on resources and the experience of flow (for example, Bakker,
2005) does the author note that understanding the balance between demands and
resources would be better understood by including all available resources, both
personal and job, into the analyses. This underlines the importance of using the
framework of Bronfenbrenner‟s model as the basis for this thesis as the influence of
the person and their working conditions can be jointly considered.
1.4.5 Affective commitment
In the research detailed in the previous section, affective commitment is used
as a measure of organizational commitment. In this manner, affective commitment is
often treated as an outcome measure for the individual and is taken as a consequence
of the demands and resources of the workplace (for example, Grebner et al., 2003;
Hakanen et al., 2006; Martinussen et al., 2007). However, as the outcomes for this
thesis are broadened to include well-being, mental health, burnout and work
engagement, affective commitment will be considered as a contextual factor that
contributes to the well-being, mental health and engagement in work of the
individual. Affective commitment is a component of organizational commitment, as
the desire and attachment to membership in an organization (N. J. Allen & Meyer,
1990; Meyer & Allen, 1991). A meta-analysis found that it has been widely used in
research as both a predictor and outcome variable (Meyer, Stanley, Herscovitch, &
Topolnytsky, 2002). A sense of affective commitment to the organization has shown
to be important to increasing organizational productivity (Harter, Schmidt, & Hayes,
2002) and reducing intentions to leave an employer (W.J. Casper et al., 2002) while
being linked to greater job satisfaction and performance (Meyer et al., 2002). By
using affective commitment as a predictor, the current research expands the
94
understanding of attachment to the workplace influences well-being and mental
health and maintains work engagement.
The engagement that an employee feels for their workplace is associated with
the informal support that they receive from their manager and co-workers. These
positive perceptions of intangible support, rather than tangible and instrumental
support, predicted greater affective commitment to the employer and reduced the
employee‟s activities to search for another job after 18 months in full-time
employees in a variety of occupations (C. A. Thompson, Jahn, Kopelan, & Prottas,
2004). Among employees of the Canadian civil service, greater levels of autonomy
and supervisor support increased affective commitment which substantially reduces
the employees‟ intention to leave their workplace (Ito & Brotheridge, 2005). Giving
employees more control demonstrates the value that the employer has for their staff,
reaffirming the staff‟s attachment to their workplace. Part-time retail employees had
greater affective commitment in jobs where they have more opportunities to learn
more job skills combined with higher levels of work flexibility and greater
communication of management decisions. The combination of these workplace
factors allowed part-time employees to feel that they were able to progress in their
careers which increased their commitment to their employer (Ng, Butts, Vandenburg,
DeJoy, & Wilson, 2006).
Being connected to the workplace is important whether employees are in an
office or using other working arrangements. Organizational connectedness is shown
to be important to the adjustment of workers, particularly men to the „virtual‟ office
(Raghuram, Garud, Wiesenfeld, & Gupta, 2001). Greater support from the
organization for personal commitments resulted in increased trust and affective
attachment in employees toward the organization in software workers (Scholarios &

95
Marks, 2004) and more altruism among university employees (Jex, Adams,
Bachrach, & Sorenson, 2003). For temporary workers, affective commitment was
increased by organizational support from both the placement organization and the
organization with whom they were temporarily working. These workers were more
likely to continue their temporary work when they felt a connection with their
temping agency, perhaps because of continuing availability of quality employment
opportunities (Connelly, Gallagher, & Gilley, 2007). Given the aging of the
population and the changing nature of employment, understanding how the
workplace culture can influence well-being is important to the way businesses in the
future will attract and retain valued employees.
1.4.6 Managerial support of work-life issues
The importance of social support for both co-workers and supervisors has
been highlighted in the previous section on demands and resources. The focus of this
section will be on the role of managers in supporting the individual to manage their
differing roles. Managerial support of flexible work practices can be considered the
practical expression of an employer‟s attitude toward their employees‟ work-life
concerns as flexible schedules do not occur without the compliance and direction of
managers.
It is important to consider the benefits to companies who have family-friendly
policies for their employees. During the recent boom economic times, benefits
represented a way for employers to retain valued staff (who might otherwise leave
for more amenable employment) and avoid the costs of hiring and training new staff.
In the current climate of financial gloom, family-friendly benefits can become a
motivating force for employees to maintain productivity as employees are more
likely to support an employer who has supported them (Eisenberger, Huntington,

96
Hutchinson, & Sowa, 1986).
Whatever the economic conditions, the long-term survival of any business
relies of having and keeping employees who are motivated, skilled and commited to
their employer (De Cierci, Holmes, Abbott, & Pettit, 2005). The Family Friendly
Index (FFI) was developed by the Family and Work Institute (Galinsky, Friedman, &
Hernandez, 1991) to quantify the benefits available to employees, for example,
flexible work arrangements, financial assistance, dependent care services and
management change in Fortune 1000 companies in the USA. The most common
reasons that companies gave for implementing work-family policies was to improve
morale and retention of staff and as a recruiting tool for new staff whilst cost was
cited as a substantial barrier to implementation (Galinsky et al., 1991). Clifton and
Shepard (2004) calculated that for the 108 companies that had matched financial
outcomes with ratings on the Family Friendly Index, the companies that score higher
on the FFI were more productive with a 10% increase in the index leading to an
increase in productivity of 2-3%. In research in the banking sector, Tombari and
Spinks (1999) found that flexible work arrangements had only positive effects for the
organization, increasing retention and commitment of employees, increasing work
performance and job satisfaction and increasing customer satisfaction. Interestingly,
family commitments accounted for only half of the reasons for taking up flexible
work arrangements with continuing education, beginning of retirement and personal
interests also important to employees(Tombari & Spinks, 1999).
These sound economic reasons for implementing work-life strategies,
however, can be limited by organizational barriers to change. Where there is
organizational inaction on work-life issues and organizational values and where work
output is valued over personal needs, employees are less likely to find balance

97
between work and family domains (De Cierci et al., 2005). Managers are more likely
to recommend work-life programs for their subordinates when they have sufficient
knowledge of the programs and believe that the programs will bring positive benefits
to their company as well (W. J. Casper, Fox, Sitzmann, & Landy, 2004; Maxwell,
2005) whereas unsupportive managers could subvert company policies by not
implementing or implementing unevenly the company‟s policies (Starrels, 1992).
Supportive practices are also more likely to be found in smaller companies than
larger companies, possibly due to the owners and managers in these smaller
workplaces knowing the staff personally and being aware of their individual needs
(Bond, Galinsky, Kim, & Brownfield, 2005). Therefore, although there can be
barriers to the availability of work-family policies, there are benefits when these
opportunities to improve working conditions are taken.
When employees believe that their organization is family-supportive, the
employees who were in diverse occupations reported more positive outcomes, with
greater job satisfaction and organizational commitment, less work-life conflict and
less intention to leave their employer (T. D. Allen, 2001). Similar results were found
among university staff as healthy workplace practices, such as involvement in
decision making, staff recognition and work-life balance policies predicted greater
well-being and organizational commitment and less exhaustion and fewer turnover
intentions (Grawitch, Trares, & Kohler, 2007). It is not only parents who benefit
from family supportive workplaces as the affective commitment of all employees is
increased where these policies are available (S. E. Anderson, Coffey, & Byerly,
2002; Grover & Crooker, 1995), reflecting that family-friendly policies reflect a
sense of care for the employees.
To clarify whether the perception of support comes from an overall

98
organizational position or is due to the actions of immediate supervisors, Thompson
and colleagues (C. A. Thompson et al., 1999) developed a work-family culture scale
that measured managerial support for family-friendly policies, the career
consequences of using family-friendly benefits and the time demands of the
organization. Having a manager who is actively supportive was predictive of
utilization of available benefits regardless of parental status or gender of the
employee and additionally, the positive work-family culture was predictive of
decreased turnover intention and less work-family conflict (C. A. Thompson et al.,
1999). Importantly, where there is a supportive work-life culture and supervisors
encouraged uptake of policies for flexibility, participation in those programs did not
lead to reduced opportunities for promotion and work hours were considered
reasonable by the Dutch employees. These employees also reported that there was
little interference between work and home (Dikkers et al., 2004), with similar results
found for American employees (Behson, 2005; C. A. Thompson et al., 1999).
Informal support for the individual has proved to be more important than just
having formal policies for flexible work practices, increasing job satisfaction and
commitment to the organization and reducing conflict between work and non-work
domains and intentions to leave the organization (T. D. Allen, 2001; Behson, 2005).
Similar results were found when employees were followed over 18 months, as
supervisor support was strongly predictive of greater organizational commitment and
less job searching at the later time (C. A. Thompson et al., 2004). Whilst perceived
organizational support is important to job satisfaction and affective commitment, the
positive work-family culture was strongly associated with reduced work-family
conflict among employed students (Behson, 2002). Managers who support family-
friendly policies provide a positive organizational culture that benefits both employer

99
and employee alike.
As noted previously in the section on gender and work hours, taking
advantage of flexible hours challenges the notion of the ideal worker as the
breadwinner for whom work dominates life. The manager who is supportive of the
implementation of family-supportive has links with Karasek & Theorell‟s (Karasek
& Theorell, 1990) model of healthy work where active jobs have demands that are
matched by high levels of control and workplace support. The support component of
their model represents the support of the manager gives to solving work-life
problems as well as solving every day work problems. It is the practical support of
allowing employees to manage all aspects of their lives that makes managerial
support important to understanding the work-life interface, rather than a more
abstract mission statement from the corporate executives.
1.4.7 Family characteristics
Family characteristics that influence well-being and mental health have been
addressed earlier in this thesis. For example, the Personal Well-Being Index was
highest amongst married individuals whilst the lowest was amongst those individuals
without a partner (Cummins, Woerner et al., 2007). Additionally, the discussion of
the influence of gender includes consideration of gender and parenting and the
following section on the work-life interface will consider the impact of the role of
parents and care of children and elders. Family characteristics are discussed
throughout this chapter where studies include such detail in relation to the workplace
and this section will discuss the effects of marital quality, the presence of partners
and children, how parental workplace experiences affect children and their
employment expectations. Family in the current thesis is taken in the broadest sense
to include parents and their children, couples alone, adult children and their parents,

100
adult siblings together, and extended kin relationships. The following section on
multiple roles and spillover will further discuss how work and family spheres
interact.
Interviews with dual-career couples (i.e. both partners have professional
occupations) found that couples coped together with the stressors of their jobs (Bird
& Schnurman-Crook, 2005). Strategies included sharing chores at home, talking to
each other, understanding and using humour to lighten their partner‟s mood and
encouraging their children to help with chores from any early age. Strategies to
manage family stressors included giving priority to their children, reducing
community involvement, changing expectations about housework and accepting
family differences (Bird & Schnurman-Crook, 2005). The combination of these
strategies would allow the individuals to successfully manage the competing
demands on themselves. The support and assistance from their partners could explain
why the presence of a partner is a protective factor for well-being, as shown in the
Personal Well-Being Index (Cummins, Walter, & Woerner, 2007). However, marital
quality can be reduced when wives are depressed. Rather than be supportive of their
partner‟s problems, depressed women were more dissatisfied with their husbands,
complaining about their children, division of housework, their spouse‟s stubbornness
and problems with sex. They also showed little affection, such as providing comfort
and help or physical contact toward their husbands (Coyne, Thompson, & Palmer,
2002).
Marriages (or commited relationships) last over time as the couples build a
strong sense of togetherness (whilst allowing for autonomy), shared coping with
crises, managing conflict, provided each other with emotional support and
importantly, shared laughter (Wallerstein & Blakeslee, 1995). Meta-analysis of

101
marital quality and well-being found that the positive relationship between marital
satisfaction and well-being became stronger for longer marriages (more than eight
years) with men and women having the same outcomes. However, discord over time
had a stronger effect to decrease marital satisfaction and well-being in the long term
(Proulx, Helms, & Buehler, 2007). These studies contrast the effects of supportive
and non-supportive relationships with the greater benefits for long term health
derived from the partners being supportive.
The presence of children adds another dimension to the influence of marriage
on well-being and mental health, changing the dynamics and experience of the
relationship (Bradbury, Fincham, & Beach, 2000). Family responsibilities also
change involvement in the workplace, influencing decisions about jobs, based on the
needs of the family schedules (both partners and children as well) with gendered
expectations entering the balance. As noted previously in the section on gender,
gender roles still guide life choices with men seeing themselves as breadwinners and
women being more involved with their children (2006; Loscoco, 1997). Parenthood
increased the intrinsic value both men and women received from their work (M. K.
Johnson, 2005) and provided opportunities for psychological growth through
involvement in parental roles throughout the child growth and development
(Palkovitz, 1996). Preschool children with more negative temperaments were
associated with more challenging behaviours and more inattention at preschool and
with their mothers‟ reporting more daily hassles (Coplan, Bowker, & Cooper, 2003).
For children of all ages, when the parent and child have positive relationships,
parents report better well-being. However, parents who were concerned about what
their children are doing after school report less psychological well-being, measured
as positive affect, with more concern about the arrangements and friends of
102
daughters rather than sons, regardless of age (Barnett & Gareis, 2006).
When marriages break down, children raised in unstable single parent
families have poorer outcomes as they are influenced by maternal characteristics and
the number of family transitions that occur (Fomby & Cherlin, 2007). In employed
Canadian mothers, single mothers felt as supported within their workplaces as
married mothers when working in similar position. However, single mothers reported
lower incomes, more family demands and more family interfering with work
(McManus, Korabik, Rosin, & Kelloway, 2002) which would be expected as they are
without another adult to share work and family responsibilities. The link between
economic security and family arrangements for children where single parents,
particularly mothers have limited education, less full-time employment and less
stability in housing led the children have more limited opportunities when the
children themselves became adults (Bianchi, 1995). Postsecondary education lead to
better jobs and little poverty among both single mothers and fathers, although single
fathers are more likely to be better off financially (Zhan & Pandey, 2004). Family
structure, as the presence or absence of a partner and or children, is an important
filter through which work and family situations should be considered.
Parents‟ experiences in the workplace also affect their children. Among
fathers of toddlers, fathers had better knowledge and more involvement with their
child when their wife worked and when the fathers did not feel stressed by their own
work (Corwyn & Bradley, 1999). For parents of adolescents, there was a significant
link from increasing parental work pressure to increased parental role overload to
increased conflict between the parent and their adolescent, which in turn lowered the
self-worth and increased depression among the adolescents. The role overload felt by
mothers particularly increased conflict with younger adolescents whilst fathers‟ role

103
overload increased conflict with older adolescents (Crouter, Bumpus, Maguire, &
McHale, 1999). Mothers had less conflict with their adolescent sons, as fathers did
with their adolescent daughters, as opposite dyads were more accepting and flexible
in parent-child interactions (Fortner, Crouter, & McHale, 2004). There is a changing
dynamic in parent-child relationships across time that adds to the way that the work-
life interface is experienced.
The time required caring for children decreases as the children grow older,
being about half the time in adolescence from preschool ages (Wallace & Young,
2008). Among lawyers, the hours billed by mothers increased as her children became
older, becoming equivalent with women without children billing when their children
were adolescents. Whilst less time spent on house work and parenting activities
increased the productivity of the women lawyers, these factors did not impact on
male productivity as male professionals are more likely to have a stay-at-home
spouse. The productivity of male lawyers was higher in larger firms, with greater
workloads, and jobs with less job flexibility and when the men had greater career
commitment (Wallace & Young, 2008). When children became adults and prepare to
enter the workforce, their perceptions of the workplace were effected by their
parents‟ experiences of work. Young adults at university whose parents, particularly
their mothers, had experienced job insecurity were more likely to view the world as
unjust, to have more negative moods (i.e. anger and anxiety) and to do less well at
school (Barling & Mendelson, 1999). The negative outcomes from work demands
affect not only the individual worker, but their family as well, but work that is
interesting and meaningful provides benefits to both (Bryant, Zvonkovic, &
Reynolds, 2006). The number and age of children, which reflect parental and family
demands (Frone et al., 1992a) will included in the current thesis to reflect the

104
changing influence of children on parents‟ working patterns, particularly that of
women. Comparison of the well-being and mental health of parents and non-parents
will also assess whether the child-free option creates better mental health.
1.4.8 Multiple roles and spillover
Implicit in the study of work-life conflict is that an individual has the multiple
roles and that these multiple roles are associated with role strain, due to a scarcity of
time and energy because of conflicting role demands (Goode, 1960). This premise
guided the early conception by Greenhaus and Beutell (1985) of work-life conflict as
role pressures that come from the time involved and the strain associated with
fulfilling the demands of multiple roles and the consequences of multiple roles
having differing behavioural standards (Frone, 2003; Geurts & Demerouti, 2003;
Goode, 1960; Greenhaus & Beutell, 1985).
That work-family conflict has been the focus of much research also highlights
that the belief that parents, and mothers in particular, would be more likely to have
conflicts between their roles than non-parents. Research, however, shows that both
parents and non-parents are appreciative on family-friendly benefits, showing
increased attachment to their workplaces (Grover & Crooker, 1995). Understanding
the work-life interface acknowledges that people are involved in many activities
beyond childcare, and that eldercare, volunteer activities and leisure pursuits can
occupy time and energy in the same manner as raising children can. Work-family,
work-nonwork, and work-life are all terms that can be used interchangeably,
acknowledging that many of the factors that effect parents also affect non-parents
(Geurts & Demerouti, 2003), such as working hours (Moen & Sweet, 2003) and
burnout (Maslach et al., 1996; Maslach & Jackson, 1981). In the Dutch research of
Geurts, Demerouti and colleagues, family, life and home are synonymous and
105
parental status is usually not given for their samples (Bakker & Geurts, 2004;
Demerouti, Bakker et al., 2004; Geurts et al., 2003). By including both parents and
non-parents in the current project, the research can explore the well-being of all
working adults, regardless of parental or marital status and draw on research from the
work-family, work-non-work, and work-life interface.
Role salience of multiple roles with the value and commitment to
occupational, marital, parental and household roles are linked to the expectations
about the nature and content of roles. In turn, expectations are guided by the personal
relevance of the role, the expected standards required to perform the role and the
resources that an individual will bring to bear upon the role (Amatea, Cross, Clark, &
Bobby, 1986). Where resources of time and energy are considered to be limited, a
scarcity approach leads to the view that multiple roles can only lead to role strain and
conflict between the roles (Goode, 1960; Greenhaus & Beutell, 1985). However,
when time and energy are considered flexible, multiple roles are energy-expansive
(Marks, 1977) and the meaning and involvement come from role balance across roles
(Marks & MacDermid, 1996). Role salience and role balance can be combined in the
concept of „dual-centric‟ individuals, who have high commitment to both work and
family roles. These individuals enjoyed objective and subjective success in their
careers and subjective satisfaction from their lives (Galinsky, 2003). Contrary to
expectations for higher levels of management in the international companies
surveyed, women managers had not given up more in their family and personal lives
(such as marriage or having children) than women in lower levels of management.
Importantly, whilst two thirds of managers of either gender valued their work more
than their families or personal life, broadening one‟s focus led to greater personal
satisfaction, less stress and feeling more successful among the dual centric

106
individuals who valued both domains (Galinsky et al., 2003). By including the
salience and involvement in roles, the relative importance and value that an
individual places on each of their roles may add to the understanding of the complex
relations between time allocation and the gender of the person filling the role.
1.4.9 Exploring the interactions between work and non-work domains
Following on from the early research by Greenhaus and Beutell (1985) that
explored the time, strain and behavioural conflict between work and family roles,
Frone and colleagues (Frone et al., 1992a) proposed that conflict was bidirectional
between work and family domains and that domain-specific antecedents should be
considered. This early research amongst married parents in the USA found that there
was a strong, positive reciprocal relationship between work-family conflict and
family-work conflict. Within either domain, stressors lead to greater distress (i.e. job
stressors significantly predicted job distress) whilst involvement reduced distress
(e.g. job involvement to job distress). The relationships found in the models were
similar for both genders and across racial groups although there was significant
relationship between job involvement and work-family conflict among white collar
workers, but not among blue collar workers (Frone et al., 1992a). In addition,
conflict between work and family occurred more often and more extensively than
family to work conflict, which indicated that the family boundary was more
permeable than the work boundary for parents. There was a small difference between
the genders with women experiencing somewhat more conflict overall than men
(Frone, Russell, & Cooper, 1992b). Further research among parents expanded on the
sources of conflict, finding that within-role distress, overload and time commitment
in the separate areas of work and family areas lead to work-to-family and family-to-
work conflict, respectively. Greater obligations toward a particular role led to

107
reduced involvement in the second role, such that work-family conflict then led to
withdrawal from the family role, and family-work conflict lead to withdrawal from
the work role (Frone et al., 1997).
However, only focusing on the negative interactions neglects the positive
effects gained from work and family life. Rather than interrole conflict that lessens
the second role, interrole facilitation makes the second role easier to enact by
providing opportunities to gain skills and resources (Frone, 2003; Greenhaus &
Powell, 2006). Grzywacz and Marks (2000b) proposed that both positive and
negative spillover occurred between work and family roles, therefore specifying both
the quality (positive or negative) and the direction of the interaction (work to family
or family to work) to incorporate role strain and role accumulation. These four
dimensions were found to be distinct (for example, Aryee, Srinivas, & Tan, 2005;
Grzywacz & Bass, 2003; Grzywacz & Marks, 2000b; Kinnunen et al., 2006) with
fewer resources leading to more negative spillover and greater resources leading to
more positive spillover. For example, working long hours and pressures at work
increased negative work-to-family spillover and low spousal support increased
negative family-to-work spillover whilst having greater decision latitude at work
increased both positive work-family and family-work spillover. Gender did not have
consistent effects although women experienced more positive work-family spillover
than men (Grzywacz & Marks, 2000b). In Europe, this taxonomy is referred to work-
home interference or home-work interference and again is either negative or positive.
There were some differences to the research from the USA, although with similar
overall trends such as work demands influencing negative interference and work
support influencing positive interference although there was no effect for gender
(Demerouti, Geurts et al., 2004).
108
Early research was centred on understanding the predictors and consequences
of the negative view of the work-life interface. When career men with working (i.e.
dual-career men) or non-working wives (i.e. traditional career men) were compared,
the dual-career men experienced more work conflict impacting on family conflict
and more work-family conflict than traditional career men but this did not reduce the
quality of their work life (Higgins & Duxbury, 1992). Among male executives,
increasing work-family conflict increased job stress and reduced life satisfaction
which in turn reduced job satisfaction. Job satisfaction was also reduced by fewer
promotions, greater ambition to advance within a company and longer time in the job
whilst working for a successful organization that supported work-family policies and
earning more money than in the past increased job satisfaction (Judge, Boudreau, &
Bretz, 1994). Depression was also more likely among married parents as work-
family conflict and family-work conflict increased (Frone, Russell, & Barnes, 1996).
Further, increased family demands, taken as having children under six years and
greater family-work conflict increased the use of family-supportive programs such as
flexitime and child care among employed parents (Frone & Yardley, 1996).
1.4.9.1 Comparing types of jobs. In a comparison of self-employed
individuals and organizational employees, the self-employed had more autonomy
and more schedule flexibility in their work and greater job satisfaction, but they had
greater negative work-family spillover and less family satisfaction. Being self-
employed involved a trade-off between work resources and the time required to
ensure the success of their business with self-employed men having greater time
involvement with their work than women and self-employed women having greater
time involvement with their families (Parasuraman & Simmers, 2001). When
independent contractors (self-employed but with no employees) were compared with

109
business owners (self-employed with employees) and organizational employees in
the National Study of the Changing Workforce, there were similar results. Business
owners worked more hours and felt more demands from their work but again had
more autonomy than either independent contractors or organizational employees
although they did not have any more work-family conflict. Independent contractors
were between the business owners and organizational employees, working the least
hours, having the least job pressure but being no more satisfied with their work than
the employee group (Prottas & Thompson, 2006). There is a paradox for business
owners of both studies, in that they „should‟ be more stressed due to their greater
workload and time involvement, but they are not. It would appear that the
independence inherent in business ownership is rewarding over and above the
pragmatic considerations of running the business.
Within a large construction company in Australia, there were differences in
outcomes based on where the employees worked for the company (Lingard &
Francis, 2004). The sample consisted on mostly men, with the small number of
women working in the different worksites reporting few differences among the
outcomes. Men who were working at the construction site as compared to men in the
site office or head office, had poorer relationships with their spouse or partner and
their children, less satisfying leisure activities and helped less at home. When the
work outcomes were considered however, these on-site workers had greater sense of
professional efficacy, but more exhaustion and cynicism and less satisfaction with
their pay although there were no differences in men‟s job satisfaction between the
locations. The authors suggested that it is likely that the actual work the men did
gave them a sense of competence and satisfaction but the problems associated with
being on-site and lack of contact with head office lead to more cynicism and
110
exhaustion and dissatisfaction with pay (e.g. they worked hard, but were not well
rewarded) (Lingard & Francis, 2004).
Across 126 occupations rated in the General Survey Study in the USA
(Dierdorff & Ellington, 2008), there were differences in work-life conflict
experienced and the behaviours of occupations were considered to be important to
these outcomes. Interdependence with co-workers and responsibilities for other
employees but not interpersonal conflicts, were associated with greater work-family
conflict, as the effort to establish and maintain the cooperation with other people or
roles was considered more taxing. Police detectives, fire fighters, and family and
general practitioners had the highest levels of work-family conflict with the greatest
levels of interdependence and responsibility, whilst taxi drivers, insurance adjusters
and bank tellers having the lowest work-family conflict (Dierdorff & Ellington,
2008). It would seem that maintaining long term relationships requires additional
effort and involvement in the work domain which could leave less time and energy
available for the non-work domains. For example, taxi drivers and bank tellers have
more fleeting and superficial relationships with their customers or clients, compared
to general practitioners whose work revolves around a deeper understanding of their
patients‟ concerns.
1.4.9.2 Importance of roles. The value of roles and the interference that may
arise between work and family roles was explored among employed MBA students.
Vignettes varied the role salience and role pressure around two incompatible role
demands; an important work project and an important family birthday which were
scheduled for the same time on a weekend (Greenhaus & Powell, 2003). If work had
low role salience, the family activity was chosen regardless of the level of family
salience, whilst high work role salience meant that the work project would be chosen

111
more often. Overall, the majority of people chose the family activity over the work
activity (Greenhaus & Powell, 2003). The use of vignettes may be somewhat
artificial as in the real world, scheduling is not likely to be immutable and an
individual‟s past experiences with choosing between work and family activities (and
the outcomes of those decisions) will influence how they perceive their current
choices. Role involvement, which is similar to role salience reduced married parents‟
distress (Frone et al., 1992a). Among married accountants who had low career
involvement, higher levels of work-family conflict increased both their intentions to
leave the profession and the likelihood of leaving. However, where they had high
career involvement, high levels of work-family conflict had the opposite effect of
lessening their intentions to leave (Greenhaus, Parasuraman, & Collins, 2001).
It would appear that career involvement colours the interpretation of work-
family conflict, such that higher involvement sees work as a less conflicted place,
whereas lower involvement would see work as more of the problem and where
leaving would remove that problem. In recent research on parents and non-parents in
a small national (US) firm, individuals with high family role salience maintained
their job satisfaction and held steady job distress as family concerns increased their
interference with work whilst individuals with low family salience had decreased job
satisfaction and increased job distress in the same situations. Also, higher family
salience buffered women from loss of job satisfaction in situations of greater family-
work interference (Bagger, Li, & Gutek, 2008).
However, mothers with a traditional gender role ideology experienced more
family distractions at work and for all mothers, greater workload lead to more
distractions at home (Cardenas, Major, & Bernas, 2004). Mothers also have lower
job satisfaction over time if their job is perceived to interfere with their home role.

112
Although fathers did not have the same association between work and family role,
for both genders work-family conflict reduced job satisfaction (Grandey, Cordeiro, &
Crouter, 2005). Work-family conflict can arise where there are differences between
the individual‟s values and expectancies of their roles and the demands upon them
(Perrewé & Hochwarter, 2001). Among couples, being valued by a partner and also
being valued by one‟s employer led to greater motivation toward work and family
activities, less work-family conflict and less exhaustion (Senecal, Vallerand, &
Guay, 2001). When working for IBM overseas, having a spouse or partner reduced
the family-work conflict as being valued by their spouse or partner made their work
role easier (Hill, Yang, Hawkins, & Ferris, 2004). Role salience and ideology
provide a way for the individual to experience their work and family lives and will be
part of the current research.
1.4.9.3 Individual factors. The influence of the person on the work-life
interface is mostly measured by the facets of the five factor model, rather than
specific individual differences. For example, extraversion and neuroticism were
included in the study variables for the MIDUS study. Extraversion and older age
increased positive work-family spillover and decreased negative spillover (Grzywacz
& Butler, 2005). Additionally, personal growth a component of psychological well-
being (Ryff, 1989) was also associated with increased positive work-family
facilitation. Alongside the influence of personality, substantive complexity, job
demands and social skills associated with work increased positive work-family
spillover although the substantive complexity of work was also associated with
increased negative work-family spillover (Grzywacz & Butler, 2005). In a nationally
representative US study, positive personality traits (extraversion, agreeableness,
conscientiousness, and openness to experience) were associated with increased both

113
types of positive spillover and less of both types of negative spillover. More of the
variance of spillover was accounted for by the personality variables than by gender,
work hours, marital status, parental status and education together. Neuroticism was
associated only with increased negative work-family and negative family-work
spillover (Wayne, Musisca, & Fleeson, 2004). Similar findings came from employed
Dutch fathers, where those fathers who were lower in emotional stability (i.e. higher
in neuroticism) experienced more burnout and depression when there were high
levels of work-family interference. Fathers who were lower in agreeableness also had
lower levels of marital satisfaction with increased levels of work-family interference
(Kinnunen et al., 2003). The general trends of the personality traits in reflected in
Indian research where men were more optimistic than women in managing conflict
between roles and therefore had greater positive work-family spillover than women.
However in India, the greater importance of the family role over the work role lead
to higher levels of family involvement reducing positive work-family spillover
among participants (Aryee et al., 2005).
1.4.9.4 Workplace and family factors. Work and family demands and
resources, as outlined in the previous section have similar effects on the interaction
between work and family domains. Among employed mothers, perceived
organization support lead to greater affective commitment, but it did not change the
interference between work and family activities (W.J. Casper et al., 2002). The work-
home culture of an organization can be construed as approving toward activities
outside work where there are high levels of support from the organization,
supervisors, and co-workers and little hindrance, in terms of negative career
consequences from using family-friendly policies or unreasonable time expectations.
Parents of young children in these approving workplaces used more of the available

114
flexible work arrangements and as a consequence, experienced less time- and strain-
based work-home interference than employees in workplaces with less positive work
home cultures (Dikkers et al., 2004). Similarly, in a study comparing five
individualistic countries including Australia, greater perceptions that the organization
is family supportive reduced all facets of work interfering with home and home
interfering with home and increased job, family and life satisfaction. In addition,
interference between work and home was separately and negatively linked to job,
family and life satisfaction (Lapierre et al., 2008). When family demands interfered
with their work, job performance was reduced significantly more for private sector
employees who perceived low organizational support whilst there was little reduction
in job performance among employees who perceived high organizational support for
their concerns (Witt & Carlson, 2006).
Work load, measured as working hours and flexibility, can be increased by
being highly commited to work (e.g. checking emails from home, working on days
off and staying at work after normal business hours). Along with negative affectivity,
this personal initiative toward work however lead to increased job stress and work-
family conflict, over and above gender and marital status, although the effect of
personal initiative on work-family conflict is stronger for women than for men
(Bolino & Turnley, 2005). For child care workers and bus drivers, work-home
interference partially mediated the relationship between workload and depression and
health complaints whilst for medical residents and a larger heterogeneous group of
employees, the relationships was fully mediated (Geurts et al., 2003). A daily diary
study of the influence of daily workload on affect found that increasing workload
increased negative affect spilling over to the family domain, increasing work-family
conflict. The study found that it was not just the hours that the individuals worked,

115
rather the chronic and specific workload on a given day that lead to increased
negative affect with the consequence that the individual withdrew from their family‟s
activities later in the day (Ilies, Schwind, Johnson, DeRue, & Ilgen, 2007).
When working hours alone were measured, longer hours increased negative
work-family spillover which led to increased psychological distress and greater
exhaustion among Finnish workers. Interestingly, working hours were not linked to
positive spillover in either direction, with positive work-family spillover decreasing
psychological distress and exhaustion (Kinnunen et al., 2006). Across blue and white
collar workers in the USA, longer hours and involuntary overtime were linked to
lower work-life balance. However, there was greater work-life balance where high-
performance practices were available. These practices included offering pay
appropriate for performance, an understanding supervisor, making job training and
childcare services available, intrinsically rewarding work and the individual feeling
strong affective commitment toward their workplace. These high-performance
practices provide challenging and rewarding work and skills that allowed workers to
better balance their work and family lives (Berg, Kallenberg, & Appelbaum, 2003).
As noted previously about the influence of types of jobs and spillover, for individuals
working in new media enterprises (e.g. internet companies or web design), self-
employment offered a way to achieve autonomy and flexibility with work to which
they were greatly attached and involved. The flexibility was used to organize their
work and family routines to suit the individual‟s needs (Perrons, 2003). However,
employed women who experience higher work-family conflict are more likely to be
absent from work, as well as leave early and leaving early is also more likely where
there is greater work-family conflict and a large kinship network (measured as close
relatives in the immediate community). Interestingly, though, having a larger kinship

116
was associated with lower family-work conflict (Boyar, Maetz, & Pearson, 2005)
which would indicate that kinship provides support and benefits that reduces the
demands of the family domain.
Support can come from both domains. As such, support from the workplace
and from family members provides resources to the individual, such that support
within a domain (i.e. from supervisors or from family) reduces the problems
experienced within that domain. Supervisor support reduced exhaustion, work
overload and intention to leave which then mediated the link to work-home
interference and psychological distress. Similarly, support from home reduced both
marital distress and intention to leave the marriage, as well as overload in the home
which in turn mediated the relationship to family-work interference and then
affective symptoms (Brotheridge & Lee, 2005). However for this study, it is not clear
from the results what the relationship between family-work interference and affective
symptoms means, as it is not apparent what a high score indicates whether it is
greater positive or negative affect. More clearly shown are the results based on a
sample of Dutch and American workers, where negative work-family interference
partially mediated the relationship between psychological job demands and lack of
workplace social support and the outcomes of increased exhaustion and decreased
job satisfaction. However, job control when combined with increased social support
increased job satisfaction (Janssen, Peeters, De Jonge, Houkes, & Tummers, 2004).
Similar results were found in comparing the effect of work demands and home
demands on interference between these domains and the effect on burnout among
Dutch workers. Work-home interference partially mediated between work demands
and burnout whilst family-work interference partially mediated the relationship
between home demands (measured as quantitative, emotional or mental demands)

117
and burnout. The experience of interference was different for men and women,
however with home demands having a greater impact on burnout for women and
work-home interference having a greater impact on burnout for men (Peeters,
Montgomery, Bakker, & Schaufeli, 2005).
Finally, the presence of children and elders requiring care can alter the work-
life interface. Eldercare is different to childcare and is managed differently. Eldercare
was more difficult and impacted on well-being and family performance when the
care was in the home, without a family climate supportive of that caring and where
there was no one to share the concerns of eldercare. On the other hand, caring for
children in the home did not affect family performance and increased well-being for
the carer (Kossek, Colquitt, & Noe, 2001). Responsibility for children and elders
increased the family-work conflict, which reduced work-family fit for IBM
employees, although schedule flexibility aided women more than men in this regard
(Hill et al., 2004). Among dual-earner couples, only the presence of preschool
children predicted negative family-work spillover whereas positive family-work
spillover was predicted by the individual being satisfied with the arrangement for
household tasks, a sense of family cohesion and contributing to their partner‟s career
success (Stevens, Minnotte, Mannon, & Kiger, 2007). The effect of young children
was also found in two large representative samples of American adults (i.e. the
Midlife Development in the United States (MIDUS) and National Study of Daily
Experiences (NSDE)). In these studies, children under 6 years increased negative
family-work spillover and decreased positive family-work spillover of their parent,
women experienced more negative spillover than men and interestingly, age had a
curvilinear relationship with negative spillover, stable in the early to middle years of
adulthood and decreasing to the later years (Grzywacz, Almeida, & McDonald,

118
2002). Age was also important for understanding the relationship between work
conditions and sleep quality as increasing age, depression, poor health and a lack of
positive family-work spillover was associated with poorer sleep among female health
care workers (Williams, Franche, Ibrahim, Mustard, & Layton, 2006). In addition to
the benefits to sleep quality, positive spillover between the work and family domains
was also associated with good to excellent general health and mental health among
MIDUS participants (Grzywacz, 2000).
In a review of studies conducted up to 1998, Allen and colleagues (T. R.
Allen, Herst, Bruck, & Sutton, 2000) presented the weighted mean effects of work-
family conflict on a number of outcomes which ranged from smaller effects sizes
(e.g. job performance (-.12), increased alcohol consumption and family satisfaction
(-.17)) to medium effect sizes (e.g. burnout (.42), depression (.32), stress (.41) and
family distress (.31)) (J. Cohen, 1988). Work-life conflict reduced job satisfaction,
affective commitment and job performance and increased turnover intention while
reducing life satisfaction, marital satisfaction and family satisfaction. Further, work-
family conflict increased general psychological strain, burnout, stress and family
distress and was associated with poor health, depression and increased alcohol
consumption (T. R. Allen et al., 2000).
A subsequent meta-analyses of 61 studies by Byron (2005) calculated the
weighted average correlations between work (range ρ = .12 to .65) and family (ρ =
.12 to .49) antecedents and the outcomes of work-family and family-work conflict.
Greater work-family conflict was associated with longer working hours, less social
support at work, less schedule flexibility and more job stress (both as overall stress
and as role overload). Greater family-work conflict was associated with more of both
measures of job stress and lack of job social support and schedule flexibility. This
119
brings together the findings of previous research, that work-related factors were more
associated with work-family conflict with family whereas family-related factors were
more associated with family-work conflict (Byron, 2005). Long hours of family
work, greater family stress and conflict and less family support, not having a partner,
having more children, both as a total number and those living at home and having
older children increased family-work conflict with most of these factors having
similar effects on work-family conflict. However, gender did not have a strong effect
with men and women experiencing similar levels of work-family conflict. Byron
considered only one individual difference variable but found that individuals with
more adaptive coping skills experienced less work-family and family-work conflict
(Byron, 2005). A narrative review of work and family research came to the same
conclusions as these reviews, with similar themes emerging from the research (Eby
et al., 2005). However, there was no statistical analysis of the results which limits the
comparison of findings across the reviews.
From these early studies and later research, it can be seen that
conflict/facilitation, spillover and interference between roles can mediate or
moderate, either fully or partially between workplace and family factors and well-
being, mental health and work outcomes. It is interesting to note that whether the
interaction is labelled a conflict, an interference or negative spillover, the outcomes
are similar. It could be concluded that demanding workplaces or families lead to
increasingly negative interactions and poorer outcomes whilst resource-rich
workplaces and families lead to increasingly positive interactions and better
outcomes. By measuring spillover (Grzywacz & Marks, 2000b), this general trend
can be the focus of the current research. As such, negative spillover represents the
distraction and tiredness from the problems between work and home whilst positive

120
spillover then represents the benefits derived from the work and home roles that can
be applied elsewhere. Negative spillover therefore narrows the individual‟s focus
while positive spillover broadens their focus by measuring the positive affective
experiences. By using a more general measure, participants can apply the items to
their own situation without exactly specifying something that may not apply to them.
1.4.10 Exploring work-life balance and work-life fit
There is no widely recognised definition for work-life balance with the
concept treated as self-evident (Frone, 2003; Greenhaus, Collins, & Shaw, 2003),
vaguely (Hyman, Baldry, Scholaris, & Bunzel, 2003) or as something quite different,
such as considering that (the absence of) work-family conflict equals work-life
balance (White, Hill, McGovern, Mills, & Smeaton, 2003). The popular conception
is of busy people juggling many demands or specifically, busy parents juggling
demanding careers and their own and their children‟s many activities (Fouard &
Tinsley, 1997). Campbell Clark defined work-family balance as „satisfaction and
good functioning at work and at home, with a minimum of role conflict‟ (Campbell
& Campbell, 1995, p751). Frone (2003) defined work-life balance in terms of
spillover, as „low levels of interrole conflict and high levels of interrole facilitation‟
(Frone, 2003, p145) whilst Kirchmeyer considered balance as having sufficient
energy, time and commitment for satisfying experiences across all life domains
(Kirchmeyer, 2000). Voydanoff considered work-life balance as effectively
performing in both domains as there were sufficient work and family resources to
meet work and family demands (Voydanoff, 2005b). Voydanoff also defined work-
family fit as occurring when first, demands and abilities and second, needs and
supplies were matched between work to family (Voydanoff, 2005b) which is similar
to Barnet‟s conception of work-family fit as the ease with which individuals meet

121
their work and family goals, given the demands upon them (Barnett, 1998).
Perhaps the most sensible conclusion comes from Greenhaus and colleagues
(Greenhaus et al., 2003) that work-life balance can be considered as a noun, as what
has been achieved, as a verb, as the daily balancing of various roles, or as an
adjective, as balanced or unbalanced. It is likely that work-life balance is more of a
verb, describing the daily proposition of managing and balancing different roles with
the quality of that balance being an adverb, as the success or satisfaction with these
daily activities rather than a constant state that a noun would imply or the adjective
describing that noun.
Work-life balance is measured in a number of ways. First, there is work-life
balance as the individual‟s satisfaction with their work-life balance (Clarke, Koch, &
Hill, 2004). This rating allows the individual to subjectively rate their own
experience of the relative levels of conflict and facilitation that they experience, in a
manner similar to Frone‟s and Campbell Clark‟s conceptions of work-life balance.
Second, following Kirchmeyer‟s definition, work-life balance can be taken as the
balance between the time, commitment and satisfaction for the work and family
domains (Greenhaus et al., 2003). However, the calculations for the time balance
requires the individual to estimate of hours spent in either role and this estimation
could be subject to biased recall. In addition, the formulae for calculating the
balances are quite complex. For work-life balance, Voydanoff measures both
resources and demands of the work, family and community domains (Voydanoff,
2004a, 2004b, 2005a) although these demands and resources are considered as how
they affect the separate components of conflict and facilitation between work to
family and family to work. Work-life fit can be measured as a scale (Barnett et al.,
1999) or as a single item (Clarke et al., 2004) and both are similar, in that the focus is

122
on the ease or difficulty of the management of different roles.
To better understand the varying definitions of work-life balance and to
further explore work-life fit, the current thesis will measure spillover as the
directional and quality of the interaction (e.g. negative work-family spillover) in
relation to work-life balance and work-life fit. In this way, any overlap or points of
difference between the definitions can be identified, which will allow future research
to be more focused in its use of „work-life balance‟.
1.4.11 Conclusions of the Context of the work-life interface
By including factors of the work-life interface that are the individual‟s
assessments and perceptions of their working and personal lives, the current research
project will examine how these factors influence well-being over time rather than in
the usual cross-sectional relationships. Where work pressure, work-home
interference and burnout in Dutch workers are considered in a cross-lagged analysis,
work-home interference emerged as a cause and outcome of work pressure and
exhaustion, suggesting reciprocal relationships between the constructs in the nature
of a loss spiral involving interference, exhaustion and work pressure (Demerouti,
Bakker et al., 2004). The loss spiral contrasts with the „broaden and build‟ theory
which states that when an individual successfully manages stressors, they build a
repertoire of coping strategies to use in the future, therefore increasing their well-
being and positive affect, which can be used to deal with future stressors
(Fredrickson & Joiner, 2002). The current research will include both positive and
negative spillover of the work-life interface to examine causal influences on well-
being and it is expected that positive spillover will enhance functioning, whilst
negative spillover will be detrimental to functioning.
The benefits of multiple roles have come from understanding the facilitation

123
and enrichment that multiple roles in the work-life interface (Frone, 2003; Grzywacz
& Butler, 2005). The role facilitation view factors in both the work and non-work
domains that are resources, such as the skills and experiences learnt in one domain
that assist in the other domains rather than only considering the demands upon the
individual (Grzywacz & Butler, 2005). Facilitation leads to role enhancement, where
performing multiple roles can have positive effects on psychological functioning for
both men and women (Barnett & Hyde, 2001; Galinsky et al., 2003; Geurts &
Demerouti, 2003; Milkie & Peltola, 1999). Multiple roles can contribute to well-
being through experiencing success that develops self-efficacy (Gowan et al.., 2000),
buffers difficulties in other roles (Gowan et al., 2000; Greenberger, O'Neil, & Nagel,
1994; Voydanoff & Donnelly, 1999) and decreases financial strains as the additional
income adds to the family‟s economic prosperity (Moen, 1992). Mutual support
within the relationship toward work and parental roles (Greenberger & O'Neil, 1990;
Marks, Huston, Johnson, & MacDermid, 2001) and the successful involvement in the
wider community (Barnett & Hyde, 2001) are additional benefits.
The view of role participation as enriching has recently been formalised as
the instrumental pathway as the resources developed in role A directly influencing
role B and the affective pathway as resources in role A directly and indirectly
influence role B through affect balance and role performance (Greenhaus & Powell,
2006). One of the benefits of this proposal is that personal factors are included in the
analysis as an integral part of the model. Combining with role salience and
commitment (Amatea et al., 1986), this perspective of enrichment allows for a deeper
and richer understanding of multiple roles to be gained. Enrichment, due to multiple
roles, may also explain the findings that executive men and women, „dual-centrics‟
who rated themselves as equally committed to both work and family roles. Dual-

124
centrics were subjectively happier and objectively as successful at work as those
executives that were focused principally on work, „work-centric‟, or through their
home role, „family-centric‟ (Galinsky, 2003; Galinsky et al., 2003). The concept of
the dual-centric man or woman fits with role enhancement, with equal commitment
to multiple roles at work and at home can assist achieving work-life balance (Burke
& Nelson, 2001; Greenberger & Goldberg, 1989; Greenberger et al., 1994).
Working adults have many influences upon their well-being. The factors
within themselves, in their environment and the resultant interactions and processes
combine to form each individual‟s experiences. The partial and overall contributions
of each component of optimal functioning in different environmental contexts can be
assessed (Semmer, 2003).
The healthy workplace with a balance of resources and demands, defining
optimal functioning in addition to coping under pressure (Nelson & Simmons, 2003;
Turner, Barling, & Zacharatos, 2002), incorporating individual differences in
temperament, disposition (Frone, 2003) and humour (R. A. Martin et al., 2003) with
family (J. M. Patterson, 2002) and community resources (Voydanoff, 2004c) will be
defined for a broad but parsimonious research program. It is expected that from that
the resources available to the individual, through their workplace will also be part of
the significant influences on them. Specifically, having jobs to which they are
attached and that allow them to use their skills and abilities, are expected to be
associated with firstly, greater work engagement and less burnout and more generally
with better well-being and mental health.
1.5 T, the time frame over which multiple roles develop and occur
The current study will investigate the relationships between „subjects in
activities that require initiative and reciprocal interaction with their environment…

125
on an everyday basis for an extended period‟ (Bronfenbrenner, 1995, p628). The
perceived balance in one‟s life is most likely a verb that describes the dynamic
processes of matching up the rhythms that occur daily, weekly, monthly, yearly and
across decades (Bronfenbrenner, 1995; Moen, Waismel-Manor, & Sweet, 2003). The
rhythms of business (such as the financial year, completing work projects and
meeting customer and competitive needs), career (developing, maintaining, and
winding down career aspirations), lifespan (forming and growing families and caring
for the aging) and individual growth and development (from adolescence to later
years) are intertwined to provide the dimensions of each person‟s life. In the same
way that depth and richness in music can appear from individual sound waves, each
of these rhythms or cycles come together to make the depth and complexity of
everyday life and have varying levels of salience depending on the age of the
individual.
Using the ecological framework can provide greater power to the study of
well-being and the work-life interface by accounting for all the influences on the
individual (Bronfenbrenner, 1995). There are three theoretical perspectives that will
be discussed as the influence of time on development. First, the Conservation of
Resources theory proposes that individuals will protect, maintain and increase the
resources that they value over their life, becoming distressed when these are lost,
threatened with loss, or not gained as expected. Second, life span theory describes
how resources are deployed across the life span to reflect how different lifestages
have differing requirements, and third, the life course perspective describes how
social roles are intertwined over a lifetime.
The Conservation of Resources (COR) theory (Hobfoll, 1989, 2001, 2002)
was proposed to understand the individual‟s response to stress. However, COR

126
theory can also be applied to the life span, as it proposes that individuals are
motivated at all times to gain and protect things or resources that they value.
Resources are broadly defined as such things that are valued for themselves (e.g.
personal characteristics) or are valued as a way to obtain valued resources (e.g. social
support) and categorised as object resources, resourceful conditions (e.g. marriage,
job conditions), personal characteristics, energetic resources and social relationships
(Hobfoll, 1989, 2002). Stress and burnout occur when resources are lost, threatened
with loss or not gained as expected after investment of time and effort. As resources
are highly valued, resource losses become more salient than similar resources gains.
Of interest to the influence of time on individual development is the notion
that resources change over time, with loss and gain spirals of resources occurring.
Where individuals lack depth in their resources to cope with stressors and challenges
in their lives, they are more likely to suffer losses immediately and in the future as
there are few reserves for them to draw on, leading to depletion and a loss spiral of
their resources. However, where the individual has greater resources, they are more
capable of producing successful outcomes to difficult situations that will increase
their resources, leading to a gain spiral in resources. In essence, initial losses are
followed by later losses, whilst initial gains are followed by further gains (Hobfoll,
2001, 2002). The theory also proposes that resources occur together, as resource
caravans, such that individuals with greater optimism were more likely to have
greater self-efficacy, better social support and higher well-being, whereas fewer
personal resources are associated with greater stress and more losses over time
(Hobfoll, 2002). Resource caravans and positive and negative spirals that accumulate
over time are similar to the drift hypothesis of low socioeconomic status and drug
use (Fox, 1990; Miech, Caspi, Moffitt, Wright, & Silva, 1999) and the dynamic

127
linkages between personal characteristics and well-being (Shmotkin, 2005). Also
relevant to this thesis is that individuals will seek to gain valuable resources when
they are not in stressful situations. By investing in themselves, their relationships and
circumstances, individuals can build up their resources and buffer themselves from
possible future losses (Hobfoll, 1989, 2002). In this way, individuals maximise their
gains and minimise their losses, and proactively address possible future problems
(Aspinwall & Taylor, 1997; Hobfoll, 2001). By including a mechanism for the
accumulation or degradation over time, Hobfoll‟s Conservation of Resource theory
can provide the method for demonstrating the reciprocal relationships that drive
development over time.
Life span theory (P. B. Baltes, Lindberger, & Staudinger, 2006) shows that
these different rhythms or phases can be understood and accomplished by the way in
which resources are allocated across the life span. In the years up to early adulthood,
the individual‟s resources are allocated to growth and building adaptive capacity in
areas such as education, careers, relationships and parenthood. As adulthood
progresses, resources are directed increasingly toward maintenance and resilience, by
managing challenges and recovery from losses to maintain adaptive functioning,
until old age when resources are necessary to regulate losses, when recovery or
maintenance is no longer possible. Particularly for older adults, using the process of
selection, optimization and compensation (SOC) for age-related changes and deficits
lead to successfully managing their aging abilities and lives (P. B. Baltes et al.,
2006). SOC is similar to self-regulation in that feedback loops allow monitoring of
progress, but SOC is different, in that it deals with losses, whereas self-regulation
explains how goals are pursued.
Taking the perspective of the life course can also add to the understanding of

128
the rhythms in the individual‟s life. Life course theory (Elder & Shanahan, 2006)
examines how lives are socially organized, as the intertwined roles, cycles and the
influence of the individual‟s age. Life cycles capture the procession of the
generations, from the socialization of newborns to their maturity, who then give birth
to the next generation, before growing old and eventually dying. The roles within the
life cycle have normative expectations of behaviours and commitments, whilst the
stability of the roles and their relationships can add to personal stability and direction
in life (Elder & Shanahan, 2006). Whilst the focus on reproduction and parenting in
the life cycle does not account for those individuals who chose not to have children,
it can be used to account for family demands on the individual, with childless
individuals having limited family stressors compared to the parents of pre-school
aged children (Frone et al., 1992a). However, elder care is another dimension that is
not explicitly part of the definition of the life cycle. Age of the individual in the life
course can be viewed in several ways. First as the life time or chronological age,
second as the social time, which reflects the family time or normative sequences of
life stages, such as leaving home or having children, and third, the historical time,
which corresponds to Bronfenbrenner‟s chronosystem. Taken together, the life-
course theory sees development as the „interlocking lives and developmental
trajectories of family members who are influenced differentially by their changing
world‟ (Elder & Shanahan, 2006, p679). The life-course theory echoes
Bronfenbrenner‟s bioecological model, of the active participant, as a dynamic whole,
shaping and being shaped by their environment, across time.
The strength of using Bronfenbrenner‟s developmental equation as the
framework of the current research is that it acknowledges that development occurs
over time, that there will be reciprocal relationships between variables over time, and

129
that developmental effects accumulate over time. Bringing together the perspectives
of resource use and allocation and roles over the life span can illustrate how these are
intertwined. Individual actions have consequences over time, so personal
characteristics will be reinforced over time and lead to the psychological outcomes
seen at a later age. Conservation of Resources shows how and why the individual
would take steps to improve their situation and prepare for the future, life span theory
shows that the way that the allocation of resources depends of the demands of the
particular life stage, whilst life course theory highlights the importance of the
individual‟s social context in how resources will be used or challenged. The most
positive developmental outcomes for the active participant will result from preparing
and accumulating resources that can be deployed in roles and situations that reinforce
and increase those resources. The end result would be successful negotiation of the
roles and responsibilities of the working adult, leading to greater well-being and
mental health and a stronger engagement in their work. In the longer term, such
activities will lead to greater psychological maturity, where at the end of their life,
mature adults are healthy and fit, have an alert and vital mind, are maintaining
meaningful roles in their lives either in a continuing vocation or in new activities, are
maintaining relationships with their family and friends and their involvement with
the community and finally, they are effective and wise problem-solvers
(Csikszentmihalyi & Rathunde, 1998). Whilst the current thesis will not explore the
longer term outcomes, it will explore the shorter term relationships between the
individual, their work-life context and their well-being, mental health and
engagement in work, taking into account resource gain and loss, life stage and social
roles.

130
1.5.1 Longitudinal studies from a developmental perspective
There are many longitudinal studies from developmental psychology that
show how Bronfenbrenner‟s bioecological model can illustrate change over time and
serve as a lifespan perspective on the current research. An excellent illustration of the
dynamic interaction of the person and their environment from childhood to adulthood
is shown in an early study by Caspi, Bem and Elder (1989). Children from the
Berkeley Guidance Study (born in 1928) were followed up at 30 and 40 years of age.
At ages 8 to 10, children were rated by their parents as ill-tempered (based on
severity and frequency of temper tantrums), shy (based on ease and reserve shown
with social contacts) or dependent (based on intense need for parental approval and
need for constant attention) (Caspi et al., 1989). Ill-tempered boys became ill-
tempered men who were more likely to be in low status jobs as adults and with more
and significant instability in their work histories. For males, early ill-tempered
behaviour became reinforced over time by lack of educational qualifications which
lead in turn to lack of occupational status and an accumulation of maladaptive
choices, whilst a strong positive, direct link from ill-temper to job instability
indicated that there is an interactive element in the outcome. Whilst ill-tempered girls
did not have the work instability of ill-tempered boys, they married later, were more
likely to divorce and become ill-tempered mothers (Caspi et al., 1989).
Shy boys became shy men and were rated as aloof, without social poise and
uncomfortable with changes in any roles in their lives. They showed delays in their
entry into the labour market, married later and were more likely to be divorced which
would reflect the description of them as likely to withdraw when frustrated and
reluctant to act when needed. Interestingly, shy girls became quietly independent as
older women and did not have a delay in becoming married, perhaps because being

131
shy, becoming employed was not as desirable to them as a family role. Given the
traditional gender roles of that time, shy women had an option to construct a
satisfying life course which included having ambitions for their husbands which was
not available to their male counterparts (Caspi et al., 1989). In the group of
dependent children, the positive outcomes are reversed for men and women.
Dependent men were more likely to marry, stay married and to have happier
marriages and also enter the workforce and become fathers on time. Unfortunately,
dependent girls became women who lacked independence, aspiration, assertiveness
and were more self-pitying. Whilst these women married and had children earlier
than other women, they did not continue their education in later life, narrowing their
options and limiting the direction of their lives (Caspi et al., 1989).
The dynamic interaction between the person and their environment is clear in
both the cumulative continuity, where the personality is in an environment that
directly reinforces personality behaviour over time and in the interactional
continuity, where personality provokes a response from the environment that then
reinforces the behaviour patterns of the personality, mutually strengthening the
adaptive or maladaptive aspects of the personality (Caspi et al., 1989).
Bronfenbrenner‟s conception of the active person can be seen in the long term
outcomes (positive and negative) of early personality. Poorer developmental
outcomes were seen as ill-tempered boys and girls become ill-tempered men and
women, shy men suffered as they did not conform to the role of active men and
dependent women did not fair well as they could not mature beyond their
dependence on others. Better developmental outcomes were seen as dependent boys
matured into nurturing, family men and shy girls matured into quiet women with
loving families. Social roles allow what may be problematic in childhood to become

132
adaptive in adults because those traits are now valued (dependence matured into
nurturing in men and shyness matured into quiet support of others in women) but
poor behaviour is never valued (bad temper will always provoke other people).
Whether the same would be true today, where occupational opportunities are greater
for women and men are able to opt out of employment to care for children is a matter
for speculation. Ill-temper would still be maladaptive but it is less clear-cut for
shyness and dependence as normative role paths for men and women are more
diverse and less restrictive today than in the past.
The influence of personality over time is also seen in the Study of Adult
Development, which has been the longest continuous study of individuals across the
lifespan. The Study comprised three groups: male Harvard graduates first
interviewed in 1938 to 1942; inner city, non-delinquent boys (beginning at age 14 in
1940); and women who were part of the Terman study of gifted children, and studied
from the early 1920s to 2000 (Vaillant, 2002). By interviewing the participants from
their adolescence or early adulthood through to advanced old age, Vaillant concluded
that whilst temperament may not change over time, character does change in
response to environment and maturation. In this way, character was important to how
adversity and challenges were managed, such that the individual could mature and
outgrow early problems which would then not limit their opportunities for
development. For many participants, a happy marriage was the difference between a
dysfunctional childhood and successful old age. Across the three groups of
participants, the results showed that factors within the individual‟s control at age 50
rather than factors that were less able to be controlled, such as childhood
temperament, parental characteristics, cholesterol and stress were associated with
successful and healthy aging at age 75 to 80. Study participants who used adaptive or

133
mature coping styles (e.g. humour) to deal with the challenges in their lives, who did
not smoke or drink to excess and had a stable marriage were considerably more
likely to be classified as Happy-Well, rather Sad-Sick in old age (Vaillant, 2002).
Other studies show similar findings. Cheerfulness when entering college was
linked to greater job satisfaction, income and less likelihood of unemployment 19
years later in both men and women (Diener, Nickerson, Lucas, & Sandvick, 2002),
whilst the Nun Study showed that positive emotional biographies written by young
women when entering the nunneries in the 1920s predicted longevity 80 years later
(Danner, Snowdon, & Friesen, 2001). In the Berlin Aging Study, the application of
adaptive coping strategies known as Selection, Optimization and Compensation
allowed older adults to manage the loss of skills and resources that occurred with
age, with greater use of theses adaptive strategies predicting happier old age and
greater wisdom (P. B. Baltes, 1997). From the National Longitudinal Surveys of
Youth, individuals who had higher self-evaluations of control, self-esteem and self-
efficacy and who had less neuroticism started their working lives with more
education and job satisfaction, better pay and higher status jobs. After 25 years, these
individuals had increased their advantage over individuals with lower self-
evaluations whilst the individuals with low self-evaluations had increasingly more
health problems that interfered with their ability to work (Judge & Hurst, 2008).
Over the length of a person‟s life, their personal characteristics are a strong influence
on their well-being and mental health and also provide a strong influence on their
children‟s well-being and mental health.
Development of the individual also has influences on their children‟s
development. Women college graduates were followed from their 20s through to
their 50s to understand their development (Roberts, Helson, & Klohen, 2002) and the

134
development of their adult children (Solomon, 2000). The rank order for the
women‟s of personalities was stable over time, with all women having better
psychological adjustment and being psychologically more complex in their 50s than
in their 20s. The women were also more dominant and less feminine than in their
earlier years (particularly at age 27) when gender differences were accentuated by
parental responsibilities. Later increases in dominance and reductions in femininity
were considered to reflect increasing involvement in work and the adult world that
followed the women‟s movement in the 1960s (Roberts et al., 2002). The outcomes
of their children were assessed when the women were aged 60. Linking the earlier
assessment of functioning at age 43 (when the children were adolescents) to the adult
children‟s functioning seventeen years later found that the mothers who were rated
by others as socially perceptive, empathetic, cheerful, humourous and able to see
problems clearly were the mothers of the best adjusted adult children whilst women
with poor interpersonal skills had children who were less well adjusted. Family
integration and cohesion, rather than marital satisfaction was significantly related to
child adjustment with the personalities of both mothers and fathers contributing to
the adult children‟s development (Solomon, 2000).
In another study of mothers and their children, Moen and Erikson (1995)
studied mothers first in 1956 and again in 1986 and studied their adult daughters in
1988. Whilst it may be difficult to untangle all the developmental influences over
time, analyses found several interlinked processes. First, the mothers‟ earlier
psychological and social resources (measured as mastery and social roles,
respectively) and modelling of coping with difficult situations promoted resilience in
their daughters in later life. Second, the daughters‟ experiences and active
participation in life directly built their own sense of mastery and could be used to

135
overcome their mothers‟ limited social resources. Third, the increased occupational
opportunities available to the daughters to be upwardly mobile provided another
pathway to positive outcomes, as daughters were not bound by their mothers‟ limited
options of the past (Moen & Erickson, 1995). These studies illustrate the role of early
childhood experiences, as the observer of parental behaviour, combined with adult
experiences as the direct instigator of one‟s own behaviour and the changing cultural
expectations of normative roles that open new pathways to shape personal and
occupational development over time.
From these studies of the developmental outcomes, the importance of the
individual to how competently an individual functions over many years can be seen.
For example, in the Study of Adult Development, there was little difference between
the men between 25 and 45 years but after that time, the life paths of the men
diverged substantially. The individuals who had used negative explanatory styles as
young men had poorer physical and mental health, less satisfying relationships and
were more likely to have died at an earlier age than their more positive classmates
(Peterson et al., 1988). The positive personal characteristics that Bronfenbrenner
used to describe the active participant have been demonstrated in these diverse
studies as the driving force for competent development of the individual and for their
children. Such positive characteristics form resource caravans (Hobfoll, 2002) that
exist and mature together over time, acting to reinforce each other. Whilst the
longitudinal framework proposed for this thesis is much shorter than these studies,
being measured in months rather than years, it is expected that the longitudinal
modelling will show the underlying mechanisms by which these processes occur.
The framework for the modelling will be explored in the next section, based on the
four non-nested models that will be described there.

136
1.5.2 Longitudinal studies from an organizational perspective
There has been considerable interest in the longitudinal effects of the
workplace and work-family interference and spillover on individual outcomes. In an
early study of Bell Telephone managers over 20 years (Howard, 1992), increasing
complexity at work provided opportunities for the men to develop their skills and
self-confidence which further increased their involvement in more challenging work
tasks. Similarly, whilst family responsibility increased family stress over time, that
responsibility lead to greater family involvement and later greater family satisfaction
in later life (Howard, 1992). There are many factors, as outlined in the previous
sections on the context of the work-life interface that can be included in the models.
The majority of recent European studies have used SEM to test their hypotheses and
in particular, a set of non-nested models to test causality within the models which
will be the focus of the analytic strategy of the longitudinal models for this thesis.
There is mixed evidence for reciprocal relationships between variables over time,
from support (for example, Demerouti, Bakker et al., 2004; Kelloway, Gottlieb, &
Barham, 1999)) to finding only causality and no evidence (for example, van Hooff et
al., 2005) of reciprocal pathways.
The four non-nested models used in SEM to test reciprocal relationships were
first demonstrated in research by de Jonge and colleagues (de Jonge et al., 2001) and
then by a number of other researchers (for example, Dikkers et al., 2004; ter Doest &
de Jonge, 2006; van Hooff et al., 2005). The set of longitudinal models provide a
method to simultaneously compare alternative models that may provide
understanding of the developmental process. The models are compared as first, the
base or stability model (synchronous correlations and auto-lagged (i.e. within
variable pathways over time), second, the causality model (stability model plus

137
cross-lagged, i.e. between variable, paths from predictor variables to outcome
variables over time), third, the reverse causality model (stability plus cross-lagged
paths from outcome variables to predictor variables over time) and fourth, to the
reciprocal model (stability plus causality plus reverse causality). This allows for the
relative importance of each path to be examined, such that the influential, significant
paths over time can be understood. These models also have the advantage that all
variables are measured at each time period, separating the stability of variables from
any changes between variables that may occur over time.
In de Jonge and colleagues‟ initial study, Dutch health care workers in
hospitals and nursing homes were studied 12 months apart. The causality model was
the best fitting model, whilst the reverse causality and reciprocal models were no
better than the stability model at explaining the data. From Time 1 to Time 2, there
was a robust stability within the demands, autonomy and social support at work over
time and moderate stability within job satisfaction and motivation and exhaustion.
From the cross-lagged paths, job demands decreased and job social support increased
job satisfaction at the later time (de Jonge et al., 2001). This study was replicated
among Dutch residential health care workers over 12 months, with the causality
model again providing the best fit and parsimony for the data. Compared to the
stability model, the reverse causality model was not better fitting and although the
reciprocal model did improve fit, it was not better fitting. In these participants, social
support at work at Time 1 increased job satisfaction whilst decreasing exhaustion at
Time 2, with moderately strong stability within all variables over time (ter Doest &
de Jonge, 2006). The causality model was also found to provide the best fit among
Dutch police officers over 12 months, with strain-based work-home interference
increasing the fatigue and depressive symptoms at the later time. Interestingly, the

138
reciprocal model had been the best fitting but as not used for the reason that the
additional paths were non-significant, indicating that best fit had been achieved by
overfitting the reciprocal model to the data (van Hooff et al., 2005).
The cross-lagged paths between the variables over time can indicate how
resources can be lost or gained over time (Hobfoll, 1989, 2001, 2002). In a three
wave panel study, Demerouti and colleagues (Demerouti, Bakker et al., 2004)
followed Dutch employment agency employees at six week intervals to assess the
effect of work pressure on work-home interference and exhaustion over time. Across
this shorter time period, the reciprocal model provided the best fit (Demerouti,
Bakker et al., 2004) rather than the causality model over longer time periods used in
the studies above. With the reciprocal paths, each variable had robust stability over
time and work pressure, work-home interference and exhaustion at Time 1
influenced the other variables at Time 2 and at Time 3 which indicates that poor
situations and outcomes reinforce each other over time. In this way, these loss spirals
were shown, first where work pressure (at time 1) increased burnout (at time 2)
which lead to greater work pressure (at time3) demands at an earlier time (e.g. work
pressure). Second, work-home interference (at time 1) increased work pressure (at
time2) which increased exhaustion (at time 3) (Demerouti, Bakker et al., 2004).
Positive gain spirals have also been shown, with the reciprocal models best
explaining the relationships between task resources, efficacy beliefs and work
engagement (Llorens et al., 2007). When Spanish students had sufficient task
resources (at time 1), they had increased self-efficacy (at time 2), their self-efficacy
(at time 1) increased both (perceived) task resources and work engagement (at time
2) and their work engagement (at time 1) increased their self-efficacy (at time 2)
(Llorens et al., 2007). From these paths, positive situations and outcomes reinforce

139
each other, representing a gain in their overall resources. However, this study used a
smaller sample size and a short time period (three weeks) which raises questions
about generalisability. When personal and organizational resources and flow of
Spanish teachers were modelled over 8 months, the reciprocal model was also the
best fitting of the four models. Personal and organizational resources had a
moderately strong positive effect on the teachers‟ flow whilst flow had a moderately
strong effect on the perception of both resources at the later time (Salanova, Bakker,
& Llorens, 2006). When a longer time frame of 3 years was used to study Finnish
dentists, the reciprocal model was again the best fitting, as job resources and work
engagement and separately work engagement and personal initiative, providing
mutual reinforcement over time (Hakanen, Perhoniemi, & Toppinen-Tanner, 2008).
These three studies, with varying time lags show that positive situations and
resources show evidence of resource accumulation, unlike the Dutch studies where
causality models were supported. It may be that the Dutch studies, by including
measures of the negative aspects and outcomes of the workplace are capturing a
broader picture of the developmental process.
In other analyses using hierarchical multiple regression and hierarchical
linear modelling, the influences of workplace factors and individual factors can be
assessed more specifically. Among Finnish health care workers, the effect of job
demands and resources on work engagement was followed over 2 years (Mauno,
Kinnunen, & Ruokolainen, 2007). From the hierarchical multiple regression
analyses, it is interesting to note that their engagement in work was strongly
predicted by how engaged they were when initially surveyed over and above
demographics and job demands, resources and work structures. This highlights the
importance of measuring each variable at every time to understand the underlying

140
level of a variable. For example, absorption at Time 2 was predicted by gender,
education, time demands, job control and self-esteem but these became non-
significant when the Time 1 absorption score is added. Similarly with dedication and
work vigour, where the Time 1 scores are the main predictor of the variables at Time
2, as only the presence of children remained as a predictor of work vigour and for
dedication, children, type of job contract, job security and job control remained as
significant predictors at time 2 (Mauno et al., 2007). Among Dutch police, multiple
regressions showed that reciprocal relationships existed between workload and work-
home interference over one year and again, the strongest predictor of the variables at
Time 2 were the variables at Time 1 (Dikkers et al., 2004). Hierarchical linear
modelling was used to show that for dual earner couples, changes in psychological
distress were associated with having dull and monotonous work, measured as time
pressure and role conflict increased anxiety and depression, regardless of gender,
over a period of two years (Barnett & Brennan, 1997). Among Canadian employees,
there were reciprocal significant paths between time and strain based work-family
and family-work conflict and the employees‟ stress and turnover intentions six
months later. The strongest paths were between the measures of strain across time
(Kelloway et al., 1999).
Both the longitudinal modelling and the regression analyses over time
indicate that there are effects over time between variables, whether limited to
causality, as the usual stressor-strain paths from predictor variables to outcomes or
more broadly as reciprocity, such that the longitudinal model captures the ongoing
interaction between person, context and outcomes. Among German workers, a
feedback loop involving depression, work-home interference and workplace stressors
provided the best fit of a series of models that tested lagged and synchronous effects.

141
For these employees, work-home interference affected their well-being in the short
and longer term (Steinmetz, Frese, & Schmidt, 2008). Reciprocal relationships
between variables would fit with Bronfenbrenner‟s developmental equation where
the individual‟s current development forms the basis for ongoing, later development.
Using the set of four models as outlined above will provide the opportunity to test
these relationships.
It is interesting to note that there are strong links between the same variables
over time, suggesting that there is substantial stability in these constructs over time.
For measures of work conditions, it is perhaps not surprising that these should be
consistent as the individual‟s job description to be (reasonably or mostly) unchanged
between measurement times. For individual differences and well-being variables, a
degree of stability over time should also be expected as longitudinal studies have
shown that personality can be stable over time (for example, Roberts et al., 2002) and
the set point for well-being shows modest stability (Fujita & Diener, 2005) and
adaptation to life events (Lucas, Clark, Georgellis, & Diener, 2003) over long
periods of time. It also makes more logical sense to have causal paths linking the
variable at Time 1 and Time 2, rather than a correlation as a correlation implies that
causal attribution is bidirectional. It is difficult to understand how a later time can
have a causal influence on the variable at an earlier time, for example Demerouti at
al (2004) call this „temporal stability‟ but recent research now has the Time 1
variable predicting the Time 2 variable (Hakanen et al., 2008). Positive influences
represent gains in resources whilst negative influences would led to losses in
resources, which Hobfoll refers to as gain spirals and loss spirals respectively
(Hobfoll, 1989, 2002). The drift hypothesis represents a similar situation of the
downward spiral associated with poverty or low socioeconomic status and poor

142
mental health. Among adolescents in New Zealand, growing up in poor
neighbourhoods and in families without education or high incomes provided limited
resources for them to overcome internalizing and externalizing mental illnesses.
Adolescents with conduct disorders were more likely to have problems with
educational transitions and not to complete their school studies which entrenched
their disadvantage as adults as their job options were limited by poor school
performance (Miech et al., 1999). Understanding the loss and gain spirals will add to
the understanding of how development occurs across time.
However in these studies, the individual is not well represented, often being
taken as age, gender and negative affectivity which are narrow conceptions of the
individual that does not provide meaningful information how the individual may
influence the interaction between workplace and well-being. In a study of bank
employees, Houkes and colleagues (Houkes, Janssen, de Jonge, & Bakker, 2003) did
include „growth need strength‟ and „upward striving‟ as individual difference
variables in some of the analyses but their results are limited by not including the
individual differences in the main analyses of the four models to test reciprocity.
Including more widely used measures of individual difference or personality and
including those variables in the models would allow the person to be included in a
realistic and meaningful way.
1.5.3 Conclusions for Time in the developmental equation
From the results of many studies in many diverse populations, competent
adaptive development across the lifespan is linked to the active and psychologically
mature individual who shapes their environment to achieve a happy and meaningful
life. Whether the maturity is called resilience, the good life or successful aging, the
best lives are flexible and exhibit self-regulation and positive relationships with their

143
families and friends. This maturity also implies that competent development will take
into account that the individual will maximize the gains of resources whilst
minimizing any losses that occur across the lifespan (P. B. Baltes, 1997; Hobfoll,
2002). The outcomes that will be considered for this thesis are well-being, mental
health (taken as the absence of mental illness), burnout and engagement with work,
as work provides as central role in the lives of all adults. It is expected that the
influence of time will be shown in the longitudinal models as the presence of
stability of variables over time, in addition to the influence of reciprocal influences
between the variables over time.
1.6 Proposed research program
Bronfenbrenner‟s developmental equation provides the framework to specify
the Person and the Contexts in which working adults‟ psychological development
can be explored. The purpose of the current research is to identify the important
factors that lead to competent development such that future psychological and
workplace interventions can be better informed and targeted. The proposed research
program will have two studies that separate and explore the influences of the person
(as their generative disposition, gender and demand characteristics) and their work-
life context (as workplace and family factors and spillover between roles). Using
quantitative methods, the person and their work-life context can be understood in
detail and the most influential factors for the outcomes can be identified.
1.6.2 Study 1
Study 1 will have a cross-sectional analysis of the developmental equation,
using hierarchical multiple regression analyses (HMR) for each of the developmental
outcomes, of well-being, mental illness, burnout and work engagement. Predictor
variables will be the variables described in the literature review in this chapter: as the

144
generative disposition, the individual‟s demand characteristics, workplace and family
factors, and spillover between work and family. Outcome variables will cover a
broad spectrum of psychological functioning.
The Person will be measured as first, the generative disposition, as
dispositional optimism, coping self-efficacy, perceived control of time, roles and
gender; and second, as the demand characteristics, as humour and social skills. The
Context will be measured by two blocks of variables: Work and Family variables of
working hours, affective commitment, skill discretion, job autonomy, job social
support, type of employment, family demands, number of children, marital status;
and as the Work-Family Interface variables of spillover (positive and negative)
between work and family, work-life balance and work-life fit. The developmental
outcomes will be Well-being, measured as life satisfaction and psychological well-
being, Mental Illness, measured as depression, anxiety and stress, Burnout, measured
as exhaustion, cynicism and professional efficacy, and Work Engagement, measured
as work vigour, work dedication and work absorption.
Hypothesis for Study 1: It is expected that aspects of the Person and Context
components of Bronfenbrenner‟s developmental equation will be significant
predictors of the developmental outcomes, measured as well-being, mental illness,
burnout, and work engagement. It is expected that individuals who have higher levels
of the generative disposition, more positive demand characteristics and greater
workplace resources will have more positive functioning. Specifically, for P, the
person, better outcomes were expected to be predicted by more dispositional
optimism, greater coping self-efficacy, more humour and better social skills. For C,
the context, more workplace resources and more positive spillover between roles and
less negative spillover between roles were expected to be associated with better
145
outcomes.
1.6.3 Study 2
Study 2 will involve building longitudinal models, using structural equation
modelling (SEM) and will be conducted using a prospective panel study that extends
from the cross-sectional data of Study 1. The longitudinal analyses will have three
time measurements and allow the combination of the developmental outcomes to
achieve a broad understanding of the reciprocal relationships to drive development
over time, as evidenced by the gain or loss of resources. However, as including many
variables in SEM can lead to problems in the quality of the longitudinal analyses, the
most frequent predictors of the HMR in Study 1 will be identified and used in the
longitudinal modelling. The person and their work-life context will defined in this
way and combined with the outcome measures to be tested by a set of non-nested
models. The additional step of removing trivial pathways from the longitudinal
models will extend previous research and more enable influential pathways to be
more clearly identified, showing where gains and losses of resource occur.
Hypothesis for Study 2. It is hypothesized that the longitudinal modelling will
show evidence that there is stability in the variables over time and that there are
changes in variables over time which will be the result of gain and loss spirals of
resources. Gain and loss spirals are evident in the significant reciprocal relationships
between variables over the measurement times. Specifically, it is expected that the
greatest influence on a variable at a later time will be from the same variable at the
previous measurement times (i.e. the auto-lagged paths), which will be taken as the
stability of a variable over time. In addition to the stability of variables, it is expected
that there will be smaller but important contribution from cross-lagged paths, such
that personal and workplace resources will increase positive functioning over time

146
and that the demands of negative spillover will increase burnout and mental illnesses
over time. These cross-lagged paths will represent the gain and loss spirals that lead
to the accumulation or loss of resources over time.

147
Chapter 2, Study 1: Using hierarchical multiple regressions to explore the predictors
of well-being, mental illness, burnout and work engagement of working adults
This chapter will investigate the cross-sectional relationships between the
individual, their work and family roles and their well-being, mental health, work
engagement and burnout for Study 1. The analysis will be based on the framework of
Bronfenbrenner‟s developmental equation, D ∫ PPCT (Bronfenbrenner & Morris,
1998), where development, D, is the function of the proximal processes, P, between
the person, P, and their context, C, over time, T. The person and the context will be
examined in the following research, with the proximal processes implied from these
variables and time to be included in Study 2.
The theoretical and empirical research that supports these components has
been outlined in Chapter 1. In summary, D, the developmental outcomes are Well-
being, measured as life satisfaction (Diener et al., 1985) and psychological well-
being (Ryff, 1989), Mental Illness, measured as depression, anxiety and stress (S. H.
Lovibond & P. F. Lovibond, 1995), Burnout, measured as exhaustion, cynicism and
professional efficacy (Maslach et al., 1996), and Work Engagement, measured as
work vigour, work dedication and work absorption (Schaufeli et al., 2002). P, the
person, will be measured by first, the generative disposition, as dispositional
optimism (Scheier et al., 1994), coping self-efficacy (Chesney et al., 2003), control
of time (Macan, 1994), role salience (Amatea et al., 1986) and egalitarian gender role
attitudes (Moen, 2003). The person will also be measured by their demand
characteristics, measured as humour (as a coping strategy, R. A. Martin & Lefcourt,
1983) and social skills (Ferris et al., 2001). C, the context of workplace and family
factors and the spillover between work and family will be measured by working
hours, affective commitment (N. J. Allen & Meyer, 1990), skill discretion (Schwartz,

148
Pieper, & Karasek, 1988), job autonomy (Voydanoff, 2004c), job social support (van
Ypern & Hagedoorn, 2003), type of employment, family demands (Frone et al.,
1992a, 1992b), number of children, marital status, and spillover (positive and
negative) between work and family (Grzywacz & Marks, 2000b). Consideration of
Time will be given in the longitudinal analyses to follow in Chapter 3 in Study 2.
This chapter will investigate the cross-sectional relationships between the
individual and their environmental context and their effect on the developmental
outcomes, providing the platform for the longitudinal modelling in the second part of
the study. Both the personal characteristics, which are resources that the individual
can use in challenging times and workplace resources, such as skill discretion are
considered likely to be important to the outcomes of working adults (Hobfoll, 2002;
Voydanoff, 2005b). These analyses will explore the relative influence of the active
participant (P, the Person) and a supportive context (C, the Context), arising from
work and family conditions and spillover of the work-family interface to understand
the predictors of D, the developmental outcomes, well-being, mental health, burnout
and work engagement.
2.1.1 Hypothesis for Study 1.
It is expected that aspects of the Person and Context components of
Bronfenbrenner‟s developmental equation will be significant predictors of the
developmental outcomes, measured as well-being, mental illness, burnout, and work
engagement. It is expected that individuals who have higher levels of the generative
disposition, more positive demand characteristics and greater workplace resources
will have more positive functioning. Specifically, for P, the person, better outcomes
were expected to be predicted by more dispositional optimism, greater coping self-
efficacy, more humour and better social skills. For C, the context, more workplace
149
resources and more positive spillover between roles and less negative spillover
between roles were expected to be associated with better outcomes.
2.2 Methods
2.2.1 Participants
2.2.1.1 Recruitment. Volunteers were recruited from the alumni of a
university and from the administrative staff of a large public hospital. The university
alumni were contacted through the alumni‟s monthly e-magazine, with the first
alphabetical half of the alumni‟s email list (N = 9000) being targeted. This email list
is arranged alphabetically by first letter, for example, as [email protected],
[email protected], [email protected], ensuring a random selection of alumni.
The article appeared in the alumni e-magazines sent out in late August and late
September 2006, with 207 members of the alumni volunteering for the survey. The
response rate for these two calls to volunteer was 2.22%.
The administrative staff (N = 450) at the public hospital were contacted
through their managers and invited to take part in the research project. The hospital
made specific arrangements for staff to have access to the SurveyMonkey website
from their computers at work rather than having to rely on their home computers. 10
and 20 days after the initial contact, the staff were again emailed asking for them to
volunteer, with about half the staff taking part (n = 268, 59.6% response rate).
The substantially better recruitment at the public hospital highlights the
problems of internet research. As will be explored in the internet survey
methodology, it is necessary for calls to action to be vouched for by a trusted or
reputable third party (e.g. immediate supervisor, rather than bulk email) and it is
necessary for the calls to action to be close in timing (T. Anderson & Kanuka, 2003;
Hewson, Yule, Laurent, & Vogel, 2003). The alumni association was however

150
limited in its ability to send more frequent reminders of the survey, as the size of
their mailing list meant that it is more likely that the e-magazine would trigger spam
protocols for the recipients‟ Internet Service Providers, leading to the emails not
being received as intended. Most participants (90%) completed the surveys within
the first day of receiving the emails asking for action, perhaps indicating that once an
email is off the page, it disappears out of conscious thought. The emails sent to
participants to initially asking for volunteers and the emails sent at Times 2 and 3
asking for involvement in the second and third waves of data collection. Future
research should be based on emails sent by known person, at 10 day intervals, with
three calls to action in total.
2.2.2 Internet survey development
The surveys were hosted by SurveyMonkey (www.surveymonkey.com), an
online survey tool which is based in the USA and which meets the European Union‟s
Safe Harbor convention for privacy of digital information. Access to the data of the
surveys was through a username and password which was further protection of the
participants‟ data.
After the scales to be used were collated in a word document, the type of
formats that were appropriate for each scale or item was decided. For example, the
choice may be between scales that used on a Likert rating scale („Matrix of choices
(only one answer per row allowed)‟) or for an item that required an open ended
question („Single textbox‟). A multi-item scale such as the Life Orientation Test-
Revised (Scheier et al., 1994) using a Likert rating scale would be constructed in
three steps. First, the stem question (“Please indicate how much you agree or
disagree with the following statements”) is entered, second, the items of the scale are
entered on separate lines and each item is numbered and third, the Likert rating scale

151
is entered on separate lines (for example, 1 strongly disagree, 2 slightly disagree, 3
neither agree nor disagree, 4, slightly agree and 5 strongly agree). For items such as
ages or hours worked each week, a simple text box was sufficient. Using the
templates available within SurveyMonkey, the survey was constructed by inserting
the appropriate question into the desired template, eventually building to the
complete survey. The survey was checked for typos, spelling mistakes,
inconsistencies in numbering or wording and the time taken to complete the survey
was estimated. As a further check, the link to the survey was emailed to supervisors
and colleagues and the correction process was repeated several times until the survey
was deemed correct.
Once the survey was checked as satisfactory, the original survey was
duplicated within SurveyMonkey to create another identical survey. Data from the
two participant pools could be separately collected and identified to calculate the
response rates. Each of the surveys has a unique URL (for example,
http://www.surveymonkey.com/s.asp?u=111873790210 for the alumni participants at
Time1 and http://www.surveymonkey.com/s.asp?u=439312440696 for the hospital
participants at Time 1). As a survey is duplicated, a new URL is generated for that
new survey. As the longitudinal analyses used the same variables at each time period,
the Time 2 and Time 3 surveys were duplicates of the Time 1 surveys, to ensure
consistency over time.
2.2.3 Internet survey methodology
The current research will used a newer method of data collection for the
cross-sectional and longitudinal analysis. Volunteers will be recruited through the
internet to ensure the largest possible sample for the planned analyses, particularly
the structural equation modelling in Study 2. Although internet surveys offer the

152
promise of obtaining large, diverse samples at low cost, reasonably quickly and
relatively easily when compared to more traditional methods, such as postal surveys
(T. Anderson & Kanuka, 2003), it is important to consider if a survey conducted
through the internet would reach sufficient individuals to warrant the use of this
method. The numbers of internet users continues to increase in Australia and across
the world, as individuals go online to socialise, to purchase products and services, to
do their banking and to organise their travel arrangements (Hewson et al., 2003).
From the 2006 Australian census data, 64% of households in Queensland, and 63%
of Australian households have access to the internet, with similar rates of access in
major cities (64%) and regional areas (59%) close to the cities (Australian Bureau of
Statistics, 2006b). Internet use occurred mostly at home, and mostly for private or
personal use, educational purposes or for business purposes among highly educated
individuals or high income earners. Most people using the internet daily (50%) or at
least weekly (41%) (Australian Bureau of Statistics, 2007). Therefore, access to the
internet at work or at home, demographics or familiarity with the internet should not
be a barrier to obtaining a wide variety of participants for the proposed study.
It was important to consider whether the data collected from internet surveys
was valid when compared to the more traditional pen and paper surveys. There were
several issues that may influence the data generated by an online survey. First, would
the scales produce the same outcomes in either format? Two recent studies indicated
that format was not as important as could be expected (Gosling, Varize, Srivastava,
& John, 2004). Among university students tested on the Occupational Personality
Questionnaire, most of the subscales in particular for conscientiousness, had
comparable results between the two formats. Being able to choose the format led to
some differences but the authors proposed that this was due more to the scales

153
involved than the format per se (Meade, Michels, & Lautenschlanger, 2007).
However, no differences were found when employees of a large multi-national
company took part in a large scale comparison of paper and pen questionnaires and
on-line surveys. The two survey formats yielded similar results for the assessment of
the organizational climate across 16 international workplaces, indicating that results
both formats could be combined in future (De Beuckelaer & Lievens, 2009). For the
purposes of the present research, this also indicated that internet research would give
similar outcomes to the traditional pen and paper surveys.
The second concern was that the samples from the internet would not be
representative of the population in general. Recruitment of general surveys through
the Web found that there was greater variation in age and education, both being
greater, than in samples taken from undergraduate students (Birnbaum, 2004). In a
comparison of participants in web-based surveys and the participants of articles in
the Journal of Personality and Social Psychology in 2002, participants of the Web
surveys had a better balance between the genders as more men participated, came
from a broad range of socio-economic backgrounds and were somewhat older,
although the racial disparity found in traditional research was also found on the web
(Gosling et al., 2004). As the current research is concerned with working adults,
being able to have a sample with older participants and with a better gender balance
will enhance the representativeness of the sample to be used.
The third concern for internet research is maximising the response rate in the
survey. Calls to volunteer for the current research were sent to specific email lists,
either through an alumni e-magazine or through hospital staff list, rather than be
generally available on a website, which allowed known groups to be contacted.
General web surveys can generate large, diverse samples on web sites with

154
substantial traffic and interest (Park, Peterson, & Seligman, 2004) but surveys can
languish where there is no way to direct potential participants to the website or
survey (T. Anderson & Kanuka, 2003). Calls for volunteers in emails generally lead
to higher response rates than to general web-based surveys (Hewson et al., 2003).
The rate of responses were increased further in several ways: first, that the request
for volunteers was sent by a third party who was known and trusted by the potential
volunteers; second, the calls to volunteer were sufficiently urgent, without being
overly persistent; third, the participants see the research as worthwhile and
rewarding; and fourth, that the participants were assured their answers were
confidential and anonymous (T. Anderson & Kanuka, 2003; Hewson et al., 2003). In
this way, the email requests were seen as a worthwhile activity that was more likely
to be acted on, which increased the response rate for the survey.
The final concerns related to the administration of the surveys. The problem
of multiple submissions, where individuals complete the surveys more than once,
were overcome by suitable configuration on the on-line survey (Birnbaum, 2004). As
the current study involved longitudinal data collection, the issue of correctly
identifying the participant over time must be considered to reduce possible attrition
of participants (Hewson et al., 2003). A simple code based on initials and birth date
was used in the current research to overcome this concern. The online format of
surveys did not negate the ethical considerations of protecting participants by
maintaining their anonymity and respecting their confidentially (Kraut et al., 2004).
Choosing a survey provider that met international standards and that did not retain
information on the individuals who participate was a crucial first step in this process.
The second step was to safeguard the participants‟ confidentially after they complete
the surveys. For the current research, any identifying information such as the

155
person‟s individual code was stored separately to the email addresses needed to call
for participation in the later waves of data collection. By addressing these concerns
through careful design and administration of the survey, the benefits of online
surveys can be gained and a large, diverse sample of working adults can be obtained.
2.2.4 Measures
2.2.4.1 Demographics. To identify participants across time, whilst retaining
their anonymity, a code was developed from their initials and their date of birth, for
example, EB160569. Gender was coded as 0, male and 1, female. Age was a
continuous variable calculated by subtracting the current year of the study from the
year of their birth. Participants were asked how many children they had, from 0 to 6
or more, and in line with the Australian Bureau of Statistics, children were defined as
their „natural, adopted, step, or foster son/s or daughter/s‟, (Australian Bureau of
Statistics, 2006a). Lifestage was defined as 1, younger non-parents, aged under 40
years; 2, older non-parents aged 40 years and older; 3, parents with youngest child
under 6 years; 4, parents with children between 6 and 12 years; 5, parents with
children between 13 and18 years; 6, parents with adult children live at home; 7,
parents with no children living at home (Moen, Harris-Abbott, Lee, & Roehling,
1999). Family and parenting demands were then calculated as 1, no children
(Lifestages 1and 2); 2, adult children (Lifestages 6 and 7); 3, adolescent children at
home (Lifestage 5); 4, primary school children at home (Lifestage 4); and 5, young
children at home (Lifestage 3) (Frone et al., 1992a, 1992b). Marital status was first
coded as 1, single or never married; 2, married or living with partner; 3, separated or
divorced; and 4, widowed. However, as most participants were married or living with
a partner, marital status was further collapsed to 1, not living with a partner or 2,
living with spouse or partner. General health was assessed with a single item,
156
„Compared to other people your age, how would you describe your usual state of
health‟, rated on a Likert scale of 1 poor, 2 fair, 3 good, 4 very good, and 5 excellent
(Idler & Benyamini, 1997).
2.2.4.2 Schedules, education, job conditions and income. The working hours
were assessed as a continuous variable by the item, „On average, how many hours do
you actually work, including any paid or extra hours that you put in beyond your
official work week?‟ The number of hours worked per week that the participant
would prefer to work was assessed by the item, „How many hours would you ideally
like to work each week, compared to hours you CURRENTLY work?‟ rated as 1, a
lot less hours; 2 a few less hours; 3 about the same hours; 4, a few more hours; or 5
many more hours (Moen & Yu, 2000). Participants were also asked to „please
indicate the major constraint for transferring from your current work hours to your
ideal hours‟. Spouse or partner‟s hours were assessed as a continuous variable by the
item, „If you have a spouse or partner and they are working, how many hours a week
do they work (e.g. 0, 15, or 45 hours)?‟ Participants were also asked how long it took
them to get to and from work each day with the item, „On average, how long does it
take you to get to and from your workplace each day? Please give the total of both
journeys in minutes. For example, 20 minutes in the morning and 20 minutes in the
afternoon equals 40 minutes in total for the day.‟
Educational background was categorised as 1, finished part or all of high
school; 2, trade or TAFE qualifications; 3, undergraduate tertiary qualifications
(degree or diploma); or 4, postgraduate tertiary qualifications (e.g. masters or PhD).
Objective job conditions were assessed by a series of items. Participants were
asked to indicate how long they „had been in their current position or business?‟ as a
continuous variable (in years), whether their job was „1, permanent, 2, contract or

157
temporary, or 3, your own business‟, and whether their work was „1, full-time, or 2,
part-time‟. Participants were asked what industry they worked in (e.g. health, law,
entertainment, IT, banking) and to describe their job (e.g. registered nurse, lawyer,
dancer, software developer, financial planner). Further, participants were asked to
estimate how many people are employed in their workplace (Moen, 2003). The
participants‟ combined household income before tax was assessed by the categories:
1, under $30,000; 2, $30,000 - $59,999; 3, $60,000 - $89,999; 4, $90,000 - $119,999;
5, $120,000 - $149,999; 6, $150,000 - $199,999; 7, $200,000 - $249,999; and 8, over
$250,000.
2.2.4.3 Work-life fit, work-life balance, feeling busy and personal problems.
Work-life fit was assessed with a single item, „how easy or difficult is for you to
manage the demands of your work and your family/personal life‟ rated as 1, very
difficult; 2, moderately difficult; 3, moderately easy; or 4, very easy (Clarke et al.,
2004). Work-life balance was assessed by a single item, „all in all, I am satisfied with
the balance between my work and family/personal life‟, rated from 1, strongly agree
to 5 strongly agree (Clarke et al., 2004). Two items were developed by the author to
rate how busy the individual felt and how they felt about their personal life. How
busy they felt was rated by the item, „How busy are you at the moment, given all the
things that you do at work and at home?‟ rated from 1, life has lots of free time, 5,
life is full but not hectic, to 9, life is hectic all the time. Personal life was rated by the
item, „How would you rate your personal life at the moment?‟, rated from 1, no
problems at all, 5, starting to have concerns, to 9, more than I can handle.
2.2.5 Reliabilities and details of the measures
Each of the measures was chosen as they were widely used and had good
internal reliability in previous research. For all scales that were used, the negatively

158
worded items were reverse scored before the scales were summed. The Cronbach‟s
alphas for the scales in the current analysis are given as a range, reflecting the
highest to lowest estimates of the scales internal reliability across the three
measurement times for Study1 and 2. The reliability of the particular scale at Time 1
is given in brackets after the range of reliabilities. Appendix I has the complete list of
the items for each of the following measures.
2.2.6 P, the Person: Generative disposition variables
2.2.6.1 Dispositional optimism. Dispositional optimism was measured with
the Life Orientation Test –Revised (LOT-R); Scheier, Carver & Bridges (1994), 6
items, sample items, „In uncertain times, I usually expect the best‟ and „If something
can go wrong for me, it will‟ (reversed), Cronbach‟s alphas = .831 to .859 (Time 1 =
.831). Items were rated on a Likert scale, 1 strongly disagree to 5 strongly agree.
Whilst the positively and negatively worded items have been used separately as
scales of optimism and pessimism, respectively (for example, Hatchett & Park,
2004), in the current sample, principal components analysis of the six items formed a
single factor (eigenvalue = 3.290) that accounted for 54.84% of the variance. The
scale was therefore used as a single measure of optimism, with high scores indicating
high levels of dispositional optimism.
2.2.6.2 Coping self-efficacy. Self-efficacy was measured by the Coping Self-
Efficacy scale (Chesney et al., 2003). The scale had 26 items that ask the participant
to rate situations, based on the following instructions, “when things aren't going well
for you, or when you're having problems, how confident or certain are you that you
can do the following…” sample situations are „keep from getting down in the
dumps‟, „talk positively to yourself‟, and „find solutions to your most difficult
problems‟. Ratings were based on a Likert scale from 1, I cannot do this at all, 4, I

159
am moderately certain I can do this, to 7, I am certain I can do this. Cronbach‟s
alphas = .963 to .969 (Time 1 = .963). High scores indicated high levels of self-
confidence in managing challenging situations.
2.2.6.3 Control. Perceived control of time was assessed by the Perceived
Control of Time Subscale of the Time Management Scale (Macan, 1994), 5 items,
sample items, „I feel in control of my time‟ and „I find it difficult to keep to a
schedule because others take me away from my work‟ (reversed). However, the
alphas for the scales were extremely poor (Cronbach‟s alphas = .548 to .655, Time 1
= .655) and a single item, „I feel in control of my time‟ was used rather than the 5
item scale. High scores indicated a strong sense of being in control of one‟s time.
2.2.6.4 Role salience. Role salience was measured by the Life Role Salience
Scales (LRSS, Amatea et al., 1986), using the reward value and commitment toward
occupational, marital and parental role subscales (six subscales). Each subscale had 5
items and was rated on a Likert scale, from 1 strongly disagree to 5 strongly agree.
Occupational role reward value, sample item, „Having work / a career that is
interesting and exciting to me is my most important life goal‟, Cronbach‟s alphas =
.660 to .711 (Time 1 = .711). Occupational role commitment, sample item, „I expect
to make as many sacrifices as are necessary in order to advance in my work/career‟,
Cronbach‟s alphas = .780 to .791 (Time 1 = .780). The Occupational Role Salience
scale was calculated from the combined occupational role reward and commitment
subscales, Cronbach‟s alphas = .830 to .834 (Time 1 = .833).
Participants were asked about their parental and marital roles, using the same
instruction: „The next questions ask about parenting and marriages or committed
relationships. Please take „marriage‟ to include committed relationships of all types
and „parenting‟ to involve children of all ages, whether they are your own, adopted,

160
step or foster children. Please answer the questions as they apply to you and how you
feel about relationships and parenting. You can tick N/A if you don‟t have children
or are not married or in a relationship at the moment, or the questions are not relevant
to you‟. Parental role reward value subscale had 5 items, sample item, „although
parenthood requires many sacrifices, the love and enjoyment of children of one‟s
own are worth it all‟, Cronbach‟s alphas = .799 to .826 (Time 1 = .826). Parental
role commitment subscale had 5 items, sample item, „it is important to me to have
some time for myself and my own development, rather than have children and be
responsible for their care (reversed), Cronbach‟s alphas = .706 to .890 (Time 1 =
.890). The Parental Role Salience scale was calculated from the two parental role
reward and commitment subscales, Cronbach‟s alphas = .784 to .916). Marital role
reward value had 5 items, sample item, „having a successful marriage is the most
important thing in life to me‟, Cronbach‟s alphas = .903 to .912 (Time 1 = .912).
Marital role commitment had 5 items, sample item, „I expect to commit whatever
time is necessary to make my marriage partner feel loved, supported and cared for‟,
Cronbach‟s alphas = .711 to .910 (Time 1 = .910). The Marital Role Salience scale
was calculated from the marital role reward and commitment subscales, Cronbach‟s
alpha = .840 to .935 (Time 1 = .935). High scores on each subscale indicated strong
agreement with the salience of that role.
2.2.6.5 Egalitarian gender role attitudes. Attitudes to gender roles were
assessed with the Egalitarian Gender Role Attitude scale (Moen, 2003), 4 items,
sample items, „it is usually better for everyone if the man is the main provider and
the woman takes care of the family‟ (reversed) and „a working mother can have just
as good relationship with her children as mother who does not work‟, Cronbach‟s
alphas = .710 to .737 (time 1 = .710). High scores indicate more egalitarian attitudes

161
to gender roles.
2.2.7 P, the Person: Demand characteristic variables
2.2.7.1 Social skills. Social skills were measured with the Social Skills Scale
(Ferris et al., 2001), 7 items, sample items, „I find it easy to put myself in the position
of others‟ and „I am good at reading other people‟s body language‟ rated on a Likert
scale, from 1 strongly disagree to 5 strongly agree, Cronbach‟s alphas = .747 to .797
(Time 1 = .747). High scores indicate that the individual s able to manage social
situations.
2.2.7.2 Humour. Humour was measured by the Coping Humour Scale
(Martin & Lefcourt, 1983), 7 items, sample item, „I often lose my sense of humour
when I am having problems‟ (reversed) and „I have found that my problems have
been greatly reduced when I try to find something funny in them‟, rated on a Likert
scale, from 1 strongly disagree to 5 strongly agree, Cronbach‟s alphas = .773 to .820
(Time 1 = .773). High scores indicate humour is used to manage difficult situations.
2.2.8 C, the Context: Workplace conditions
2.2.8.1 Job autonomy. Participants rated how much choice they had in the
decisions at work (Voydanoff, 2004c), 4 items, sample items, „how often do you
have a choice in deciding how you do your tasks at work‟ and „how often do you
have a say in planning your work environment – i.e. how your workplace is arranged
or how things are organized‟, rated on a Likert scale on how often the items were
experienced in the workplace, rated from 1 never, 3 sometimes to 5, all the time.
Cronbach‟s alphas = .847 to .885 (Time 1 = .847). High scores indicate greater
choice about workplace decisions.
2.2.8.2 Skill discretion. Participants rated how much they were able to use
their skills and creativity at work (Schwartz et al., 1988), 6 items, sample items,

162
„does your work require creativity‟ and „in your job, do you keep learning new
things‟, rated on a Likert scale on how often the items were experienced in the
workplace, rated from 1 never, 3 sometimes to 5, all the time. Cronbach‟s alphas =
.853 to .875 (Time 1 = .860). High scores indicate greater ability to use skills and
more opportunities to learn.
2.2.8.3 Job social support. How much the participant could rely on their
supervisor and co-workers was measured by the Job Social Support scale (van Ypern
& Hagedoorn, 2003), 4 items, with 2 items about supervisors and 2 items about co-
workers. The items were similar, substituting co-workers for supervisor in the items
about co-workers. Items were, „can you rely upon your immediate supervisor (co-
workers) when things get tough at work‟ and „if necessary, can you ask your
immediate supervisor (co-workers) for help‟, rated on a Likert scale on whether this
social support would be given, from 1 never, 3 sometimes to 5, all the time.
Cronbach‟s alphas = .846 to .879 (Time 1 = .846). Higher scores indicated that there
was more social support available from supervisors and co-workers.
2.2.8.4 Managerial support for work-life issues. Workplace support for work-
life balance issues was measured by the Managerial Support subscale of the Work-
Family Culture scale (C. A. Thompson et al., 1999), 11 items, sample items, „in the
event of a conflict, managers understand when employees have to put their families
first‟ and „higher management in this organization encourages supervisors to be
sensitive to employees‟ family and personal needs‟, rated on a Likert scale of 1
strongly disagree to 5 strongly agree. Cronbach‟s alphas = .866 to .901 (Time 1 =
.901). Higher scores indicated that immediate managers and supervisors were more
supportive of family issues.
2.2.8.5 Affective commitment. The emotional attachment to the workplace

163
was measured by the Affective Commitment scale (N. J. Allen & Meyer, 1990), 6
items, sample items, „I would be very happy to spend the rest of my career with this
organization‟ and „I do not feel like „part of the family‟ at this organization‟
(reversed), rated on a Likert scale of 1 strongly disagree to 5 strongly agree.
Cronbach‟s alphas = .743 to .795 (Time 1 = .743). Higher scores indicated that the
individual was more affectively attached to their workplace.
2.2.9 C, the Context: The work-life interface
2.2.9.1 Spillover between work and family life. Spillover was measured by the
Work-Family Spillover scale (Grzywacz & Marks, 2000b) with four subscales to
reflect the two factor solution of spillover; the direction of influence (work to home
and home to work) and quality of interaction (negative or positive). Each subscale
had four items, rated on how often these items had been experienced in the previous
year, on a Likert scale of 1, never, 3 sometimes to 5 all the time.
Negative work-to-family spillover, sample items „your job reduces the effort
you can give to activities at home‟ and „job worries or problems distract you when
you are at home‟, Cronbach‟s alphas = .848 to .864 (Time 1 = .864). Positive work-
to-family spillover, sample items, „the things you do at work help you deal with
personal and practical issues at home‟ and „the things you do at work make you a
more interesting person at home‟. Removing item 4 improved the reliability of the
scale and only the 3 item scale was used, Cronbach‟s alphas = .755 to .792 (Time 1 =
.755).
Negative family-to-work spillover, sample items, „responsibilities at home
reduce the effort you can devote to your job‟ and „personal or family worries and
problems distract you when you are at work‟, Cronbach‟s alphas = .770 to .794
(Time 1 = .772). Positive family-to-work spillover, sample items, „talking with
164
someone at home helps you deal with problems at work‟ and „the love and respect
you get at home makes you confident about yourself at work‟, Removing item 4
substantially improved the reliability of the scale and only 3 items were used,
Cronbach‟s alphas = .794 to .810 (Time 1 = .794). Higher scores for negative
spillover in either direction indicate more problems and tiredness from one domain to
the other. Higher scores for positive spillover in either direction indicate that one
domain supports better performance in the other domain.
2.2.10 Well-being, mental illness, burnout and work engagement
2.2.10.1 Life satisfaction. Life satisfaction was measured with the Satisfaction
with Life Scale (SWLS, Diener et al., 1985), 5 items, sample items, „in most ways,
my life is close to ideal‟ and „the conditions of my life are excellent‟, rated on a
Likert scale 1 strongly disagree, to 5 strongly agree. Cronbach‟s alphas = .878 to
.894 (Time 1 = .883). High scores indicated high satisfaction with life‟s conditions.
2.2.10.2 Psychological well-being. Psychological well-being was measured
by the 18 item version of Ryff‟s Scales of Psychological Well-Being (Ryff, 1989).
The short version was chosen because of time and space constraints in the survey
document. The scale had six subscales (of 3 items each, 18 items in total) and as the
subscales did not have adequate reliabilities, the scale was used as a single measure.
Cronbach‟s alphas = .820 to .839 (Time 1 = .820). The subscales were Autonomy,
sample item, „I have confidence in my opinions, even if they are different from the
way that most people think‟; Environmental mastery, sample item, „I am good at
managing the responsibilities of my daily life‟; Positive relations with others, sample
item, „people would describe me as a giving person, willing to share my time with
others‟; Self-acceptance, sample item, „when I look at the story of my life, I am
pleased with how things have turned out so far‟; Purpose in life, sample item, „some

165
people wander aimlessly through life, but I am not one of them‟; and Personal
growth, sample item, „for me, life has been a continual process of learning, changing,
and growth‟. High scores indicated that the individual had a high sense of
psychological well-being in each of these dimensions.
2.2.10.3 Satisfaction with life domains. Single items were used to assess
satisfaction with various life domains. These items were „I am satisfied with my
work life‟, „I am satisfied with my family or personal life‟, „I am satisfied with my
relationship with my spouse or partner‟, „I am satisfied with my sporting,
recreational or non-work activities‟ and „I am satisfied with my or my family‟s
financial position‟. A single item was used to assess the perceived fairness of the
division of household labour, „in my relationship with my spouse or partner, I am
satisfied with the way that work (e.g. childcare, household chores, earning money,
yard work, car maintenance) is divided‟ (Clarke et al., 2004). All items were rated on
a Likert scale of 1 strongly disagree to 5 strongly agree. High scores indicated high
satisfaction with each domain.
2.2.10.4 Mental Illness. Depression, anxiety and stress were measured by the
short version of the Depression Anxiety and Stress Scale (DASS-21, S. H. Lovibond
& P. F. Lovibond, 1995). Each scale had 7 items, rated on a Likert scale of 0, didn‟t
apply to me at all, 2 applied to me to some degree, or some of the time, 4 applied to
me to a considerable degree, or a good part of time, or 6 applied to me very much, or
most of the time. Depression, sample items, „I couldn't seem to experience any
positive feeling at all‟ and „I found it difficult to work up the initiative to do things‟,
Cronbach‟s alphas = .865 to .867 (Time 1 = .867). Anxiety, sample items, „I was
aware of dryness of my mouth‟, and „I was worried about situations in which I might
panic and make a fool of myself‟, Cronbach‟s alphas = .813 to .860 (Time 1 = .813).

166
Stress, sample items, „I found it hard to wind down‟ and „I was intolerant of anything
that kept me from getting on with what I was doing‟, Cronbach‟s alphas = .851 to
.861 (Time 1 = .861). From the published norms for the scales (S. H. Lovibond & P.
F. Lovibond, 1995), the scores for the normal range were as follows, depression (0 to
9), anxiety (0 to 7) and stress (0 to 14); for the mild range for depression (10-13),
anxiety (8 to 9), and stress (15 to 18); for the moderate range for depression (14 to
20), anxiety (10 to 14) and stress (19 to 25); and for the severe range for depression
(21+), anxiety (15+) and stress (26+). Scores on each scale in the mild or greater
categories indicate that the individual had one or more mental illnesses.
2.2.10.5 Burnout. Burnout was measured with the Maslach Burnout Inventory
– General (Maslach et al., 1996), using the three subscales of emotional exhaustion,
cynicism, and professional efficacy. Emotional exhaustion, 5 items, sample items, „I
feel emotionally drained from my work‟ and „I feel used up at the end of the
workday‟, Cronbach‟s alphas = .875 to .892 (Time 1 = .892). Cynicism, 5 items,
sample items, „I have become more and more cynical about whether my work
contributes to anything‟ and „I doubt the significance of my work‟, Cronbach‟s
alphas = .826 to .841 (Time 1 = .841). Professional efficacy, 6 items, sample items, „I
feel exhilarated when I accomplish something at work‟ and „in my opinion, I am
good at my job‟, Cronbach‟s alphas = .735 to .775 (Time 1 = .735). Scales were rated
on a Likert scale of 1 strongly disagree to 5 strongly agree. Higher scores indicated
greater levels of exhaustion and cynicism and greater feelings of professional
competence or efficacy.
2.2.10.6 Work Engagement. Engagement in work was measured with the
Utrecht Work Engagement Scale (Schaufeli et al., 2002), with three subscales
measuring work vigour, work dedication and work absorption. Work vigour was the
167
energy the individual feels at work, 6 items, sample items, „when I get up in the
morning, I feel like going to work‟ and „at my work, I feel bursting with energy‟,
Cronbach‟s alphas = .807 to .815 (Time 1 = .815). Work dedication was the zest and
intrinsic rewards available from work, 5 items, sample items, „I am enthusiastic
about my job‟, „I find the work that I do full of meaning and hope‟, and „to me, my
job is challenging‟, Cronbach‟s alphas = .907 to .912 (Time 1 = .912). Work
absorption was the depth of involvement in work, sample items, „when I am
working, I forget everything else around me‟ and „it is difficult to detach myself from
my job‟, Cronbach‟s alphas = .761 to .796 (Time 1 = .790). Scales were rated on a
Likert scale of 1 strongly disagree to 5 strongly agree. Higher scores indicated that
the individual had greater energy, zest, enthusiasm and involvement in their work.
2.2.11 Procedure
Calls for volunteers were made in two places, a university alumni e-magazine
and by email to the administrative staff of a large public hospital. A second call for
volunteers was made through the university alumni‟s e-magazine the following
month, whilst for the hospital staff, second and third calls for volunteers were sent
via email 10 and 20 days respectively, after the first call for volunteers. Interested
volunteers clicked on the embedded link in the e-magazine or the email to be
directed to the survey, hosted by SurveyMonkey. To facilitate longitudinal data
collection, the last question participants were asked was to give their email address
so that they could take part in the second and third waves of data collection. Data
collection for Time 1 was conducted between late August and early November 2006,
with the longer period reflecting a delay in starting the hospital staff‟s data
collection. However, there were no major events or circumstances over this time that
would negate or skew the results or created any artificial differences.
168
At Time 2 and Time 3, these email addresses were collected and arranged in
blocks of around 50 addresses. Rather than send all the emails at once, this step was
designed to avoid the emails being considered as spam by internet service providers.
Email addresses were always stored separately from any identifying data and there
was no link between the email addresses and any individual‟s responses to the
survey. To ensure that the emails calling for action at Time 2 and Time 3 were sent
correctly, the researcher‟s private email was included as the last in each block of
emails. In this way, each block of emails could be verified as sent. Further, to ensure
the privacy of participants‟ email addresses, the researcher‟s own email address was
in the main address line, with all participants‟ email addresses placed in the BCC (i.e.
blind copy) address line. As with the Time 1 call for volunteers for the hospital staff,
second and third reminder calls to action were sent 10 and 20 days after the initial
call to action. It was necessary to have this reminder as not all participants responded
to the first call. It would appear that once an email is off the first page of messages, it
is „lost‟ to the recipient. Sending reminders allows the participant to take part if they
were too busy or unable to do so in the first instance. Data collection for Time 2
occurred in February and March 2007, whilst data collection for Time 3 occurred in
May and June 2007.
At the end of each data collection period, the data was downloaded from the
SurveyMonkey website as an Excel file. This file was then converted into an SPSS
data file ready for analysis. Participant identification codes were constructed by
taking the individual‟s initials and their birth date, for example, EB160469.
Once the data was in the SPSS format, missing data, skewness and kurtosis
were assessed, scale reliabilities were calculated and then the scales were
constructed. Hierarchical multiple regression was conducted using the Time 1 data

169
set whilst the longitudinal modelling used the panel data (the matched set of
participants) from Times 1, 2 and 3 and is reported in the next chapter.
2.2.12 Analytical strategy for the hierarchical multiple regression (HMR) analyses
2.2.12.1 Variables in each block. The variables will be entered in three
blocks, which reflect the Person and Context components of Bronfenbrenner‟s
developmental equation. The Individual Difference variables combine the measures
of the individual‟s generative disposition and demand characteristics, as well as their
age and gender. The variables are also entered such that the earlier variables are
presumed to be „causes‟ of the later variables (J. Cohen, Cohen, West, & Aiken,
2003). For example, a person (Block 1) „selects‟ a job and „has‟ a family (Block 2)
that have „effects‟ on their work-life interface (Block 3). As such, the blocks (as
shown in Table 2.1) are arranged in a way that will test first the effect of the
individual‟s characteristics to understand the underlying influence of the person, then
the effects of the contexts of their life, as first the work and family variables and then
the work-life interface variables. For simplicity, only the names of the variables,
rather than the scales are given in Table 2.1, as the scales are outlined previously in
the chapter. For all these scales, a high score denotes a high level of that variable,
either as more self-efficacy, greater job autonomy and more positive spillover, as
well as more negative spillover.
The outcomes were considered firstly as the positive outcomes of well-being
(as life satisfaction and psychological well-being), work satisfaction and work
engagement (as vigour, dedication and absorption in work) and secondly, as the
negative outcomes of mental illness (as depression, anxiety and stress) and burnout
(as emotional exhaustion, cynicism and professional efficacy). Again, a high score
indicated a greater level of the outcome, as greater life satisfaction, more emotional

170
Table 2.1
Variables in each block as blocks are entered into hierarchical multiple regressions
Blocks in HMR Variables in block
1 Individual Differences Dispositional optimism, Coping self-efficacy, Humour,
Social skills, Perceived control of time, Egalitarian
gender role attitudes Reward and Commitment from
Occupational, Parental, and Marital roles, Gender, Age
2 Work and Family Affective commitment, Managerial support, Job social
support, Job autonomy, Skill discretion, Hours per
week, Preferred working hours, Family demands,
Children, Marital status, Education
3 Work-Life Interface Work-life balance, Work-life fit, Feeling busy,
Negative work-to-family spillover, Positive work-to-
family spillover, Negative family-to-work spillover,
Positive family-to-work spillover
exhaustion and more professional efficacy. Step 1 assessed the predictive value of
the Individual Difference variables; Step 2 added the assessment of the Work and
Family variables to the Individual Difference variables, whilst Step 3 added the
Work-Life Interface to these variables, so that all variables were assessed together.
2.2.12.2 Statistical considerations for the regression analyses. Consideration
must be given to the possibility that these broad ranging analyses will lead to Type I
errors being commited, such that spurious associations would be considered to be
important (J. Cohen et al., 2003). It would be simpler to minimise the number of
predictor and outcome variables in order to minimise the likelihood of errors but this

171
would negate the purpose of the current research to understand the broad sweep of an
individual‟s self and context. As outlined in the literature review in Chapter 1,
different areas of psychology have focused on variables of particular importance to
each area, with the consequence that individual differences are not widely included
in organizational psychology and the role of work or family are not usually included
in health or personality psychology. Whilst these areas of psychology may by
necessity narrow the focus of their study, the purpose of this thesis was to combine
these diverse strands into a holistic understanding of the working adult, as the person
themselves and their surrounding context. In everyday life, individuals have many
different roles, many different attributes and different working conditions which the
individual does not separate but lives as a whole life.
To reduce the likelihood of Type I errors, the procedure outlined by Cohen et
al. (2003) was followed to ensure that the investigation-wise error rate was
contained. First, variables were entered as blocks in the hierarchical multiple
regression, second, the variance of that set of variables was tested by the F test using
the appropriate alpha level (α = .05), third, if the F test was significant, then the
significance of predictors within the set were tested and fourth, if the F test was not
significant, then the predictors in that set were not interpreted (J. Cohen et al., 2003).
By reducing the large number of predictor variables to three sets of variables and
adding the requirement of a set being significant before being interpreted, the
resulting F and t tests of the analyses were robust and protected against Type I errors.
In this way, error rates were contained for each outcome.
However, as there are multiple outcomes, it was also necessary to consider if
these could also lead to inflation of Type I errors. The significance of the alpha test
was taken „per hypothesis‟ (J. Cohen et al., 2003) and in the current research, this

172
was the specific hypothesis related to the significant predictors of each of the
outcomes. It was important to note that the outcomes were not compared against
each other and there was no hypothesis that suggested that one outcome was more
appropriate than any other to explain developmental outcomes. For example, the
current research would not propose that life satisfaction was a better measure of well-
being than psychological well-being, that depression was a better measure of mental
illness than stress, or any other variation of such comparisons. Each outcome
represented a distinct measure of psychological functioning. Therefore, although
there were many comparisons, the analysis of each outcome was considered to be a
separate examination of the data.
Next, mediation and moderation were considered. It would be difficult to
establish mediation by the process used by Baron and Kenny (1986), where there are
significant relationships between the predictor (A) and the outcome (B), between A
and the mediator (M) and M and B and where the addition of M to the regression
reduces the relationship between A and B to non-significance (Baron & Kenny,
1986; Muller, Judd, & Yzerbyt, 2005). The difficulty here would be to determine
which of the variables in the block would be the mediator that could be tested in the
classic procedure. Where was a possibility of mediation occurring following the
addition of the second or third blocks of variables, a test for multiple mediators was
undertaken (Preacher & Hayes, 2008), using the bootstrapping method to test the
significance of the indirect paths through the mediators. Estimates of the indirect
effects and their 95% confidence intervals (CI) were also calculated with mediation
occurring when the CI did not include zero. However, the overall focus of the
analyses was on understanding how each block adds to the explanation of the
developmental outcomes. As such, the effects from the addition of the second and

173
third blocks were seen by any changes to the beta weights of all variables in each
step. Any changes would the hypothesis for each specific outcome. First, did
individual differences predict that outcome, second, did the work and family factors
add to the outcome, over and above the individual differences, and finally, did the
work-life interface add again to the outcome, over and above individual differences
and the work and family variables? Given the number of variables involved in the
regressions, post hoc analyses of moderation was limited to the effects of the
significant predictor variables on the outcome variables. The question focused on
whether there was evidence of any moderation between the significant predictors to
simplify the analyses and minimise any possibility of Type I errors.
Finally, there was some evidence that there are a number of suppressor
variables in the regression equations. The suppressor variables were not directly
identified but their effects could be seen on other variables. Suppression was
indicated where the zero order correlations between the effected variable and the
outcome variables were less, rather than greater, than the beta weights or semi-partial
correlations between the two variables (i.e. either classical or cooperative
suppression) or the zero order correlation and the beta weight had opposing signs
(i.e. negative suppression). Whilst the presence of suppressor variables may appear
to confuse the understanding of the predictors of a particular outcome, they can be
useful in removing or tidying the variance associated with another predictor variable.
In each case, prediction was improved as the magnitude of the predictor was
increased by the presence of the suppressor variables, clarifying the relationships (J.
Cohen et al., 2003; Conger, 1974; Tabachnick & Fidell, 2001). As the predictor
variables were entered as blocks, a better description may be of suppressor situations,
rather than specific suppressor variables (Tzelgov & Henik, 1991). Cohen et al.

174
(2003) note that more complex models were more likely to include suppression and
that suppression may underlie homeostatic mechanisms, indicating a more complex
explanation and understanding of psychological functioning.
2.3 Results
2.3.1 Data cleaning and screening
Before constructing the scales, the data was examined for missing data.
Participants who missed substantial portions of the survey were deemed to be non-
completers and removed from the potential data set. Similarly, duplicate entries were
removed. This occurred where the participant had begun, paused and returned to
finish the survey and the initial portion was retained by SurveyMonkey. After this
initial tidying of the data set, missing data within items of the scales were found to be
at random and were replaced by the item means (Tabachnick & Fidell, 2001).
The scales for the regression analyses were constructed and assessed for
normality, linearity and homoscedasticity. Normal distribution of the scores on the
scales was considered by their skewness and kurtosis, based on the comparison of the
ratios of the skewness statistic to its standard error and the kurtosis statistic to its
standard error to the z distribution. A z-score > 3.0 would indicate either skewed or
kurtotic distributions (Tabachnick & Fidell, 2001). However, another rule of thumb
for skewness is that when the skewness statistic falls within the range of -1 to +1, this
value indicates a normal distribution (Hair, Anderson, Tatham, & Black, 1998).
For kurtosis, only anxiety and depression showed positive kurtosis, indicating
that most participants had similar scores. For skewness, examination of the scales
found that depression and anxiety were highly positively skewed on both the z-score
calculation and the skewness statistic indicating that most participants reported lower
levels of these variables, whilst for stress, there is milder breach, as the z-score is

175
greater than 3, but the statistic itself is less than 1. Comparison of the mental illness
scores to the published norms (S. H. Lovibond & P. F. Lovibond, 1995) showed that
most participants fell within the normal ranges for depression (normal range 0 to 9,
74.3%), anxiety (normal range 0 to 7, 76.4%) and stress (normal range 0 to 14,
74.9%) which would explain the positive skew of the data. Transformations for
depression and anxiety scales were considered but not pursued, as transformation did
not alter the patterns of results and to maintain interpretability of the results.
Interestingly, there was some negative skew (z > 3, Skew statistic < -1) for
dispositional optimism, egalitarian gender role attitudes, managerial support, job
social support, skill discretion, work vigour, work dedication and professional
efficacy. These results would indicate that participants were mostly optimistic, more
likely to view the genders as equal, receive support from managers and co-workers,
feel that they can use their skills at work, whilst feeling vigorous, enthusiastic and
competent about their work. However, as will be noted in the discussion about
sample size, it was considered that there were sufficient cases to absorb the influence
of these breaches of normality, particularly as the positive skew could be considered
to be mild breaches of skewness as the skewness statistic inside the range of ± 1
(Hair et al., 1998). Further checks of normality were given by examination of the
scatter plots of predicted values to residual errors and the normal probability plots
from the multivariate analyses also found that there were no concerns for normality
(Tabachnick & Fidell, 2001). For all the outcomes, the normal probability plots fell
along the straight diagonal, indicating that the distribution of actual data closely
matched a normal distribution. The scatter plots of predicted versus expected residual
errors were evenly distributed across the range, indicating that there were no
breaches of linearity or homoscedasticity in the regression analyses.

176
Table 2.2
Retention of participants over time, with percentages of original sample of
participants
Participant group Time 1 Time 2 Time 3
University alumni 206 144 (69.9%) 112 (55.2%)
Hospital staff 264 146 (55.3%) 91 (34.5%)
Total 470 290 (61.7%) 203 (48.3%)
After the removal of multivariate outliers (n = 5), the final composition of
participants from the two possible pools of volunteers is shown in Table 2.2, with the
retention of participants across the three time periods. Attrition analysis found that
there were no significant differences between participants who completed all three
measures and those that dropped out after Time 1, based on age (F(1, 462) = 0.024, p
= .877), gender (F(1, 462) = 0.174, p = .677) or the hours worked per week at Time 1
(F(1, 462) = 0.121, p = .729). Also, those participants that were retained over time
did not differ on their preferences for shorter working hours (M = 2.20, SD = 0.76)
than those who dropped out (M = 2.33, SD = 0.84; F(1, 462) = 3.060, p = .080). The
retention of participants over time is reported here to show how participant numbers
changed, although the analyses for Study 1 is based only on the Time 1 participants.
2.3.2 Demographics
At Time 1, participants (N = 470, 78.9% female) ranged in age from 19 to 66
years (M = 38.90 years, SD = 11.05 years) and were mostly married or living with
their partner (n = 293, 62.3%) or single (n = 119, 25.3%). For the hierarchical
multiple regression, marital status was collapsed to either no partner (n = 177,
37.7%) or having a partner (n = 293, 62.3%). The participants represented a broad

177
diversity of lifestages and parental and family demands. The parents among the
participants (n = 242, 51.5%) had between 1 and 6 children (M = 2.26, SD = 0.92),
with most having 2 (n = 126, 52.1%) or 3 children (n = 54, 22.3%). The most
frequent life stage were non-parents under 40 years (n = 183, 38.9%) with the other
life stages being reasonably evenly distributed. Family and parental demands (i.e. the
care associated with dependent children) were calculated from the life stages, from
the least or no parental or family demands (Lifestages 1 and 2, n = 231, 49.1%), to
the limited demands from adult children (Lifestages 6 and 7, n = 87, 18.5%), to some
demands from adolescent children (Lifestage 5, n = 31, 6.6%), to more demands
from children aged 6 to 12 years (Lifestage 4, n = 63, 13.4%), to the most demands
from children under 6 years of age (Lifestage 3, n = 58, 12.3%).
Participants reported that their education as: finished high school (n = 98,
20.9%), trade or TAFE qualification (n= 45, 9.6%), undergraduate tertiary
qualifications (n = 231, 49.1%) or postgraduate tertiary qualifications (n = 96,
20.4%). As could be expected, the alumni group, as university graduates, had
significantly greater levels of educational attainment than the hospital group,
F(1,473) = 116.445, p < .001. However, this disparity was not considered as
limitation as the data for both groups was pooled for the analyses.
The range of hours that the participants worked was from under 10 hours per
week to a maximum of 85 hours per week (M = 40.78 hours, SD = 11.95 hours).
Most participants worked full-time (88.30%), with their hours ranging from 30 to 85
hours (M = 43.73 hours, SD = 8.89 hours) in comparison to part-time workers who
worked less hours (M = 18.22 hours, SD = 7.46 hours). Across all participants,
working longer hours was associated with the desire to work fewer hours per week, r
= -.350, p < .001. Full-time workers showed a stronger preference to work fewer

178
hours (M = 2.17, SD = 0.74) than their current working hours in comparison to part-
time workers (M = 2.91, SD = 0.94), where „3‟ equated to wanting to work „about the
same hours‟, F(1,466) = 44.101, p < .001. Interestingly, part-time workers also had
significantly greater family and parental demands (M = 2.80, SD= 1.64) than did
full-time workers (M = 2.14, SD = 1.43), F(1,473) = 10.150, p = .002. Taken
together, these results would indicate that those participants in part-time work may
have felt their hours about right for them, given their greater family and parenting
needs. There was considerable variation in the hours that the participants‟ spouses
worked, from not working to 120 hours per week (n = 342, M = 36.74, SD = 18.25).
Commuting time per day varied widely also from some participants working from
home to those participants with long commutes of 200 minutes in total each day (M
= 68.10 minutes, SD = 39.14 minutes).
Participants reported their gross household income in bands, with most
participants (87.6%) having incomes between $30,000 and $150,000 (n = 126,
$30,000 to $59,999; n = 124, $60,000 to 89,999; n = 103, $90,000 to 119,999; and n
= 59, $120,000 to $149,999). There were many different occupations and industries
represented among the participants. This was a strength of the study as this diversity
allows for a broad understanding of important factors that are applicable to many
working adults, rather than a narrow emphasis on one occupation alone.
Finally, participants‟ reported that on average, they were in good to very
good health (M = 3.42, SD = 0.88), that their lives were busy, being more than full
but less than hectic (M = 6.49, SD = 1.53, range 1 to 9) and that they felt that their
problems were below the level that would start to cause concern (M = 4.38, SD =
2.10, range 1 to 9). In addition, although the range included both ends of the scales,
on average participants rated both work-life fit and work-life balance near the centre

179
of possible ratings. The fit between their work and family roles was at the midpoint
between the rating of moderately easy and moderately difficult (M = 2.51, SD = 0.74,
range 1 to 4) and their satisfaction with their work-life balance was at the midpoint
(M = 3.06, SD = 1.28, range 1 to 5). When considering satisfaction with non-work
domains, participants were slightly above average for their satisfaction with their
family life (M = 3.76, SD = 1.20, range 1 to 5), for how well household chores were
shared (M = 3.54, SD = 1.21, range 1 to 5) and about average for satisfaction with
their recreational activities (M = 3.05, SD = 1.31, range 1 to 5). Participants with
partners were mostly quite satisfied with their spouse or partner (M = 4.21, SD =
1.14, range 1 to 5).
2.3.3 Scale construction and sample size
To construct each of the measures, the necessary items were reverse scored
(indicated by * after the items, as shown in Appendix I) and all the scale items were
then summed. Cronbach‟s alphas were calculated for each scale and overall, the
scales had good to excellent reliability (i.e. alphas > .70), although the Cronbach‟s
alphas for three scales were problematic: Perceived Control of Time, Positive Work-
to-Family Spillover and Positive Family-to-Work Spillover. Perceived Control of
Time could not be improved by the removal of any one item and it was decided to
use only one item, “I feel in control of my time” in place of the scale as this item had
good face validity for the purpose of the research. The two positive spillover scales
were improved substantially by the removal of item 4 in both scales, leaving the
scale with 3 items. Cronbach‟s alphas for all scales at Time 1 are given on the
diagonal in brackets in Table 2.3, with the single items indicated by a dash, -.
The means, standard deviations and correlations between the variables used
in the hierarchical multiple regressions are shown in Table 2.3, based on the Time 1

180
data set. There were many variables involved as the purpose of these regressions was
to understand Bronfenbrenner‟s developmental equation by bringing together the
different strands of research from individual differences in health to occupational and
organizational psychology. The rule of thumb, N ≥ 50 + 8 m, where m is the number
of independent predictors, allowed for calculation of a sample size (N) that will
detect moderate effect sizes with an alpha = .05 and adequate power (.80)
(Tabachnick & Fidell, 2001). The variables in hierarchical multiple regression were
entered in three blocks as the Individual Difference variables (14 variables), the
Work and Family variables (11 variables) and the Work-Life Interface variables (7
variables), which gives 32 independent variables. The sample size equation was
calculated as N ≥ 50 + (8 * 32) = 50 + 256, therefore N ≥ 306, which indicated that
there were enough participants to meet the criteria of power and effect size.
Tabachnick and Fidel (2001) also note that skewed variables (for example, for
depression and anxiety here) and small effect sizes require more cases for each
independent variable. The authors suggested using the formula, N ≥ (8 / f2) + (m – 1),
where f2 was the effect size (i.e. small, f
2 = .02, medium, f
2 = .15, and large, f
2 = .35).
Using the small effect size, this equation can be calculated as N ≥ (8/.02) + (32 – 1) =
400 + 31, therefore N ≥ 431. By either calculation, the Time 1 sample size (N = 470)
had sufficient power to detect small effect sizes (i.e. r = .10, Cohen, 1988), withstand
skewness in the variables and be robust in its design.
2.3.4 Means, standard deviations and correlations between the variables
The correlations are arranged as the individual difference variables, the work
and family variables, the work-life interface variables and finally the outcome
variables. The effect sizes for these correlations can be read as small (r = .10),
medium (r = .30) and large (r = .50) (Cohen, 1988).

181
Perhaps the most intriguing finding was the limited significant correlations
between gender (variable 13 in Table 2.3) and the other variables. The only outcome
variable that gender had a significant relationship with was work satisfaction, with
women more likely to have greater satisfaction with their work then men. From the
other significant correlations for gender shown in Table 2.3, in addition to being
more satisfied with their work, women were more likely to have less education, to
feel busier, to report greater satisfaction with their work-life balance, to have more
egalitarian gender role attitudes and greater social support from their managers and
co-workers. Men in contrast were more likely to work longer hours, whilst preferring
to work fewer hours, to use more humour as a coping strategy and to have greater
family and parental demands than women. These relationships were further
examined in the multiple regressions to establish whether gender was a significant
predictor for the outcomes, when all the variables were considered.
There were many variables that could be examined for their correlational
relationships. The outcome variables (variables 33 to 44, in Table 2.3) were mostly
highly significantly correlated between themselves and in the expected directions.
For example, psychological well-being was significantly, negatively correlated with
depression and exhaustion, stress was positively correlated to cynicism and work
vigour and work dedication are positively correlated. Consideration of the predictor
variables is limited to working hours (variable 20), often cited as the major cause of
work-life problems (see for example, Pocock, 2003) and dispositional optimism
(variable 1), proposed here as the main component of the active individual and
adaptive self-regulation (see for example, Aspinwall et al., 2002). From the
correlations between the hours that an individual works and the other variables
showed that individuals working longer hours were (Results continued, p 189)

182
Table 2.3
Correlations between the variables included in the hierarchical multiple regressions
Mean SD 1 2 3 4 5
1 Dispositional optimism 21.84 4.77 (.831) 0.551*** 0.308*** 0.239*** 0.343***
2 Coping self-efficacy 119.36 30.12 (.963) 0.400*** 0.323*** 0.387***
3 Perceived control of time 3.16 1.20 - -0.032 0.101*
4 Social skills 24.55 4.18 (.747) 0.244***
5 Humour 24.77 4.54 (.773)
6 Egalitarian gender roles 15.87 3.53
7 Occupational role reward 17.18 3.81
8 Occupational role commitment14.56 4.35
9 Parental role reward 16.54 7.68
10 Parental role commitment 15.67 8.49
11 Marital role reward 14.48 7.37
12 Marital role commitment 17.12 7.56
13 Gender 0.79 0.41
14 Age 38.90 11.05
15 Affective commitment 18.23 4.76
16 Managerial support 38.11 8.86
17 Job social support 14.87 3.61
18 Job autonomy 13.95 3.53
19 Skill discretion 20.85 4.83
20 Hours per week 40.78 11.95
21 Preferred work hours 2.26 0.80
22 Family demands 2.21 1.47
23 Children 1.17 1.31
24 Marital status 1.62 0.49
25 Education 2.69 1.02
26 Satisfaction with WLB 3.06 1.28
27 Work-life fit 2.51 0.74
28 Feeling busy 6.49 1.53
29 Negative WF Spillover 10.80 3.32
30 Positive WF Spillover 7.24 2.47
31 Negative FW Spillover 8.49 2.98
32Positive FW Spillover 9.66 2.99
33 Life satisfaction 16.64 4.77
34 Psychological well-being 70.65 8.89
35 Work satisfaction 3.46 1.21
36 Work vigour 21.23 4.51
37 Work dedication 17.94 4.76
38 Work absorption 16.05 4.17
39 Depression 6.19 6.68
40 Anxiety 4.70 6.01
41 Stress 10.93 7.89
42 Exhaustion 14.67 5.29
43 Cynicism 12.53 4.98
44 Professional efficacy 25.03 3.38 †p <.10, *p <.05, **p <.01, ***p <.001
Note. Cronbach‟s alphas given in brackets on the diagonal, single items indicated by -

183
Table 2.3 (Continued)
6 7 8 9 10
1 Dispositional optimism 0.072 0.080† 0.128** 0.088† 0.077†
2 Coping self-efficacy 0.136** 0.052 0.129** 0.028 0.056
3 Perceived control of time 0.115* 0.024 0.094* 0.019* -0.002
4 Social skills 0.106* 0.157** 0.171*** 0.030 0.014
5 Humour 0.099* -0.034 0.039 0.000 0.016
6 Egalitarian gender roles (.710) 0.066 0.144** -0.075 -0.020
7 Occupational role reward (.711) 0.604*** -0.195*** -0.179***
8 Occupational role commitment (.780) -0.153** -0.148**
9 Parental role reward (.826) 0.784***
10 Parental role commitment (.890)
11 12 13 14 15
1 Dispositional optimism 0.035 0.122** -0.063 0.158** 0.158**
2 Coping self-efficacy -0.015 0.072 -0.006 0.093* 0.098*
3 Perceived control of time -0.059 -0.054 0.019 0.050 0.093*
4 Social skills 0.018 0.075 0.085† -0.033 0.130**
5 Humour -0.068 -0.008 -0.113* 0.166*** 0.105*
6 Egalitarian gender roles -0.202*** -0.136 ** 0.220*** -0.045 0.054
7 Occupational role reward -0.084† -0.051 -0.033 -0.160** 0.128**
8 Occupational role commitment -0.086† -0.052 -0.052 -0.136** 0.219***
9 Parental role reward 0.352*** 0.361*** -0.040 0.269*** -0.015
10 Parental role commitment 0.316*** 0.401*** -0.018 0.170*** 0.033
11 Marital role reward (.912) 0.708*** -0.113* 0.042 0.052
12 Marital role commitment (.910) -0.037 -0.008 0.055
13 Gender - -0.105* 0.033
14 Age - 0.139**
15 Affective commitment (.743)
16 17 18 19 20
1 Dispositional optimism 0.242*** 0.277*** 0.202*** 0.238*** 0.030
2 Coping self-efficacy 0.203*** 0.334*** 0.300*** 0.226*** 0.023
3 Perceived control of time 0.264*** 0.294*** 0.199*** 0.048 -0.129**
4 Social skills 0.116* 0.098* 0.230*** 0.121** -0.002
5 Humour 0.119* 0.190*** 0.142** 0.174*** 0.006
6 Egalitarian gender roles 0.123** 0.139** 0.144** 0.173*** -0.016
7 Occupational role reward 0.066 -0.075 0.095* 0.149** 0.176***
8 Occupational role commitment 0.090† -0.037 0.166*** 0.214*** 0.203***
9 Parental role reward 0.043 0.040 0.143** -0.003 -0.088†
10 Parental role commitment 0.061 0.060 0.098* -0.018 -0.078†
11 Marital role reward -0.037 0.012 0.089† 0.076 -0.011
12 Marital role commitment 0.015 0.056 0.068 0.095* 0.021
13 Gender 0.067 0.102* 0.007 -0.003 -0.156**
14 Age -0.045 0.006 0.143** 0.083† 0.015
15 Affective commitment 0.370*** 0.271*** 0.355*** 0.328*** 0.075
16 Managerial support (.901) 0.480*** 0.360*** 0.145** -0.123**
17 Job social support (.846) 0.311*** 0.171*** -0.113*
18 Job autonomy (.847) 0.420*** 0.026
19 Skill discretion (.860) 0.084†
20 Hours per week - †p <.10, *p <.05, **p <.01, ***p <.001
Note. Cronbach‟s alphas given in brackets on the diagonal, single items indicated by -

184
Table 2.3 (Continued)
21 22 23 24 25
1 Dispositional optimism 0.000 0.035 0.086† 0.080† 0.137**
2 Coping self-efficacy 0.071 -0.037 0.023 -0.019 -0.028
3 Perceived control of time 0.285*** -0.101* -0.045 -0.034 -0.086†
4 Social skills -0.048 0.031 -0.004 0.050 0.069
5 Humour -0.082† 0.073 0.107* 0.068 0.090†
6 Egalitarian gender roles 0.107* 0.001 -0.070 -0.058 0.021
7 Occupational role reward 0.065 -0.230*** -0.190*** -0.166*** 0.231***
8 Occupational role commitment 0.090† -0.138** -0.105* -0.150** 0.198***
9 Parental role reward -0.024 0.515*** 0.526*** 0.302*** -0.022
10 Parental role commitment -0.045 0.476*** 0.466*** 0.338*** -0.021
11 Marital role reward -0.035 0.139** 0.172*** 0.453*** 0.081†
12 Marital role commitment 0.004 0.132** 0.121* 0.473*** 0.062
13 Gender 0.147** -0.101* -0.069 -0.093* -0.160**
14 Age -0.113* 0.199*** 0.554*** 0.181*** -0.061
15 Affective commitment 0.118* 0.084† 0.114* 0.093* 0.006
16 Managerial support 0.164*** 0.026 -0.027 0.039 0.033
17 Job social support 0.164*** 0.008 -0.007 0.107* -0.052
18 Job autonomy 0.067 0.109* 0.123** 0.139** 0.142**
19 Skill discretion -0.022 0.036 0.030 0.052 0.313***
20 Hours per week -0.361*** -0.099* -0.005 -0.018 0.089†
21 Preferred work hours - -0.035 -0.046 -0.068 -0.117*
22 Family demands - 0.668*** 0.355*** 0.057
23 Children - 0.328*** -0.061
24 Marital status - 0.049
25 Education -
26 Satisfaction with WLB
27 Work-life fit
28 Feeling busy
29 Negative work-to-family spillover
30 Positive work-to-family spillover
31 Negative family-to-work spillover
32Positive family-to-work spillover
33 Life satisfaction
34 Psychological well-being
35 Work satisfaction
36 Work vigour
37 Work dedication
38 Work absorption
39 Depression
40 Anxiety
41 Stress
42 Exhaustion
43 Cynicism
44 Professional efficacy †p <.10, *p <.05, **p <.01, ***p <.001
Note. Cronbach‟s alphas given in brackets on the diagonal, single items indicated by -

185
Table 2.3 (Continued)
26 27 28 29 30
1 Dispositional optimism 0.172*** 0.074 -0.009 -0.168*** 0.167***
2 Coping self-efficacy 0.294*** 0.190*** -0.060 -0.261*** 0.130**
3 Perceived control of time 0.578*** 0.497*** -0.449*** -0.487*** 0.023
4 Social skills -0.012 -0.040 0.169*** 0.017 0.211***
5 Humour 0.084† 0.024 0.078† -0.098* 0.187***
6 Egalitarian gender roles 0.134** 0.202*** -0.054 -0.187*** 0.121**
7 Occupational role reward -0.029 -0.035 0.020 0.111* 0.145**
8 Occupational role commitment 0.002 -0.040 0.024 0.036 0.174***
9 Parental role reward 0.011 0.014 0.048 -0.114* 0.002
10 Parental role commitment -0.006 -0.008 0.081† -0.075 0.038
11 Marital role reward 0.052 -0.071 0.067 0.055 0.002
12 Marital role commitment 0.078 -0.047 0.123** 0.074 0.005
13 Gender 0.099* 0.106* 0.010 -0.022 0.079†
14 Age -0.034 0.014 -0.036 -0.094* 0.117*
15 Affective commitment 0.169*** 0.074 0.036 -0.135** 0.327***
16 Managerial support 0.326*** 0.274*** -0.163*** -0.323*** 0.169***
17 Job social support 0.330*** 0.293*** -0.138** -0.363*** 0.130**
18 Job autonomy 0.196*** 0.119* -0.003 -0.130** 0.299***
19 Skill discretion 0.065 -0.019 0.067 -0.020 0.352***
20 Hours per week -0.231*** -0.238*** 0.229*** 0.250*** 0.048
21 Preferred work hours 0.447*** 0.338*** -0.303*** -0.318*** 0.049
22 Family demands -0.101* -0.161*** 0.183*** -0.027 0.046
23 Children -0.084† -0.124** 0.118* -0.065 0.101*
24 Marital status 0.004 -0.057 0.142** 0.040 0.043
25 Education -0.113* -0.175*** 0.122** 0.158** 0.153**
26 Satisfaction with WLB - 0.571*** -0.453*** -0.538*** 0.040
27 Work-life fit - -0.576*** -0.527*** 0.002
28 Feeling busy - 0.433*** 0.098*
29 Negative work-to-family spillover (.864) -0.022
30 Positive work-to-family spillover (.755)
31 Negative family-to-work spillover
32Positive family-to-work spillover
33 Life satisfaction
34 Psychological well-being
35 Work satisfaction
36 Work vigour
37 Work dedication
38 Work absorption
39 Depression
40 Anxiety
41 Stress
42 Exhaustion
43 Cynicism
44 Professional efficacy †p <.10, *p <.05, **p <.01, ***p <.001
Note. Cronbach‟s alphas given in brackets on the diagonal, single items indicated by -

186
Table 2.3 (Continued)
31 32 33 34 35
1 Dispositional optimism -0.207*** 0.286*** 0.468*** 0.536*** 0.259***
2 Coping self-efficacy -0.297*** 0.413*** 0.545*** 0.641*** 0.235***
3 Perceived control of time -0.382*** 0.237*** 0.413*** 0.334*** 0.285***
4 Social skills 0.013 0.155** 0.250*** 0.337*** 0.120**
5 Humour -0.067 0.138** 0.251*** 0.332*** 0.105*
6 Egalitarian gender roles -0.105* 0.060 0.159** 0.223*** 0.174***
7 Occupational role reward -0.045 0.063 0.033 0.097* -0.005
8 Occupational role commitment -0.082† 0.032 0.048 0.096* 0.065
9 Parental role reward 0.049 -0.003 0.112* 0.063 0.101*
10 Parental role commitment 0.054 0.005 0.163*** 0.123** 0.052
11 Marital role reward 0.042 0.224*** 0.168*** 0.084† 0.037
12 Marital role commitment -0.001 0.258*** 0.250*** 0.192*** 0.028
13 Gender -0.008 0.056 0.056 0.040 0.148**
14 Age -0.107* -0.079† -0.006 0.051 0.036
15 Affective commitment -0.091* 0.018 0.152** 0.126** 0.461***
16 Managerial support -0.185*** 0.171*** 0.317*** 0.258*** 0.343***
17 Job social support -0.186*** 0.257*** 0.316*** 0.315*** 0.369***
18 Job autonomy -0.151** 0.163*** 0.327*** 0.328*** 0.359***
19 Skill discretion -0.203*** 0.155** 0.270*** 0.321*** 0.364***
20 Hours per week 0.019 -0.063 -0.060 0.026 -0.084†
21 Preferred work hours -0.097* 0.080† 0.137** 0.027 0.212***
22 Family demands 0.229*** -0.122** -0.008 -0.028 0.113*
23 Children 0.085† -0.088† -0.027 -0.004 0.095*
24 Marital status 0.061 0.160*** 0.166*** 0.077† 0.039
25 Education 0.055 0.054 0.035 0.151** 0.028
26 Satisfaction with WLB -0.300*** 0.267*** 0.421*** 0.278*** 0.397***
27 Work-life fit -0.367*** 0.190*** 0.255*** 0.211*** 0.208***
28 Feeling busy 0.300*** -0.116* -0.123** -0.045 -0.066
29 Negative work-to-family spillover 0.414*** -0.074 -0.250*** -0.264*** -0.351***
30 Positive work-to-family spillover 0.053 0.114 0.139** 0.154** 0.290***
31 Negative family-to-work spillover (.772) -0.110* -0.277*** -0.261*** -0.183***
32Positive family-to-work spillover (.794) 0.493*** 0.465*** 0.100*
33 Life satisfaction (.883) 0.637*** 0.282***
34 Psychological well-being (.820) 0.260***
35 Work satisfaction -
36 Work vigour
37 Work dedication
38 Work absorption
39 Depression
40 Anxiety
41 Stress
42 Exhaustion
43 Cynicism
44 Professional efficacy †p <.10, *p <.05, **p <.01, ***p <.001
Note. Cronbach‟s alphas given in brackets on the diagonal, single items indicated by -
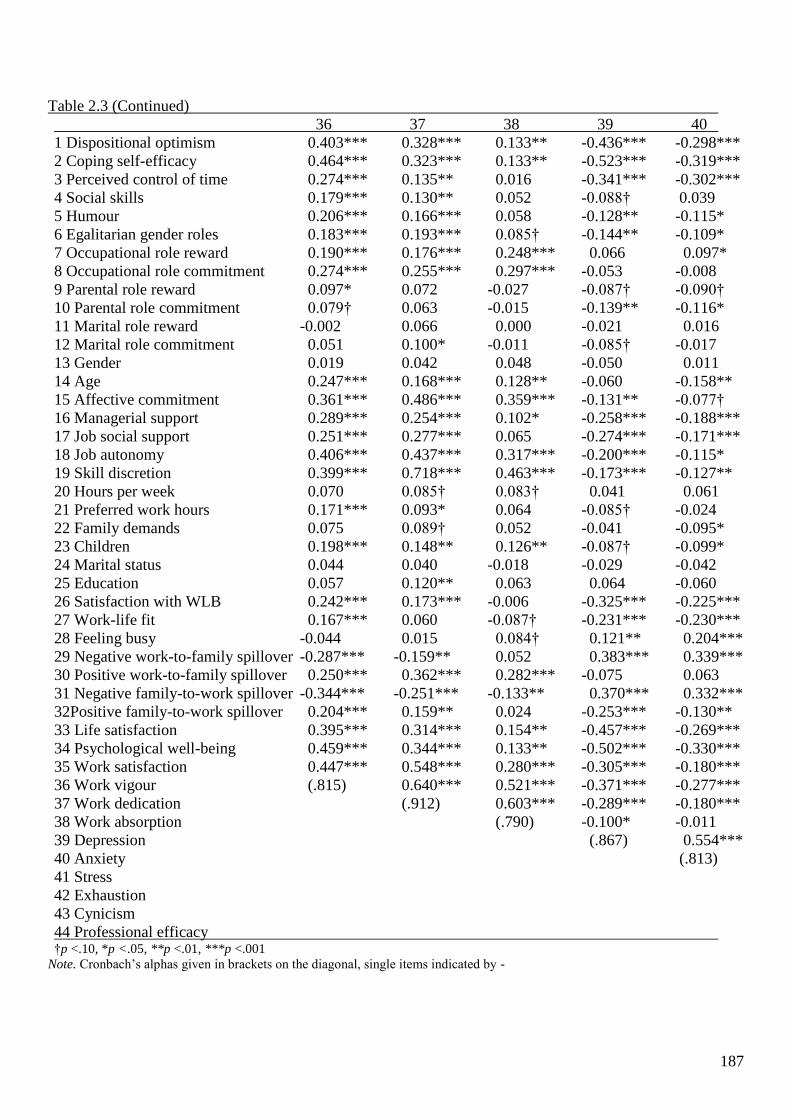
187
Table 2.3 (Continued)
36 37 38 39 40
1 Dispositional optimism 0.403*** 0.328*** 0.133** -0.436*** -0.298***
2 Coping self-efficacy 0.464*** 0.323*** 0.133** -0.523*** -0.319***
3 Perceived control of time 0.274*** 0.135** 0.016 -0.341*** -0.302***
4 Social skills 0.179*** 0.130** 0.052 -0.088† 0.039
5 Humour 0.206*** 0.166*** 0.058 -0.128** -0.115*
6 Egalitarian gender roles 0.183*** 0.193*** 0.085† -0.144** -0.109*
7 Occupational role reward 0.190*** 0.176*** 0.248*** 0.066 0.097*
8 Occupational role commitment 0.274*** 0.255*** 0.297*** -0.053 -0.008
9 Parental role reward 0.097* 0.072 -0.027 -0.087† -0.090†
10 Parental role commitment 0.079† 0.063 -0.015 -0.139** -0.116*
11 Marital role reward -0.002 0.066 0.000 -0.021 0.016
12 Marital role commitment 0.051 0.100* -0.011 -0.085† -0.017
13 Gender 0.019 0.042 0.048 -0.050 0.011
14 Age 0.247*** 0.168*** 0.128** -0.060 -0.158**
15 Affective commitment 0.361*** 0.486*** 0.359*** -0.131** -0.077†
16 Managerial support 0.289*** 0.254*** 0.102* -0.258*** -0.188***
17 Job social support 0.251*** 0.277*** 0.065 -0.274*** -0.171***
18 Job autonomy 0.406*** 0.437*** 0.317*** -0.200*** -0.115*
19 Skill discretion 0.399*** 0.718*** 0.463*** -0.173*** -0.127**
20 Hours per week 0.070 0.085† 0.083† 0.041 0.061
21 Preferred work hours 0.171*** 0.093* 0.064 -0.085† -0.024
22 Family demands 0.075 0.089† 0.052 -0.041 -0.095*
23 Children 0.198*** 0.148** 0.126** -0.087† -0.099*
24 Marital status 0.044 0.040 -0.018 -0.029 -0.042
25 Education 0.057 0.120** 0.063 0.064 -0.060
26 Satisfaction with WLB 0.242*** 0.173*** -0.006 -0.325*** -0.225***
27 Work-life fit 0.167*** 0.060 -0.087† -0.231*** -0.230***
28 Feeling busy -0.044 0.015 0.084† 0.121** 0.204***
29 Negative work-to-family spillover -0.287*** -0.159** 0.052 0.383*** 0.339***
30 Positive work-to-family spillover 0.250*** 0.362*** 0.282*** -0.075 0.063
31 Negative family-to-work spillover -0.344*** -0.251*** -0.133** 0.370*** 0.332***
32Positive family-to-work spillover 0.204*** 0.159** 0.024 -0.253*** -0.130**
33 Life satisfaction 0.395*** 0.314*** 0.154** -0.457*** -0.269***
34 Psychological well-being 0.459*** 0.344*** 0.133** -0.502*** -0.330***
35 Work satisfaction 0.447*** 0.548*** 0.280*** -0.305*** -0.180***
36 Work vigour (.815) 0.640*** 0.521*** -0.371*** -0.277***
37 Work dedication (.912) 0.603*** -0.289*** -0.180***
38 Work absorption (.790) -0.100* -0.011
39 Depression (.867) 0.554***
40 Anxiety (.813)
41 Stress
42 Exhaustion
43 Cynicism
44 Professional efficacy †p <.10, *p <.05, **p <.01, ***p <.001
Note. Cronbach‟s alphas given in brackets on the diagonal, single items indicated by -

188
Table 2.3 (Continued)
41 42 43 44
1 Dispositional optimism -0.254*** -0.279*** -0.332*** 0.259***
2 Coping self-efficacy -0.386*** -0.314*** -0.311*** 0.294***
3 Perceived control of time -0.411*** -0.469*** -0.250*** 0.148**
4 Social skills 0.068 -0.022 -0.102* 0.141**
5 Humour -0.117* -0.151** -0.190*** 0.165***
6 Egalitarian gender roles -0.054 -0.155** -0.205*** 0.205***
7 Occupational role reward 0.130** 0.022 -0.040 0.156**
8 Occupational role commitment 0.021 -0.065 -0.158** 0.119*
9 Parental role reward -0.068 -0.164*** -0.099* 0.075
10 Parental role commitment -0.073 -0.148** -0.120* 0.071
11 Marital role reward 0.006 -0.032 0.006 0.018
12 Marital role commitment 0.038 -0.068 -0.058 0.026
13 Gender 0.015 -0.007 -0.027 0.014
14 Age -0.132** -0.092* -0.136** 0.127**
15 Affective commitment -0.062 -0.308*** -0.542*** 0.282***
16 Managerial support -0.241*** -0.431*** -0.380*** 0.182***
17 Job social support -0.201*** -0.356*** -0.338*** 0.201***
18 Job autonomy -0.094* -0.284*** -0.421*** 0.354***
19 Skill discretion -0.018 -0.138** -0.422*** 0.320***
20 Hours per week 0.134** 0.207*** -0.005 0.032
21 Preferred work hours -0.132** -0.331*** -0.173*** 0.075
22 Family demands 0.005 -0.040 -0.114* 0.101*
23 Children -0.068 -0.076 -0.169*** 0.080†
24 Marital status 0.022 -0.040 -0.060 0.014
25 Education 0.091* 0.057 -0.012 0.075
26 Satisfaction with WLB -0.402*** -0.534*** -0.295*** 0.122**
27 Work-life fit -0.360*** -0.477*** -0.206*** 0.061
28 Feeling busy 0.355*** 0.309*** 0.042 0.069
29 Negative work-to-family spillover 0.539*** 0.673*** 0.364*** -0.076
30 Positive work-to-family spillover 0.041 -0.124** -0.316*** 0.274***
31 Negative family-to-work spillover 0.406*** 0.384*** 0.269*** -0.167***
32Positive family-to-work spillover -0.136** -0.177*** -0.118* 0.177***
33 Life satisfaction -0.281*** -0.331*** -0.288*** 0.263***
34 Psychological well-being -0.320*** -0.359*** -0.392*** 0.339***
35 Work satisfaction -0.232*** -0.470*** -0.597*** 0.345***
36 Work vigour -0.241*** -0.480*** -0.589*** 0.463***
37 Work dedication -0.107* -0.312*** -0.670*** 0.479***
38 Work absorption 0.065 -0.096* -0.327*** 0.316***
39 Depression 0.653*** 0.442** 0.434*** -0.168***
40 Anxiety 0.644*** 0.377*** 0.272*** -0.153**
41 Stress (.861) 0.488*** 0.275*** -0.067
42 Exhaustion (.892) 0.567*** -0.165***
43 Cynicism (.841) -0.429***
44 Professional efficacy (.735) †p <.10, *p <.05, **p <.01, ***p <.001
Note. Cronbach‟s alphas given in brackets on the diagonal, single items indicated by –

189
(Results continued from page 181)
more likely to report more occupational role salience, to feel busier, to have less
work-life fit, to be less satisfied with their work-life balance and to feel they have
less control over their time. Longer working hours were also associated with less
social support from managers and co-workers and less support from managers about
work-life matters and less satisfaction with their family lives and their recreational
activities. Further, longer hours were associated with more negative spillover from
work to family domains, more stress and greater emotional exhaustion. These
associations can have detrimental effects for the individual and it was important for
the regressions to explore these relationships further.
Dispositional optimism was significantly correlated to many of the variables
highlighting the diverse influence of an optimistic view of one‟s life, such as greater
well-being, less mental illness, and more positive spillover but less negative spillover
between work and family domains. However, dispositional optimism did not
influence working hours or preferred hours nor work-life fit or balance, feeling busy
or family demands or occupational or parental role salience. As with gender and
working hours, the results of the multiple regressions will provide information on the
relative importance of dispositional optimism and the other variables, as predictors of
the well-being, mental health, burnout and work engagement outcomes.
2.3.5 Presentation of the results of the HMR
The results of the hierarchical multiple regressions are presented in the tables
that follow, showing the changes to B (unstandardized estimates), the standard error
(SE) of B, beta weights (β) and their significance at each step, with the unique
variance (i.e. the squared semi-partial correlations, sr2) of the significant predictor
variables at each step (Tables 2.4 to 2.15). The tables also report the F test for each

190
step, the change in variance (R2 change, i.e. ΔR
2) associated with that step, the final
variance, R2 and adjusted R
2 and the final F test for the regression. Where
participants had missing data, they were deleted listwise. As noted earlier in the
Results, the multivariate outliers (n = 5) were identified using the Χ2, p < .001
criteria for the Mahalanobis distance and were removed from the data set. The
variance that was uniquely explained by each significant predictor is shown as sr2 in
the tables, with the magnitude of the effect of a predictor taken as small (sr2 = .01),
medium (sr2 = .09) and large (sr
2 = .25) (J. Cohen et al., 2003). There were some
large effects, but most of the effects of the predictor variables were small to small-
medium. Effect sizes for R2 of the models were taken as small (R
2 = .02), medium
(R2 = .15) and large (R
2 = .35) (J. Cohen, 1992) which allowed consideration of the
variance added at each step (ΔR2) and the final variance explained by the model.
The results of the hierarchical multiple regressions show that placing the
individual first in the analyses highlighted the centrality of the individual to the
outcomes. Further, controlling for the „person‟ allows the effects of the workplace or
family responsibilities to be more clearly articulated, now that these are „free‟ of the
influence of the individual, as with adding the Work-Life Interface variables. For
most of the hierarchical multiple regressions, the addition of each set of variables
was a significant increment in the variance explained by the model. The first block of
the Individual Difference variables significantly predicted all of the outcomes with
the Work and Family and Work-Life Interface variables mostly adding significantly
to the outcome variables. Specifically, the addition of the Work and Family variables
did not significantly improve the variance explained for depression, anxiety and
stress and Work-Life Interface variables did not significantly increase the variance
explained for work dedication. Overall, the three sets of variables were sound

191
predictors of the outcomes, with a small number of the variables being the most
common predictors of all the outcomes. The summary of the beta weights for the
outcomes are shown in Table 2.18 and illustrate these „core‟ predictors which will in
turn form the basis for the structural equation modelling in Study 2.
2.3.6 Life satisfaction
The first hierarchical multiple regression was conducted to assess the
influences of the three blocks of variables, the Individual Difference, Work and
Family and Work-Life Interface variables on the individual‟s life satisfaction. The
results of the three steps are shown in Table 2.4. The ΔR2 for each block is shown
across the top line of the table along with its F test. The R2 for the regression model
was very large and significant, R2 = .555, F(32,399) = 15.535, p < .001. The adjusted
R2 was .519, which indicates that just over half of the variability of an individual‟s
life satisfaction was predicted by the combined variables. Individual Difference
variables explained 46.4% of the variance, with Work and Family variables adding
4.3% and Work-Family Interface adding another 4.8%, which were both small but
significant increments to the explanation of life satisfaction.
From Table 2.4, dispositional optimism, coping self-efficacy and perceived
control of time are the most significant, positive predictors of life satisfaction in the
first step with these remaining significant as the other blocks are added. The presence
of children had a negative significant effect on life satisfaction which has been
enhanced by the presence of suppressors (r =-.023, β = -.104), although this effect at
Step 3 only approached significance. At the final step, positive family-to-work
spillover, satisfaction with work-life balance, dispositional optimism, coping self-
efficacy, and, parental role commitment were the strongest predictors of life
satisfaction with small-medium effect sizes and with the rest of the significant

192
Table 2.4
Results for the three steps of hierarchical multiple regressions for life satisfaction
Variables added Step 1 Step 2 Step 3
In each block ΔR2 B (SE of B) β sr
2 ΔR
2 B (SE of B) β sr
2 ΔR
2 B (SE of B) β sr
2
ΔR
2,
F test for ΔR2 .464, F (14,417) = 25.785*** .043, F(11.406) = 3.224*** .048, F(7,399) = 6.105***
Block 1
Dispositional optimism 0.215 0.047 .210*** .028 0.196 0.046 .191*** .022 0.185 0.045 0.180*** .019
Coping self-efficacy 0.044 0.008 .274*** .041 0.041 0.008 .257*** .033 0.027 0.008 0.168** .013
Perceived control of time 0.994 0.166 .245*** .046 0.801 0.174 .198*** .026 0.496 0.194 0.123* .007
Social skills 0.092 0.046 .081* .005 0.071 0.046 .062 0.085 0.044 0.075† .004
Humour 0.050 0.043 .048 0.045 0.043 .043 0.040 0.041 0.039
Egalitarian gender roles 0.136 0.052 .100* .009 0.081 0.052 .059 0.063 0.051 0.046
Occupational role reward 0.060 0.059 .047 0.048 0.059 .037 0.040 0.057 0.031
Occupational role commitment -0.076 0.051 -.069 -0.085 0.052 -.077 -0.061 0.050 -0.056
Parental role reward -0.041 0.039 -.066 -0.037 0.040 -.058 -0.034 0.039 -0.054
Parental role commitment 0.072 0.034 .127* .006 0.080 0.034 .141* .007 0.095 0.033 0.168** .009
Marital role reward 0.071 0.035 .108* .005 0.058 0.035 .088† .003 0.032 0.034 0.049
Marital role commitment 0.070 0.035 .109* .005 0.049 0.035 .076 0.017 0.034 0.026
Gender 0.655 0.453 .055 0.561 0.457 .047 0.387 0.446 0.032
Age -0.033 0.017 -.075† .005 -0.022 0.021 -.050 -0.006 0.021 -0.015
Block 2
Affective commitment -0.027 0.044 -.027 -0.014 0.043 -0.013
Managerial support 0.067 0.024 .121** .009 0.052 0.024 0.095* .006
Job social support -0.039 0.058 -.029 -0.058 0.057 -0.044
Job autonomy 0.126 0.060 .092* .005 0.111 0.058 0.082† .004
Skill discretion 0.098 0.043 .098* .006 0.086 0.043 0.086* .004
Hours per week -0.002 0.016 -.006 0.005 0.016 0.012
Pref work hours 0.248 0.248 .041 0.074 0.250 0.012
Family demands 0.021 0.181 .006 0.156 0.178 0.048
Children -0.378 0.225 -.103† .003 -0.382 0.217 -0.104† .003
Marital status 0.727 0.446 .073 0.466 0.434 0.047
Education -0.146 0.194 -.030 -0.126 0.187 -0.026
Block 3
Satisfaction with WLB 0.676 0.190 0.177*** .014
Work-life fit 0.029 0.323 0.004
Feeling busy 0.111 0.146 0.035
Negative work-to-family spillover 0.055 0.070 0.037
Positive work-to-family spillover -0.067 0.078 -0.034
Negative family-to-work spillover -0.085 0.068 -0.052
Positive family-to-work spillover 0.327 0.067 0.205*** .027
Total R2 = .555, Total Adj R
2 = .519, Final model, F(32,399) = 15.535***
Note. † p < .100, * p < .050, ** p < .010, ***p < .001;

193
predictors having small effects. In summary, life satisfaction, as a global assessment
of subjective well-being, appeared to rest mainly with a supportive home life
(positive family-to-work spillover), satisfaction with the balance between roles, a
sense of optimism and competence and valuing an involvement with children.
Interestingly, many individuals, regardless of parental status strongly agreed that it
was important to be involved with their (current or future) children.
2.3.7 Psychological well-being
The second hierarchical multiple regression was conducted to assess the
influences of the three blocks of variables, the Individual Difference, Work and
Family and Work-Life Interface variables on the individual‟s psychological well-
being. The results of the three steps are shown in Table 2.5. The ΔR2 for each block
is shown across the top line of the table, along with the F test for the addition. The R2
for the regression model was very large and significant, R2 = .586, F(32,399) =
18.821, p < .001. The adjusted R2 was .570, which indicates that just over half of the
variability of an individual‟s psychological well-being was predicted by the
combination of the variables. Specifically, the Individual Difference variables had a
very large effect, explaining 51.6% of the variance, with Work and Family variables
adding 3.4% and Work- Life Interface adding another 3.6%, which were both small
and significant increments to the explanation of psychological well-being.
There are similarities between the significant predictors of psychological
well-being and life satisfaction although there is a predominance of Individual
Difference variables as the significant predictors of psychological well-being when
all variables were considered in the third step. From Table 2.5, half of the individual
Difference variables were significant, positive predictors of psychological well-
being at Step 1, with the strongest predictor, coping self-efficacy having a medium

194
effect size (sr2 = .080). Dispositional optimism and egalitarian gender role attitudes
were also significant and had small-medium effect sizes (sr2 = .027 and .022,
respectively), with the remaining significant predictors with small effects. Skill
discretion and education were the significant predictors from the Work and Family
variables, although with only small effects. At the final step, the significant
predictors were coping self-efficacy, positive family-to-work spillover, dispositional
optimism, social skills, parental role commitment, education, an egalitarian gender
role attitude, affective commitment and negative work-to-family spillover.
In summary, psychological well-being as the individual‟s assessment of the
mastery, direction and relationships in their lives, rested with their self-efficacy, or
competence to manage challenges, their optimism and ability to get on with others, a
supportive home environment, a good education to provide opportunities for more
interesting life experiences, involvement with children and a belief that both genders
should have equal opportunities in life. The facets of psychological well-being, for
example, environment mastery and positive relations with others, could then be seen
as consequences of these predictors, underpinned by the individual‟s belief that they
can manage the challenges that they encounter.
2.3.8 Satisfaction with work
The next hierarchical multiple regression was conducted to assess the
influences of the three blocks of variables, the Individual Difference, Work and
Family and Work-Life Interface variables on the individual‟s satisfaction with their
work. The results of the three steps of the regression are shown in Table 2.6, with
ΔR2 for each step across the top of the table. The R
2 for the regression model was
large and significant, R2 = .474, F(32,399) = 9.468, p < .001. The adjusted R
2 was
.431, which indicates that just under half of the variability of an individual‟s

195
Table 2.5
Results for the three steps for the hierarchical multiple regression for psychological well-being
Variables added Step 1 Step 2 Step 3
In each block ΔR2 B (SE of B) β sr
2 ΔR
2 B (SE of B) β sr
2 ΔR
2 B (SE of B) β sr
2
ΔR2, F test for ΔR
2 .516, F(14,417) = 33.820*** .034, F(11,406) = 2.916*** .036, (F(7,399) = 5.079***
Block 1
Dispositional optimism 0.387 0.079 0.208*** .027 0.319 0.079 .171*** .017 0.309 0.077 .166*** .016
Coping self-efficacy 0.113 0.013 0.384*** .080 0.111 0.014 .379*** .071 0.089 0.014 .302*** .041
Perceived control of time 0.766 0.282 0.104** .008 0.790 0.297 .107** .008 0.368 0.334 .050
Social skills 0.267 0.078 0.129** .013 0.254 0.078 .123** .011 0.262 0.076 .127** .012
Humour 0.119 0.073 0.063 0.079 0.073 .042 0.076 0.071 .040
Egalitarian gender roles 0.390 0.089 0.158*** .022 0.340 0.089 .137*** .015 0.262 0.088 .106** .009
Occupational role reward 0.206 0.101 0.089* 0.134 0.101 .058 0.126 0.098 .055
Occupational role commitment -0.142 0.087 -0.071 -0.206 0.089 -.103* .006 -0.163 0.087 -.082† .004
Parental role reward -0.125 0.065 -0.110† .004 -0.112 0.069 -.098 -0.132 0.067 -.115† .004
Parental role commitment 0.125 0.058 0.121* .005 0.131 0.058 .126* .005 0.153 0.057 .148** .007
Marital role reward 0.065 0.059 0.054 0.034 0.060 .028 -0.005 0.059 -.004
Marital role commitment 0.136 0.059 0.116* .006 0.136 0.060 .117* .006 0.107 0.059 .092† .003
Gender 0.835 0.770 0.038 0.998 0.780 .046 1.061 0.766 .049
Age -0.001 0.029 -0.002 -0.013 0.036 -.015 0.011 0.035 .014
Block 2
Affective commitment -0.045 0.075 -.024 -0.021 0.074 -.012
Managerial support 0.055 0.041 .055 0.027 0.041 .027
Job social support 0.020 0.099 .008 -0.068 0.098 -.028
Job autonomy 0.122 0.102 .049 0.130 0.100 .052
Skill discretion 0.176 0.073 .097* .006 0.179 0.074 .098* .006
Hours per week 0.013 0.028 .018 0.037 0.027 .051
Pref work hours -0.277 0.422 -.025 -0.376 0.429 -.034
Family demands -0.341 0.308 -.057 -0.154 0.306 -.026
Children 0.172 0.383 .026 0.099 0.373 .015
Marital status -0.161 0.761 -.009 -0.465 0.747 -.026
Education 0.939 0.331 .108** .009 1.006 0.322 .115** .010
Block 3
Satisfaction with WLB 0.050 0.326 .007
Work-life fit 0.720 0.555 .059
Feeling busy 0.255 0.252 .043
Negative work-to-family spillover -0.313 0.121 -.117* .007
Positive work-to-family spillover -0.141 0.134 -.039
Negative family-to-work spillover -0.007 0.117 -.002
Positive family-to-work spillover 0.577 0.115 .199*** .025
Total R2 = .586, Total Adj R
2 = .570, F(32,399) = 18.821***
Note. † p < .100, * p < .050, ** p < .010, ***p < .001

196
satisfaction with work was predicted by the combination of the variables.
Specifically, the Individual Difference variables explained 19.0% of the variance,
with Work and Family variables adding 23.7% (both significant, medium effects)
and Work-Family Interface adding another small and significant increment of 4.6%,
to the explanation of work satisfaction.
Unlike life satisfaction and psychological well-being, the contribution to
satisfaction with work from Work and Family variables was greater than that of the
Individual Difference variables. After the addition of the Work-Life Interface
variables, the individual‟s feeling that they had control of their time (β = .228, p <
.001 in Step 1, to β = .082, p = .117 in Step 3) and their egalitarian gender role
attitudes (β = .126, p = .008 in Step1 to β = .058, p = .157 in Step 3) were no longer
significant predictors of work satisfaction. Using the multiple mediation process
(Preacher & Hayes, 2008), the possible mediation of the effect of egalitarian gender
role and perceived control of time were explored. There was no evidence of
mediation for egalitarian gender role attitudes or for perceived control of time, as the
coefficients for the mediation pathways were non-significant and the confidence
intervals included zero (i.e. the indirect paths were not different from zero).
Interestingly, the salience of the occupational role, measured either as role reward or
role commitment, was not a significant predictor of work satisfaction.
At Step 3, the most significant predictors of work satisfaction were higher
levels of affective commitment, satisfaction with work-life balance, skill discretion,
lack of negative work-to-family spillover, parental role reward, dispositional
optimism and gender. Affective commitment had a medium-small effect size (sr2 =
.052), whilst skill discretion (sr2 = .020) and satisfaction with work-life balance (sr
2 =
.021) are smaller. Of note for work satisfaction was that this is the only outcome

197
Table 2.6
Results for the three steps for the hierarchical multiple regression for satisfaction with work
Variables added Step 1 Step 2 Step 3
In each block ΔR2 B (SE of B) β sr
2 ΔR
2 B (SE of B) β sr
2 ΔR
2 B (SE of B) β sr
2
ΔR2, F test for ΔR
2 .190, F(14,417) = 6.983*** .237, F(11,406) = 15.283*** .046, F(7,399) = 5.032**
Block 1
Dispositional optimism 0.040 0.014 .155** .015 0.024 0.013 0.094† .005 0.026 0.012 0.103* .006
Coping self-efficacy 0.001 0.002 .024 0.000 0.002 0.005 0.000 0.002 0.008
Perceived control of time 0.232 0.051 .228*** .040 0.171 0.047 0.168*** .019 0.083 0.053 0.082
Social skills 0.010 0.014 .035 0.001 0.012 0.004 0.001 0.012 0.004
Humour 0.009 0.013 .033 -0.003 0.012 -0.012 -0.010 0.011 -0.039
Egalitarian gender roles 0.043 0.016 .126** .014 0.029 0.014 0.084* .006 0.020 0.014 0.058
Occupational role reward -0.003 0.018 -.010 -0.006 0.016 -0.018 -0.002 0.016 -0.006
Occupational role commitment 0.009 0.016 .034 -0.025 0.014 -0.090† .004 -0.021 0.014 -0.077
Parental role reward 0.026 0.012 .166* .009 0.026 0.011 0.167* .008 0.024 0.011 0.154* .007
Parental role commitment -0.010 0.011 -.071 -0.018 0.009 -0.125† .005 -0.017 0.009 -0.121† .005
Marital role reward 0.019 0.011 .113† .006 0.011 0.009 0.065 0.009 0.009 0.053
Marital role commitment -0.014 0.011 -.088 -0.011 0.009 -0.066 -0.010 0.009 -0.064
Gender 0.429 0.140 .143** .018 0.299 0.124 0.100* .008 0.301 0.122 0.100* .008
Age 0.001 0.005 .010 -0.011 0.006 -0.098† -0.011 0.006 -0.102* .005
Block 2
Affective commitment 0.084 0.012 0.327*** .070 0.074 0.012 0.288*** .052
Managerial support 0.004 0.007 0.031 0.001 0.006 0.006
Job social support 0.031 0.016 0.092† .005 0.023 0.016 0.070
Job autonomy 0.025 0.016 0.074 0.023 0.016 0.068
Skill discretion 0.048 0.012 0.192*** .024 0.046 0.012 0.181*** .020
Hours per week -0.001 0.004 -0.014 -0.001 0.004 -0.007
Pref work hours 0.091 0.067 0.060 0.002 0.068 0.001
Family demands 0.051 0.049 0.062 0.044 0.049 0.053
Children 0.065 0.061 0.070 0.060 0.059 0.065
Marital status -0.178 0.121 -0.071 -0.130 0.119 -0.052
Education 0.020 0.052 0.017 0.034 0.051 0.028
Block 3
Satisfaction with WLB 0.207 0.052 0.216*** .021
Work-life fit -0.020 0.088 -0.012
Feeling busy 0.069 0.040 0.085† .004
Negative work-to-family spillover -0.046 0.019 -0.125* .008
Positive work-to-family spillover 0.038 0.021 0.076† .004
Negative family-to-work spillover -0.001 0.019 -0.003
Positive family-to-work spillover -0.031 0.018 -0.077† .004
Total R2 = .474, Total Adj R
2 = .431, Final model, F(32,399) = 9.468***
Note. † p < .100, * p < .050, ** p < .010, ***p < .001

198
for which gender is a significant predictor with women reporting higher work
satisfaction than men, following on from the significant correlation between gender
and work satisfaction. The influences of age (at Step 3, r = .060, β = -.102, p = .042)
and parental role commitment (at Step 3, r = .066, β = -.121, p = .056) were
enhanced by the presence of suppressor variables, although both variables are on the
cusp of being significant and only have small effects. In summary, work satisfaction
was linked to feeling attached and belonging to your workplace, having work that
used your talents and skills and work that does not intrude or take from the rest of
your life. Minimising the problems that spill over from work, valuing being a parent
(and enabling a sense of perspective to work), being optimistic and younger added to
the explanation of work satisfaction.
2.3.9 Work vigour
The next three hierarchical multiple regressions focus on the components of
work engagement. The first of these regressions will assess the influences of the
three blocks of variables, the Individual Difference, Work and Family and Work-Life
Interface variables on work vigour. The results of the three steps of the regression
were shown in Table 2.7, with ΔR2 for each step, along with their F test, across the
top of the table. The R2 for the overall regression model was large and significant, R
2
= .491, F(32,399) = 12.026, p < .001. The adjusted R2 was .450, which indicates that
just under half of the variability of an individual‟s work vigour was predicted by the
combination of the variables. Specifically, the Individual Difference variables
explained 34.7% of the variance, a significant large effect with Work and Family
variables adding 11.5% and Work-Life Interface adding another 2.8%, which were
both significant (medium and small effects, respectively) increments to the
explanation of work vigour.

199
Table 2.7
Results for the three steps for the hierarchical multiple regression for work vigour
Variables added Step 1 Step 2 Step 3
In each block ΔR2 B (SE of B) β sr
2 ΔR
2 B (SE of B) β sr
2 ΔR
2 B (SE of B) β sr
2
ΔR2, F test for ΔR
2 .347, F(14,417) = 15.845*** .115, F(11,406) = 7.928*** .028, F(7,399) = 3.168***
Block 1
Dispositional optimism 0.143 0.047 .151** .014 0.119 0.045 .125** .009 0.116 0.044 .123** .009
Coping self-efficacy 0.038 0.008 .257*** .036 0.034 0.008 .227*** .026 0.027 0.008 .178** .014
Perceived control of time 0.296 0.169 .079† .005 0.083 0.168 .022 -0.114 0.192 -.030
Social skills -0.005 0.047 -.005 -0.018 0.044 -.017 -0.011 0.044 -.011
Humour 0.010 0.044 .010 -0.005 0.041 -.005 -0.009 0.041 -.009
Egalitarian gender roles 0.108 0.053 .086* .006 0.060 0.050 .048 0.028 0.051 .023
Occupational role reward 0.107 0.060 .091† .005 0.084 0.057 .072 0.092 0.056 .078
Occupational role commitment 0.197 0.052 .194*** .022 0.104 0.050 .103* .006 0.109 0.050 .107* .006
Parental role reward 0.035 0.039 .060 0.016 0.039 .027 0.007 0.038 .013
Parental role commitment 0.016 0.035 .030 0.008 0.033 .015 0.010 0.033 .020
Marital role reward 0.005 0.035 .007 -0.013 0.034 -.021 -0.016 0.034 -.027
Marital role commitment -0.001 0.035 -.002 -0.001 0.034 -.001 -0.009 0.034 -.015
Gender 0.572 0.461 .052 0.236 0.441 .021 0.352 0.440 .032
Age 0.098 0.018 .239*** .048 0.061 0.020 .148** .012 0.061 0.020 .149** .012
Block 2
Affective commitment 0.120 0.042 .128** .011 0.117 0.042 .125** .010
Managerial support 0.041 0.023 .081† .004 0.030 0.023 .058
Job social support -0.019 0.056 -.015 -0.045 0.056 -.037
Job autonomy 0.126 0.058 .100** .006 0.129 0.057 .103* .007
Skill discretion 0.152 0.041 .164*** .018 0.129 0.042 .139** .012
Hours per week 0.025 0.016 .068 0.031 0.016 .084* .005
Pref work hours 0.827 0.238 .149** .016 0.820 0.246 .148** .014
Family demands -0.013 0.174 -.004 0.093 0.175 .031
Children 0.376 0.216 .111† .004 0.327 0.214 .096
Marital status -0.219 0.430 -.024 -0.230 0.428 -.025
Education -0.161 0.187 -.036 -0.097 0.185 -.022
Block 3
Satisfaction with WLB 0.033 0.187 .009
Work-life fit 0.076 0.318 .012
Feeling busy 0.243 0.144 .081† .004
Negative work-to-family spillover -0.163 0.069 -.120* .007
Positive work-to-family spillover -0.004 0.077 -.002
Negative family-to-work spillover -0.199 0.067 -.132** .011
Positive family-to-work spillover 0.092 0.066 .062
Total R2 = .491, Adj R
2 = .450, Final model, F(32, 399) = 12.026***
Note. † p < .100, * p < .050, ** p < .010, ***p < .001

200
In Step 1, increasing age and higher levels of coping self-efficacy,
occupational role commitment, and dispositional optimism were the strongest
predictors of work vigour. Age (sr2 = .048) and coping self-efficacy (sr
2 = .036) had
medium-small effect sizes with the other variables having small effect sizes. The
addition of the Work and Family variables highlighted the importance of workplace
resources to feeling vigorous, as greater skill discretion, affective commitment,
working one‟s preferred hours and having autonomy at work were significant
predictors. The effects of age and occupational role commitment on work vigour
were not mediated by the workplace resources, as the coefficients of the indirect
paths were non-significant and the confidence intervals included zero.
At Step 3, the most significant predictors were higher levels of coping self-
efficacy, older age, working one‟s preferred hours, greater skill discretion, affective
commitment and dispositional optimism, a lack of negative spillover from family to
work and from work to family and more occupational role commitment. The effects
of working hours and feeling busy on vigour are enhanced by the presences of other
suppressor variables, although these were small and only close to being significant.
In summary, feeling vigorous at work depended on feeling confident in one‟s
abilities to manage challenges, being attached and belonging at work, working the
hours you want, feeling the future was positive and not having problems from home
intruding into work domain. In contrast to work satisfaction, perhaps older workers
were more vigorous as they are have accumulated more resources and are more
pragmatic about their jobs, using their past jobs for comparison, whilst being a
realistic about their current jobs.
2.3.10 Work dedication
The second hierarchical multiple regression about work engagement will

201
assess the influence of the three blocks of variables on work dedication. The results
of the three steps are shown in Table 2.8, with the ΔR2 at the top of the table, along
with the F test for each step. The R2 for the overall regression model was very large
and significant, R2 = .662, F(32,399) = 24.367, p < .001. The adjusted R
2 was .634,
which indicated that nearly two thirds of the variability of an individual‟s work
dedication is predicted by the variables. Specifically, the Individual Difference
variables explained 23.9% of the variance in work dedication, with Work and Family
variables adding 41.6%, which was a large and significant increase in the variance
explained, although the Work-Family Interface variables only added another 0.7%,
which was not a significant increase. Therefore, the third block of variables will not
be further considered as part of the results.
Although the Individual Difference variables of dispositional optimism,
egalitarian gender role attitudes, occupational role commitment and age are
significant in Step 1, the most striking predictors to work dedication are the Work
and Family variables of skill discretion and affective commitment. At Step 3, skill
discretion has a large effect (β = .565, p <.001, sr2 = .194) on work dedication, far
outstripping the other significant predictors, affective commitment, dispositional
optimism and education. In summary, work dedication which captured the zest that
an individual has for their work rested substantially on the ability to use one‟s
creativity and skills and to continue learning in one‟s job. Whilst optimism and
attachment to work are contributors, being able to express yourself in your work
increases the pride, meaning and enthusiasm that your job engenders.
2.3.11 Work absorption
The last of the hierarchical multiple regressions on work engagement
assessed the effect of the three blocks of variables on work absorption. The results of

202
Table 2.8
Results for the three steps for the hierarchical multiple regression for work dedication Variables added Step 1 Step 2 Step 3
In each block ΔR2 B (SE of B) β sr
2 ΔR
2 B (SE of B) β sr
2 ΔR
2 B (SE of B) β sr
2
ΔR2, F test for ΔR
2 .239, F(14,417) = 9.333*** .416, F(11,406) = 44.489* .007, F(7,399) = 1.138 ns
Block1
Dispositional optimism 0.180 0.055 .177*** .020 0.094 0.038 .092* .005 0.088 0.039 .087* .004
Coping self-efficacy 0.023 0.009 .147* .012 0.012 0.007 .078† .003 0.011 0.007 .066
Perceived control of time -0.073 0.195 -.018 -0.105 0.144 -.026 -0.193 0.167 -.048
Social skills -0.044 0.054 -.039 -0.044 0.038 -.039 -0.044 0.038 -.039
Humour 0.028 0.051 .027 -0.030 0.035 -.029 -0.037 0.035 -.036
Egalitarian gender roles 0.187 0.062 .139** .017 0.080 0.043 .060 0.077 0.044 .057† .003
Occupational role reward 0.099 0.070 .079 0.064 0.049 .051 0.064 0.049 .051
Occupational role commitment 0.215 0.060 .197*** .023 0.042 0.043 .038 0.040 0.043 .036
Parental role reward 0.014 0.045 .023 0.013 0.033 .021 0.017 0.033 .027
Parental role commitment 0.013 0.040 .023 0.007 0.028 .012 0.004 0.028 .007
Marital role reward 0.049 0.041 .075 0.005 0.029 .008 0.000 0.029 .000
Marital role commitment 0.018 0.041 .029 0.022 0.029 .035 0.022 0.029 .035
Gender 0.854 0.533 .072 0.200 0.378 .017 0.183 0.384 .016
Age 0.083 0.020 .188*** .030 0.021 0.017 .047 0.019 0.018 .043
Block 2
Affective commitment 0.213 0.036 .211*** .029 0.201 0.037 .200*** .025
Managerial support 0.003 0.020 .005 -0.003 0.020 -.005
Job social support 0.070 0.048 .053 0.067 0.049 .050
Job autonomy 0.050 0.049 .037 0.042 0.050 .031
Skill discretion 0.581 0.036 .587*** .226 0.559 0.037 .565*** .194
Hours per week 0.013 0.013 .034 0.014 0.014 .035
Pref work hours 0.336 0.205 .056 0.274 0.215 .046
Family demands 0.049 0.149 .015 0.087 0.153 .027
Children 0.326 0.186 .090† .003 0.286 0.187 .079
Marital status -0.769 0.369 -.078* .004 -0.734 0.374 -.074† .003
Education -0.380 0.160 -.080* .005 -0.378 0.161 -.080* .005
Block 3
Satisfaction with WLB 0.192 0.163 .051
Work-life fit -0.359 0.278 -.055
Feeling busy 0.016 0.126 .005
Negative work-to-family spillover -0.046 0.060 -.032
Positive work-to-family spillover 0.110 0.067 .056
Negative family-to-work spillover -0.092 0.059 -.057
Positive family-to-work spillover 0.014 0.058 .009
Total R2 = .662, Total Adj R
2 = .634, Final model, F(32,399) = 24.367***
Note. † p < .100, * p < .050, ** p < .010, ***p < .001

203
the three steps of the regression are shown in Table 2.9, with ΔR2 for each step, and
its F test for each step, across the top of the table. The R2 for the regression model
was large and significant, R2 = .376, F(32,399) = 7.508, p < .001. The adjusted R
2
was .326, which indicates that about one third of the variability of an individual‟s
absorption in their work is predicted by the variables. Specifically, the Individual
Difference variables explained 14.5% (medium effect), with Work and Family
variables adding 20.7% and the Work-Life Interface variables adding another 2.4%
to the variance, which were both significant increments (medium and small effects,
respectively).
At Step 1, only occupational role reward, occupational role commitment and
age were significant, positive predictors of absorption in work. Although age
becomes non- significant after the addition of the Work and Family variables at Step
2, there was no evidence of any mediation that may have occurred. Similarly,
occupational role reward and commitment became less significant after the addition
of the Work and Family and Work-Life Interface variables but there was no evidence
of mediation for either variable. However, these variables remained significant at
Step 3. Skill discretion, job autonomy and affective commitment were again
influential Work variables with skill discretion having a medium-small effect size
(Step 2, sr2 = .088; Step 3, sr
2 = .068). At Step 3, along with occupational role reward
and commitment, the significant predictors of work absorption were greater skill
discretion, greater affective commitment and more job autonomy. There was
evidence that the effects of education (at Step 3, r = .060, β = -.137, p = .003) and
social skills (at Step 3, r = .044, β = -.090, p = .052) have been enhanced by negative
suppression, as the correlations have the opposite sign to the beta weights. The effect
of negative work-to-family spillover was also positively enhanced by suppressor

204
Table 2.9
Results for the three steps for the hierarchical multiple regression for work absorption Variables added Step 1 Step 2 Step 3
In each block ΔR2 B (SE of B) β sr
2 ΔR
2 B (SE of B) β sr
2 ΔR
2 B (SE of B) β sr
2
ΔR2, F test for ΔR
2 .145, F(14.417) = 5.043*** .207, F(11,406) = 11.784** .024, F(7,399) = 2.200*
Block 1
Dispositional optimism 0.065 0.051 .073 0.037 0.046 .042 0.024 0.046 .027
Coping self-efficacy 0.009 0.009 .067 0.001 0.008 .009 0.002 0.008 .015
Perceived control of time -0.234 0.180 -.067 -0.262 0.172 -.075 -0.027 0.198 -.008
Social skills -0.060 0.050 -.062 -0.082 0.045 -.084† .005 -0.088 0.045 -.090† .006
Humour 0.010 0.047 .012 -0.015 0.042 -.017 -0.013 0.042 -.015
Egalitarian gender roles -0.004 0.057 -.003 -0.064 0.052 -.054 -0.026 0.052 -.022
Occupational role reward 0.142 0.064 .130* .010 0.140 0.058 .128* .009 0.130 0.058 .119* .008
Occupational role commitment 0.240 0.056 .253*** .038 0.135 0.052 .143** .011 0.117 0.051 .123* .008
Parental role reward -0.028 0.042 -.052 -0.049 0.040 -.090 -0.033 0.040 -.061
Parental role commitment 0.031 0.037 .063 0.022 0.034 .044 0.015 0.034 .030
Marital role reward 0.044 0.038 .076 0.014 0.035 .025 0.023 0.035 .040
Marital role commitment -0.038 0.038 -.068 -0.025 0.035 -.045 -0.028 0.035 -.051
Gender 0.851 0.493 .082† .006 0.421 0.452 .041 0.255 0.455 .025
Age 0.066 0.019 .172** .025 0.014 0.021 .037 0.012 0.021 .032
Block 2
Affective commitment 0.129 0.043 .147** .014 0.125 0.044 .143** .013
Managerial support -0.006 0.024 -.012 0.006 0.024 .012
Job social support -0.041 0.057 -.036 -0.004 0.058 -.004
Job autonomy 0.177 0.059 .151** .014 0.160 0.059 .137** .012
Skill discretion 0.315 0.043 .365*** .088 0.288 0.044 .334*** .068
Hours per week -0.007 0.016 -.021 -0.017 0.016 -.051
Pref work hours 0.066 0.245 .013 0.221 0.255 .043
Family demands 0.122 0.178 .043 0.130 0.181 .046
Children 0.282 0.222 .089 0.256 0.221 .081
Marital status -0.439 0.441 -.051 -0.531 0.443 -.062
Education -0.519 0.191 -.126** .012 -0.566 0.191 -.137** .012
Block 3
Satisfaction with WLB -0.026 0.194 -.008
Work-life fit -0.593 0.329 -.103† .005
Feeling busy 0.058 0.149 .021
Negative work-to-family spillover 0.161 0.072 .127* .008
Positive work-to-family spillover 0.090 0.079 .053
Negative family-to-work spillover -0.133 0.069 -.094† .006
Positive family-to-work spillover -0.034 0.068 -.024
Total R2 = .376, Total Adj R2 = .326, Final model F(32,399) = 7.508***
Note. † p < .100, * p < .050, ** p < .010, ***p < .001

205
variables (step 3, r = .080, β = .127, p = .025).
In summary, absorption in work rested with being attached to a job that
allowed the individual to use their skills and creativity, to make their own decisions
and was found in individuals who see their career as salient and important to their
life, although the effects of education, social skills and negative spillover were less
obvious. It could be speculated that individuals with poorer social skills are less
socially capable and spend more time at work to compensate and that education,
whilst opening opportunities, may make the individual more aware of non-work
interests. Negative work-to-family spillover may also lead the individual to spend
more time at work as work problems may be easier to solve than family problems or
work was more salient than the family.
2.3.12 Depression
The next three hierarchical multiple regressions will examine the mental
illnesses, depression, anxiety and stress. The first of these assessed the effect of the
three blocks of variables on depression. The results of the three steps are shown in
Table 2.10, with the ΔR2 for each step and the F test for each step across the top of
the table. The R2 for the model was large and significant, R
2 = .448, F(32,399) =
10.013, p < .001. The adjusted R2 was .403, which indicates that just under half of
the variability in the individual‟s depression was accounted for by the variables.
Specifically, the Individual Difference variables explained 37.3% of the variance
(large effect), Work and Family variables added 2.2%, which was a small, non-
significant increase and the Work-Life Interface variables added 5.3%, which was a
small and significant increase to the explained variance in depression.
At Step 1, about half of the Individual Difference variables were significant,
negative predictors of depression, with a lack of coping self-efficacy being the

206
Table 2.10
Results for the three steps for the hierarchical multiple regression for depression
Variables added Step 1 Step 2 Step 3
At each step ΔR2 B (SE of B) β sr
2 ΔR
2 B (SE of B) β sr
2 ΔR
2 B (SE of B) β sr
2
ΔR2, F test for ΔR
2
.373, F(11,417) = 17.733*** .022, F(11,406) = 1.320 ns .053, F(7,399) = 5.5445***
Block 1
Dispositional optimism -0.309 0.069 -.220*** .030 -0.292 0.070 -.208*** .026 -0.293 0.068 -.209*** .025
Coping self-efficacy -0.093 0.012 -.421*** .096 -0.092 0.012 -.415*** .085 -0.080 0.012 -.362*** .058
Perceived control of time -0.529 0.245 -.095* .007 -0.512 0.264 -.092† .006 0.139 0.296 .025
Social skills 0.118 0.068 .076† .005 0.127 0.069 .082† .005 0.093 0.068 .060
Humour 0.139 0.063 .097* .007 0.157 0.064 .110* .009 0.160 0.063 .112* .009
Egalitarian gender roles -0.192 0.077 -.103* .009 -0.191 0.079 -.103* .009 -0.134 0.078 -.072† .004
Occupational role reward 0.179 0.087 .103* .006 0.156 0.089 .090† .005 0.129 0.087 .075
Occupational role commitment -0.030 0.076 -.020 -0.004 0.079 -.003 -0.011 0.077 -.007
Parental role reward 0.052 0.057 .060 0.082 0.061 .095 0.093 0.059 .109
Parental role commitment -0.109 0.051 -.140* .007 -0.085 0.052 -.110 -0.088 0.050 -.114† .004
Marital role reward -0.019 0.051 -.021 -0.019 0.053 -.021 -0.004 0.052 -.004
Marital role commitment -0.002 0.051 -.002 -0.024 0.053 -.027 -0.013 0.052 -.015
Gender -0.372 0.670 -.023 -0.089 0.693 -.005 -0.437 0.679 -.027
Age 0.007 0.026 .011 0.044 0.032 .072 0.052 0.031 .085† .004
Block 2
Affective commitment -0.044 0.066 -.031 -0.040 0.065 -.029
Managerial support -0.061 0.036 -.081† .004 -0.027 0.036 -.036
Job social support 0.003 0.088 .001 0.044 0.087 .024
Job autonomy 0.026 0.091 .014 0.015 0.088 .008
Skill discretion -0.081 0.065 -.059 -0.036 0.065 -.026
Hours per week 0.016 0.025 .030 0.002 0.024 .003
Pref work hours 0.384 0.375 .047 0.610 0.380 .074
Family demands -0.060 0.274 -.013 -0.304 0.271 -.068
Children -0.606 0.340 -.120† .005 -0.549 0.331 -.109† .004
Marital status 0.521 0.676 .038 0.341 0.661 .025
Education 0.365 0.294 .056 0.226 0.285 .034
Block 3
Satisfaction with WLB -0.430 0.289 -.082
Work-life fit 0.190 0.492 .021
Feeling busy -0.018 0.223 -.004
Negative work-to-family spillover 0.268 0.107 .133* .009
Positive work-to-family spillover 0.006 0.118 .002
Negative family-to-work spillover 0.432 0.103 .193*** .024
Positive family-to-work spillover -0.091 0.102 -.042
Total R2 = .448, Total Adj R
2 = .403, Final model F(32,399) = 10.103**
Note. † p < .100, * p < .050, ** p < .010, ***p < .001

207
strongest predictor with a medium effect size (sr2 = .096). As the addition of the
Work and Family variables did not lead to a significant increment in variance, they
will not be considered further, whilst the Work-Life Interface variables significantly
increased the variance explained. At Step 3, the significant predictors were a lack of
coping self-efficacy and less dispositional optimism, higher levels of negative
family-to-work spillover and negative work-to-family spillover and more humour
used as a coping strategy. There were no variables that showed the influence of
suppressor variables in the analysis. In summary, depression in this current sample
was linked to a lack of confidence in managing difficult situations, lacking positive
expectations for the future and having problems and worries, mostly at home, that
spilt over into other areas of life, rather then the conditions at work or home per se.
Using humour to cope may indicate that this type of humour is used when life is
„blue‟, rather than in more cheerful situations.
2.3.13 Anxiety
The second hierarchical multiple regression on mental illness assessed the
effects of the three blocks of variables on the individual‟s level of anxiety. The
results of the three steps are shown in Table 2.11, with the ΔR2 for each step, and the
F test for each step across the top of the table. The R2 for the model was medium-
large and significant, R2 = .289, F(32,399) = 5.604 , p <.001. The adjusted R
2 was
.232 which indicates that just under one quarter of the variability in the individual‟s
anxiety was accounted for by the blocks of variables. This was the least variance
explained by any of the regression models, which is in turn reflected in the
significant predictors having only small (or slightly more) effect sizes. Specifically,
Individual Difference variable accounted for 19.1% of the variance, the Work and
Family variables accounted for 3.0% and the Work-Life Interface variables
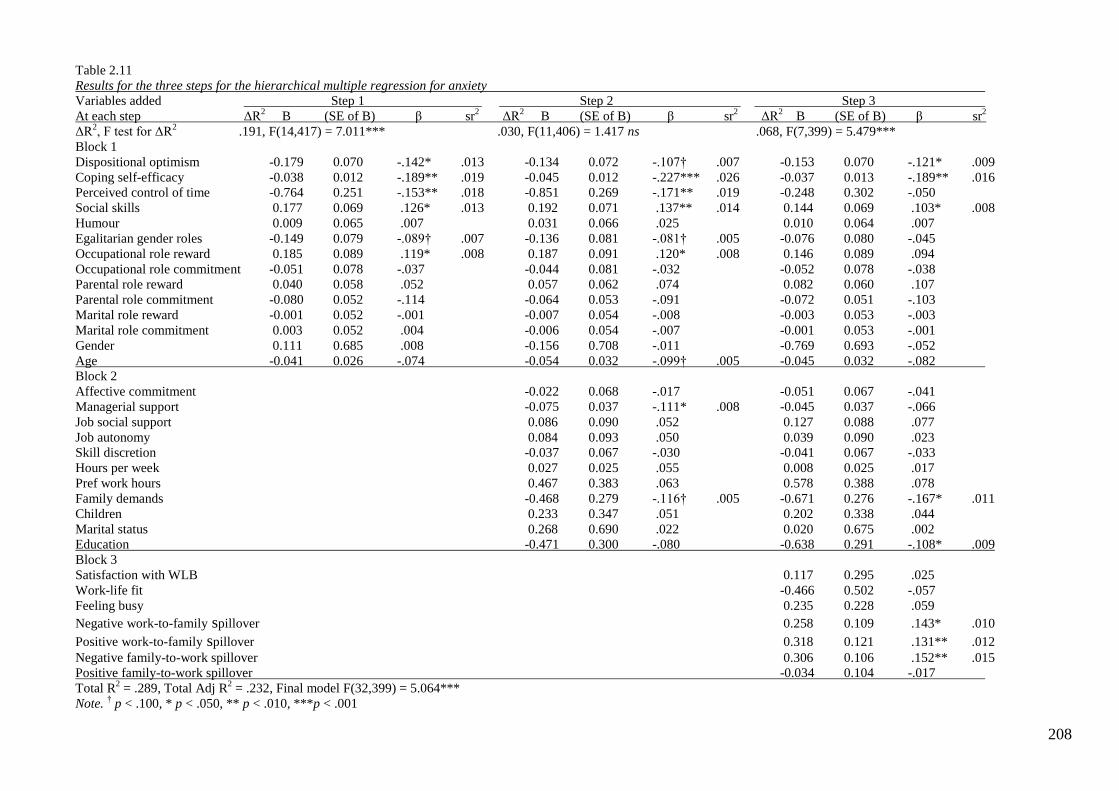
208
Table 2.11
Results for the three steps for the hierarchical multiple regression for anxiety
Variables added Step 1 Step 2 Step 3
At each step ΔR2 B (SE of B) β sr
2 ΔR
2 B (SE of B) β sr
2 ΔR
2 B (SE of B) β sr
2
ΔR2, F test for ΔR
2 .191, F(14,417) = 7.011*** .030, F(11,406) = 1.417 ns .068, F(7,399) = 5.479***
Block 1
Dispositional optimism -0.179 0.070 -.142* .013 -0.134 0.072 -.107† .007 -0.153 0.070 -.121* .009
Coping self-efficacy -0.038 0.012 -.189** .019 -0.045 0.012 -.227*** .026 -0.037 0.013 -.189** .016
Perceived control of time -0.764 0.251 -.153** .018 -0.851 0.269 -.171** .019 -0.248 0.302 -.050
Social skills 0.177 0.069 .126* .013 0.192 0.071 .137** .014 0.144 0.069 .103* .008
Humour 0.009 0.065 .007 0.031 0.066 .025 0.010 0.064 .007
Egalitarian gender roles -0.149 0.079 -.089† .007 -0.136 0.081 -.081† .005 -0.076 0.080 -.045
Occupational role reward 0.185 0.089 .119* .008 0.187 0.091 .120* .008 0.146 0.089 .094
Occupational role commitment -0.051 0.078 -.037 -0.044 0.081 -.032 -0.052 0.078 -.038
Parental role reward 0.040 0.058 .052 0.057 0.062 .074 0.082 0.060 .107
Parental role commitment -0.080 0.052 -.114 -0.064 0.053 -.091 -0.072 0.051 -.103
Marital role reward -0.001 0.052 -.001 -0.007 0.054 -.008 -0.003 0.053 -.003
Marital role commitment 0.003 0.052 .004 -0.006 0.054 -.007 -0.001 0.053 -.001
Gender 0.111 0.685 .008 -0.156 0.708 -.011 -0.769 0.693 -.052
Age -0.041 0.026 -.074 -0.054 0.032 -.099† .005 -0.045 0.032 -.082
Block 2
Affective commitment -0.022 0.068 -.017 -0.051 0.067 -.041
Managerial support -0.075 0.037 -.111* .008 -0.045 0.037 -.066
Job social support 0.086 0.090 .052 0.127 0.088 .077
Job autonomy 0.084 0.093 .050 0.039 0.090 .023
Skill discretion -0.037 0.067 -.030 -0.041 0.067 -.033
Hours per week 0.027 0.025 .055 0.008 0.025 .017
Pref work hours 0.467 0.383 .063 0.578 0.388 .078
Family demands -0.468 0.279 -.116† .005 -0.671 0.276 -.167* .011
Children 0.233 0.347 .051 0.202 0.338 .044
Marital status 0.268 0.690 .022 0.020 0.675 .002
Education -0.471 0.300 -.080 -0.638 0.291 -.108* .009
Block 3
Satisfaction with WLB 0.117 0.295 .025
Work-life fit -0.466 0.502 -.057
Feeling busy 0.235 0.228 .059
Negative work-to-family spillover 0.258 0.109 .143* .010
Positive work-to-family spillover 0.318 0.121 .131** .012
Negative family-to-work spillover 0.306 0.106 .152** .015
Positive family-to-work spillover -0.034 0.104 -.017
Total R2 = .289, Total Adj R
2 = .232, Final model F(32,399) = 5.064***
Note. † p < .100, * p < .050, ** p < .010, ***p < .001
209
accounted for 6.8% of the variance of anxiety. The Individual Difference and Work-
Life Interface variables represented significant increments in variance whilst the
change due to the Work and Family variables was not significant.
At Step 1, coping self-efficacy, dispositional optimism, perceived control of
time, social skills and occupational role reward were significant, negative predictors
of anxiety. Although coping self-efficacy was the strongest predictor, its effect size
was only a little above „small‟, sr2 = .019. As with depression, the addition of the
work and family variables did not significantly change the variance of the model and
were not considered further. However, in Step 3, two of the Work and Family
variables, education and family demands were significant predictors. Education was
again under the influence of suppressor variables and the effect of family demands
appeared to be strengthened by the Work-Life interface variables. Further evidence
of suppressor variables enhancing the effectiveness of variables was shown by social
skills and by positive work-to-family spillover. At Step 3, the significant predictors
of anxiety were a lack of coping self-efficacy, less dispositional optimism, higher
levels of both negative family-to-work spillover and negative work-to-family
spillover and as noted, social skills, positive work-to-family spillover, education and
family demands.
In summary, anxiety in this study appeared to be linked to the management of
problems at work and at home rather than work or family situations per se.
Individuals who were more anxious felt less capable of managing difficult situations,
had less optimistic expectations for the future and had more negative spillover in
both directions between work and family. They also had less family responsibilities
and more education and paradoxically, better social skills and more positive spillover
(i.e. there were benefits from work which may help at home).

210
2.3.14 Stress
The final hierarchical multiple regression for mental illness examined the
effects of the three blocks of variables on the individual‟s level of stress. The results
of the three steps of the analysis are shown in Table 2.12, with the ΔR2 for each step,
and the F test for each step across the top of the table. The R2 for the model was large
and significant R2 = .455, F(32,399) = 10.417, p < .001. The adjusted R
2 was .411
which indicated that just under half of the variability in the individual‟s depression
was accounted for by the blocks of variables. Specifically, the Individual Difference
variables accounted for 27.6% of the variance in stress, the Work and Family
variables accounted for a small and non-significant increment of 2.9%, whilst the
Work-Life Interface had a medium effect of 15.0% on the variance, a significant
increase. As was the case for depression and anxiety, the Work and Family variables
did not add to the prediction of anxiety and will not be further discussed. At Step 1,
coping self-efficacy and perceived control of time were the strongest negative
predictors, having medium-small effect sizes (sr2 = .051, sr
2 = .057, respectively),
with social skills and egalitarian gender roles having smaller contributions. The
addition of the Work-Life Interface variables substantially decreased the beta and
significance of perceived control of time, suggesting mediation. The bootstrap
method of multiple mediators (Preacher & Hayes, 2008) was used to assess if the
effect of perceived control of time on stress was mediated by negative work-to-
family spillover, negative family-to-work spillover and feeling busy, as a simplified
test of the possible mediation. The mediation pathway through „feeling busy‟ was not
significant (i.e. the estimates for the confidence interval included zero). However, the
indirect paths through negative work-to-family spillover (Z = -6.67, p < .001) and
through negative family-to-work spillover (Z = -3.87, p < .001) were significant,

211
Table 2.12
Results for the three steps for the hierarchical multiple regression for stress
Variables added Step 1 Step 2 Step 3
In each block ΔR2 B (SE of B) β sr
2 ΔR
2 B (SE of B) β sr
2 ΔR
2 B (SE of B) β sr
2
ΔR2, F test for ΔR
2 .276, (F(14,417) = 11.369*** .029, F(11,406) = 1.530 ns .150, F(7,399) = 15.706***
Block 1
Dispositional optimism -0.053 0.088 -.032 -0.039 0.090 -.024 -0.073 0.081 -.044
Coping self-efficacy -0.080 0.015 -.306*** .051 -0.087 0.015 -.329*** .054 -0.077 0.015 -.291*** .038
Perceived control of time -1.792 0.314 -.272*** .057 -1.590 0.337 -.241*** .038 -0.055 0.350 -.008
Social skills 0.259 0.087 .140** .015 0.267 0.088 .144** .016 0.190 0.080 .103* .008
Humour 0.016 0.081 .009 0.014 0.082 .008 0.010 0.074 .006
Egalitarian gender roles -0.053 0.099 -.024 -0.076 0.101 -.034 0.065 0.093 .029
Occupational role reward 0.250 0.112 .121* .009 0.252 0.114 .122* .008 0.176 0.103 .085† .004
Occupational role commitment 0.003 0.097 .002 -0.022 0.101 -.013 -0.045 0.091 -.025
Parental role reward 0.000 0.073 .000 0.004 0.078 .004 0.045 0.070 .044
Parental role commitment -0.044 0.065 -.048 -0.035 0.066 -.037 -0.040 0.060 -.043
Marital role reward -0.098 0.066 -.091 -0.119 0.068 -.110† .005 -0.086 0.061 -.079
Marital role commitment 0.125 0.065 .119† .006 0.107 0.068 .102 0.093 0.062 .089
Gender 0.077 0.858 .004 0.363 0.885 .019 -0.742 0.803 -.038
Age -0.032 0.033 -.044 -0.041 0.041 -.056 -0.013 0.037 -.018
Block 2
Affective commitment -0.042 0.085 -.025 -0.041 0.077 -.024
Managerial support -0.135 0.046 -.150** .014 -0.055 0.042 -.061
Job social support 0.125 0.113 .057 0.232 0.103 .106* .007
Job autonomy 0.126 0.116 .057 0.066 0.104 .030
Skill discretion 0.068 0.083 .042 0.095 0.077 .058
Hours per week 0.059 0.031 .091† .006 0.019 0.029 .029
Pref work hours 0.158 0.479 .016 0.859 0.450 .087† .005
Family demands 0.057 0.349 .011 -0.312 0.320 -.058
Children -0.141 0.435 -.023 -0.117 0.391 -.019
Marital status 0.668 0.863 .041 -0.143 0.782 -.009
Education -0.020 0.375 -.002 -0.321 0.337 -.041
Block 3
Satisfaction with WLB -0.566 0.342 -.091† .004
Work-life fit -0.223 0.582 -.021
Feeling busy 0.688 0.264 .131** .009
Negative work-to-family spillover 0.701 0.126 .293*** .042
Positive work-to-family spillover 0.098 0.140 .030
Negative family-to-work spillover 0.503 0.122 .188*** .023
Positive family-to-work spillover 0.042 0.121 .016
Total R2 = .455, Total Adj R
2 = .411, Final model F(32,398) = 10.417***
Note. † p < .100, * p < .050, ** p < .010, ***p < .001

212
indicating mediation had occurred, and the confidence intervals around the estimates
of the indirect effects did not include zero.
At Step 3, the significant predictors of stress were more negative work-to-
family spillover, less coping self-efficacy, more negative family-to-work spillover,
feeling busy and having better social skills, which was enhanced by the presence of
suppressor variables. Managerial support belonged to the non-significant Work and
Family variables and will not be considered to avoid Type 1 errors. In summary,
stress is linked to feeling that life is hectic and the individual was not able to manage
difficult situations, particularly the problems that spill over in both directions
between work and family, which lessened their feelings of controlling their time
2.3.15 Emotional exhaustion
The last set of the hierarchical multiple regressions examined burnout, with
the first to examine the effect of the three blocks of variables on emotional
exhaustion. The results of the three steps of the analyses are shown in Table 2.13,
with the ΔR2 for each step, and the F test for each step across the top of the table.
The R2 for the model was very large and significant, R
2 = .601, F(32,399) = 12.815,
p < .001. The adjusted R2 was .569 which indicates that over half of the variability in
the individual‟s emotional exhaustion was accounted for by the blocks of variables.
Specifically, the Individual Difference variables accounted for 30.1% of the variance
in emotional exhaustion, the Work and Family variables accounted for 13.5%, whilst
the Work-Life Interface accounted for 16.5% of the variance, both of which were
medium effect sizes and significant increases in the explained variance of emotional
exhaustion.
At Step 1, control of time and egalitarian gender role attitudes, with a small
contribution from coping self-efficacy, were the significant negative predictors, with

213
control of time having a slightly greater than medium effect size (sr2 = .114). At step
2, control of time had a reduced input, with affective commitment, managerial
support, preferred working hours and hours per week being significant negative
predictors. However, it was the addition of the Work-Life Interface variables at Step
3 that altered the contributions of the predictor variables, suggesting mediation, in
particular by negative work-to-family spillover (sr2 = .091). Using the bootstrap
method of multiple mediator analyses (Preacher & Hayes, 2008), the possible
mediation of negative work-to-family spillover and negative family-to-work
spillover on the effects of the formerly significant predictors, coping self-efficacy,
perceived control of time, egalitarian gender role attitudes, managerial support, hours
per week and preferred working hours on emotional exhaustion were assessed.
Work-family fit was not included as it did not show evidence of being a mediator.
There was support for mediation occurring, although not for working hours
and preference for working hours (i.e. the confidence intervals for the indirect paths
included zero). The indirect paths through negative work-to-family spillover to
emotional exhaustion were significant for perceived control of time (Z = -9.157, p <
.001), coping self-efficacy (Z = -5.508, p < .001), egalitarian gender role attitudes (Z
= -4.000, p < .001) and managerial support (Z = -6.630, p < .001) with the
confidence intervals around the estimates of the indirect effects not including zero
for any of these paths. The indirect paths through negative family-to-work spillover
to emotional exhaustion were significant for perceived control of time (Z = -2.362, p
= .018), coping self-efficacy (Z = -2.440, p = .015), managerial support (Z = -2.511,
p = .012) and egalitarian gender role attitudes (Z = -1.901, p = .057). These paths
were not as strong as for negative work-to-family spillover and whilst the indirect
path from egalitarian gender role attitudes approached significance, the confidence

214
Table 2.13
Results for the three steps for the hierarchical multiple regression for emotional exhaustion
Variables added Step 1 Step 2 Step 3
In each block ΔR2 B (SE of B) β sr
2 ΔR
2 B (SE of B) β sr
2 ΔR
2 B (SE of B) β sr
2
ΔR2, F test for ΔR
2 .301, F(14,417) = 12.815*** .135, F(11,406) = 8.852*** .165, F(7,399) = 23.494***
Block 1
Dispositional optimism -0.056 0.057 -.051 -0.035 0.054 -.032 -0.056 0.046 -.051
Coping self-efficacy -0.020 0.010 -.115* .007 -0.019 0.009 -.108* .006 -0.010 0.008 -.058
Perceived control of time -1.689 0.204 -.386*** .114 -1.120 0.201 -.256*** .043 -0.198 0.199 -.045
Social skills 0.067 0.057 .055 0.095 0.053 .077† .004 0.073 0.045 .060
Humour -0.072 0.053 -.064 -0.062 0.049 -.055 -0.040 0.042 -.036
Egalitarian gender roles -0.196 0.065 -.134** .016 -0.169 0.060 -.115** .011 -0.041 0.053 -.028
Occupational role reward 0.026 0.073 .019 0.039 0.068 .028 -0.002 0.058 -.002
Occupational role commitment -0.018 0.063 -.015 0.025 0.060 .021 -0.006 0.051 -.005
Parental role reward -0.073 0.048 -.107 -0.071 0.046 -.105 -0.032 0.040 -.047
Parental role commitment -0.025 0.042 -.041 -0.017 0.040 -.027 -0.024 0.034 -.038
Marital role reward -0.024 0.043 -.033 -0.022 0.040 -.031 0.001 0.035 .001
Marital role commitment -0.020 0.043 -.029 -0.031 0.040 -.044 -0.039 0.035 -.056
Gender 0.166 0.559 .013 0.910 0.528 .070† 0.317 0.456 .024
Age -0.005 0.021 -.011 0.004 0.024 .008 0.012 0.021 .026
Block 2
Affective commitment -0.196 0.051 -.179*** .021 -0.167 0.044 -.151*** .014
Managerial support -0.102 0.028 -.171*** .019 -0.052 0.024 -.087* .005
Job social support -0.040 0.067 -.027 0.074 0.058 .051
Job autonomy -0.072 0.069 -.049 -0.102 0.059 -.070† .003
Skill discretion 0.013 0.050 .012 0.026 0.044 .024
Hours per week 0.046 0.019 .106* .008 0.017 0.016 .040
Pref work hours -0.922 0.286 -.142** .014 -0.455 0.255 -.070† .003
Family demands 0.109 0.209 .031 -0.050 0.182 -.014
Children -0.157 0.259 -.039 -0.081 0.222 -.020
Marital status 0.656 0.515 .061 0.231 0.444 .021
Education 0.047 0.224 .009 -0.158 0.191 -.031
Block 3
Satisfaction with WLB -0.370 0.194 -.090† .004
Work-life fit -0.668 0.330 -.093* .004
Feeling busy -0.178 0.150 -.051
Negative work-to-family spillover 0.682 0.072 .430*** .091
Positive work-to-family spillover -0.049 0.079 -.023
Negative family-to-work spillover 0.176 0.069 .099* .006
Positive family-to-work spillover -0.032 0.068 -.019
Total R2 = .601, Total Adj R
2 = .569, Final model F(32,399) = 18.755***
Note. † p < .100, * p < .050, ** p < .010, ***p < .001

215
intervals did not include zero.
At Step 3, higher levels of negative work-to-family spillover were the most
significant predictor of emotional exhaustion. The other significant predictors were a
lack of affective commitment, a lack of managerial support (over and above the
partial mediation by negative spillover in both directions), a lack of work-life and
negative family-to-work spillover.
In summary, emotional exhaustion among the participants was increased by
the negative spillover between work and family domains and a lack of attachment to
one‟s workplace, with negative spillover increased by the absence of a number of
personal and workplace supports. Perceived control of time, coping self-efficacy,
egalitarian gender role attitudes and managerial support were significant, negative
predictors of emotional exhaustion, but their effects are exerted through negative
spillover from both work to home and home to work. As such, the absence of a sense
of being able to control time commitments, a lack of confidence to deal with difficult
situations, a lack of support from ones‟ manager for work and family responsibilities
(i.e. a lack of managerial support) and feeling that gender roles are not based on
merit (i.e. egalitarian gender role were not supported) would increase the negative
spillover that was experienced between work and family domains which would in
turn increase emotional exhaustion.
2.3.16 Cynicism
The second hierarchical multiple regression on burnout will examine the
effect of the three blocks of variables on the individual‟s level of cynicism. The
results of the three steps of the regression are shown in Table 2.14, with the ΔR2, and
its F test, across the top of the table. The R2 for the overall regression model was
very large and significant, R2 = .548, F(32, 399) = 15.122, p < .001. The adjusted R
2

216
was .512, which indicates that just over half of the variability of an individual‟s level
of cynicism is explained by the variables. Specifically, the Individual Difference
variables (22.0%) and Work and Family variables (29.0%) had similar, medium-
large effects on the variance of cynicism, with the Work-Life Interface variables
adding a small (3.8%), significant increment to the explanation of cynicism.
At Step 1, dispositional optimism, perceived control of time, egalitarian
gender role attitudes and occupational role commitment were significant negative
predictors of cynicism, with small effects from each variable (e.g. sr2 = .022 for
egalitarian gender role attitudes). The importance of Step 2, the addition of the Work
and Family variables, was shown by the medium-large increase in variance explained
and the effect sizes of the individual predictors, for example affective commitment
(sr2 = .089) and skill discretion (sr
2 = .033), with the reduction in contributions from
age and occupational role commitment to the understanding of cynicism. The
decrease in the significance of perceived control of time and occupational role
commitment as the subsequent blocks of variables were added suggested mediation,
although there was no evidence of this for occupational role commitment. Following
the bootstrap method for multiple mediators (Preacher & Hayes, 2008), the effect of
perceived control of time on cynicism was mediated by both affective commitment
(Z = -1.996, p = .046) and negative work-to- family spillover (Z = -5.990, p <.001),
and the 95% confidence intervals around the estimates of the direct effects did not
include zero. The link between not feeling in control of your time and greater
cynicism was exerted through less attachment to the workplace and greater negative
spillover between work and home. At Step 3, the significant predictors of cynicism
were a lack of affective commitment and skill discretion, negative work-to-family

217
Table 2.14
Results for the three steps for the hierarchical multiple regression for cynicism
Variables added Step 1 Step 2 Step 3
In each block ΔR2 B (SE of B) β sr
2 ΔR
2 B (SE of B) β sr
2 ΔR
2 B (SE of B) β sr
2
ΔR2, F test for ΔR
2 .220, F(14,417) = 8.400*** .290, F(11,406) = 21.852*** .038, F(7,399) = 4.792***
Block 1
Dispositional optimism -0.169 0.058 -.161** .016 -0.117 0.048 -.111* .007 -0.119 0.046 -.113* .007
Coping self-efficacy -0.017 0.010 -.101† .006 -0.011 0.008 -.066 -0.008 0.008 -.048
Perceived control of time -0.532 0.205 -.128* .013 -0.238 0.178 -.057 0.042 0.201 .010
Social skills 0.017 0.057 .015 0.054 0.047 .046 0.057 0.046 .049
Humour -0.063 0.053 -.059 -0.024 0.044 -.023 -0.005 0.043 -.004
Egalitarian gender roles -0.224 0.065 -.160** .022 -0.172 0.054 -.124** .013 -0.127 0.053 -.091* .006
Occupational role reward 0.051 0.073 .039 0.068 0.060 .053 0.056 0.059 .043
Occupational role commitment -0.165 0.064 -.146* .013 0.000 0.053 .000 -0.008 0.052 -.007
Parental role reward -0.004 0.048 -.006 -0.011 0.041 -.017 0.000 0.040 .001
Parental role commitment -0.064 0.042 -.109 -0.032 0.035 -.055 -0.031 0.034 -.053
Marital role reward 0.005 0.043 .007 0.043 0.036 .063 0.049 0.035 .073
Marital role commitment -0.013 0.043 -.020 -0.029 0.036 -.045 -0.034 0.035 -.051
Gender -0.276 0.561 -.022 0.472 0.468 .038 0.339 0.461 .028
Age -0.052 0.021 -.115* .011 0.022 0.021 .049 0.026 0.021 .057
Block 2
Affective commitment -0.385 0.045 -.368*** .089 -0.355 0.044 -.339*** .073
Managerial support -0.031 0.025 -.056 -0.015 0.024 -.027
Job social support -0.043 0.060 -.031 -0.001 0.059 -.001
Job autonomy -0.154 0.061 -.111* .008 -0.154 0.060 -.110* .008
Skill discretion -0.229 0.044 -.223*** .033 -0.207 0.044 -.201*** .025
Hours per week -0.003 0.017 -.007 -0.010 0.016 -.024
Pref work hours -0.455 0.253 -.073 -0.286 0.258 -.046
Family demands 0.090 0.185 .027 0.050 0.184 .015
Children -0.584 0.230 -.154* .008 -0.510 0.224 -.135* .006
Marital status 0.734 0.456 .072 0.578 0.449 .056
Education 0.310 0.198 .063 0.245 0.194 .050
Block 3
Satisfaction with WLB -0.252 0.196 -.064
Work-life fit 0.037 0.334 .005
Feeling busy -0.278 0.151 -.084† .004
Negative work-to-family spillover 0.297 0.072 .197*** .019
Positive work-to-family spillover -0.148 0.080 -.073† .004
Negative family-to-work spillover 0.107 0.070 .064
Positive family-to-work spillover 0.021 0.069 .013
Total R2 = .548, Total Adj R
2 = .512, Final Model, F(32,399) = 15.122***
Note. † p < .100, * p < .050, ** p < .010, ***p < .001

218
spillover, lower levels of dispositional optimism and less egalitarian gender role
attitudes. In addition, having children was some protection against cynicism.
In summary, cynicism among the participants suggested a jaded view of work
and life. Lacking an attachment to their work, having fewer opportunities to use their
talents, feeling less optimistic about the future and with negative effects spilling from
work to home, cynicism appears to make the individual less hopeful and less
directed. Children may give protection from cynicism by virtue of providing a
different, longer term perspective to life.
2.3.17 Professional efficacy
The last of the hierarchical multiple regressions for burnout examined the
effects of the three blocks of variables on the individual‟s sense of professional
efficacy. The results of the three steps are shown in Table 2.15, with the ΔR2, and its
F test, across the top of the table. The R2 of the final regression model was medium-
large and significant, R2 = .308, F(32, 399) = 5.562, p < .001. The adjusted R
2 was
.253 and indicated that a quarter of the variability professional efficacy was
explained by the variables, which was the second lowest amount of variance
explained by the regression models. As with anxiety with the least explained
variance, the significant predictors had only small effect sizes. For the blocks of
variables, Individual Difference variables had a medium affect and accounted for
17.1 % of professional efficacy, the Work and Family added 10.9% (a medium
effect) and the Work-Life Interface variables added 2.8% (a small effect) to the
explanation of professional efficacy, both of which were significant increments to the
explanation of professional efficacy.
At Step 1, egalitarian gender role attitudes, coping self-efficacy, occupational
role reward and age were significant positive predictors of professional efficacy

219
Table 2.15
Results for the three steps for the hierarchical multiple regression for professional efficacy
Variables added Step 1 Step 2 Step 3
In each block ΔR2 B (SE of B) β sr
2 ΔR
2 B (SE of B) β sr
2 ΔR
2 B (SE of B) β sr
2
ΔR2, F test for ΔR
2 .171, F(14,417) = 6.153*** .109, F(11,406) = 5.614*** .028, F(7,399) = 2.295*
Block 1
Dispositional optimism 0.075 0.039 .108† .007 0.059 0.038 .085 0.048 0.038 .069
Coping self-efficacy 0.018 0.007 .161** .014 0.013 0.007 .122* .007 0.010 0.007 .088
Perceived control of time 0.123 0.140 .045 0.047 0.143 .017 0.145 0.164 .053
Social skills 0.022 0.039 .029 -0.002 0.037 -.002 -0.013 0.038 -.017
Humour 0.034 0.036 .048 0.023 0.035 .033 0.014 0.035 .019
Egalitarian gender roles 0.133 0.044 .144** .018 0.095 0.043 .103* .009 0.103 0.043 .111* .010
Occupational role reward 0.139 0.050 .162** .015 0.133 0.048 .155** .013 0.119 0.048 .139* .011
Occupational role commitment 0.004 0.043 .006 -0.055 0.043 -.074 -0.056 0.043 -.075
Parental role reward 0.016 0.033 .039 0.004 0.033 .010 0.012 0.033 .028
Parental role commitment 0.023 0.029 .058 0.020 0.028 .051 0.018 0.028 .047
Marital role reward 0.030 0.029 .066 0.021 0.029 .047 0.022 0.029 .050
Marital role commitment -0.031 0.029 -.072 -0.021 0.029 -.049 -0.033 0.029 -.075
Gender 0.119 0.382 .015 -0.008 0.375 -.001 -0.228 0.377 -.028
Age 0.033 0.015 .110* .010 0.021 0.017 .069 0.025 0.017 .081
Block 2
Affective commitment 0.099 0.036 .144** .014 0.089 0.036 .129* .011
Managerial support 0.003 0.020 .007 0.008 0.020 .020
Job social support 0.001 0.048 .001 0.008 0.048 .009
Job autonomy 0.157 0.049 .170** .018 0.135 0.049 .147** .013
Skill discretion 0.102 0.035 .150** .015 0.075 0.036 .110* .007
Hours per week 0.004 0.013 .015 -0.001 0.013 -.004
Pref work hours 0.142 0.203 .035 0.202 0.211 .049
Family demands 0.260 0.148 .117† .005 0.293 0.150 .132† .007
Children -0.139 0.184 -.056 -0.172 0.184 -.069
Marital status -0.522 0.366 -.077 -0.700 0.367 -.103† .006
Education -0.117 0.159 -.036 -0.131 0.158 -.040
Block 3
Satisfaction with WLB 0.141 0.160 .055
Work-life fit -0.051 0.273 -.011
Feeling busy 0.312 0.124 .142* .011
Negative work-to-family spillover 0.074 0.059 .074
Positive work-to-family spillover 0.114 0.066 .085† .005
Negative family-to-work spillover -0.095 0.057 -.086† .005
Positive family-to-work spillover 0.073 0.057 .067
Total R2 = .308, Total Adj R2 = .253, Final Model F(32,399) = 5.562***
Note. † p < .100, * p < .050, ** p < .010, ***p < .001
220
with slightly above small effect sizes (e.g. sr2 = .018 for egalitarian gender role
attitudes). The addition of the Work and Family variables showed that the
availability of workplace resources were important to professional efficacy and these
remain significant when the Work-Life Interface variables were added. At Step 3, the
significant predictors of professional efficacy were higher levels of the workplace
resources, job autonomy, affective commitment and skill discretion, along with
feeling busy, finding the occupational role rewarding and supporting egalitarian
gender role attitudes.
The decrease in the significance of coping self-efficacy suggested that
mediation of its effect on professional efficacy had occurred. Using the bootstrapping
method of multiple mediators (Preacher & Hayes, 2008), the possible mediators of
job autonomy, affective commitment and feeling busy were tested. The results found
that the effect of coping self-efficacy was mediated by job autonomy, as the indirect
path through was significant (Z = 3.981, p < .001) and the 95% confidence intervals
around the estimate of the indirect effect did not include zero.
In summary, the participants‟ professional efficacy was linked to the
availability of workplace resources and their use. Participants with greater
professional efficacy can feel free to make their own decisions (i.e. job autonomy),
they feel busy and active, using their skills and talents in a workplace that they are
attached to, in occupations that they feel are interesting and rewarding and where
everyone is considered equal (i.e. egalitarian gender role attitudes are supported).
2.3.18 Summary of the significant predictors of the hierarchical multiple regressions
The significant predictors of the outcomes of the preceding hierarchical
multiple regressions were many and varied, although there were some patterns that
did emerge. Table 2.16 brought together the beta weights from each regression

221
model, with the significant predictors highlighted in bold to make them easier to see.
It was hypothesized that the individual with a more generative disposition and more
positive demand characteristics, with more workplace and family resources would be
predictive of better psychological functioning, which was generally supported,
although more specific hypotheses about individual predictors of the outcomes were
harder to qualify. However, Table 2.16 makes it clear that whilst the preceding
regressions tested a large number of variables, only a small number of predictors
were consistently important across all the outcomes. These were personal and
workplace resources (Hobfoll, 2002) that the individual could use to meet the
challenges of work and family issues and which underpinned their overall
functioning.
From P, the Person (i.e. the Individual Difference variables), only
dispositional optimism (8 of the 12 outcomes) and coping self-efficacy (6 of the 12
outcomes) were among the most frequent predictors, being particularly important for
the well-being and mental illness outcomes. Perceived control of time and egalitarian
gender role attitudes were initially important but were mediated by negative spillover
in both directions for a number of outcomes. Perhaps not surprisingly, neither marital
role reward nor commitment were important for these outcomes and may be
significant predictors for analyses that focus more on relationships. Humour was not
a significant predictor except for depression and this puzzling lack of predictiveness
was examined in the post hoc analyses in the following section. Gender also was
surprisingly not a significant predictor, apart from women reporting higher work
satisfaction than men. Whilst men and women may have different roles and
responsibilities, in this sample they did not differ on their well-being, their
engagement in work or their levels of mental illness and burnout.

222
From C, the context of the Work and Family variables, the workplace
resources of skill discretion (8 of the 12 outcomes), affective commitment (7 of 12
outcomes), job autonomy (4 of the 12 outcomes) and education (4 of the 12
outcomes) were among the important, frequent predictors. However, the effect of
education on the outcomes was often enhanced by suppressor variables, which may
not occur again in later analyses, limiting its explanatory power. Job autonomy,
although only predicting a small number of outcomes, was particularly important to
the understanding of burnout and work engagement. Of limited value to the
regression models were some surprising variables. Managerial support, job social
support, working hours, family demands and number of children are often considered
important to working adults but this was not the case in these analyses. Particularly
for managerial support and job social support, in part due to the mediation of their
effects by negative spillover.
From the Work-Life Interface variables, negative work-to-family spillover (9
of the 12 outcomes) and negative family-to-work spillover (5 out of the 12 outcomes)
were the most important predictors with limited input from positive spillover scales,
work family fit and balance and how busy a person felt. Whilst positive work-to-
family spillover did not contribute significantly to the outcomes, positive family-to-
work spillover, capturing a supportive home environment was important to the
overall assessment of well-being, contributing strongly to both life satisfaction and
psychological well-being. From the mediation analyses within the previous
regressions, negative work-to-family spillover mediated between a number of
predictors and the outcomes, for example, for both perceived control of time and
managerial support to emotional exhaustion. As both negative spillover scales were
influential in understanding the outcomes, a post hoc investigation of the predictors

223
Table 2.16
Summary of standardized regression weights (β) of the predictor variables for the hierarchical multiple regressions .
Well-being Work engagement Mental illness Burnout .
Variables entered in Life Psychological Work Professional
Each block Satisfaction WB Satisfaction Vigour Dedication Absorption Depression Anxiety Stress Exhaustion Cynicism Efficacy
Block 1
Dispositional optimism .180*** .166*** .103* .123** .087* .027 -.209*** -.121* -.044 -.051 -.113* .069
Coping self-efficacy .168** .302*** .008 .178** .066 .015 -.362*** -.189** -.291*** -.058 -.048 .088
Perceived control of time .123* .050 .082 -.030 -.048 -.008 .025 -.050 -.008 -.045 .010 .053
Social skills .075† .127** .004 -.011 -.039 -.090† .060 .103* .103* .060 .049 -.017
Humour .039 .040 -.039 -.009 -.036 -.015 .112* .007 .006 -.036 -.004 .019
Egalitarian gender roles .046 .106** .058 .023 .057† -.022 -.072† -.045 .029 -.028 -.091* .111*
Occupational role reward .031 .055 -.006 .078 .051 .119* .075 .094 .085† -.002 .043 .139*
Occupational role commitment -.056 -.082† -.077 .107* .036 .123* -.007 -.038 -.025 -.005 -.007 -.075
Parental role reward -.054 -.115† .154* .013 .027 -.061 .109 .107 .044 -.047 .001 .028
Parental role commitment .168** .148** -.121† .020 .007 .030 -.114† -.103 -.043 -.038 -.053 .047
Marital role reward .049 -.004 .053 -.027 .000 .040 -.004 -.003 -.079 .001 .073 .050
Marital role commitment .026 .092† -.064 -.015 .035 -.051 -.015 -.001 .089 -.056 -.051 -.075
Gender .032 .049 .100* .032 .016 .025 -.027 -.052 -.038 .024 .028 -.028
Age -.015 .014 -.102 .149** .043 .032 .085† -.082 -.018 .026 .057 .081
Block 2
Affective commitment -.013 -.012 .288*** .125** .200*** .143** -.029 -.041 -.024 -.151*** -.339*** .129*
Managerial support .095* .027 .006 .058 -.005 .012 -.036 -.066 -.061 -.087* -.027 .020
Job social support -.044 -.028 .070 -.037 .050 -.004 .024 .077 .106* .051 -.001 .009
Job autonomy .082 .052 .068 .103* .031 .137** .008 .023 .030 -.070† -.110* .147**
Skill discretion .086* .098* .181*** .139** .565*** .334*** -.026 -.033 .058 .024 -.201*** .110*
Hours per week .012 .051 -.007 .084* .035 -.051 .003 .017 .029 .040 -.024 -.004
Pref work hours .012 -.034 .001 .148** .046 .043 .074 .078 .087† -.070† -.046 .049
Family demands .048 -.026 .053 .031 .027 .046 -.068 -.167* -.058 -.014 .015 .132†
Children -.104† .015 .065 .096 .079 .081 -.109† .044 -.019 -.020 -.135* -.069
Marital status .047 -.026 -.052 -.025 -.074† -.062 .025 .002 -.009 .021 .056 -.103†
Education -.026 .115** .028 -.022 -.080* -.137** .034 -.108* -.041 -.031 .050 -.040
Block 3
Satisfaction with WLB .177*** .007 .216*** .009 .051 -.008 -.082 .025 -.091† -.090† -.064 .055
Work-life fit .004 .059 -.012 .012 -.055 -.103† .021 -.057 -.021 -.093* .005 -.011
Feeling busy .035 .043 .085† .081† .005 .021 -.004 .059 .131** -.051 -.084 .142*
Negative WF Spillover .037 -.117* -.125* -.120* -.032 .127* .133* .143* .293*** .430*** .197*** .074
Positive WF Spillover -.034 -.039 .076† -.002 .056 .053 .002 .131** .030 -.023 -.073† .085†
Negative FW Spillover -.052 -.002 -.003 -.132** -.057 -.094† .193*** .152** .188*** .099* .064 -.086†
Positive FW Spillover .205*** .199*** -.077† .062 .009 -.024 -.042 -.017 .016 -.019 .013 .067
Note. † p < .100, * p < .050, ** p < .010, ***p < .001
Note. WF = work-to-family; FW = family-to-work

224
of both negative work-to-family spillover and negative family-to-work spillover were
conducted, following the post hoc analyses of moderation, humour and gender.
Generally, the individual‟s confidence in the future and their capabilities,
where they are attached to a job that allows them to use their skills and talents and
make their own decisions, without too many problems or tiredness spilling over
between work and home domains can reasonably predict greater well-being, better
mental health, less burnout and more work engagement and work satisfaction.
Specific additional predictors add to specific outcomes. For example, a supportive
home environment and valuing the parenting role adds specifically to greater well-
being, whilst work-life fit do not contribute to mental health or well-being but did
add to feeling less emotional exhaustion. Variables that would be considered
important, such as perceived control of time and managerial support were found to
be mediated by negative spillover removing them from the final list of significant
predictors. The summary of the significant predictors highlighted that both the broad
outline of predictors as well as the fine-grained analyses for each outcome best
explained the individual‟s developmental outcomes.
2.3.19 Post-hoc analysis: Examining moderation between the most common
predictors for the outcomes
Following on from the mediation explored within the regression analyses, the
first step of the post hoc analyses was to consider if there was any moderation
between the variables, to add to the explanatory power of the regression models.
Rather than use all of the predictor variables, the process will be simplified by using
only the most frequent significant predictors identified in the previous section. This
kept the number of comparisons within bounds as well as using only those variables
that have already „proved‟ themselves. The Type I errors were controlled by dividing

225
by the number of actual comparisons (16 in total) made for each outcome to maintain
the „per hypothesis‟ alpha (α < .05/16 < .0031) (J. Cohen et al., 2003). Only an
interaction that was significant at α ≤ .003 was deemed to be significant and the
moderation examined further.
The comparisons for moderation that were considered were between each of
the two individual difference variables (dispositional optimism and coping self-
efficacy) and each of the three workplace resources (affective commitment, job
autonomy and skill discretion) and each of negative work-to-family spillover
(NWFS) and negative family-to-work spillover (NFaWS). These combinations gave
five comparisons for each individual difference variable, as the individual difference
variables were combined in turn with a workplace resource and then with each
spillover scale (10 in total). The three workplace resources were then combined in
turn with each of the negative spillover scales, giving two comparisons for each
resource (6 in total), adding up to the 16 planned comparisons.
The variables were centred and interaction terms calculated from the centred
variables. The hierarchical multiple regressions conducted for the possible
combinations, with the centred variables in Step 1 (for example, Opt-C, NWFS-C,
the centred variables for dispositional optimism and negative work-to-family
spillover) and the interaction term in Step 2, with the criterion variable remaining in
its original form (J. Cohen et al., 2003). Only nine significant interactions were
found. Five involved individual difference variables, with negative spillover in both
directions moderated the effect of optimism on depression, whilst negative family-to-
work spillover moderated the effect of optimism on anxiety. Negative work-to-
family spillover moderated the effect of coping self-efficacy on depression and
anxiety. For the four significant interactions involving the workplace variables,

226
negative work-to-family spillover moderated the effect of skill discretion on
absorption in work and affective commitment on professional efficacy. Negative
family-to-work spillover moderated the effect of job autonomy on both exhaustion
and cynicism.
The results of the moderated regression analyses at Step 2 are shown in Table
2.17, giving the B, SE of B, standardized beta weights (β) and unique variance of the
centred predictors and the interaction terms (sr2). Not only are most of the
interactions between the centred variables significant, but nearly all of the main
effects were significant as well, which would be expected from the regression
analyses. These results indicated that the presence or absence of personal and
workplace resources and negative spillover, as well as their combinations, were
important to the individual‟s experience of mental health, work engagement and
burnout. The simple slopes for high and low levels of the moderating variables,
negative work-to-family spillover (NWFS) and negative family-to-work spillover
(NFaWS) are listed in Table 2.18. All of the simple slopes are significant and are
mostly negative, except for the simple slopes where the outcome was a „positive‟, i.e.
between skill discretion and work absorption and between affective commitment and
professional efficacy. The significant negative slopes indicate that at low levels of
the first variable (i.e. low in a resource), participants would have significantly higher
levels of the criterion variable (i.e. a mental illness or burnout) regardless of the level
of negative spillover, than for an individual who is high in that variable. However,
examination of the simple slopes, shown in Appendix G, Figures G1 to G.6, indicate
that the moderating influence of negative spillover operated differently, whether it
was a personal resource (i.e. dispositional optimism or coping self-efficacy) or a
workplace resource (i.e. affective commitment, job autonomy or skill discretion).

227
Table 2.17
Results at Step 2, showing the significant interactions in the moderated regression
Outcomes Predictors B SE of B β sr2
Depression Opt-C -0.536 0.055 -.382*** .142
NWFS-C 0.582 0.080 .289*** .078
OptxNW-C -0.062 0.016 -.150*** .021
Depression Opt-C -0.546 0.056 -.390*** .144
NFaWS-C 0.604 0.091 .269*** .067
OptxNFa-C -0.060 0.019 -.126** .015
Depression CSE-C -0.104 0.009 -.470*** .204
NWFS-C 0.543 0.077 .269*** .068
CSExNW-C -0.011 0.002 -.161*** .025
Anxiety CSE-C -0.052 0.009 -.262*** .063
NWFS-C 0.505 0.078 .279*** .072
CSExNW-C -0.009 0.002 -.152*** .023
Anxiety Opt-C -0.325 0.054 -.258*** .063
NFaWS-C 0.510 0.087 .253*** .059
OptxNFa-C -0.071 0.018 -.167*** .027
Work Absorption SD-C 0.390 0.035 .452*** .202
NWFS-C 0.071 0.051 .056 .003
SDxNW-C 0.038 0.011 .145*** .021
Emotional exhaustion Aut-C -0.340 0.062 -.227*** .050
NFaWS-C 0.629 0.074 .354*** .122
AutxNFa-C 0.053 0.016 .141** .020
Cynicism Aut-C -0.543 0.058 -.385*** .145
NFaWS-C 0.359 0.068 .215*** .045
AutxNFa-C 0.053 0.014 .148*** .022
Professional AC-C 0.206 0.032 .291*** .082
Efficacy NWFS-C -0.047 0.045 -.047 .002
ACxNW-C -0.026 0.009 -.131** .017 **p < .01, *** p< .001
Note. Opt-C = Dispositional optimism centred; NWFS-C = Negative work-to-family spillover centred;
NFaWS-C = Negative family-to-work spillover centred; CSE-C= Coping self-efficacy centred; SD-C
= Skill discretion centred; Aut-C = Job autonomy centred; AC-C = Affective commitment centred.
Interaction terms (e.g. Opt-NW-C) are made from the multiplying the centred terms as listed, with
NWFS shortened to „NW‟ and NFaWS shortened to „NFa‟

228
Table 2.18
Simple slopes for the centred predictor variable (X1) and the criterion variable (Y) at
Low and High levels of the second, centred moderating variable (X2)
Predictor (X1) and Criterion (Y) X2 Slope t (66)
Dispositional optimism and Depression Low NWFS -.510 -8.932***
High NWFS -.562 -9.843***
Dispositional optimism and Depression Low NFaWS -.486 -8.460***
High NFaWS -.606 -9.857***
Coping self-efficacy and Depression Low NWFS -.093 -10.398***
High NWFS -.115 -12.857***
Coping self-efficacy and Anxiety Low NWFS -.254 -4.622***
High NWFS -.396 -6.732***
Dispositional optimism and Anxiety Low NFaWS -.254 -4.622***
High NFaWS -.396 -6.732***
Skill Discretion and Work absorption Low NWFS .352 9.408***
High NWFS .428 11.963***
Job autonomy and Emotional exhaustion Low NFaWS -.393 -6.198***
High NFaWS -.287 -4.460***
Job autonomy and Cynicism Low NFaWS -.596 -10.103***
High NFaWS -.490 -8.212***
Affective commitment and Professional efficacy Low NWFS .232 6.871***
High NWFS .180 5.636***
**p < .01, *** p< .001
Note. All predictor variables were centred for the moderated regression analyses. NWFS =
Negative work-to-family spillover centred; NFaWS = Negative family-to-work spillover
centred;
Note. For the simple slopes, „Low‟ is -1SD below the mean, and „High‟ is +1SD above the mean.

229
For dispositional optimism and coping self-efficacy, the presence of the
resource buffered the effect of negative spillover, such that levels of depression and
anxiety were similarly low when levels of dispositional optimism and coping self-
efficacy were high, regardless on the level of spillover. However, when examining
the simple slopes for the workplace resources, it was the absence of the resource that
increased the effect of the negative spillover. Emotional exhaustion and cynicism
remained high when job autonomy was low, regardless of the level of negative
spillover. When job autonomy was high, levels of emotional exhaustion and
cynicism were lower when the negative family-to-work spillover was low. Similarly,
the absence of affective commitment to work reduced professional efficacy,
regardless of negative spillover, whilst greater affective commitment lead to greater
levels of professional efficacy when less negative work-to-family spillover was
present. The absence of the protective, workplace resources means that the risks
associated with negative spillover are not buffered, further increasing the likelihood
of burnout.
The moderated relationship between skill discretion and work absorption was
more complex as this was a disordinal interaction (i.e. the line of the slopes cross).
When skill discretion was low, absorption in work was low, regardless of negative
spillover. However, the highest level of work absorption was associated with high
levels of both skill discretion and negative work-to-family spillover. It could be
speculated that when a job allows the individual to use their skills and talents in a
way that was highly absorbing, any problems that spill from work to family domains
can be tolerated or possibly ignored.
The moderated relationships add to results of the regression analyses by
showing how specific resources are important for specific outcomes, rather than to

230
the overall, general processes. These could be thought of as resource-driven
behaviours (such as coping better with difficult situations to lessen depression and
anxiety when negative spillover is greater) that allow the individual to manage the
problems and tiredness associated with negative spillover to bolster specific
psychological outcomes.
2.3.20 Post-hoc analysis: What happened to humour?
From the literature review in Chapter 1, humour, measured by the coping
humour scale was expected to be a strong predictor of many of the outcomes.
However, this hypothesis was not supported, although there was some input for
humour as a predictor of depression, albeit in a counter-intuitive way. As
dispositional optimism and coping self-efficacy were the most frequent predictors in
the block of Individual Difference variables, it was suspected that these variables
could be of interest as possible mediators. Therefore, mediation was explored to
establish whether the lack of the expected effects of humour on the outcomes would
be explained in this way.
Using the bootstrapping method of multiple mediators (Preacher & Hayes,
2008), humour was entered as the independent variable, dispositional optimism and
coping self-efficacy were entered as the mediators and each of the outcomes (e.g. life
satisfaction, psychological well-being and so on) was separately considered as the
dependent variable. Except for work satisfaction and work absorption, the effect of
humour on the outcomes was mediated by dispositional optimism and coping self-
efficacy, and only by coping self-efficacy for the path from humour to stress. The
direct paths between humour and each outcome changed from being significant (i.e.
at least p <.01) to being non-significant (ranging from p = .106 for psychological
well-being to p = .977 for work vigour). An example of the changes in the

231
Table 2.19
Z scores for the indirect effects between humour and the outcomes, through
dispositional optimism and coping self-efficacy as the mediators
Mediators
Outcome Dispositional optimism Coping self-efficacy
Life satisfaction 4.365*** 6.320***
Psychological well-being 4.829*** 7.109***
Work vigour 3.820*** 5.542***
Work dedication 3.618*** 3.482***
Depression -4.280*** -6.515***
Anxiety -3.196** -3.920***
Stress -1.299 -5.542***
Emotional exhaustion -2.676** -3.823***
Cynicism -3.741*** -3.013***
Professional efficacy 2.365* 3.501***
*p < .05, ** p < .01, *** p < .001
significance and values was shown for the direct path between humour and life
satisfaction. The total effect, c, changed from .234 (the unstandardized estimate of
the effect of humour on life satisfaction), t(469) = 5.613, p < .001, to the direct
effect after the calculation of the indirect effects, c`, of .011 (the unstandardized
estimate of the effect), t(469) = 0.260, p = .795. All the outcomes saw similar
decreases in the total to direct effect of humour on the outcomes. The Z scores and
significance test of the indirect effects (i.e. the mediation paths through dispositional
optimism and coping self-efficacy) are shown in Table 2.19. The indirect effects of
the paths through the multiple mediators were significant and their confidence

232
intervals did not include zero (i.e. the paths were significantly different to zero). In
summary, the effect of coping humour was seen through the lens of the effective use
of dispositional optimism and coping self-efficacy. It could be concluded that the use
of humour to provide relief when situations are tense and to bring problems into
perspective is an extension of being able to manage challenging and difficult
situations in general (i.e. using coping self-efficacy) and having a positive and
optimistic expectation for the future (i.e. to be high in dispositional optimism). As
such, where dispositional optimism and coping self-efficacy were significant
predictors of the outcomes in the regressions, part of the explanation of their effect
rests with the individual having the ability to use humour to lighten and lift their
mood and bring perspective about their life, as part of a broader suite of actions and
abilities.
2.3.21 Post-hoc analysis: An examination of gender
From the multiple regressions, gender was only a significant predictor for one
of the outcomes, with women reporting greater work satisfaction than men. A
comparison of working hours found that men (M = 44.42 hours, SD = 12.90) worked
longer lours than women (M = 39.83 hours, SD = 11.52), F(1,465) = 11.580, p <.001,
although there was no significant difference between the hours either gender would
prefer to work, F(1,468) = 0.162, p = .661. The male participants (M = 2.52, SD =
1.59) had slightly, but not significantly greater family and parental demands than
women (M = 2.14, SD = 1.43) after accounting for the breach of the assumption of
homogeneity of variance, F(1,468) = 4.869, p = .028. In addition, when considering
satisfaction with non-work domains, women reported slightly higher levels for each
than men but there were no significant differences between their levels of satisfaction
with their family lives (F(1,465) = 3.196, p = .074) and recreational activities

233
(F(1,461) = 2.591, p = .108).
Of interest to the debate on how gender is important to how household chores
were shared, men and women did not differ on their satisfaction of how the
household chores were shared, F(1,425) = 0.821, p = .365. However, as could be
expected with the presence of another person in a household, participants with
partners (M = 3.56, SD = 1.33) reported significantly greater satisfaction with how
chores were divided than those participants who were without a partner (i.e. single or
divorced, M = 3.19, SD = 0.85), F(1, 423) = 7.075, p = .008. The interaction between
gender and partner status was not significant, (F(1, 423) = 0.470, p = .493). Among
the participants with spouses and partners, women reported more satisfaction with
their partners (M = 4.32, SD = 1.04) than men did with their partners (M = 3.85, SD
= 1.36), F(1,287) = 8.811, p = .003, which remained significant after accounting for
the breach in the assumption of homogeneity of variance.
Apart from the small differences outlined above, the genders were in fact
rather alike in their assessment of their lives. There was no difference how busy they
felt (F(1,468) = 0.046, p = .830), how easily their lives fitted together (F(1,468) =
0.298, p = .585) or in their satisfaction with their work-life balance (F(1,468) =
0.082, p = .775). They did not differ on the rewards they gained (F(1,468) = 0.201, p
= .654) or in their commitment (F(1,468) = 0.160, p = .689) to their occupations or in
the reward they felt as parents (F(1,468) = 0.908, p = .341) or their commitment to
the parenting role (F(1,468) = 0.869, p = .352). However, among participants with
spouses of partners, men reported somewhat slightly higher rewards from their
marital role (F(1, 281) = 3.841, p = .052), but there were no differences between the
partnered men and women on their marital role commitment, (F(1,281) = 0.079, p =
.779). However, all of these results must be considered with the caveat that there

234
were many more women than men in the sample of the current research.
2.3.22 Post-hoc analysis: What predicts negative spillover?
From Table 3.16, negative spillover from work to home and home to work
were significant predictors of many outcomes and mediated between many variables
and emotional exhaustion. What lies behind this? It was not sufficient to say
„negative spillover is a problem‟, rather it was sensible to explore what may be
predictors of both forms of negative spillover that employers and employees can take
steps to reduce or eliminate the sources of negative spillover.
Returning to the predictor variables used in the initial hierarchical multiple
regressions, a multiple regression was conducted to again assess the merits of all the
variables. After taking out the predictors previously identified as the more frequent
significant predictors of the main outcomes (i.e. dispositional optimism, coping self-
efficacy, affective commitment, job autonomy and skill discretion) and the two
negative spillover scales, 25 of the original 32 predictors remained. The regression
model for negative work-to-family spillover had a large effect size and was
significant R2 = .414, F(25, 444) = 12.538, p < .001. The adjusted R
2 was .381,
which indicates that over a third of the variability in negative work-to-family
spillover was explained by the variables, although only six of the 25 possible
predictors were significant. The predictors came from the Individual Difference
variables (perceived control of time and egalitarian gender role attitudes), from the
Work and Family variables (managerial support, job social support and education)
and from the Work-Life Interface variables (feeling busy) and were most of the
variables for which negative work-to-family spillover was a strong mediator for their
effects on emotional exhaustion. Negative work-to-family spillover was predicted by
a lack of perceived control of time (β = -.267, p < .001, sr2 = .049), less support for

235
egalitarian gender role attitudes (β = -.109, p < .006, sr2 = .010), less managerial
support (β = -.115, p = .008, sr2 = .009) and less job social support (β = -.188, p
<.001, sr2 = .024), for higher levels of education (β = .094, p = .016, sr
2 = .008) and
when individuals felt busier (β = .275, p <.001, sr2 = .053).
In summary, negative work-to-family spillover is increased where the
individual felt that they did not have control of their time, where gender equality was
not supported and where the individual had less workplace supports, generally from
supervisors and co-workers, and specifically from their managers for any work-
family matters and they feel their life is more hectic that they would like.
A separate consideration was given to the predictors of negative family-to-
work spillover, using the same set of predictors. The regression model was
significant, R2
= .243, F(25,444) = 5.707, p < .001, although this was a only a
medium-large effect size. The adjusted R2 was .201 which indicates that 20% of the
variability of negative family-to-work spillover is explained by these variables,
although only four of the 25 possible predictors were significant. Negative family-to-
work spillover was predicted by a lack of perceived control of time (β = -.261, p <
.001, sr2 = .047), increased family demands from younger children (β = .283, p <
.001, sr2 = .037) and feeling busier (.134, p = .007, sr
2 = .013). The effect of children
was enhanced by negative suppression, such that fewer children increased negative
spillover (r = .083, β = -.150, p = .012, sr2 = .011). In summary, negative family-to-
work spillover was greatest when the individual feels that time was not under control
and that life was hectic and busy. Taking the effect of the number of children
together with family demands, it could be speculated that fewer, younger children
were more likely to increase the negative spillover from the family to the work
domain. This may perhaps occur as one child may take more „work‟ than two or

236
more children because the children could entertain each other, rather than one child
relying only on their parents.
It is interesting to note that for both types of negative spillover, neither the
hours and individual works or their preferences for working hours influenced the
level of negative spillover that that they experience. Working hours (β = -.015, p =
.683) and a preference for less working hours (β = -.025, p = .521) were weak,
negative non-significant predictors for negative work-to family spillover. The results
were still non-significant but were slightly different for spillover from family to
work, as working hours (β = -.043, p = .321) and a preference for more working
hours (β = .062, p = .153) were weak, negative, non-significant predictors for
negative family-to-work spillover. However, as all these results are non-significant,
any differences were not meaningful in terms of understanding negative spillover
either from work to home or home to work.
2.3.23 Post-hoc analysis: Understanding positive spillover
To round out the understanding of spillover, a consideration of positive
spillover will be undertaken. From the literature review in Chapter 1, positive
spillover was expected to be an important predictor of the outcomes that were
considered. However, this did not occur, with only positive family-to-work spillover
a significant predictor of life satisfaction and psychological well-being. This final
post hoc analysis explored the relationships between the work-life interface and
positive spillover and then examined the predictors of positive spillover. The
correlations table, Table 2.3 shows the relationships between the work-life balance
and fit, feeling busy and the direction and quality of spillover. Interestingly, positive
work-to-family spillover is not correlated to the other components of the interface,
being only correlated with feeling busy (r = .098, p = .033). Further, positive family-

237
to-work is only correlated to satisfaction with work-life balance (r = .267, p < .001)
and work-life fit (r =.190, p < .001) and less so to feeling busy (r = -.116, p = .012)
and negative family-to-work spillover (r = -.110, p = .017). Interestingly, positive
spillover, i.e. the benefits gained from a role appeared to be unrelated to negative
spillover, i.e. the problems associated with a role.
In an exploratory analysis of the predictors of both positive spillover scales,
positive work-to-family spillover was first to be considered as the dependent
variable, with all of the other predictors entered in the multiple regressions. The
regression model was significant and had a medium-large effect, R2 = .277, F(31,
402) = 4.967, p < .001. The adjusted R2
was .221, with over 20% of the variance of
positive work-to-family spillover explained by the variables, although only 5 of the
possible 31 predictors were significant. Positive work-to-family spillover, where the
activities and skills learnt at work help the individual in their home life, was
predicted by having greater social skills (β = .099, p = .046), more affective
commitment to one‟s job (β = .148, p = .005), greater job autonomy (β = .108, p =
.046) and skill discretion (β = .219, p< .001). Greater negative family-to-work
spillover was also significant, positive predictor (r = .050, β = .164, p = .002)
although this effect was enhanced by the presence of suppressor variables. In
summary, a socially skilled individual, when combined with the benefits of a
resourceful workplace, where the individual likes their work, can make their own
decisions and use their talents, provide the foundation for positive spillover from
work to family domains. These resources help the individual perform better in their
home and family lives, with speculation that the negative spillover between family
and home could trigger some sort of spiral; more problems or stress at home leading
to greater use of workplace resources to find solutions to those problems.

238
When positive family-to-work spillover was entered as the dependent
variable, the regression model was again significant and had a large effect, R2 = .366,
F(31,402) = 7.472, p < .001. The adjusted R2 was .317, indicating that just over 30%
of the variance was explained by the variables, although only 5 of the 31 variables
were significant. Positive family-to-work spillover, where the support and affection
at home allows the individual to perform better at work was significantly predicted
by greater coping self-efficacy (β = .341, p < .001), placing more value on the
rewards of the marital role (β = .140, p = .022), having a partner (β = .118, p = .022)
with the effects of being younger (r = -.106, β = -.144, p = .008) and negative work-
to-family spillover (r = -.059, β = .144, p =.011) being enhanced by suppressor
variables. In summary, feeling capable of managing challenging situations, along
with having and valuing a spouse or partner led to increases in positive spillover, the
home-based support given to the individual. Younger people possibly received
support from other family members, not just a marital partner. The effect of negative
work-to-family spillover was made stronger, although in the opposite direction by
suppressor variables, possibly indicating that the individual can gain more support
from home as problems or troubles at work increase.
2.4 Discussion
The results of these analyses showed that Bronfenbrenner‟s developmental
equation provided a useful framework to better understand the developmental
outcomes of the working adult. By specifying the components of a generative
disposition, positive demand characteristics and the work-life interface, and applying
these to a broad view of psychological functioning, both the general trends and
specific predictors can be seen. The general trend was that as was hypothesized,
more generative dispositions and positive demand characteristics, along with more

239
resources at work and within families and less demands from the work-family
interface were predictive of higher levels of well-being (as life satisfaction and
psychological well-being), work satisfaction, and work engagement (as work vigour,
dedication and absorption), better mental health (as the absence of depression,
anxiety and stress) and less burn out (as less emotional exhaustion and cynicism and
greater professional efficacy). However, more specifically, the most important
predictors of these outcomes were personal and workplace resources along with the
demands from negative spillover to and from work and home. There were seven
main predictor variables; dispositional optimism and coping self-efficacy (resources
of P, the generative disposition, from the Individual Difference variables), affective
commitment, job autonomy, and skill discretion (resources of C, the Work and
Family context), negative work-to-family spillover and negative family-to-work
spillover (demands of C, the Work-Life Interface). However whilst these were most
important across the board, being more specific still, a mosaic of variables was
necessary to fully explain the breadth of a person‟s functioning. The fine-grained
analysis from the multiple regressions shows the particular components about the
individual and their surrounding context that are important for each particular
outcome. The seven most common predictors may provide a broad overview of
general importance, but it was the pieces of the mosaic that round out the overall
understanding of the individual‟s psychological functioning. Given the breadth of the
outcomes that were examined, it was perhaps not surprising that there was this
mosaic of significant predictors. The diversity of psychological functioning meant
that it was likely that many would be important (in varying combinations) and that
no one variable would be the important predictor. Bronfenbrenner‟s developmental
equation allowed for the analyses to illustrate levels of understanding of what would

240
influence competent development, from the overview that the individual‟s generative
disposition, workplace resources, and the demands of work-life spillover influence
psychological functioning down to the specific predictors of each outcome.
The limited number of mediated and moderated relationships indicates that
the principle mode of action between the individual difference, work and family and
work-family interface variables was likely to be straight forward and additive, rather
than multiplicative. A general consensus would be that an individual with good
levels of personal resources, sufficient workplace and family resources and with less
negative and more positive spillover between their life domains will have fare better
across the measured outcomes. Dispositional optimism, skill discretion and negative
work-to-family spillover were strong contenders to be central to these processes,
with negative work-to-family spillover an important mediator, particularly for
emotional exhaustion, and moderator as well. The specific examples of where
moderation occurs shows that the general additive nature of development has parts
that are not so simple, where the presence or absence of a resource can buffer the risk
that negative spillover presents. Only for some resources and only in some situations
does this occur, again adding to the fine-grained analysis of competent development,
which supplements a broader, more general understanding of the individual.
Some of the intriguing findings from the multiple regressions are what was
not important, for example, gender. The findings that women were more satisfied
with their work than men is similar to previous findings (A. E. Clark, 1997),
although the level of education did not reduce the gender difference, as was the case
in Clark‟s study of British employees. Further, men and women did not differ on
their commitment to work and family and did not experience differences in how they
were able to use their skills at work. Among the participants of the current research,
241
men and women may experience their lives differently, but they did not differ how
on satisfied they were with life in general, whether they have a mental illness or felt
burnt out. It could be speculated that amongst this sample of employed individuals,
gender was less important to the outcomes as employment provided sufficient
resources for both genders to buffer against poorer outcomes, as among
underemployed, partnerless men in the Australian Quality of Life surveys (Cummins
et al., 2003; Cummins, Woerner et al., 2007) or for women and the unemployed on
other Australian research (Andrews et al., 2001; Hawthorne et al., 2003). In this
sample, gender was not important to the end result of competent development, as
measured by this broad range of outcomes. As such, a happy and fulfilling life does
not depend on being one gender or the other in the present sample.
An important consideration then to come from this thesis is that rather than
focus on the individual‟s gender, it is the way that individuals think that is much
more important. Any individual who has positive, optimistic views of the future, and
who views themselves as being capable to manage difficult situations will have
better psychological functioning. It is not the preserve of one gender or the other to
„think better‟. I believe that gender, as will be shown with working hours, is too blunt
a measure of what is important in individual differences. An individual‟s behaviour,
based on their levels of optimism and self-efficacy will be a better indicator of how
they will respond to the challenges of managing their work and family lives, rather
than merely accounting for their gender.
The prevalence of dispositional optimism as a significant predictor of the
diverse outcomes indicates that it is a fundamental personal resource that gives the
individual many benefits for positive psychological functioning. This finding
supports the central position of this thesis, that dispositional optimism, which is the

242
expression of self-regulation (Carver & Scheier, 1998; Scheier et al., 1994), captures
Bronfenbrenner‟s generative disposition (Bronfenbrenner & Morris, 1998, 2006) and
is essential for competent development. Dispositional optimism directly predicted
life satisfaction, psychological well-being and reduced depression and anxiety.
Further, it buffered the individual from the effects of negative spillover from
depression and anxiety, such that individuals who were high in dispositional
optimism were less influenced by high levels of negative spillover in both directions.
The results support the effect of dispositional optimism to moderate the effects of
health problems to improve well-being and reduce depression and distress (Elavsky
& McAuley, 2009; Hart et al., 2008; Major et al., 1998; McGregor et al., 2004), as
well as reducing stress in work situations (Atienza et al., 2004; Chang, 1998; Sumi,
1997; Taubman-Ben-Ari & Weintroub, 2008). The results extend the importance of
the individual‟s optimism to the research on work engagement and burnout.
Dispositional optimism was associated with greater satisfaction with work and more
engagement with work, as more vigour and dedication and the lessening of cynicism,
supporting the limited findings for dispositional optimism in the occupational health
psychology research (Xanthopoulou et al., 2007).
The importance of coping self-efficacy, as a measure of the individual‟s
confidence in their ability to handle difficult situations as a predictor of the
outcomes, adds to dispositional optimism as a marker of the generative disposition.
Coping self-efficacy is particularly important to the mental health outcomes as well
as well-being and work vigour, which supports previous research among working
individuals (Jex & Bliese, 1999; Judge et al., 1998; Marshall & Lang, 1990) and
amongst carers of AIDS patients (Chesney et al., 2003). Feeling capable and
competent and persisting toward goals (DiBartolo, 2002; Ryff & Singer, 1998;

243
Semmer, 2003) may also explain the buffering of the effect of high negative work-to-
family spillover depression and anxiety, as the individual is able to formulate plans
to offset the problems associated with the work-family interface, rather than be
downcast by those problems.
Control of time was considered to be important to the understanding of the
developmental outcomes, but this was not the case as the effect of feeling in control
of time was mediated by negative spillover. Rather than a fundamental characteristic
of the individual, as locus of control, the belief that one is control of their own time
occurs in response to the current situation or external cues, which supports the view
that control should be taken in context (Fournier & Jeanrie, 2003). As such, an
individual will feel that they have control of time where negative spillover (taken as
problems and tiredness between roles) is limited and feel „out of control‟ when
negative spillover rises. The subsequent analyses on the predictors of negative
spillover showed that feeling a lack of control of time predicted both directions of
negative spillover, which highlights the results of the mediation analyses. This may
be a circular argument about whether there is mediation or prediction but in the end,
greater levels of either type of negative spillover lessen the individual‟s sense that
they can control their time.
Other variables that were considered likely to be important predictors were
humour and social skills, which were proposed as the demand characteristics with
which the individual interacts with their environment. Humour was important to the
outcomes until the addition of dispositional optimism and self-efficacy, where after it
was completely absorbed by these personal resources. This was an unexpected result,
given the breadth of previous research on the benefits of humour to cope with
stressful situations (Abel & Maxwell, 2002; Kuiper & Nicholl, 2004; Nezlek &

244
Derks, 2001; Thorson et al., 1997). The addition of dispositional optimism and
coping self-efficacy mean that the cognitive –affective reappraisals that are involved
in the use of humour are actually part of the suite of behaviours that come with the
use of these personal resources. Humour would therefore be a part or outcome of
optimism and self-efficacy, rather than a separate construct, with self-regulation
involving the use of mature defense mechanisms (Vaillant, 2000). However, the
thesis did not measure humour as an interpersonal style (R. A. Martin et al., 2003),
so these comments can only apply to humour as a coping mechanism. The other
measure of the demand characteristics was social skills but this was also not a major
contributor. Interestingly, better social skills was associated with higher levels of
anxiety and stress, perhaps indicating that social skills are more needed in distressing
or stressful situations.
The limited input from role salience scales toward the outcomes may reflect
the breadth of the analyses, whereby the importance attached to a role is, like
humour, part of the self-regulation of a goal-directed life. However, parental role
commitment was specifically important to well-being. I believe that parental role
commitment, measured as being prepared to be involved with the activities of child
rearing, reflects a generative view of life (McAdam, de St Aubin, & Logan, 1993),
seeing the care of children is an important activity in the life span. This would
indicate that greater well-being may be attached to fulfilling (or having the
expectation to fulfil) the role of parent, as part of the many social roles in life (Elder
& Shanahan, 2006). Many participants, including those without children, strongly
endorsed the items on this scale and future research should explore how participants
regard the parental role, whether or not they have children. Marital role salience did
not provide predictors for any of the outcomes, whilst occupational role reward and
245
commitment was only important for work absorption, role commitment to work
vigour, and role reward to higher levels of professional efficacy. As such, valuing the
work identity did not lead to greater stress or work satisfaction, only increased the
specific facets of absorption, vigour and competence at work.
Although the influence of egalitarian gender role attitudes was mediated by
negative work-to-family spillover, this mediation may prove useful in understanding
the process that leads to increased emotional exhaustion. Among health care workers,
a lack of fairness is considered one of the pathways that lead to the development of
burnout (Maslach, 2006; Maslach & Leiter, 1997). As the positive endorsement of
egalitarian gender roles brings with it an implicit belief that everyone can have a „fair
go‟, it is possible that the problems implicit in negative spillover could make the
individual feel that their work or family situation was unfair and that they were not
being supported as they felt they should be, either at home or at work. Further, the
perception that everyone is equal also implies that everyone should be helping
equally, so it may capture assessments of inequality as well as unfairness.
Perceptions of inequality may lead to or exacerbate the problems and tiredness
associated with negative spillover, which would increase emotional exhaustion.
Therefore, rather than just a statement about gender roles, these attitudes appear to
capture the fairness of gender relationships and indicate how fairness in workplace
relationships could reduce the experience of negative work-to-family spillover.
Turning to the Context of the Work, Family and Work-Family Interface
variables, another interesting and surprising „non predictor‟ was working hours as
hours are often taken as prime importance to the work-life interface (Pocock, 2003,
2005). However, in these results, the length of the working week was not an
important predictor of any of the outcomes, nor was it associated with levels of
246
negative spillover. The recent literature on the detrimental effects of working hours
(Pocock, 2003; Relationships Forum Australia, 2007) is not supported in the present
research rather the more important characteristic about working is the nature of the
work itself. Just using hours per week is a rather crude metric for the sort of work an
individual does, as hours do not capture anything of the type of work or the way the
individual views the work that they do. A simple thought experiment can illustrate
this: an hour in a boring or disliked job is too long, whilst 60 hours in an engrossing,
interesting, challenging job may not seem enough. Working hours may be more
easily gleaned from government statistics (for example, from the Australian Bureau
of Statistics, www.abs.gov.au), but the harder effort to find out the employees‟
affective commitment or their autonomy or use of their skills which would be better
measures of how work affects the individual.
The results show that the two most important workplace resource are that the
individual is able to use their skills, talents and creativity, i.e. to have high levels of
skill discretion and that they are attached to their work. Skill discretion and affective
commitment to work are closely linked in the current sample and could be expected
to enable the individual to better meet the demands of their job, which has support
from previous research (Bakker et al., 2003; Demerouti et al., 2000; Hakanen et al.,
2006; Meyer et al., 2002; Schaufeli & Bakker, 2004).
The workplace resources, along with job autonomy, the ability to direct one‟s
work, are closely linked with higher levels of work engagement and less burnout
among the participants, which is similar to findings based on the Job Demand-
Resources model (Bakker et al., 2003; Demerouti et al., 2001). The importance of
skill discretion in explaining the outcomes also lends support to the Demand-Control
Support model (Karasek & Theorell, 1990), where high levels of control, a

247
combination of skill discretion and decision latitude (i.e. job autonomy), reduced the
impact of greater psychological demands and limited social support. In the current
study, working hours can be taken as a measure of work demands, whilst support
was measured by managerial support for work-life matters and general social support
from supervisors and co-workers. It has already been noted that working hours was
not a useful predictor and the effects of support, managerial or in general, were
mediated by negative spillover. As such, the current research does not add to either
the Demand-Resources or the Demand-Control-Support models. It would be fairer to
say that the experience of the workplace is more complicated than either model, as it
is necessary to acknowledge that workers have family lives and personal resources,
which are not included in either model. Only recently has personal resources been
considered as a possible addition to the Job Demand-Resources model (Bakker,
2005), which is in line with the current results. Again, Bronfenbrenner‟s equation
allows the more complex consideration of all the influences on the individual, with
the context of the individual‟s life expanded from their workplace to their family and
the interface between those roles.
The Family variables were not as potent as perhaps was expected, unlike
previous research which showed young children to increase negative spillover
(Grzywacz et al., 2002). In the current research, the effects of the number of children
and family demands were mediated by negative family-to-work spillover whilst
marital status did not predict any of the outcomes. It was interesting that fewer,
younger children were associated with more problems at home interfering with work.
More children, rather than just one child, may make child care easier. For example,
two children could play together with limited parental input, whilst one child needs
their mother or father to be their playmate, increasing the demands on the parent.

248
Further, the presence of younger children, which leads to more family demands, was
associated with lower levels of anxiety and having children, per se, was associated
with lower levels of cynicism. Taken together, the results show that the care and
involvement with children can provide the individual with a sense of perspective that
protects against distress and cynicism. Children have their own interests and
activities and could give adults another view on the world that makes the adults less
jaded and their own concerns less worrying. By including both parent and non-
parents in the sample it was possible to show that children are not detrimental to
mental health and well-being. As noted previously, valuing child care activities was
associated with higher levels of well-being, even among non-parents. Taken together,
children may change the way and adult lives their life but they are not a „burden‟ that
reduces well-being or increases mental illness, as there were few difference between
parents and non-parents in the developmental outcomes.
Managerial support for work-life issues and social support on the job
generally were not substantial contributors to the outcomes, despite the strong
correlations between these two variables and all of the outcomes that were shown in
Table 2.3. Job social support was only a predictor of stress, such that more support
was given when the individual reported more stress. Managerial support did predict
greater life satisfaction and predicted less emotional exhaustion, over and above the
partial mediation of negative spillover in both directions. This result is in line with
previous research among university staff (Grawitch et al., 2007). The reason for the
lack of predictive power most probably lies with negative spillover, as job social
support and managerial support were significant predictors of negative work-to-
family spillover, which in turn was a pervasive, negative contributor to the
developmental outcomes.

249
Negative work-to-family spillover impacts all aspects of psychological
functioning, reducing well-being and work satisfaction and vigour, increasing mental
illnesses and particularly impacting on emotional exhaustion and stress. Previous
research has shown that managerial support is beneficial for employees to use
available workplace flexibility programs (Behson, 2005; Dikkers et al., 2004; C. A.
Thompson et al., 1999) and that the general support from supervisors and co-workers
increased work engagement and reduced burnout (Bakker et al., 2007; Klusmann et
al., 2008a; Schaufeli & Bakker, 2004). However, when combined with the research
showing that increased managerial support reduced work-family conflict (Behson,
2002), it is possible to see the path whereby the lack of workplace social support,
either in general or specifically for work-family issues, would increase the
experience of problems in the workplace spilling over and impacting on the home
domain.
Another implication from the mediation of managerial support, general job
social support and egalitarian gender role attitudes by negative spillover comes from
the research on burnout. Burnout is most likely to occur when there was a high
workload, where there was a lack of control over situations and work tasks, such as
handling similar problems for many different people, insufficient rewards for the
work that is done, by a breakdown of community within the workplace and a loss of
support, an absence of fairness and conflicting values between the individual and
their employment (Maslach, 1993, 1998, 2006; Maslach & Leiter, 2008; Maslach et
al., 2001). There is s similarity here to the results of the multiple regressions, where
negative work-to-family spillover was the strongest predictor of emotional
exhaustion, a major component of burnout. The predictors of negative work-to-
family spillover can be seen in the predictors of burnout. The loss of support and
250
workplace community would be equivalent to the lack of managerial support and
lack of general job social support, the lack of control is similar to a lack of perceived
control of time, whilst the absence of fairness can be seen in the lack of support for
egalitarian gender role attitudes. Negative spillover becomes a potent predictor of
emotional exhaustion because it is bringing together the direct contributors to
burnout. The combination of lost workplace supports would be another reason why
negative work-to-family spillover has such a widespread effect on all of the
outcomes.
Whilst negative spillover in both directions were important to understanding
the outcomes, there was limited input from the other Work-Family Interface
variables with satisfaction with work-life balance, work-life fit, feeling busy and
positive spillover only predicting a few outcomes. Satisfaction with work-life
balance added to the individual‟s life satisfaction, which would reflect how
satisfaction with the domains of life (i.e. a bottom-up approach) adds to overall
assessment of life satisfaction (Easterlin, 2006). Work-life fit, the ease with which
the demands of work and family could be managed, was only a predictor of reduced
emotional exhaustion. Further exploration of work-life fit is necessary to better
understand how this assessment of fit is made. It could be speculated that work-life
fit may be similar to humour, that it is a consequence of successful self-regulation
with better fit arising from the behaviours and choices to that allow work and family
roles to be managed more easily. The new item about how busy the participant felt
was an interesting addition to the likely predictors of the outcomes. Whilst feeling
busy added to the stress an individual felt, it also added to their sense of professional
efficacy. Perhaps this indicates that while an individual can feel busy and stressed,
being busy gives them a sense of importance about their work. There is a further

251
consideration, as feeling busy also contributed to both work-to-family and family-to-
work negative spillover. It will be interesting to further investigate the point at which
„busy‟ becomes „crazy busy‟, when the assessment of too much to do increases stress
and negative spillover beyond the benefits to feeling competent at work.
The last two components of the Work-Family Interface are the positive
spillover scales. The lack of correlations between positive and negative spillover
indicate that the benefits and problems of roles are not necessarily tied to each other.
As with the experience of positive and negative affect when coping with difficult
situations (Folkman & Moskowitz, 2000; Folkman & Moskowitz, 2004), it is
possible that the positive and negative experiences from the interactions between
roles can co-exist somewhat independently of each other. The lack of correlations
between the various measures of the work-life interface also limits further discussion
of what is the best definition of „work-life balance‟. Given the pervasiveness of
negative spillover in combination with personal and workplace resources to explain
the outcomes, how the individual views the sum or balance of their life may be a
verb (Greenhaus et al., 2003), dependent on the shifting, dynamic interplay of the
many predictors identified in this analyses.
Positive family-to-work spillover was one of the significant predictors of life
satisfaction and psychological well-being and captures how a supportive home
environment bolsters the individual in their assessment of their overall well-being.
The exploration of positive family-to-work spillover found that the predictors were
coping self-efficacy, marital status and marital role reward and younger age, with the
surprising inclusion of negative work-to-family spillover. For the individual who is
able to manage challenging situation, having the support from a spouse or partner
(and for younger people, perhaps support from parents) would see the home and

252
family domain as a source of strength to manage work situations, particularly when
there are problems at work that are likely to spill over to home. It may be almost a
circular argument that valuing a partnership will engender more support from that
partner, and the analyses cannot imply causality, only association.
Turning to the predictors of positive work-to-family spillover, the same
workplace resources that were associated with more positive psychological
functioning were also associated with a workplace that enabled the individual to
perform better in their personal lives. It is possible that these positive associations
between workplace and family in both directions are similar to the affective
pathways of work-family enhancement proposed recently by Greenhaus and Powell
(2006). However, the results of the current research are not conclusive to confirm
these pathways and further research can explore these pathways further.
The important practical outcome was that the links between the measures of
work-based support and negative spillover provide leverage points at which
employers may make a substantial contribution to their employees‟ psychological
functioning. In addition to the previous comments about egalitarian gender role
attitudes, employers can take steps to ensure that equality is practiced, cooperation
between their employees is positively encouraged and that their managers actively
supported their employees‟ work-family responsibilities. There are many workplace
programs currently available to achieve these ends (for example, the Family Friendly
Index outlined in Clifton & Shepard, 2004), which will benefit the employer by
increasing productivity and retaining staff and benefit the employee by decreasing
negative work-to-family spillover. By providing more resourceful work
environments, employers can support their employees to improve work engagement
and limit burnout, which would be a win-win situation for both parties.

253
The importance of containing negative spillover is also illustrated by the
moderation analyses. The importance of personal and workplace resources to the
developmental outcomes supports Hobfoll‟s (1989, 2001, 2002) Conservation of
Resources theory, with the resources (dispositional optimism, coping self-efficacy,
skill discretion, affective commitment and job autonomy) broadly associated with
achieving greater well-being, better mental health, less burnout and more work
engagement. However, the moderating effect of negative spillover (in both
directions) brought out an interesting difference between the personal resources and
the workplace resources. In the absence of workplace resources (i.e. at low levels of
job autonomy, affective commitment and skill discretion), there was no protection
from the effect of negative spillover, either low or high. In contrast, the presence of
personal resources (i.e. high levels of dispositional optimism and coping self-
efficacy) insulated the individual from depression and anxiety, regardless of the
levels of negative spillover. The presence of high levels of dispositional optimism
buffered the moderating effect of high negative spillover (both work-to-family and
family-to-work) on depression and anxiety (family-to-work only). Individual who
were more optimistic were better able to withstand the depressive and distressing
effect of negative spillover, again highlighting the importance of dispositional
optimism as a central personal resource that allows the individual to manage their
lives successfully which is in support of previous research (Armor & Taylor, 1998;
Aspinwall et al., 2002; Aspinwall & Taylor, 1997; Culver et al., 2003; Scheier et al.,
2002).
The presence of coping self-efficacy similarly buffered individuals from the
effects of negative work-to-family spillover on depression and anxiety, as at high
levels of coping self-efficacy, high negative work-to-family spillover was limited in
254
its effect. More confidence in managing challenges (Chesney et al., 2003; Scholz et
al., 2002) would allow the individual to find solutions to the problems at work that
threaten to spill into their family lives, protecting from any distresses.
When considering the workplace resources, the simple slopes give a different
explanation to the way the workplace resources operate. Rather than there being little
difference in the outcomes at high levels of the personal resources, it is at low levels
of the resources that there is little difference in outcome due to the level of negative
spillover. When job autonomy was low, emotional exhaustion and cynicism were
increased to similar levels, regardless of negative family-to-work spillover. When
affective commitment was low, professional efficacy was similarly reduced and
when skill discretion was low, work absorption was limited, both occurring
regardless of the levels of negative work-to-family spillover. At high levels of the
resources, the differing effects of low versus high negative spillover could be seen,
where the effect is as could be expected; low negative spillover, less exhaustion or
cynicism where there was greater job autonomy and greater professional efficacy
where there was higher affective commitment. However, the results for work
absorption were perhaps counter-intuitive, as the individual who had a job with
greater use of their skills and talents became more engrossed in their work, enabling
them to overcome or ignore problems at work that impacted their families. Whilst
this may be sustainable in the short term, not disengaging from work can lead to
tiredness and reductions in positive mood at home (Sonnentag & Bayer, 2006) and
increase the likelihood of burnout developing (Vinje & Mittelmark, 2007). As with
the moderations involving dispositional optimism and coping self-efficacy, these are
specific effects of the workplace resources on specific outcomes.

255
In summary, the general processes between the individual and their context,
outlined by Bronfenbrenner‟s developmental equation were largely additive but the
moderations provide specific instances where the resources act on the effects of
negative spillover. Both individual and workplace resource were important to this
process, indicating that programs that bolster the individual as well as supportive
workplace and employers could be targeted to improve functioning. Across all the
analyses, competent development, however defined requires the input of personal
and contextual resources (mostly from the workplace) to deal with the consequences
of negative spillover that occurs in both directions. There were a core of important
variables, but it was the fine grained analyses of the regressions that showed how
there was a mosaic of many variables that predict the many different outcomes that
represent competent and positive psychological functioning.
2.4.1 Limitations and strengths of Study 1
The sample for Study 1 was largely university educated, although the sample
from the public hospital did include a numbers of individuals with less than a
university education. These constraints do limit the generalisability to blue-collar
employees or manual labourers, although with the rise of the knowledge economy,
this component of the labour market is diminishing. Another limitation is that the
sample is largely female and the conclusions about the factors that lead to competent
development may not apply to men equally as to women. Further research among
predominately male samples and in other cultural settings should test the conclusion
of the current research to confirm that the findings apply across genders and in other
less individualistic cultures. In addition, other sources of information should be
included in future research to avoid any possible bias from common method
variance.
256
The strengths of the sample for Study 1 were first that it included a very
diverse range of occupations, particularly among the university alumni sample and
even within the hospital sample. The administration of the hospital involved a range
of occupations, including nurses, managers and clerical workers. The breadth of
occupations would indicate that the findings have greater external validity and are
applicable to many separate industries rather than being limited to narrow groups of
employees, such as healthcare workers or police officers (de Jonge et al., 2001;
Demerouti, Bakker et al., 2004; Dikkers et al., 2004). A second strength of Study 1
was the size of the sample, which allowed sufficient numbers to investigate the large
number of predictor variables in the multiple regressions and provided enough power
for the longitudinal modelling. The sample size gives robustness to the findings,
although replication in other populations of employees is necessary to confirm the
findings.

257
Chapter 3, Study 2: Longitudinal modelling
Following on from the hierarchical multiple regressions of the previous
chapter, seven variables were identified as the most common predictors of the
developmental outcomes. Specifically, these were the personal resources of
dispositional optimism (Scheier et al., 1994) and coping self-efficacy (Chesney et al.,
2003) and the workplace resources of skill discretion (Schwartz et al., 1988), job
autonomy (Voydanoff, 2004c), and affective commitment (N. J. Allen & Meyer,
1990), with the negative spillover from work to the home arena and from the home
arena to work (Grzywacz & Marks, 2000b).
Study 2 will take these variables of the personal and workplace resources and
the negative spillover between domains and model their influences on the
developmental outcomes longitudinally. This modelling will bring the Time
component into Bronfenbrenner‟s equation, specifically testing for the gain and loss
in resources over time, proposed by Hobfoll‟s (1989, 2001, 2002) Conservation of
Resources Theory.
One of the advantages of longitudinal analyses can be to tease out cause and
effect where there is no clear beginning to the effect of one variable on another
variable or where reciprocal relationships may be operating (Menard, 1991). The
framework of Bronfenbrenner‟s developmental equation, D f PPCT (Bronfenbrenner
& Morris, 1998, 2006) acknowledges the dynamic and reciprocal relationships
between the individual, their environment and the developmental outcomes over
time, such that the person is influential on both sides of the equation. First as the
active participant in dynamic interactions with their environment and second through
the developmental outcomes that support and reciprocally influence later behaviours
of the person, who then interacts with their environment. This process implies

258
ongoing, dynamic relationships of which the current research can capture only a
sliver of the passing time.
The longitudinal models will be tested in the format described by De Jonge,
Demerouti and colleagues (for example, de Jonge et al., 2001; Demerouti, Bakker et
al., 2004; Llorens et al., 2007) which allow for the testing of concurrent functioning
and both the stability of variables and the strength of reciprocal relationships over
time. However, this thesis will take the process of testing the competing longitudinal
models one step further than described by De Jonge and colleagues. By removing
trivial pathways from the models, I believe that it will be possible to more clearly
identify the influential pathways that will show Bronfenbrenner‟s developmental
equation in action. Further, it is possible that the consequences of prior functioning at
the individual level, of their work-life interface and of their well-being and mental
health can be seen as loss and gain spirals of resources (Hobfoll, 1989, 2002). The
gain and loss spirals are proposed by the Conservation of Resources theory (Hobfoll,
1989, 2002), which states that individuals will feel stressed if personal or workplace
resources are lost, if their resources are threatened or they do not gain the resources
that could be expected from their efforts. The loss of resources set up a loss spiral,
with initial losses increasing over time. However, in times that were not stressful,
individuals were likely to take steps to increase their resource base, to provide for
future needs, which would result in a gain spiral of resources. In addition, stability
and continuity of resources are shown where similar resources were linked together
and maintaining the stability of each resource over time, in „resource caravans‟
(Hobfoll, 1989, 2001, 2002).
The longitudinal modelling of De Jonge and colleagues found the presence of
both loss spirals (de Jonge et al., 2001; Demerouti, Bakker et al., 2004) and gain
259
spirals (Llorens et al., 2007) with stability evident between the same variables over
time. However, the research often focused separately on the negative or positive
outcomes, not both outcomes together. The current research will extend previous
research on longitudinal modelling by including both positive and negative outcomes
together in the models and by trimming the models to better understand the most
influential pathways in the models.
3.1.1 Hypothesis for Study 2
It is hypothesized that the longitudinal modelling will show evidence that
there is stability in the variables over time and that there are changes in variables
over time which will be the result of gain and loss spirals of resources. Gain and loss
spirals are evident in the significant reciprocal relationships between variables over
the measurement times. Specifically, it is expected that the greatest influence on a
variable at a later time will be from the same variable at the previous measurement
times (i.e. the auto-lagged paths), which will be taken as the stability of a variable
over time. In addition to the stability of variables, it is expected that there will be
smaller but important contribution from cross-lagged paths, such that personal and
workplace resources will increase positive functioning over time and that the
demands of negative spillover will increase burnout and mental illnesses over time.
These cross-lagged paths will represent the gain and loss spirals that lead to the
accumulation or loss of resources over time.
3.2 Methods
3.2.1 Participants
The sample consisted of participants from the alumni of a university and the
administrative staff from a large public hospital, who took part in the prospective
panel study. Of the individuals who completed all three time periods (N = 198,

260
78.8% female), the participants ranged in age from 19 to 62 years (M = 38.18 years,
SD = 11.14 years), and worked on average about 41 hours per week across the three
time periods (Time 1, M = 40.96 hours, SD =11.91 hours; Time 2, M = 41.18 hours,
SD = 11.39 hours; Time 3, M = 41.58 hours, SD = 12.58 hours). Attrition analysis
found that there was no difference between participants who completed all three
measures and those that dropped out after Time 1, based on age (F(1, 462) = 0.024, p
= .877), gender composition (F(1, 462) = 0.174, p = .677), or the hours worked per
week at Time 1 (F(1, 462) = 0.121, p = .729). The full demographic details of the
participants will be given in the results section.
3.2.2 Recruitment of participants, survey methods and materials
The recruitment process and online survey methods are outlined in the
previous chapter on the cross-sectional analyses of the data. This chapter describes
the processes involved in the longitudinal modeling, building on the previous chapter
and using the same measures and data collection methods to construct a prospective
panel study used in Study 2. Briefly to recap, participants were recruited from a
university alumni e-magazine or by managers within the administrative section of the
public hospital to take part in an on-line survey. Of the original participants (n =
470), just under half (n = 198, 42.1%) competed identical surveys online at all three
time points. The details of the measures used, along with the scales‟ reliabilities were
given in Chapter 3, with Table 3.3 (pages 250-256) showing the correlations between
all the variables at Time 1.
3.2.3 General process for longitudinal modelling
Whilst the SEM analysis for this thesis will be conducted using the AMOS
program (Arbuckle, 2006), the initial multiple regressions was conducted by SPSS.
Whilst structural equation modelling using can investigate the relationships between
261
many variables, these relationships can be difficult to interpret when the variables are
closely related or correlated to each other (Zapf et al., 1999). Given the number,
diversity and breadth of variables that were measured in the current study, it was
considered very likely that there would be considerable overlap in the constructs and
an associated difficulty of obtained clear and interpretable results from the structural
equation modelling. The results of the cross-sectional analyses (i.e. the hierarchical
multiple regressions of Study 1) are detailed in Chapter 2 and were the first step to
simplifying the analytic process.
The second step of the longitudinal modelling involved pooling the results of
the hierarchical multiple regressions to find which variables were the most frequent
significant predictors of the developmental outcomes. The seven predictors were
dispositional optimism (8 of 12 outcomes) and coping self-efficacy (6 of 12),
affective commitment (7 of 12), skill discretion (8 of 12) and job autonomy (4 of 12),
and negative work-to-family spillover (9 of 12) and negative family-to-work
spillover (5 of 12). Although job autonomy predicted the least of these variables, it
was important to burnout and work engagement and therefore included in the
modelling. The seven predictors form distinct groupings of the individual and their
context. The groupings have been labelled Individual Factors (dispositional optimism
and coping self-efficacy), Positive Workplace Factors (affective commitment, skill
discretion and job autonomy), and Negative Spillover (negative work-to-family
spillover and negative family-to-work spillover), which provide a clear basis for the
subsequent analyses.
3.2.4 Introduction to SEM and associated terminology
To assist with the terminology and the many models involved in the analyses,
names of variables and models and a glossary of terms and fit indices are available in

262
Individual Factors
Dispositional
optimism
e1
1
1
Coping
self-efficacy
e21
Positive Workplace
Factors
Affective
commitment
e31
Job
autonomy
e41
Overall Well-Being
Psychological
well-being
e7
1
1
Life
satisfaction
e6
1
e8
1
Skill
discretion
e51
1
Appendix K. These are the last 2 pages of the appendices and can be easily accessed,
as a ready reminder for the reader throughout this chapter.
The AMOS program (Arbuckle, 2006) will be used for all the SEM analyses
conducted in this thesis. The process of structural equation modelling has two
separate phases. First, the structural component hypothesizes how latent variables
(constructs that are not easily measured, such as well-being or mental health) are
related to each other and second, the measurement component details the observed
indicator variables that best reflect or are „caused‟ by these latent variables (Holmes-
Smith, Cunningham, & Coote, 2006). Using Figure 3.1 as a simplified example of
the models that will follow, the researcher would theorise that in the structural part of
Figure 3.1. Simplified representation of the components used in SEM

263
the model that the latent factors, „Individual Factors‟ and „Positive Workplace
Factors‟ are correlated and jointly influence the outcome, „Overall Well-Being‟. The
latent variables Individual Factors and Positive Workplace Factors‟ are independent,
or exogenous, variables, whilst the latent variable, Overall Well-Being, is a
dependent, or endogenous, variable. It is also necessary to specify a residual error,
„e8‟, as explanation of all other possible influences on „Overall Well-Being‟
Using Figure 3.1 again as an example of the measurement part of the model,
the researcher designates that the latent factor „Individual Factors‟ is best represented
by the measured variables, „Dispositional optimism‟ and „Coping self-efficacy‟, the
latent factor „Positive Workplace Factors‟ is best represented by the measured
variables, „Affective commitment‟, „Job autonomy‟ and „Skill discretion‟, whilst the
latent factor „Overall Well-being‟ is best represented by the measured variables, „life
satisfaction‟ and „psychological well-being‟. Previous research would be used to
guide the selection of suitable instruments and scales for the observed variables. As
the observed variables are not perfect estimates of the latent factors, it is necessary to
include a measurement error term to each observed variable, which are shown as „e1‟
through to „e7‟ in Figure 3.1 (Byrne, 2001; Holmes-Smith et al., 2006).
3.2.5 Assessing model fit
Once the model has been developed and the parameters estimated, the fit of
the model can be assessed. Traditional and SEM analyses differ in their tests of
significance, as in traditional analyses, the null hypothesis, Ho is tested and either
retained (if p > .05) or rejected (if p < .05). The desired outcome is that the research
will find a significant difference between the variables or conditions and the null
hypothesis, Ho can be rejected. In the modeling context however, the situation is
different. The assessment of the model‟s fit is based on testing the research

264
hypothesis that there is a minimal discrepancy (i.e. no difference) between the model
calculated from the sample and an implied matrix drawn from the population. That
is, the model has good fit when the result of the significance test in SEM is p > .05,
indicating that the discrepancy is not significant. Larger p-values would indicate a
better fit of the model to the data. A Chi-squared (Χ2) test is used to assess the
difference between the implied variance - covariance matrix (Σ) and the empirical
variance – covariance matrix derived from the sample (S) (Byrne, 2001; Holmes-
Smith et al., 2006). In simple terms, SEM assesses how well the hypothesized model,
as drawn, matches or „fits‟ the sample data.
A number of measures assess the fit and parsimony of the model, based on
Χ2, the discrepancy function. The current thesis will use the Normed Chi-squared (Χ
2
/df), the Comparative Fit Index (CFI), the Root Mean Square of Approximation
(RMSEA) and its 90% confidence interval, Akaike‟s Information Criteria (AIC) and
the Expected Cross-Validation Index (ECVI), as measures of each model‟s
adequacy of fit and parsimony and to compare the models. Of these, the Normed
Chi-squared, the RMSEA (and the 90% confidence interval) and the AIC will be
used as the principle measures of fit and parsimony to assess which model has the
best fit, whilst CFI and ECVI will add to the understanding of the fitness of the
competing sets of models.
3.2.5.1 Normed Chi-Squared statistic. The Normed Chi-squared is derived
from the Chi-squared statistic and the model degrees of freedom. The Chi-squared
(Χ2) statistic tests the exact fit of the specified model but can be inflated by
increasingly large sample sizes with reasonable models rejected in large samples
(Holmes-Smith et al., 2006). In addition, the impractical expectation in large samples
that an implied model will exactly fit real world data leads to a significant Chi-
265
squared test with p < .05 (Byrne, 2001). The Chi-squared statistic ranges from 0
(zero) in the saturated model where all possible paths or relationships are included in
the model to the maximum value in the independence (or null) model, where there
are no paths or relationships and therefore no covariances in the model (Schmacker
& Lomax, 2004). The Chi-squared statistic for the specified model falls between
these limits, depending on the particular model being tested. Model degrees of
freedom, relevant for the test of significance of the Χ2 statistic, are calculated as the
number of observations (i.e. the variances and covariance among the observed
variables) less the number of free parameters (sample statistics to be calculated)
(Kline, 2006). Degrees of freedom increase as paths are added or decrease as paths
are removed from the model.
Given the uncertainty associated with using Χ2
alone, it is considered
preferable to use the Normed Chi-squared (Χ2/df), which divides the Chi-squared by
the degree of freedom for the model and accounts for the complexity of the model.
An acceptable range for Normed Chi-squared (Χ2/df) is considered to be between 1
and 2 (Holmes-Smith et al., 2006), although Schumacker & Lomax (2004) note that
models up to a Normed Chi-squared < 5 have acceptable fit but do require
improvement. From these ranges, an acceptable level for the Normed Chi-Squared
(Χ2/df) is considered to be between 1 and 3, with Normed Chi-squared of less than 1
indicate possible overfitting of the model to the data (Holmes-Smith et al., 2004).
3.2.5.2 Root Mean Square Error of Approximation (RMSEA). The Root Mean
Square Error of Approximation (RMSEA) is one of the more important indices, as it
allows for error in estimating the model in the population, includes sample size in its
calculation and is less rigid than the expectation of perfect fit inherent in the Chi-
squared statistic. In this way, the RMSEA assesses the closeness of fit and by

266
accounting for the parsimony of the model and gives better fit estimates for more
parsimonious models. RMSEA can be given as a point estimate, as a 90% confidence
interval and with a significance test of close fit (i.e. that the RMSEA < .05). As with
the significance test for X2, larger p-values indicate better fit, but interpretation of the
p-values for the test of close fit can be confused with the point estimates of the
RMSEA. As the confidence interval and the test of close fit give similar information
about the estimation of the RMSEA (Browne & Cudeck, 1993) and to avoid any
confusion, only the confidence interval will be reported in this thesis.
For the point estimates, an RMSEA equal to 0 indicates perfect fit, ≤ .05
indicate close or good fit, between .05 and .08 indicates reasonable fit, between .08
and .10 indicates mediocre fit and estimates over .10 indicate poor or unsatisfactory
fit (Browne & Cudeck, 1993; Byrne, 2001: Holmes-Smith et al., 2006; Kline, 2005).
Hu and Bentler (1998) have also noted that RMSEA ≤ .06 indicate good fit of a
model. A 90% confidence interval (C.I.) is calculated by AMOS, where a lower
bound estimate of .00 indicated that exact fit of the model can be supported (Holmes-
Smith et al., 2006). Whilst it may be difficult to achieve exact fit of a model, close fit
of the model can be supported when the lower bound estimate of the RMSEA in the
confidence interval is less than .05 (Browne & Cudeck, 1993) and reasonable fit is
supported with an upper bound estimate of .08 (Garson, 2007). However, a CI that
had an upper bound estimate > .10 would indicate poor fit of the model. As with all
confidence intervals, a narrow range indicates that there is less error the calculation
of the RMSEA (Byrne, 2001). The 90% confidence interval can also be used as a
basis to calculate the power of an analysis using the test of close fit (which indicates
that the CI includes .05), the degrees of freedom of the analyses and the sample size
(MacCallum, Browne, & Sugawara, 1996). Having sufficient power was important to

267
ensure that Type I errors are avoided and that the „true‟ state of reality can by
reflected in the modeling. As was demonstrated in the results of the longitudinal
modelling, the sample size in this thesis, combined with the number of parameters
involved in the models, provided sufficient power for the modelling (power ≥ .60) in
4 of the 5 models that have been tested.
3.2.5.3 Akaike Information Criteria (AIC). The Akaike Information Criteria
(AIC) is a predictive fit index of model adequacy, based on information theory of
data analysis, which is useful for determining the most parsimonious model in a set
of competing models. The calculation of the AIC is based on X2 and the number of
parameters estimated in the model, therefore taking into account the complexity of
the model. The acceptable level for the most parsimonious model is the lowest AIC
when comparing two or more models (Byrne, 2001; Kline, 2006). The trend for AIC
estimates is to fall as the fit of the model improves (reflected by the decreasing Chi-
squared statistic) but to increase again past the point of the most parsimonious
model, as an inverted U shape. The AIC allows for the selection of the most
parsimonious model among a set of competing models that are not hierarchical and
use the same data set, as is the case in the current thesis. The AIC therefore indicates
which model combines the best fit with the fewest parameters (Byrne, 2001; Holmes-
Smith et al., 2006; Kline, 2006).
3.2.5.4 Comparative Fit Index (CFI). In the past, the Goodness-of-Fit Index
(GFI) and the Normed Fit Index (NFI) have been used to assess model fit, but these
will not be used in this thesis as these fit indices do not have any penalty for adding
parameters and therefore complexity to the model (Byrne, 2001; Kenny, 2008).
Sample size can affect the assessment of fit using these indices, as the GFI can
overestimate fit in poorly specified models whilst the NFI can underestimate fit in

268
small samples (Byrne, 2001). Based the model‟s Χ2
and including allowance for the
model‟s degree of freedom, the Comparative Fit Index (CFI) is an incremental index
that compares the specified model to the independence or null model. In this way, the
CFI is less sensitive to sample size and more responsive to model complexity (Byrne,
2001). The CFI is scaled from 0 to 1, where CFI ≥ .95 indicate good fit and estimates
of 1 indicate prefect fit (Holmes-Smith et al., 2006).
3.2.5.5 Expected Cross-Validation Index (ECVI). The Expected Cross-
Validation Index (ECVI) addresses the issue of cross-validation of a single-sample
model, when the sample size, as in for the current research, does not allow for
dividing the sample into a calibration and validation sub-samples. The ECVI tests
that the model would be valid in similar sized samples from the same population
(Byrne, 2001; Schmacker & Lomax, 2004). In smaller samples, dividing the data in a
calibration and validation samples for cross-validation can be problematic, as this
can increase the errors of approximation overall and lessen the reliability of the
outcome (Browne & Cudeck, 1993). The ECVI overcomes this by calculating the
fitted covariance matrix using the available data against the expected covariance in a
sample of similar size from the same population, checking the expected overall
discrepancy against all possible calibrations samples. It is then possible using a
single sample to determine if the model would cross-validate to other, similar
populations (Browne & Cudeck, 1993; Byrne, 2001). By comparing the ECVI
estimates of all the competing models, including that of the saturated model of all
possible paths, the smallest ECVI estimate is found and this model will be the most
likely to be replicated (Byrne, 2001) and to be the most stable (Schmacker & Lomax,
2000). This model will also guard against accepting a model that is based on chance
associations within a particular sample that do no apply across a population (Holmes-

269
Smith et al., 2006). A 90% confidence interval (CI) can also be calculated for the
ECVI, which allows for an estimation of the precision of the calculated ECVI and is
a further useful method to compare alternative models (Schmacker & Lomax, 2004).
3.2.6 Early SEM models
Following the hierarchical multiple regressions described in the last chapter,
the significant predictors of the well-being and mental health outcomes were entered
into preliminary SEM analyses to gain an early understanding of the relationships
among the variables to be studied. As with the hierarchical multiple regressions, the
preliminary modeling were conducted using the Time 1 data set (N = 470). The early
models aimed to establish whether causal relationships between the variables,
representing individual differences, workplace factors and the work-life interface and
the well-being and mental health outcomes could be demonstrated. In all cases,
satisfactory, well fitted models could be achieved and provided sound bases for the
subsequent Confirmatory Factor Analyses.
For all of the models under consideration, the initial models were
hypothesized with three exogenous variables and the applicable endogenous
variables. From the results of the HMR, and drawn in a similar way to the simplifies
representation of SEM shown in Figure 3.1, the models were initially hypothesized
with three exogenous factors that were correlated to each other and with each
exogenous variable having a causal influence on each of the endogenous factors. The
endogenous variables were also considered to be correlated to each other in the initial
model.
The exogenous, or independent, latent variables were designated as
Individual Factors, as the observed indicators of dispositional optimism and coping
self-efficacy; Positive Workplace Factors, as the observed indicators, job autonomy,

270
skill discretion and affective commitment; and Negative Spillover, as the observed
indicators of negative work-to-family spillover and negative family-to-work
spillover. Whilst the measurement errors for the observed variables for the
independent variables were also exogenous variables (Holmes-Smith et al. 2006), for
the purposes of the current discussion, only the latent variables were considered.
The endogenous, or dependent, variables change with the model under
consideration. For the first early SEM of positive outcomes, the two endogenous
variables were Work Well-being/Engagement, as the observed indicators of work
satisfaction, work vigour, work dedication and work absorption and Overall Well-
Being, as the observed indicators of life satisfaction and psychological well-being.
For the second early SEM of negative outcomes, the endogenous latent variables
were Mental Illness, as the observed indicators of depression, anxiety and stress and
Burnout, as the observed indicators of exhaustion, cynicism and professional
efficacy. The third model combines all the positive and negative outcomes. These
early SEMs provided the basis for the next step of the confirmatory factor analyses.
3.2.7 Confirmatory Factor Analysis (CFA)
Confirmatory factor analyses (CFAs) were measurement models, where the
relationships between the latent and indicator variables were examined. Figure 3.2
shows a simplified representation of the CFAs used in this thesis, with the latent
factors which reflect or are said to cause the observed, or indicator, variables.
Indicator variables can be either the measured predictor or outcome variables. In the
simplified example of the proposed models shown in Figure 4.2, the latent factor,
„Individual Factors‟ underlies or „causes‟ the indicator variables, „Dispositional
optimism‟ and „Coping self-efficacy‟ and the latent factor, „Overall Well-Being‟
causes the indicator variables, „Life satisfaction‟ and „Psychological well-being‟.

271
Individual
Factors
Overall Well-Being
Dispositional
optimism e111
Coping
Self-efficacy e21
Life
satisfaction e31
1
Psychological
well-being e41
Figure 3.2. Simplified representation of the confirmatory factor analyses
As with Figure 3.1, measurement error terms, „e1‟ to „e4‟ are included as the
observed variables are not perfect estimates of the latent factors.
3.2.8 Models to be considered in the CFAs and for longitudinal modeling
In each of the CFAs that have been conducted, appropriate latent variables
accounted for the multiple predictors and multiple outcomes required for each
individual analysis, as detailed in Table 3.1. Using the Time 1 data set (N = 470),
separate confirmatory factor analyses (CFAs) were conducted in AMOS (Arbuckle,
2006) to develop models of the relationships between the latent outcome and
predictor variables. Five models were considered in the thesis to explore and
understand the longitudinal relationships between the individual, their environment
and their well-being and mental health. As noted by Seligman and Csikszentmihalyi
(2000), the focus of much psychological research in past decades has been on
understanding mental illness and finding ways to alleviate the symptoms of such.
Positive psychology, as an antidote, is orientated toward understanding and exploring

272
Table 3.1
Latent and observed variables used in confirmatory factor analyses
Latent variable SEM Label Observed indicator variables used in CFAs
Overall Well-Being OWB Life satisfaction, psychological well-being
Work Well-Being WWB Work satisfaction, work dedication,
work absorption
Mental Illness MI Depression, anxiety, stress
Burnout Burnout Exhaustion, cynicism, professional efficacy
Work Engagement WE Work dedication, work absorption,
professional efficacy
Individual Factors IF Dispositional optimism, coping self-efficacy
Positive Workplace Factors
PWF Affective commitment, job autonomy, skill
discretion
Negative Spillover NSP Negative work-to-family spillover, negative
family-to-work spillover, exhaustion (only
included in final Integrated model)
the strengths and positives of human functioning. The first and second longitudinal
models considered this divide between positive and negative outcomes. The first
longitudinal model explored the positive outcomes of overall well-being and work
well-being as an analysis of Well-Being and the second longitudinal model explored
the negative outcomes of mental illness and burnout as an analysis of Mental
Distress.
However, positive and negative outcomes do not occur in isolation from each

273
other (Bohart, 2002) and it was important to consider and explore together the
relative influences of the positive and negative over time, which could then account
for that the multiple influences on an individual. As such, the third and fourth
longitudinal models looked at the combination of positive and negative outcomes.
The third longitudinal model was an analysis of Well-Being - Mental Health,
combining overall well-being and mental illness (in a similar manner to
Keyes‟(2002, 2005) research). The fourth model was an analysis of Work
Engagement, which explored the affective states within burnout (as exhaustion,
cynicism and professional efficacy) and work engagement (as work vigour, work
dedication and work absorption) and extended recent research on the formulation of
these constructs (for example, Schaufeli et al., 2008). The fifth longitudinal model
included all the outcomes to explore a more complete, Integrated model which had
not been published elsewhere and brought together all influences on the individual
for an overall understanding their lives.
3.2.9 Constructing composite variables for the longitudinal models
When an acceptable CFA model has been shown to have good fit, a
composite variable can be calculated. Factor score weights were derived from the
CFA and converted the latent unmeasured variable to an observed measured
variable. A limitation of using many observed and latent variables in modelling of
longitudinal data was that the models can be unstable and confounded by the
difficulties of estimating numerous parameters unless the sample size is very large.
The composite variables overcome this serious limitation (Holmes-Smith et al.,
2006). The reliability of the composite variables was also assessed by examination of
the squared multiple correlation of each indicator variable that contribute to the
composite variable. Squared multiple correlations (SMC) of greater than .30 were
274
acceptable, with SMC greater than .50 indicating a good observed variable (Holmes-
Smith et al., 2006).
The calculation of the composite variables for each participant was stated
formally as ξ = ωX, and calculated for the ith
participant with n indicator variables, as
ξi = ω1X1i + ω2X2i + … + ωnXn (2)
(Holmes-Smith et al., 2006). That was to say that the estimated composite score for
the new variable was the sum of the factor score weight (ω) for the particular
observed indicator variable multiplied by the participant‟s scores (X) for that
observed indicator variable. Factor score weights therefore represent the proportion
that each of the measured variables contributes to the latent variables, based on the
relationships found in the confirmatory factor analyses (Holmes-Smith et al., 2006).
For example, in the Well-Being - Mental Health model, the mental illness latent
variable at Time 1 became the measured Mental Illness composite variable,
MIwbmh1, through the following equation (3):
MIwbmh1 = [Depression tm1*.519] + [Anxiety tm1*.083] + [Stress
tm1*.156] + [life satisfaction tm1*-.019] + [psychological well-being tm1*-
.020] + [negative family-work spillover tm1*.146] + [negative work-family
spillover tm1*.032] + [affective commitment tm1*.008] + [job autonomy
tm1*.023] + [skill discretion tm1*-.034] + [coping self-efficacy tm1*-.011] +
[dispositional optimism tm1*-.081]. (3)
Note that „tm1‟ at the end of each variable indicates that this was the
participant‟s score at Time 1 for each of the following measured variables. From this
example, it can be seen that whilst depression, anxiety and stress contribute greatly to
the composite variable MI (mental illness), every other variable also contributed
something to its final calculation. These contributions can be both intuitive and
275
counterintuitive. In the example above, life satisfaction (SWLStm1) had the
expected, negative contribution to the mental illness composite variable, whilst job
autonomy (JobAUTtm1) has an unexpected, positive contribution. This could be
explained as life satisfaction acting as a buffer for the individual against mental
illnesses (i.e. less life satisfaction increased mental illness) but that greater autonomy
or decision making in one‟s job could add to the stress that the individual
experiences, leading to greater mental illnesses.
3.2.10 Naming the composite variables
Naming the new variables took into account the different models for which
they were constructed, such that the labels were as clear as possible in indicating to
which model the variables belong. For example, as a general term, IF referred to
individual factors, whilst IFwb referred to the individual factors variable in the Well-
Being model, IFmi referred to the individual factors variable in the Mental Distress
model, IFwbmh referred to the individual factors variable in the Well-Being - Mental
Health model, IFwa referred to the individual factors variable in the Work
Engagement model, and IFcm referred to the individual factors variable in the
complete, Integrated model. The labels were therefore derived from a specific CFA
and relate to a particular model. As such, „wb‟ was the label for the Well-Being, „mi‟
for the Mental Distress model, „wbmh‟ for the Well-Being - Mental Health model
that combined well-being and mental health, „wa‟ for the Work Engagement model,
and „cm‟ for the complete Integrated model. The label „im‟ was considered for the
Integrated model, but discarded because of the likely confusion between the „mi‟ of
the Mental Distress model and the „im‟ of the Integrated model.
It should be noted that it was not appropriate to use the composite variables in
any other analysis than for the one for which it is calculated. By labelling the
276
composite variables in this way, it remained clear which variables were to be
included in which analyses. When a general analytic strategy is described however,
the general label of IF can be used rather than the particular labels, IFwb, IFmi,
IFwbmh, IFwa and IFcm, as the general process rather than specific models are being
described. It should also be noted that „1‟, „2‟, and „3‟ at the end of a variable name
indicated that the variable was relevant to Time 1, Time 2, and Time 3 respectively.
3.2.11 Calculations of the composite variables
The composite variables were calculated in SPSS using the prospective panel
data set of participants (n=198) that provided data at all three time periods. As noted
in Chapter 2, attrition analysis showed that the participants who were „lost‟ from the
earlier rounds of data collection were not significantly different to those people who
completed measures at all three time periods. Cross-validation of the SPSS
calculations of the composite variables was conducted using hand calculations with
these composite scores matching the scores calculated by SPSS. Each new variable
was calculated separately for Times 1, 2 and 3, using the observed indicator variables
of that particular time period. As shown in the example above on calculating the
composite variable of mental illness at time 1, MIwbmh1, only Time 1 observed
variables were used. To calculate the new Time 2 and Time 3 composite variables for
mental illness, the Time 1 variables (e.g. depression tm1) were replaced by the
observed Time 2 (depression tm2) and Time 3 (depression tm3) variables,
respectively. In this way, the panel data set now contained composite variables
suitable to use in the longitudinal analyses.
3.2.12 Analytical strategy for longitudinal modelling
3.2.12.1 Set of models to be compared. The panel data was analysed
in AMOS (Arbuckle, 2006), using the Maximum Likelihood (ML) method.

277
Structural equation modelling is useful in longitudinal analyses as it accounts for any
errors in the measurement of the variables, it allows for all causal relationships to be
simultaneously estimated and for reciprocal relationships to be introduced and for the
methodological limitations of multiple regression to be overcome (Zapf, Dormann, &
Frese, 1996). Whilst there is limited research that investigates longitudinal
relationships around the work-life interface, the available research is consistent in its
approach. Following the procedures outlined de Jonge, Demerouti, Bakker and
colleagues in their investigations of burnout and work engagement (de Jonge et al.,
2001; Demerouti, Bakker et al., 2004; Llorens et al., 2007), the set of the models
were compared in the following sequence of Stability, Causality, Reverse Causality,
and Reciprocal Models. This sequence represented a progression of model building,
starting on the basis of the Stability model and culminating in the most complex, the
Reciprocal model. These models were not nested models however as the Causality
and Reverse Causality cannot be derived from each other (Kline, 2006). This thesis
Figure 3.3. Representation of the basic relationships to be tested in the longitudinal
analyses

278
took the longitudinal model approach a novel step further by investigating the effects
of model trimming, in that the pathways that have trivial contributions to the model
were removed to better understand the influential pathways of the better fitting
models.
The explanations of the set of competing models were based on the simplified
relationships as shown in Figure 3.3. The composite predictor variables of individual
differences, positive workplace factors, and negative spillover were represented as
predictor1, predictor2, and predictor3, at Time 1, Time 2 and Time 3 respectively.
Similarly, the composite outcome variables of overall well-being, work well-being,
work affect, mental illness and burnout are represented as outcome1, outcome2, and
outcome3 at Time 1, Time 2 and Time 3, respectively. By convention, correlations
were drawn as double-headed arrows, whilst causal relationships were drawn as
single-headed arrow, pointing from the causal variable to the variable being
influenced (Holmes-Smith et al., 2006). As noted previously, there was not perfect
measurement of the indicator variables and measurement errors are added to the
model, shown as „e1‟ to „e6‟.
The initial models did not include the longer term stability elements (i.e.
causal arrows) from Time 1 to Time 3, but the fit of all models within the set of
competing models were substantially improved by the addition of these paths. For
example, the AIC of the Well-Being Stability model was reduced from 285.58 to
178.40 and the RMSEA was reduced from an ill-fitting and unacceptable figure of
.147 to a better, although still mediocre fit of .091 by the inclusion of Time 1 to Time
3 auto-lagged paths. Similar dramatic improvements were found for the fit indices
for the Causality, Reverse Causality and Reciprocal models and the auto-lagged
paths from Time 1 to Time 3 were therefore included as standard in each of the

279
longitudinal models.
Model A is the Stability model represented the synchronous correlations
between the variables (i.e. the cross-sectional relationships), along with the auto-
lagged relationships (i.e. the relationships between the same variable across time),
which represent the temporal stability of each variable from Time 1 to Time 2, Time
2 to Time 3 and Time 1 to Time 3. The Stability model therefore accounted for
concurrent functioning and the short-term and longer term stability of each variable.
These results show that the individual‟s current functioning had significant
contributions from functioning in the recent and the more distant past.
Model B was the Causality model, which incorporated the stability model and
added the additional cross-lagged paths of Time 1 to Time 2 and from Time 2 to time
3. However, the Time 1 to Time 3 paths, i.e. „predictor1‟ to „outcome3‟, were not
included in the final models as these paths reduced the goodness of the model fit and
each path was highly non-significant. For example in the Well-Being model, adding
the cross-lagged paths from Time 1 to Time 3 paths in the Causality model increased
the AIC from 135.39 to 141.27 and increased the RMSEA from .037 to .044,
indicating a reduction in model fit. In summary, the causality model, Model B,
represents how predictor variables lead to changes in the outcome variables at a later
time, in addition to concurrent functioning and short and long term stability.
Model C was the Reverse Causality model which incorporated the stability
model and added the reverse causal relationships between the outcome variables and
the predictor variables, positive workplace factors and negative spillover, which were
cross-lagged from Time 1 to Time 2 and Time 2 to Time 3. For example, the
pathways would include each reverse causal pathway from „outcome1‟ to
„predictor2‟ and „outcome2‟ to „predictor3‟. Similarly to Model B, cross-lagged

280
pathways from Time 1 to Time 3 were not included, as these paths reduced the
model fit. For example, in the Well-Being Reverse Causality model, the addition of
the Time 1 to Time 3 paths, that is „outcome1‟ to „predictor3‟, increased the AIC
from 142.18 to 147.23, and increased the RMSEA from .051 to .057. These changes
again indicated that these paths did not add to the fit of the model. In summary, the
reverse causality model, Model C, tested the causal influence of variables, which are
usually only considered as outcomes of developmental processes, in addition to
concurrent functioning and short and long term variable stability.
Model D was the Reciprocal model, which incorporated the Stability,
Causality and Reverse Causality models, such that all the relationships of the
previous models can be considered together. For the same reasons noted for Models
B and C, Model D did not include the Time 1 to Time 3 cross-lagged pathways.
Model D allowed for the inclusion of the causality and reversed causality pathways
that are likely to be influential to longitudinal functioning.
3.2.12.2 Model trimming. The process of building up the models, from the
basic Stability model to the more complex Reciprocal model, allowed for the
consideration of how each of these added pathways increased or decreased model fit.
The next phase was to remove superficial pathways to better understand which of the
pathways could be considered responsible for influencing functioning at a later time,
i.e. having a causal effect over time. In the five longitudinal models, either the
Reciprocal model alone or the Reciprocal model tied with the Causality model to be
the best fitting model before model trimming was considered. The final step in the
comparison of the competing models, the trimmed model is designated as Model E
and explored the effect of removing the trivial pathways on the fit and explanatory
power of the model (Garson, 2007; Kline, 2006). Whilst a number of the cross-

281
lagged paths were statistically not significant, the purpose was to remove those paths
with minimal variance (≤ 1%), measured as standardized regression weights (β
weights) of β ≤ .10, that were non-significant (p > .20), as opposed to removing all
non-significant pathway. In this way, it was expected that only trivial paths would be
removed. Kline (2006) noted that it is not necessary to remove all the non-significant
paths, where either sample size or power are small. Further, he stated that true
nonzero causal paths may be non-significant in a particular sample and their removal
would lead to Type II errors and loss of explanatory power. Removing the non-
significant paths also guards against Type I errors such that chance relationships
would not be considered important.
In the current thesis, the sample size (N = 198) was considered adequate,
although the power of the analyses, which was lower for the less complex models
than for the Integrated model, may raise issues of replication (MacCallum et al.,
1996). Kline (2006) also suggested retaining the paths until replication of the model
in another sample could show if the paths were meaningful or had a negligible effect.
The Expected Cross-Validation Index (ECVI) has been given for each of the models
in an effort to address the issue of reproducing the results of the modeling in the
current thesis in other samples, given the consideration of sample size and power,
with the lowest ECVI indicating the model most likely to be replicated in a similar
sample drawn from the same population. It was important to show that the saturated
model, where all possible pathways are estimated did not have the lowest ECVI,
which would indicate that despite a model having acceptable fit indices, the proposed
model would not be the most likely to be replicated (Browne & Cudeck, 1993).
3.2.13 Summary of methods used for the longitudinal modeling
This chapter has outlined the process involved in longitudinal modelling.

282
Beginning with hierarchical multiple regressions which clarified the most common
significant predictors of the well-being and mental health outcomes (and detailed in
Chapter 2), the second step was the development of the initial structural equation
models to explore the causal relationships between predictors and outcomes. After
satisfactory models were achieved, the third step was the confirmatory factor
analyses (CFAs) which were conducted to show the dynamic nature of the
relationships that occur synchronously. From the CFAs, composite variables were
then constructed to represent these dynamic relationships and to test the stability and
reciprocity of relationships within and between the composite variables across the
three time periods. The final step was to compare the sets of longitudinal models and
the effect of removing the trivial pathways, such that the best fit of the longitudinal
models was established.
By finding the model that was the best fit of the data, Study 2 will allow the
influential developmental pathways to be established. In this way, the intricate web
of cause and effect can be revealed to extend the understanding of how the
competent adult develops, how well-being and mental health are maintained over
time, and where interventions to improve mental health may be most effective.
3.3 Results of the Longitudinal Modeling
3.3.1 Sample size and characteristics
The sample for the longitudinal analysis of well-being and mental health was
drawn from the participants of the on-line surveys, described in Chapter 3 on
Hierarchical Multiple Regression. Only those participants that completed the on-line
surveys at all three time periods (N = 203) were included in the data set with 5
participants removed as being multivariate outliers, leaving a sample of N = 198.
Unlike multiple regression, where N = 50 + 8K (Tabachnick & Fidell, 2006) is

283
accepted as the guide for the minimum sample size, there appears to be no definitive
minimum sample size for SEM, with the definition of a small sample ranging from N
≤ 50 to N ≤ 250 (Hu & Bentler, 1998; Kline, 2006). It was necessary to consider
whether the sample for the proposed analyses was sufficient to ensure adequate
power. A recent proposal that sample sizes of less than 200 be rejected for
publication (Barrett, 2007) has been rebutted vigorously by a number of authors (for
example, Bentler, 2007; Goffin, 2007; Hayduck, Cummings, Boadu, Pazderka-
Robinson, & Boulianne, 2007). Barrett‟s cut-off does not take into account the
number of parameters involved (and hence, model degrees of freedom) or the power
of the analyses (Bentler, 2007; Goffin, 2007), nor previously published articles (for
example, Llorens et al., 2007) that have found well-fitting models in small samples.
To address the issue of sample size for the proposed analyses, two methods
were used to calculate the adequacy of the sample size. First, a ratio of sample size to
observed variables (n:v) can be used as a guideline for a minimum sample size, using
the ratio of 10:1 or 15: 1 as a minimum (B. Thompson, 2000). For the most complex
longitudinal model analysed in the current thesis (the Integrated model), there were
198 participants and 18 composite variables used as observed variables, giving a
ratio of 11:1, which was above the minimum desired ratio. In the least complex
model, the Well-Being model, there were 198 participants and 12 composite
variables, for a ratio of 16.5:1. A second method for determining the sufficiency of
the sample size used the distributions of the Root Mean Square of Approximation
(RMSEA) to calculate the power of the test of closeness of fit, based on the model
degrees of freedom and the sample size (MacCallum et al., 1996). Given these inputs
of N= 198 and model degrees of freedom ranging from 22 (for the Well-Being
model) to 64 (for the Integrated model), the best fit in the sets of models proposed

284
and tested in the current thesis had an estimated power to find a close fitting model
of 48% (Well-Being model) to 85%, respectively (Integrated model). From both
methods of assessing sample size, it was judged that for the current thesis, the sample
was sufficient to provide adequate power to test that the models can provide evidence
of close fitting models. Replication of the models in another sample is of course
desirable to confirm the generalisability of the models.
The sample consisted of participants from the alumni of a university and the
administrative staff from a large public hospital who took part in the prospective
panel study outlined in Chapter 2. The individuals who completed all three time
periods were very similar to the participants at Time 1. There were 156 women
(78.8%) and 42 (21.2%) men, ranging in age from 19 to 62 years (M = 38.18 years,
SD = 11.14 years), and working around 41 hours per week across the three time
periods (Time 1, M = 40.96 hours, SD =11.91 hours; Time 2, M = 41.18 hours, SD =
11.39 hours; Time 3, M = 41.58 hours, SD = 12.58 hours).
As with the Time 1 data, the participants were mostly married or living with
their partner (63.6%) or single, having never been married (25.3%). Over half of the
sample did not have children, whilst most who were parents had two or three
children (75.5% of parents). Education attainment was again similar between the
Time 1 data and the panel data, those who completed only high school (17.3%),
those with trade or technical qualifications (9.1%), and those with undergraduate
degrees (49.7%) to those with postgraduate qualifications (23.9%).
Around half of the sample would like to work a few less hours per week at
each time period (Time 1, 48.5%; Time 2, 51.1%; Time 3, 55.1%), with around 30%
preferring to work about the same hours as they currently work (Time 1, 34.7%;
Time 2, 30.8%; Time 3, 28.8%). In this sample, only 4 (at Time 1) and 3 (at Times 2

285
& 3) participants (1.5%) preferred a few more hours per week but no one wanted to
work many more hours than they were currently working. It was interesting to note
that whilst there were significant, negative relationships between the hours
individuals worked and their preferences for more or less work hours (i.e. work
longer hours, prefer to work less hours), neither the actual nor the preferred length of
the working week were among the significant predictors of the well-being and
mental health outcomes. As such, the relationships between actual and preferred
work hours was not explored further.
3.3.2 Assessing the fit and parsimony of the models
To reiterate from the previous chapter on the methods involved in the
longitudinal modelling, a poorly fitting model was considered to be incorrectly
specified, as it did not reproduce the sample covariance matrix adequately (Byrne,
2001; Kline, 2006). From the initial hypothesized models to the final, fitted models,
the model can be respecified or revised to improve the fit between the model and the
sample covariance matrix. Paths can be removed or added based on the Modification
Indices (an indication of the change in X2 when a particular parameter was estimated
in the revised model) and a consideration of the statistical significance of the paths.
However, it was important to consider that any changes were theoretically
meaningful and not driven solely by statistical concerns (Holmes-Smith et al., 2006).
As noted earlier in the chapter, acceptable levels for the fit indices for SEM was
taken as follows: Normed Chi-Squared (X2/df) between 1 and 3; Comparative Fit
Index (CFI) ≥ .95; the point estimate of RMSEA, equal to .00 (perfect fit), ≤ .05
(close or good fit), .05 to .08 (reasonable fit), .08 to .10 (mediocre fit) and > .10
(unsatisfactory fit); and for the RMSEA 90% confidence interval (CI), a lower bound
estimate of .00 indicated perfect fit and a CI that had an upper bound estimate > .10

286
would indicate poor fit of the model. For the longitudinal models, Akaike‟s
Information Criteria (AIC) and the Expected Cross-Validation Index (ECVI) are
given, with the lowest value within a set of models being compared the most
parsimonious and the most likely to be replicated, respectively (Browne & Cudeck,
1993; Byrne, 2001; Kline, 2006; Schmacker & Lomax, 2004).
3.4 Time 1 SEMs as a basis for longitudinal models
The modelling was intended, first, to establish that models could be
satisfactorily fitted to the data and, second, to understand the nature and direction of
the relationships in the models. Three SEMs were conducted, using the Time 1 data
(N = 470) for the positive outcomes, the negative outcomes and for a combination of
all the outcomes. These three models formed the basis for the subsequent
longitudinal analyses. The full explanations of the Time 1 models are shown in
Appendix H, with figures of the models and model summaries. There is limited detail
here as the main purpose of the initial models was to establish whether the proposed
relationships would be supported by the data.
For all of the models under consideration, the initial models were
hypothesized with three exogenous variables and the applicable endogenous
variables. Based on previous research and the correlations in Table 2.3, the models
were initially hypothesized as first, that the three exogenous factors were correlated
to each other and second, that each exogenous variable had a causal influence on
each of the endogenous factors. The endogenous variables were also considered to be
correlated to each other in the initial Time 1 model.
The exogenous latent variables for the three models were designated as
Individual Factors (as the observed indicators of dispositional optimism and coping
self-efficacy), Positive Workplace Factors (as the observed indicators, job autonomy,

287
skill discretion and affective commitment) and Negative Spillover (as the observed
indicators of negative work-to-family spillover and negative family-to-work
spillover). Whilst the measurement errors for the observed variables for the
independent variables are also exogenous variables (Holmes-Smith et al. 2006), for
the purposes of the current discussion, only the latent variables were considered.
The endogenous variables changed with the Time 1 model under
consideration. For the first Time 1 model of the positive outcomes, the two
endogenous variables were Work Well-Being (as the observed indicators of work
satisfaction, work vigour, work dedication and work absorption) and Overall Well-
Being (as the observed indicators of life satisfaction and psychological well-being).
Modification indices were used to consider how best to improve the fit of the models,
removing work satisfaction and work vigour from the Work Well-Being and
removing Negative Spillover as an exogenous latent variable. The final model for the
positive outcomes was well fitting, X2/df = 1.758, CFI = .992, RMSEA = .041 (90%
CI = .011-.066). For the second Time 1 model of negative outcomes, the endogenous
latent variables were Mental Illness (as the observed indicators of depression, anxiety
and stress) and Burnout (as the observe indicators of exhaustion, cynicism, and
professional efficacy). Modification indices indicated that fit would be improved by
removing stress and exhaustion and the result of the first model of negative outcomes
had acceptable fit, X2/df = 2.309, CFI = .970, RMSEA = .053 (90% CI = .038 -
.069). Another model, with the same exogenous variables, was tested with stress and
exhaustion as the outcomes. This second model of negative outcomes also had
acceptable fit, X2/df = 1.616, CFI = .997, RMSEA = .037 (90% CI = .000 - .089).
With these Time 1 structural models establishing that the well-being and
mental health outcomes could be modelled separately in this data, the next step was
288
to combine the initial three models to find if these would form a tenable overall
model that included all outcomes. The Time 1 SEM that combined all the outcomes
had the three exogenous latent variables of Individual Factors (as dispositional
optimism and coping self-efficacy), Positive Workplace Factors (as skill discretion,
job autonomy, and affective commitment) and Negative Spillover (as negative work-
to-family spillover and negative family-to-work spillover) which were correlated
with other and separately having a causal influence on the three endogenous latent
variables of Mental Illness (as depression, anxiety and stress), Work Engagement (as
work dedication, work absorption, professional efficacy and cynicism) and Overall
Well-Being (as life satisfaction and psychological well-being). Cynicism was
removed from the model to improve fit with some additional paths between indicator
variables. The final model in shown in Appendix H, Figure H.4, and had acceptable
fit, X2/df = 2.473, CFI = .965, RMSEA = .057 (90% CI = .046 -.068).
The relationships between the individual, their workplace and problems
within the work-life interface have distinct effects of the well-being, mental health
and work engagement of the participants involved in the current thesis. Using the
Time 1 SEMs as a basis, the next step was the confirmatory factor analyses for each
of the five designated models, with various combinations of the positive and negative
outcomes, and then developing and testing the longitudinal models.
3.5 Confirmatory factor analyses (CFAs)
From the early SEMs using the Time 1 data, there were five models to be
examined through the Confirmatory Factor Analyses (CFAs) and then as longitudinal
models. The first model of Well-Being combined the positive outcomes of Overall
Well-Being (as life satisfaction and psychological well-being) and Work Well-Being
(as work dedication and work absorption), the second model of Mental Distress

289
combined the negative outcomes of Burnout (as exhaustion, cynicism, and
professional efficacy) and Mental Illness (as depression, anxiety and stress). The
third model of Well-Being – Mental Health combined Overall Well-Being and
Mental Illness, the fourth model of Work Engagement explored and refined Burnout
and Work Engagement in a study of Work engagement and the fifth Integrated model
brought together all the outcomes to consider all possible relationships. The CFA and
subsequent factor score weights of each model are considered in turn, before
examining the results of the longitudinal models themselves.
Whilst this may seem to be a long process to arrive at the final longitudinal
models, I believe that the exploration of the combinations of the positive and
negative outcomes illustrated the holistic view of psychological functioning where
„everything‟ can be included. For example, the combination of burnout and work
engagement was particularly interesting and gave unexpected results which were
quite different to much of the prevailing research. This step by step approach,
building up to the final Integrated model allowed for all of the relationships in this
sample to be fully explored.
3.5.1 Confirmatory factor analysis of Well-Being model
Building on the basis of the model of positive outcomes at Time 1, a
confirmatory factor analysis (CFA) was conducted for the Well-Being model. It
should be noted that unlike the graphical arrangement of the Time 1 SEMs with the
causal relationships of the structural model, the CFA shows a measurement model,
where the latent factors are considered to be correlated. In this way, factor score
weights were generated to allow the transformation of latent, unobserved variables to
observed variables for the longitudinal models (de Jonge et al., 2001; Holmes-Smith
et al. 2006). The fit and parsimony indices for the Well-Being CFA, shown in

290
Appendix I, Figure I.1 are as follows and indicated a reasonable fit of the CFA; X2/df
= 1.987, CFI = .949, RMSEA = .046 (90% CI = .019-.072). The standardized
regression weights (β) and squared multiple correlations between the latent factors
and the observed indicators and the correlations between the latent factors and
correlations between the observed variables are shown in full in the Appendix
(Tables I.1 and I.2). The results of the CFA show that each indicator variable loads
well onto the latent variables, with the loadings ranging from β = .557 (p <.001) for
job autonomy to β =.994 (p < .001) for work dedication. The correlations between
the latent factors reflect the relationships evident in the early SEM, in that Individual
Factors and Overall Well-Being were closely related (r = .924, p < .001) and Positive
Workplace Factors and Work Well-Being were also closely related (r = .882, p <
.001). There were also positive correlations between Individual Factors and Positive
Workplace Factors (r = .490, p < .001) and Work Well-Being (r = .463, p < .001),
Positive Workplace Factors and Overall Well-Being (r =.546, p < .001) and between
Overall Well-Being and Work Well-Being (r = .460, p < .001). The correlations
between the indicator variables indicated that job autonomy had a relationship with
life satisfaction (r = .177, p = .039), over and above the specified relationships
through the latent variables of Positive Workplace Factors, Work Well-Being and
Overall Well-Being respectively.
3.5.2 Factor Score Weights for Well-Being model
Based on the CFA, factor score weights were calculated by AMOS to reflect
the relationships within the CFA and are shown in Table 3.2. The composite
variables were then calculated in SPSS as the weighted sum of each indicator
variable, based on the individual‟s score for an indicator variable multiplied by the
factor score weight for that indicator variable. The factor score weights can therefore

291
be viewed as a raw weighting for each scale, without any implication of significance
of the predictors. Most scales have similar numbers of items (between 4 and 7) and
were based on a similar rating scale (from 1, strongly disagree to 5, strongly agree).
Psychological well-being had more items (18) but on the same rating scale (1 to 5)
whilst coping self-efficacy was the exception to both, with the scale having 26 items
and being rated on 1 (not at all certain) to 7 (completely certain). These differences
must be kept in mind when interpreting the factor score weights. For example, from
Tables 3.2, dispositional optimism with 6 items, had a maximum score of 30 that
could be multiplied by the factor score weight for IFwb .162 and would be weighted
as 4.860, whereas coping self-efficacy, with 26 items had a maximum score of 182
that could be multiplied by the factor score weight for IFwb of .032 and would be
weighted as 5.824 in the composite variable, IFwb.
The two highest contributors to each composite variable are highlighted in
bold in Table 3.2. For Overall Well-Being (OWB) the two highest contributors were
the two indicator variables of the corresponding latent variable in the CFA, whilst for
(WWB), the contributions were more varied. For Individual Factors, the highest raw
contribution come from dispositional optimism and psychological well-being, with
less weight given to the larger scale for coping self-efficacy. For both Positive
Workplace Factors and Work Well- Being, the highest raw contributors were work
dedication and skill discretion, although at different levels as shown in Table 3.2.
Work Well-Being was overwhelmingly composed of the indicator variable, work
dedication rather than skill discretion, whereas the contribution for Positive
Workplace Factors was work dedication and skill discretion was more evenly
distributed. Despite these obvious linkages, it was important to keep the composite
variables separate, to allow the conditions of a positive workplace and work

292
Table 3.2
Factor Score weights for composite variables for the Well-Being model
Weighted contribution of observed variables to each
composite variable
Observed variable IFwba PWFwb
a WWBwb
a OWBwb
a
Dispositional optimism .162 -.006 .008 .221
Coping self-efficacy .032 -.001 .002 .044
Skill discretion -.009 .263 .079 .091
Job autonomy -.018 .114 .035 -.006
Work dedication .067 .451 .830 .050
Work absorption .005 .033 .060 .004
Psychological well-being .133 .037 .004 .435
Life satisfaction .116 .020 -.001 .374
Note. a IFwb, PWFwb, WWBwb, and OWBwb are the Individual Factors, Positive Workplace
Factors, Work Well-Being, and Overall Well-Being variables, respectively, for the Well-Being
longitudinal model
Note. Two highest factor score weights for each composite variable highlighted in bold
well-being to be studied separately to understand the processes involved, rather than
the processes be hidden within a single composite variable.
3.5.3 Confirmatory factor analysis of the Mental Distress model
From the early SEMs, a CFA was conducted to consider the negative
outcomes of Mental Illness (as depression, anxiety and stress) and Burnout (as
exhaustion, cynicism, and professional efficacy). The negative outcomes were
designated as two latent factors, Mental Illness and Burnout and these outcomes were
considered along with Individual Factors (as dispositional optimism and coping self-
efficacy), Positive Workplace Factors (as skill discretion, job autonomy and affective
commitment) and Negative Spillover (as negative work-to-family spillover and

293
negative family-to-work spillover). Using the Modification Indices, the final CFA is
shown in Appendix I, Figure I.2 with the fit indices for the CFA being X2/df = 2.837,
CFI = .888, RMSEA = .063 (90% CI = .050-.076). Given that this CFA combined
the two SEMs of the negative outcomes, it was reasonable to expect and accept some
„untidiness‟, in that there would be a number of correlations between the
measurement errors, but fit of the CFA was acceptable although near the upper limits
of acceptability (e.g. X2/df ≤ 3). Whilst stress and exhaustion could be removed to
minimize the cross-loadings indicated by the correlations, the improvement in fit was
not sufficient to justify leaving out such important constructs.
The correlations between the latent factors show expected positive
correlations between Individual Factors and Positive Workplace Factors (r = .424, p
< .001), Negative Spillover and Burnout (r = .816, p <.001), Negative Spillover and
Mental Illness (r = .688, p <.001) and between Burnout and Mental Illness (r = .631,
p < .001). The correlations also indicate that negative correlations between the latent
factors, Individual Factors and Negative Spillover (r = -.490, p < .001), Burnout (r =
-.617, p < .001) and Mental Illness (r = -.712, p < .001) and Positive Workplace
Factors and Negative Spillover (r = -.603, p < .001), Burnout (r = -.916, p < .001)
and Mental Illness (r = -.369, p < .001). These relationships were supplemented by
the direct relationships between the observed variables as shown by the correlations
between the measurement errors. Of note, negative work-to-family spillover was
positively correlated to exhaustion (r = .468, p < .001) and to stress (r = .302, p
<.001), as were anxiety and stress (r = .348, p < .001). Interestingly, exhaustion was
positively correlated with skill discretion (r = .234, p < .001) and professional
efficacy was positively correlated with depression (r = .197, p = .007). The
remaining correlations were positive, which were both intuitive (exhaustion and

294
stress, r = .145, p = .017) and counterintuitive (dispositional optimism and stress, r =
.113, p = .031; coping self-efficacy and cynicism, r = .150, p = .026; and professional
efficacy and exhaustion, r = .100, p = .022).
The squared multiple correlations give the reliability of the indicator
variables for the latent factors. All indicator variables were within acceptable ranges
for the squared multiple correlations (> .30, Holmes-Smith et al., 2006), with the
lowest being professional efficacy (.340) to the highest, depression (.810). The full
list is given in the Appendix in Tables I.3 and I.4.
3.5.4 Factor score weights for the Mental Distress model
The composite variables to be used in the longitudinal model were derived
from the factor score weights generated from the CFA for Mental Distress and are
shown in Table 3.3. The weighted balance of the contribution of each observed
variable to the new, composite variables can be seen, with greater factor score
weights indicating that the indicator variable would contribute more to the composite
variable than lesser factor score weights. The two highest raw contributors to each
composite variable are shown in bold in Table 3.3. For the Negative Spillover (NSP),
Burnout and Mental Illness (MI) composite variables, the two highest contributors
were indicator variables of the corresponding latent variables in the CFA. For
example negative work-to-family spillover (.190) and negative family-to-work
spillover (.212) contributing to Negative Spillover. However, for Individual Factors
(IF) and Positive Workplace Factors (PWF), the contributors were more varied.
Coping self- efficacy had less weight for Individual Factors after dispositional
optimism, a lack of cynicism and less depression. For Positive Workplace Factors,
contributions from a lack of cynicism and less exhaustion were followed by the
contribution from affective commitment.

295
Table 3.3
Factor Score weights for composite variables for the Mental Distress model
Weighted contribution of observed variables to each
Composite variable
Observed variable IFmia PWFmi
a NSPmi
a Burnout
a MIllness
a
Dispositional optimism .245 -.010 .012 -.020 -.080
CSE .048 .003 .000 -.010 -.012
Skill discretion .003 .127 -.007 -.110 .018
Autonomy -.008 .122 -.009 -.095 .027
Affective commitment -.007 .132 -.010 -.104 .028
Neg work-family spillover .072 .077 .190 .004 -.009
Neg family-work spillover .021 -.021 .212 .129 .105
Exhaustion -.034 -.155 .000 .163 .003
Cynicism -.091 -.187 .104 .267 .066
Professional efficacy .039 .097 -.061 -.148 -.141
Depression -.081 .019 .074 .066 .533
Anxiety .000 .003 .021 .012 .072
Stress -.051 .017 -.015 -.007 .155 Note. IFmi, PWFmi, NSPmi, Burnout and MIllness are the Individual Factors, Positive Workplace
Factors, Negative Spillover, Burnout and Mental Illness, respectively, for the Mental Distress
longitudinal model
Note. Two highest factor score weights for each composite variable are shown in bold
3.5.5 Confirmatory factor analysis for the Well-Being-Mental Health model
The third CFA combined the positive and negative outcomes of Overall Well-
Being and Mental Illness Fit and had good fit indices for the model, X2/df = 1.592,
CFI = .988, RMSEA = .036 (90% CI .000 - .052). The CFA is shown in Appendix I,
Figure I.3. The standardized regression weights (β) and squared multiple correlations

296
for the indicator variables were well above acceptable levels (Holmes-Smith et al.,
2006) and are shown in the Appendix I (Tables I.5 and I.6). With the exception of
affective commitment (β = .477, p < .001), all indicators had β ≥ .625 (for negative
work-to- family spillover), with the highest for depression (β = .889, p < .001). As
such, the squared multiple correlations, as measures of the reliabilities of the
indicator variables, were also above acceptable levels (> .30). Although the squared
multiple correlation for affective commitment was below this cut-off level, it had
been retained as it was a highly significant indicator variable for Positive Workplace
Factors. The correlations between the latent factors gave the expected relationships.
Individual Factors was positively correlated with Positive Workplace Factors (r =
.463, p < .001) and with Overall Well-Being (r = .922, p < .001), Positive Workplace
Factors with Overall Well-Being (r = .538, p < .001) and Negative Spillover and
Mental Illness (r =.737, p < .001). Individual Factors were negatively correlated with
Negative Spillover (r = -.506, p < .001) and Mental Illness (r = -.694, p < .001),
Negative Spillover with Positive Workplace Factors (r = -.463) and Overall Well-
Being (r = -.529, p < .001), and Mental Illness with Positive Workplace Factors (r = -
.306, p < .001) and Overall. Well-Being (r = -.602, p < .001).
In addition, there are the correlations between the measurement errors that
indicate the relationships over and above those evident through the latent factors.
Like the Well-Being model, but unlike the Mental Distress model, there were few of
these relationships which would indicate that in the Well-Being –Mental Health
model, the latent factors capture the majority of the underlying relationships. In the
Well-Being - Mental Health model, there were again positive correlations between
stress and anxiety (r = .328, p < .001) and between stress and negative work-to-
family spillover (r =.357, p < .001), similar to the Mental Distress model. The link

297
between dispositional optimism and stress (r = .119, p = .015) also appeared again in
the present model. There was a positive correlation between skill discretion and
negative work-to family spillover (r = .244, p < .001) and stress (r = .190, p < .001).
3.5.6 Factor score weights for the Well-Being – Mental Health model
From the CFA, the main relationships through the latent factors can be seen,
as well as the addition linkages between the indicator variables. The two highest
factor score weights for each new, observed variable are highlighted in bold in Table
3.4. For Positive Workplace Factors (PWF), Negative Spillover (NSP), Overall Well-
Being (OWB) and Mental Illness (MI), the two highest contributors for each
composite variable were from observed variables for the corresponding latent
variable in the CFA, for example, skill discretion and job autonomy for the Positive
Workplace Factors composite variable. For the Individual Factors (IF) composite
variable, the contributions were more varied. The highest contributors were
dispositional optimism and psychological well-being with less weight given again to
coping self-efficacy. This was a similar to the Well-Being and the Mental Distress
models, which may indicate that whether person views themselves optimistically or
competently is linked to their level of well-being or mental illness.
3.5.7 Confirmatory factor analysis for the Work Engagement model, based on the
scales of burnout and work engagement
Following the success of the early SEMs and the CFAs for the Well-Being,
Mental Distress, and Well-Being-Mental Health models, it was expected that a CFA
with Burnout and Work Engagement as the outcomes would have similar acceptable
fit as the other models with minimal additional pathways. However, to achieve a
reasonable fit of the CFA (i.e. X2/df <3 and RMSEA ≤ .08), based on the five latent
factors of Individual Factors, Positive Workplace Factors, Negative Spillover,

298
Table 3.4
Factor Score weights for composite variables for the Well-Being – Mental Health
model
Weighted contribution of observed variables to each
Composite variable
Observed variable IFwbmha PWFwbmh
a NSPwbmh
a OWBwbmh
a MIwbmh
a
Dispositional optimism .148 .013 .006 .200 -.081
Coping self-efficacy .031 .003 .001 .043 -.011
Skill discretion .015 .225 -.053 .071 -.034
Autonomy .016 .323 -.028 .087 .023
Affective Commitment .006 .118 -.010 .032 .008
Neg WF spillover .031 -.107 .215 -.043 .032
Neg FW spillover .009 -.038 .209 -.045 .146
Psychological well-being .110 .037 -.014 .401 -.020
Life satisfaction .106 .035 -.013 .385 -.019
Depression -.063 .020 .095 -.042 .519
Anxiety -.003 .008 .028 .000 .083
Stress -.039 -.007 -.007 -.031 .156 Note.
a IFwbmh, PWFwbmh, NSPwbmh, OWBwbmh, MIwbmh are the Individual Factors, Positive
Workplace Factors, Negative Spillover, Overall Well-Being and Mental Illness, respectively, for the
Well-Being-Mental Health longitudinal model
Note. Two highest factor score weights for each composite variable are shown in bold.
Burnout and Work Engagement, it was necessary to add correlations between nearly
all of the errors of the observed variables (shown in Appendix I, Figure I.4). This
result indicated that the latent factors, as drawn, could not provide a satisfactory
explanation of the data and that the CFA represented a serious misspecification of the
data. As Individual Factors, Positive Workplace Factors and Negative Spillover were

299
not problematic in the previous CFAs, it was necessary to begin with a CFA that
examined the relationships between Burnout and Work Engagement, without the
other variables, to clarify the underlying relationships. There has been discussion
among researchers as to whether Burnout and Work Engagement are best represented
as one factor, with burnout as the loss of work engagement (for example, Maslach,
1993; Pines, 1993) or as two factors, with Burnout and Work Engagement as related
but distinct factors, (for example, Schaufeli et al., 2002; Schaufeli et al., 2008). Both
scenarios were considered in turn, first the one-factor, then second, the two factor
CFA to understand the constructs.
3.5.8 CFA for Burnout and Engagement alone
3.5.8.1 One-factor CFA. First, Burnout and Work Engagement were
considered as a single latent factor, to be called „Work Engagement‟. This
represented burnout and work engagement as a continuum of motivational-affective
responses to the workplace and is shown in Appendix I, Figure I.5. Modest fit was
achieved for this CFA with all six components (exhaustion, cynicism and
professional efficacy from Burnout and work vigour, work dedication and work
absorption from Work Engagement), X2/df = 3.430, CFI = .990, RMSEA = .073,
(90% CI = .037-.112). However, examination of the model found that the squared
multiple correlation for exhaustion was only .13, indicating that the Work
Engagement latent variable accounted for only 13% of the variance of exhaustion.
Such a low figure was much less that the level (.30) of an acceptable indicator
variable (Holmes-Smith et al., 2006), and would suggest that exhaustion was a poor
representative of Work Engagement, when seen as the combination of the scales of
both Burnout and Work Engagement.
Therefore, a single-factor CFA for the latent variable Work Engagement,

300
with the five indicator variables (without exhaustion) was conducted and is shown in
Appendix I, Figure I.6. This was a well-fitting model, X2/df = .933, CFI = 1.000,
RMSEA = .000 (90% CI = .000- .077). In addition to the relationships through the
latent factors, there were the correlations between the measurement errors for the
indicator variables. There was a positive correlation between work absorption and
cynicism (r = .52, p < .001) and a negative correlation between work absorption and
professional efficacy (r = -.19, p < .001).
3.5.8.2 Two factor CFA. When the CFA for the two factors, Burnout and
Work Engagement was considered, the fit was unacceptable, X2/df = 17.656, CFI =
.933, RMSEA = .190, 90% CI = .157 - .226. This CFA is shown in Appendix I,
Figure I.7. Examination of the model however showed that fit could not be improved
by using the Modification Indices and the statistical significance of paths. Any
attempt to respecify the model to improve fit lead to an inadmissible result, as the
correlation between burnout and work engagement was greater than 1 (r = -1.003).
Further, the covariance matrix was non-positive definite, i.e. that some of the
covariances in the matrix were negative, rather than all covariances being positive.
Non-positive definite covariance matrices can be the result of linear dependence
between variables, such that two variables are perfectly correlated. A solution would
be to remove one of the variables, as the inadmissible result implies that there is
redundant information in the calculations of the CFA (Holmes-Smith et al., 2006;
Schmacker & Lomax, 2004).
To further try to understand the factorial structure of burnout and work
engagement, a second, two factor CFA was then conducted. Following the
suggestions of Schaufeli et al. (2002), the factors were rearranged. The first factor
had the „core‟ features of burnout, exhaustion and cynicism, and the second factor

301
had the other four components of work vigour, work dedication, work vigour and
professional efficacy, as shown in Appendix I, Figure I.8. However, in this form, the
result was an inadmissible solution, as the covariance matrix was again non-positive
definite. These results indicated that in data for the current thesis, burnout and work
engagement can only be represented as one factor, rather than as two separate and
related factors. This single factor was called Work Engagement and was used in the
following analyses of the larger Work Engagement model.
3.5.9 Confirmatory Factor Analysis for the Work Engagement model
The CFA of the larger Work Engagement model with the five latent
variables, Individual Factors, Positive Workplace Factors, Negative Spillover and
Work Engagement, was again conducted. However, the process of fitting the model
to the data found that early solutions had inadequate fit (X2/df = 3.733, CFI = .948,
RMSEA = .077 (90% CI = .064 – .090)). Using the Modification Indices, the fit was
considerably improved by removing one of the proposed components of Work
Engagement, work vigour. It is likely that this could indicate that an individual‟s
energetic attitudes toward work, captured by work vigour, are explained elsewhere in
the CFA. The fit indices of the CFA for the Work Engagement model were
acceptable, X2/df = 2.608, CFI = .971, RMSEA = .059 (90% CI = .044 - .075), with
the CFA shown in Appendix I, Figure I.9.
The indicator variables load satisfactorily on each of the latent variables, as
shown in the Appendix (Table I.7), with the least being negative work-to-family
spillover (β = .534, p < .001) and the highest loadings for work dedication (β = .889,
p < .001), cynicism (β = -.788) and coping self-efficacy (β = .752, p <.001). The
squared multiple correlations show that the indicator variables are acceptable
representatives for the latent variables, although a significant pathway, negative

302
work-to-family spillover was slightly below the acceptable cut-off (squared multiple
correlation = .285). The full list of beta weights and correlations were given in the
Appendix I, Tables I.7 and I.8. The latent factors were correlated with each other in
the expected directions. Individual Factors was positively correlated to Positive
Workplace Factors (r = .458, p < .001) and Work Engagement (r = .480, p < .001),
Positive Workplace Factors to Work Engagement (r = .912, p < .001) and Negative
Spillover was negatively correlated to Individual Factors (r = -.443, p < .001),
Positive Workplace Factors (r = -.400) and Work Engagement (r = -.421, p < .001).
In addition to the relationships through the latent factors, additional paths
were present in the CFA. Skill discretion and work dedication were positively
correlated (r = .519, p < .001), as are negative work-to-family spillover and cynicism
(r = .327, p < .001). Affective commitment and cynicism were negatively correlated
(r = -.242, p <.001), work absorption is positively correlated with cynicism (r = .378,
p < .001) and with negative work-to- family spillover (r = .257, p < .001). Skill
discretion is also positively correlated to negative work-to-family spillover (r = .150,
p = .001).
3.5.10 Factor score weights for the Work Engagement model
The factor score weights are shown in Table 3.5 and illustrate the balance of
the relationships explored in the Work Engagement CFA, with the two highest factor
score weights highlighted in bold in Table 3.5. For Negative Spillover (NSP) and
Work Engagement (WE), the two highest contributors for each composite variable
are from the indicator variables for the corresponding latent variable, for example,
for Negative Spillover, negative work-family spillover and negative family- work
spillover and for Work Engagement, work dedication and cynicism. For Individual
Factors (IF) and Positive Workplace Factors (PWF), the contributions were more

303
Table 3.5
Factor Score weights for composite variables for the Work Engagement model
Weighted contribution of observed variables to each
Composite variable
Observed variable IFwaa PWFwa
a NSPwa
a WEwa
a
Dispositional optimism .279 .019 -.022 .021
Coping self-efficacy .053 .003 -.004 .004
Skill discretion .006 .126 -.021 -.038
Autonomy .015 .165 -.007 .096
Affective Commitment .006 .083 -.010 .014
Neg Work-Family spillover -.034 -.023 .162 .022
Neg Family-Work spillover -.072 -.025 .316 -.047
Work dedication .043 .151 -.016 .419
Work absorption .030 .132 -.039 .207
Professional efficacy .015 .081 -.010 .122
Cynicism -.023 -.140 -.020 -.266
Note. a IFwa, PWFwa, NSPwa, WEwa are the composite variables, Individual Factors, Positive
Workplace Factors, Negative Spillover and work engagement, respectively used in the longitudinal
models.
Note. The highest factor score weights for each composite variable are shown in bold.
varied. For Individual Factors, the highest raw contribution came from dispositional
optimism, negative family-work spillover and coping self-efficacy. For Positive
Workplace Factors, the highest contributors were job autonomy and work dedication,
followed by work absorption and skill discretion.
3.5.11 Confirmatory factor analysis of the Integrated model
With the success of the CFAs for Well-Being, Mental Distress, Well-Being-
Mental Health and Work Engagement, the last step was to combine all the outcomes
304
into a complete, Integrated model. It is unusual to test a large number of positive and
negative outcomes together and this process provided a unique opportunity to
understand how the balance of positive and negative were experienced by the
individual. It was important to further explore whether there were redundancies or
overlaps among the indicator variables for the latent factors. As seen when Burnout
and Work Engagement, two measures can be used in separate situations but when
combined, there was considerable convergence toward an underlying construct.
Taking a broad approach to well-being and mental health outcomes brought a more
holistic understanding of working adults.
In the same manner as the previous CFAs, the CFA was drawn as six latent
factors: Individual Factors (as dispositional optimism and coping self-efficacy),
Positive Workplace Factors (as skill discretion, job autonomy, and affective
commitment), Negative Spillover (as negative work-to-family spillover and negative
family-to-work spillover), Overall Well-Being (as life satisfaction and psychological
well-being), Mental Illness (as depression, anxiety, and stress) and Work
Engagement (as work dedication, work absorption, professional efficacy, and
cynicism). Unfortunately, the first CFA with all the listed variables was not an
admissible solution. The covariance matrix was non-positive definite (i.e. there were
negative covariances in the matrix) which indicates that there are linear dependencies
among some or more of the variables (Holmes-Smith et al., 2006) and the CFA as
drawn was not usable.
It was necessary to rethink how the Integrated CFA would proceed. The
process of understanding Work Engagement, as outlined in the previous section, had
also given non-positive definite covariance matrices. Therefore, changes to Work
Engagement were chosen as the first and most likely solution to the problem. The

305
effect of removing the indicators of Work Engagement (work dedication, work
absorption, professional efficacy, and cynicism) were considered one at a time and it
was found that removing cynicism from the Work Engagement latent factor allowed
a solution to be calculated successfully. However, taking cynicism out of the
Integrated CFA provided another dilemma. If cynicism, which was a satisfactory
inclusion of the Work Engagement CFA was now redundant in the Integrated CFA,
should work vigour and exhaustion, which were excluded from the Work
Engagement CFA be reconsidered for this new Integrated CFA? As the purpose of
this Integrated model was to explore and understand how the many and diverse
constructs come together in previously untested combinations, it was decided to
revisit how work vigour and exhaustion related to the other variables.
First, work vigour was reconsidered. Work vigour could not be successfully
added to the Integrated CFA as part of the Work Engagement factor as the solution
was inadmissible (as a non-positive definite covariance matrix). As was the case in
the Work Engagement CFA, it is likely that the individual‟s vigour for their work is
captured elsewhere in the model. The hierarchical multiple regression for work
vigour, as shown in Chapter 2 found that all of the indicators of Individual Factors
and Positive Workplace Factors were significant predictors of work vigour, which
could explain how vigour was already being measured within the CFA. Second,
exhaustion was reconsidered. Emotional exhaustion proved to be an interesting
addition to the Integrated CFA. From the Modification Indices and standardized
regression weights, rather than loading onto the Work Engagement latent factor as
expected (and as found in the previous CFAs), in this Integrated CFA, exhaustion
loaded strongly on the Negative Spillover factor (β = .834, p < .001). This result
followed from the hierarchical multiple regressions in Chapter 2, where negative
306
work-to-family spillover was the strongest predictor of emotional exhaustion and
could indicate that emotional exhaustion is tied to a wider set of problems across the
work and family domains.
The final CFA for the Integrated model is shown in Appendix I, Figure I.11
and had the following fit indices, X2/df = 2.784, CFI = .954, RMSEA = .062 (90% CI
= .053 - .072). Even with the large number of latent and observed variables involved,
the final model was not overly complicated by correlations between the indicator
variables, which would show that the latent variables are reasonably explaining the
relationships between the variables.
In accordance with the previous models, the relationships between the latent
variables in the Integrated CFA were similar in their strength and direction.
Individual Factors were positively correlated with Positive Workplace Factors (r =
.425, p <.001), Overall Well-Being (r = .922, p < .001) and Work Engagement (r =
.429, p < .001). Positive Workplace Factors were positively related to Overall Well-
Being (r = .495, p < .001) and Work Engagement (r = .938, p < .001) and Overall
Well-Being and Work Engagement were positively correlated (r = .421, p < .001).
Negative Spillover was positively correlated with Mental Illness (r = .663, p < .001)
and negatively correlated with Individual Factors (r = -.471, p < .001), Positive
Workplace Factors (r = -.300, p < .001), Overall Well-Being (r = -. 506, p < .001)
and Work Engagement (r = -.366, p < .001). Lastly, Mental Illness was negatively
correlated with Individual Factors (r = -.685, p < .001), Positive Workplace Factors
(r = -.262, p < .001), Overall Well-Being (r = -.608, p < .001) and Work Engagement
(r = -.307, p <.001). The standardized regressions weights and the squared multiple
correlations and the correlations between the indicator variables are shown in the
Appendix I, Tables I.9 and I.10.

307
The indicator variables loaded satisfactorily on the latent variables, with the
highest being work dedication (β=.982, p < .001), depression (β = 880, p < .001), and
psychological well-being (β = .858, p < .001). Whilst some of indicator variables had
beta weights below the cut-off for acceptable indicators (β < .55, Holmes-Smith et
al., 2006), the paths were significant and were retained. These indicator variables
were job autonomy (β = .513 p < .001), negative family-to-work spillover (β = .525 p
< .001), and professional efficacy (β = .532, p < .001). Adding to the relationships
between the latent variables were the direct correlations between the indicator
variables, which were the relationships in excess those given by the latent factors. As
in the Work Engagement and the Well Being-Mental Health CFAs, stress and
anxiety were positively correlated (r = .325, p < .001) as were work absorption and
work-to-family spillover (r = .154, p = .002). Affective commitment and exhaustion
were negative correlated (r = -.321, p < .001). The negative work-to-family spillover
and stress were positively correlated (r = .338, p < .001), as previously found in the
Mental Distress and Well-Being-Mental Health models. Job autonomy and
professional efficacy were positive correlated (r = .193, p < .001), as were
professional efficacy and psychological well-being (r = .227, p < .001).
In summary, all of the CFAs showed that individuals with more positive
views of the future and greater personal effectiveness were likely to feel they had
greater control and creativity in their work, felt more attached to their work, had
fewer problems that spread across their lives, felt greater satisfaction and purpose in
their lives, with fewer mental health concerns, and felt zest, focus and competence
about their work, which was in line with the findings of the multiple regressions
outlined in Chapter 2. The additional pathways added greater understanding of the
nuances of the individual‟s experiences.

308
3.5.12 Factor score weights for the Integrated model
The factor score weights for the Integrated model are shown in Table 3.6 and
indicate the balance of the relationships found in the CFA and the weighted
contribution of each indicator variable to the composite variables to be used in the
longitudinal model. There were many similarities to the previous CFAs, which was
to be expected as the Integrated CFA was the combination of those CFAs. From the
CFA, the main relationships through the latent factors can be seen, as well as the
addition linkages between the indicator variables. The two highest factor score
weights were highlighted in bold in Table 3.6. For Negative Spillover (NSP), Overall
Well-Being (OWB) and Mental Illness (MI), the two highest contributors for each
composite variable were from observed variables for the corresponding latent
variable in the CFA. For example, negative work-to-family spillover and exhaustion
for Negative Spillover and psychological well-being and life satisfaction for Overall
Well-Being.
For the Individual Factors (IF), Positive Workplace Factors (PWF) and Work
Engagement (WE) composite variables, the contributions were more varied. For
Individual Factors, the highest raw contributors were dispositional optimism,
psychological well-being and life satisfaction, with lesser weighting from coping
self-efficacy. As in the Work Engagement model, both Positive Workplace Factors
and Work Well-Being had the highest raw contributors of work dedication and skill
discretion, although at different levels as shown in Table 3.6. Work Engagement was
again overwhelmingly composed of the indicator variable, work dedication rather
than skill discretion. For Positive Workplace Factors, the contributions were from
work dedication and skill discretion, although this was not as disparate. As in the
previous models, keeping the composite variables separate allowed the conditions of

309
a positive workplace and work well-being to be studied separately to understand the
processes involved.
Table 3.6
Factor score weights for the composite variables for the Integrated model
Weighted contribution of observed variables to each
Composite variable
Observed variable IFcma
PWFcma NSPcm
a OWBcm
a MIcm
a WEcm
a
Dispositional optimism .146 -.015 .003 .196 -.055 .006
Coping self-efficacy .031 -.003 .001 .042 -.012 .001
Skill discretion -.019 .166 .005 .104 .016 .052
Job autonomy -.002 .076 .002 .075 .006 .017
Affective commitment -.005 .059 .054 .022 .032 .016
Negative WF spillover .027 .001 .239 -.051 -.026 -.018
Negative FW spillover .003 .004 .097 -.025 .050 -.003
Exhaustion .004 .036 .237 -.045 .124 .000
Psychological well-being .116 .046 -.013 .405 -.026 -.004
Life satisfaction .108 .043 -.012 .372 -.024 .001
Depression -.062 .013 .050 -.049 .488 -.003
Anxiety -.010 .002 .022 -.012 .086 -.001
Stress -.025 .004 -.021 -.008 .166 .002
Work dedication .078 .533 -.041 .023 -.032 .875
Work absorption .001 .022 -.026 .006 .001 .038
Professional efficacy -.040 -.012 .003 -.167 .007 .033 Note.
a IFcm, PWFcm, NSPcm, OWBcm, MIcm, and WEcm are the composite variables, Individual
Factors, Positive Workplace Factors, Negative Spillover, Overall Well-Being, Mental Illness and
Work Engagement, respectively, used in the longitudinal Integrated model
Note. Two highest factor score weights for each composite variable are shown in bold.

310
3.6 Comparing the longitudinal models
3.6.1 Competing sets of longitudinal models
The final part of the analyses was the longitudinal modelling, which will
examine the relationships between the variables in several ways: first, by testing the
strength of the synchronous correlations, as the relationships between variables at
each measurement time; second, as the auto-lagged relationships within each variable
across time; and third, as the cross-lagged relationships between variables across
time. The effect of concurrent functioning was captured by the synchronous
correlations and was seen in the previous section on the CFAs for each model,
representing the individual‟s here-and-now. The long term stability and persistence
of each part of the model was seen in the auto-lagged paths, which showed how
previous levels of each variable influence the current level of the same variables. As
such, this stability can show if, for example, well-being in the near and/or distant past
can influence current levels of well-being. Model A gave the fit of these first two
pathways. The last component to be tested was the influence of the cross-lagged
paths. These were the relationships between the variables over time, for example,
indicating the influence of well-being at one time on the level of spillover at the next
time. Models B and C tested the changes to model fit due to the addition of these
paths, whilst Model D combined all the hypothesized relationships.
Briefly to recap on how the relationships are drawn in the models, as was
shown in Figure 3.3 earlier in the chapter and shown at the start of Appendix K.
Correlations between the measurement errors at each time period (synchronous
correlations), single headed (i.e. causal) arrows between the same variable from
Time 1 to Time 2, Time 2 to Time 3, and Time 1 to Time 3 (auto-lagged paths) and
single headed (i.e. causal) arrows between variables from Time 1 to Time 2 and

311
Time 2 to Time 3 (cross-lagged paths). The cross-lagged paths in the Causality
models were from the „predictors‟, Individual Factors, Positive Workplace Factors
and Negative Spillover to the „outcomes‟, Overall Well-Being, Work Well-Being,
Mental Illness, Burnout, and Work engagement, as appropriate for the particular
model being considered. In the Reverse Causality models, the cross-lagged paths
were from the „outcomes‟, Overall Well-Being, Work Well-Being, Mental Illness,
Burnout and Work Engagement, as appropriate, to the „predictors‟, Individual
Factors, Positive Workplace Factors and Negative Spillover.
The initial longitudinal modelling for the Well-Being model considered only
the Time 1 to Time 2 and Time 2 to Time 3 auto-lagged relationships (for example,
IFwb1 to IFwb2 and IFwb2 to IFwb3). The fit indices for all the competing models
(i.e. Models A to D) for the Well-Being model were not acceptable and none of the
models could be supported, as shown in Table 3.7 in the „Without‟ column. The
inclusion of the Time 1 to Time 3 auto-lagged relationships improved the fit of all of
the models (models A to D) and the models now had acceptable fit, shown in the
„With‟ column of Table 3.7 Therefore, all Time 1 to Time 3 auto-lagged paths
Table 3.7
Improvement in the fit of non-nested models in the Well-Being model by including the
auto-lagged pathways from Time 1 to Time 3
Stability (A) Causality (B) Rev Causality (C) Reciprocal (D)
Model Fit Without With Without With Without With Without With
X2/df 4.754 2.648 4.199 1.265 4.390 1.457 4.848 1.202
RMSEA .142 .091 .132 .037 .135 .048 .144 .032 Note. „Without‟ models do not include Time 1 to Time 3 auto-lagged paths; „With‟ models include
Time 1 to Time 3 auto-lagged paths.

312
were included in all subsequent models. However, when the cross-lagged paths were
added, only the Time 1 to Time 2 and Time 2 to Time 3 paths proved to be important
to the fit of the models. Across all the competing models (Models A to D), the Time
1 to Time 3 paths were non-significant and reduced the fit of the models. Therefore
the Time 1 to Time 3 cross-lagged paths were not included in any of the subsequent
models.
After the set of models (Models A to D) were compared, the next step was to
consider whether any of the auto-lagged or cross-lagged paths were trivial and did
not contribute to the fit of the models (designated as Model E). Rather than a
speculative exploration of the data, the rationale for the model trimming followed
from process of fitting the early SEMs. For example, Negative Spillover was not
included in the final model of positive outcomes in the early SEM, nor did Negative
Spillover have an influence on Overall Well-Being in the model with both positive
and negative outcomes of the Time 1 SEM. The central question for model trimming
is whether paths were redundant (i.e. not influential) and should not be included in
the longitudinal models. The decision was based on the standardized regression
weights (beta, β), the non-significance of the paths and improvements to the AIC, as
the AIC measures the best fit in a model using the least number of parameters. The
standardized regression weights can be taken as the effect size for a path, with β in
the range of .50 - .80 indicating a strong effect, whilst β < .20 indicating weak effect
sizes (Holmes-Smith et al., 2006). For model trimming in the following models, the
criteria for removing paths were set at β ≤ .10 where the paths were also highly non-
significant (p > .20). Consideration of fit and parsimony to ascertain if the deletion
has lowered values of the AIC was also important to the final inclusion or deletion of
a pathway. The combination of minimal variance and non-significance of a path is

313
necessary to prevent to removal of paths with true non-zero causal effects that were
non-significant in this model, but may be significant in other, similar samples (Kline,
2006). Therefore, Type II errors can be avoided, as can overfitting of the model to
this particular data set, which would avoid a Type I error. Replication of the models
in other samples should be undertaken to confirm the results found in the current
thesis.
The results for the longitudinal models are reported in two steps. First, the fit
indices and measures of parsimony are given for each of the outcomes models, in the
following order: Well-Being, Mental Distress, Well-Being-Mental Health, Work
Engagement, and the Integrated model, showing the best fitting of the set of models
(A to E) for each of these longitudinal models (Tables 3.8 to 3.12). The betas weights
of the best fitting models is shown in Table 3.13. Rather than place all of the results
here in the chapter, only the important results will be shown in the chapter with the
supplementary results given in Appendix J. Tables J.1 to J. 5 list the means, standard
deviations and ranges, the correlations between the composite variables for each
longitudinal models are shown in Tables J.6 to J.10. Table J.11 shows the X2 and df
for each competing set of models (A to E) for each of the longitudinal models.
Figures J.1 to J.5 graphically show the sets of models (A to E) that were tested for
each longitudinal model. Tables J.12 to J.16 show the synchronous correlations of
the best fitting longitudinal models and Tables J.17 to J.21 give the beta weights of
the paths in the best fitting longitudinal models.
3.6.2 The longitudinal Well-Being Model
The competing set of models that have been compared for the Well-Being
model are shown in Appendix J, Figure J.1, with the best fitting model shown here in
Figure 3.4. The results of the competing set of models in the Well-Being model are

314
shown in Table 3.8, with the Chi-Squared statistics (and significance levels) and
degrees of freedom for the models shown in Appendix J, Table J.11. It should be
noted that the Comparative Fit Index (CFI) is satisfactory (CFI > .95) for each model
considered within the Well-Being model and did not provide a distinct difference
between models. There were differences between the Normed Chi-Squared, RMSEA
and AIC which were used to determine the best fitting model. The least well fitted
model was the Stability model (X2/df = 2.648), with the Reverse Causality improving
the fit (X2/df = 1.457). The Causality and Reciprocal models were about equal,
balancing the lower AIC of the Causality (AIC = 135.43) with the better Normed
Chi-squared (X2/df = 1.202), whilst RMSEA was equivalent for both models. For
Model E, all the non-significant pathways in the Reciprocal model were considered
for trimming, using the previously noted criteria (minimal β, p > .20). Interestingly,
removing all non-significant pathways decreased the fit of the model dramatically
(Normed Chi-Squared rose to 4.164, indicating very poor fit). This change indicated
that there were true non-zero causal pathways in this model that, whilst not
significant in this particular sample, should be included to avoid Type II errors
(Kline, 2006).After removing the trivial pathways, Model E, the Trimmed Reciprocal
was the best fitting model with the lowest Normed Chi-Squared and RMSEA and
with an AIC lower than the Causality model and therefore represents an
improvement on both the Causality and the Reciprocal models. The least value of the
Expected Cross-Validation Index (ECVI) (0.66 for E), in comparison to the other
models (A to D) further indicated that the Trimmed Reciprocal model, E was also the
most likely of the set of models to be validated in another sample of similar
participants. Figure 3.4 shows the Trimmed Reciprocal model. The correlations, the
auto-lagged and cross-lagged paths (shown in Appendix J, Tables J.12 and J.17) are

315
IFwb2 PWFwb2 WWBwb2 OWBwb2
IFwb3 PWFwb3 WWBwb3 OWBwb3
e71
e8
e9 e10 e11 e12
1 1 1 1
e131
e141
IFwb1 PWFwb1 WWBwb1 OWBwb1
e151
e161
e171
e18
1
1
Table 3.8
Results of longitudinal model testing for Well-Being Model
Model X2/df CFI RMSEA (90%CI) AIC ECVI (90%CI)
A Stability 2.648 .990 .091 (.069-.114) 179.34 0.91 (0.78-1.08)
B Causality 1.265 .999 .037 (.000-.070) 135.43 0.69 (0.65-0.79)
C Reverse Causality 1.457 .998 .048 (.000-.078) 140.79 0.72 (0.65-0.82)
D Reciprocal 1.202 .999 .032 (.000-.072) 140.03 0.71 (0.69-0.80)
E Trimmed 1.127 .999 .025 (.000-.062) 130.68 0.66 (0.65-0.76) Note. X
2/df – good fit in the range 1 < X
2/df < 2, close to 1 indicates good fit, <1 overfit; CFI
(Comparative Fit Index), good fit >.950; RMSEA (Root Mean Square Error of Approximation), good
fit if RMSEA < .050; 90%CI for RMSEA, range with lower end including .000 (indicates exact fit)
and upper range of < .08; AIC (Akaike‟s Information Criteria), lowest AIC is most parsimonious, AIC
of Saturated model = 156.00; ECVI (Expected Cross-Validation Index), lowest is most likely to be
replicated, ECVI of Saturated model = 0.79.
Figure 3.4 The best fitting model for the Well-Being model, E the Trimmed
Reciprocal Note. IF: Individual Factors; PWF Positive Workplace Factors; WWB: Work well-being, OWB:
Overall well-being; „wb‟ indicates composite variables of the Well-Being model; 1, 2, 3 indicate
Times 1, 2 and 3 respectively

316
discussed the following section with the standardized regression weights and
significance of the paths at the end of the fit of the longitudinal models.
3.6.3 The longitudinal Mental Distress model
The competing set of models that are compared in the Mental Distress model
are shown in the Appendix (Figure J.2), with the best fitting model shown in Figure
3.5 in this chapter. The results of the comparisons are shown in Table 3.9, with the
Chi-squared statistic (and significance levels) and the degrees of freedom for the
models in Appendix J, Table J.11. It should be noted that the Comparative Fit Index
(CFI) is satisfactory (CFI > .95) for each model considered within the Mental
Distress model and does not provide a distinct difference between models. There are
differences between the Normed Chi-Squared, RMSEA and AIC which will be used
to determine the best fitting model. As with the Well-Being model, the Stability
model is the least well fitting of the set (X2/df = 1.615), although the Stability model
would have acceptable fit if it were to be considered by itself. Whilst the Reverse
Causality model is an improvement on the Stability model (X2/df = 1.548), the AIC
is greater than the Stability model, indicating that the Stability model is more
parsimonious than the Reverse Causality. The Causality and Reciprocal models are
again ranked similarly, to balance the Causality model being more parsimonious
(AIC = 204.91) whilst the Reciprocal model has a slightly better Normed Chi-
squared (X2/df = 1.205) and RMSEA (RMSEA = .032, 90%CI = .000-.062). For
model E, the non-significant paths of the Reciprocal model that were considered for
trimming and using the same criteria (minimal β, p>.20) as the Well-Being model.
However, changes to the fit indices indicated that two paths (Mental Illness Time 2
MI2 Positive Workplace Factors Time 3, PWF3; and Mental Illness Time 2
MI2to Negative Spillover Time 3, NSP3) should be reinstated, despite small beta

317
IFmi1 PWFmi1 NegSp1 burnout1 MIllness1
IFmi2 PWFmi2 NegSp2 burnout2 MIllness2
IFmi3 PWFmi3 NegSp3 burnout3 MIllness3
e11
e21
e31
e41
e51
e61
e71
e81
e91
e101
e11 e12 e13 e14 e15
11 1 1 1
Table 3.9
Results of longitudinal model testing for Mental Distress Model
Model X2/df CFI RMSEA (90%CI) AIC ECVI (90%CI)
A. Stability 1.615 .995 .055 (.034-.075) 216.91 1.24 (1.10-1.42)
B. Causality 1.263 .998 .036 (.000-.061) 204.61 1.21 (1.02-1.26)
C. Reverse Causality 1.548 .996 .052 (.027-.074) 218.32 1.71 (1.06-1.32)
D. Reciprocal 1.205 .999 .032 (.000-.062) 211.37 1.07 (1.04-1.18)
E. Trimmed 1.079 1.000 .020 (.000-.053) 199.46 1.01 (1.00-1.12) Note. X
2/df – good fit in the range 2 < X
2/df > 1, close to 1 indicates good fit, <1 overfit; CFI
(comparative Fit Index), good fit >.950; RMSEA (Root Mean Square Error of Approximation), good
fit if RMSEA < .050; 90%CI for RMSEA, range with lower end including .000 (indicates exact fit)
and upper range of < .08; AIC (Akaike‟s Information Criteria), lowest AIC is most parsimonious, AIC
of Saturated model = 240.00; ECVI (Expected Cross-Validation Index), lowest is most likely to be
replicated, ECVI of Saturated model = 1.22.
Figure 3.5. The best fitting of Mental Distress model, E, the Trimmed Reciprocal Note. IF: Individual Factors; PWF: Positive Workplace Factors; NegSp: Negative Spillover; MIllness:
Mental illness; 1, 2, 3: Times 1, 2 and 3 respectively

318
weights and are included in the final results for the model. Inclusion of the paths
guards against a Type II error of ignoring meaningful, yet non-significant (in this
sample) paths (Kline, 2006). The Trimmed Reciprocal model, E, was an
improvement on both the Causality and the Reciprocal models, as the most
parsimonious (the lowest AIC (199.46)), perfect comparative fit (CFI = 1.00), with
the lowest RMSEA (RMSEA = .020, 90%CI = .000-.053) and with the lowest values
of the Expected Cross-Validation Index (ECVI) (1.01), the Trimmed model was the
most likely to be validated in another similar sample. Figure 3.5 shows the Trimmed
Reciprocal model, E. The correlations, the auto-lagged and cross-lagged paths
(shown in Appendix J, Tables J.13 and J.18), are discussed with the standardized
regression weights and significance of the paths, at the end of the fit of the
longitudinal models.
3.6.4 The longitudinal Well-Being – Mental Health model
The competing set of models that were compared for the Well-Being –Mental
Health model are shown in Appendix J, Figure J.3, with the best fitting model shown
in Figure 3.6 in this chapter. The results of the comparisons are shown in Table 3.10
with the Chi-Squared statistics (and significance levels) and the degrees of freedom
for the models shown in Appendix J, Table J.11. It should be noted that the
Comparative Fit Index (CFI) was again satisfactory (CFI > .95) for each model
considered within the Well-Being-Mental Health model and did not provide a
distinct difference between models. There were differences between the Normed
Chi-Squared, RMSEA and AIC which were used to determine the best fitting model.
As the Well-Being and Mental Distress models, the Stability model was the least
well-fitting of the set (X2/df = 2.187) with the Reverse Causality model improving fit
(X2/df = 1.639). Whereas in the Well-Being and Mental Distress models, the

319
Causality and Reciprocal models were very similar, in the Well-Being-Mental Health
model, the Reciprocal model had the better fit, with a lower Normed Chi-Square
(X2/df = 0.969), a perfect fit given by the point estimate for the RMSEA and close fit
given by the confidence interval (RMSEA = .000, 90%CI = .000-.049), and being
more parsimonious (AIC = 202.85) than the Causality model.
For Model E, all the non-significant pathways from the Reciprocal model
were considered for trimming, using the same criteria (minimal β, p >.20) for
removal of a path. Although the Normed chi-squared is less than 1 (X2/df = .896),
overfitting was not likely as paths have been removed from the model rather than
added to improve fit. The Trimmed Reciprocal was considered the best fitting and
most parsimonious model, with the RMSEA =.000 (90%CI = .000-.038), the AIC
(184.78) having the lowest value and the ECVI (.94) indicating that the Trimmed
model was the mostly likely to be replicated in another sample of similar
participants. Whilst including true non-zero paths that may be significant will avoid
Type II errors, removing the trivial paths will guard against Type I errors, and chance
associations that should be disregarded. Figure 3.6 shows the Trimmed Reciprocal
model, E. The relative importance of the correlations, the auto-lagged and cross-
lagged paths (shown in Appendix J, Tables J.14 and J.19) are discussed in the next
section on the standardized regression weights and significance of the paths, at the
end of the comparisons of longitudinal model fit.
3.6.5 The longitudinal Work Engagement model
The competing set of models that were compared for the Work Engagement
model are shown in Appendix J, Figure J.4, with the best fitting model shown here in
Figure 3.7. The results of the comparisons are shown in Table 3.11, with the Chi-
squared statistics (and significance levels) and degrees of freedom for the models

320
IFwbmh1 PWFwbmh1 NSpwbmh1 OWBwbmh1 MIwbmh1
IFwbmh2 PWFwbmh2 NSPwbmh2 OWBwbmh2 MIwbmh2
IFwbmh3 PWFwbmh3 NSPwbmh3 OWBwbmh3 MIwbmh3
e11
e21
e31
e41
e51
e61
e71
e81
e91
e101
e11 e12 e13 e14 e15
11111
Table 3.10
Results of longitudinal model testing for Well-Being-Mental Health models
Model X2/df CFI RMSEA (90%CI) AIC ECVI (90%CI)
A Stability 2.187 .988 .078 (.060-.096) 251.22 1.28 (1.13-1.46)
B Causality 1.298 .998 .039 (.000-.064) 206.32 1.05 (0.98-1.17)
C Reverse Causality 1.639 .995 .057 (.033-.079) 222.68 1.13 (1.03-1.27)
D Reciprocal 0.969 1.000 .000 (.000-.049) 202.85 1.03 (1.04-1.12)
E Trimmed 0.896 1.000 .000 (.000-.038) 184.78 0.94 (0.94-1.04) Note. X
2/df – good fit in the range 2 < X
2/df > 1, close to 1 indicates good fit, <1 possible overfit; CFI
(Comparative Fit Index), good fit >.950; RMSEA (Root Mean Square Error of Approximation), good
fit if RMSEA < .050; 90%CI for RMSEA, range with lower end including .000 (indicates exact fit)
and upper range of < .08; AIC (Akaike‟s Information Criteria), lowest AIC is most parsimonious, AIC
of Saturated model = 240.00; ECVI (Expected Cross-Validation Index), lowest is most likely to be
replicated, ECVI of Saturated model = 1.22.
Figure 3.6. The best fitting of the Well-Being-Mental Health model, E, the Trimmed
Reciprocal Note. IF: Individual Factors; PWF: Positive Workplace Factors; NSP: Negative Spillover; OWB:
Overall Well-being; MI: Mental illness; „wbmh‟: composite variables of Well-Being-Mental health
model; 1, 2, 3: Times 1, 2 and 3 respectively

321
shown in Appendix J, Table J.11. It should be noted that the Comparative Fit Index
(CFI) is again satisfactory (CFI > .95) for each model considered within the Work
Engagement model and does not provide a distinct difference between models. There
were differences between the Normed Chi- Squared, RMSEA and AIC which were
used to determine the best fitting model. As with the Well-Being, Mental Distress
and Well-Being-Mental Health, the Stability model of the Work Engagement model
was the least well-fitting of the set of models, although the Stability model could be
considered to be well-fitting in its own right (X2/df = 1.879). The Reverse Causality
had improved fit (X2/df = 1.593) and parsimony (AIC = 143.76) over the Stability
model, with the Reciprocal improving the fit and parsimony further. The Causality
model however, was the best fitting of the set of models (X2/df = 1.221, RMSEA =
.033, 90%CI = .000-.066).
However, examination of the standardized regression weights in the Causality
model found that several paths were highly non-significant and had negligible
standardized regression weights (for example, IFwa1 WEwa2, β = -.007, p = .708;
and NSPwa1 WEwa2, β = -.013, p = .437). Therefore, the process of model
trimming was undertaken to determine if fit could be improved by removing paths
such as these. As the Reciprocal model still represents good fit of the model and in
line with the other models previously considered, Model E is based on the Reciprocal
model. All the non-significant paths were considered for trimming, using the same
criteria for removal (minimal β, p > .20) as previously. The Trimmed Reciprocal
model had improved fit (X2/df = 1.141, RMSEA = .027, 90%CI = .000-.061) over
the Causality model and also better parsimony (AIC = 128.50) and with the lowest
ECVI (0.65), having the greater likelihood that the model would be replicated in
another similar group of participants. Figure 3.7 shows the Trimmed Reciprocal

322
IFwa1 PWFwa1 NSPwa1WEwa1
IFwa2 PWFwa2 NSPwa2 WEwa2
IFwa3 PWFwa3 NSPwa3 WEwa3
e11
e21
e31 e4
1
e51
e61
e71
e8
e9e10 e11 e12
11 1
1
1
Table 3.11
Results of longitudinal model testing for the Work Engagement model
Model X2/df CFI RMSEA (90%CI) AIC ECVI (90%CI)
A. Stability 1.879 .991 .067 (.042-.091) 151.64 0.77 (0.67-0.91)
B. Causality 1.221 .998 .033 (.000-.066) 132.62 0.67 (0.64-0.77)
C. Reverse Causality 1.593 .995 .055 (.022-.083) 143.76 0.73 (0.65-0.85)
D. Reciprocal 1.390 .997 .044 (.000-.078) 141.35 0.72 (0.67-0.82)
E. Trimmed 1.141 .999 .027 (.000-.061) 128.50 0.65 (0.63-0.75) Note. X
2/df – good fit in the range 2 < X
2/df > 1, close to 1 indicates good fit, <1 overfit; for CFI
(Comparative Fit Index), good fit >.950; for RMSEA (Root Mean Square Error of Approximation),
good fit if RMSEA < .050; 90%CI for RMSEA, range with lower end including .000 (indicates exact
fit) and upper range of < .08; AIC (Akaike‟s Information Criteria), lowest AIC is most parsimonious,
AIC of Saturated model = 156.00; ECVI (Expected Cross-Validation Index), lowest is most likely to
be replicated, ECVI of Saturated model = 0.79.
Figure 3.7. The best fitting of the Work Engagement model, the Trimmed Reciprocal Note. IF: Individual Factors; PWF: Positive Workplace Factors; NSP: Negative Spillover; WE: Work
Engagement ; „wa‟ composite variables of the Work Engagement model; 1, 2, 3: Times 1, 2, 3
respectively

323
model. Again, the correlations, the auto-lagged and cross-lagged paths (shown in
Appendix J, Tables J.15 and J.20) are reported in the next section on the standardized
regression weights and significance of the paths, at the end of the discussion of
longitudinal model fit.
3.6.6 The longitudinal Integrated model
The competing set of models that were compared for the Integrated model are
shown in Appendix J, Figure J.5, with the best fitting model shown here in Figure 3.8
in this chapter. The results of the comparisons are shown in Table 3.12, with the Chi-
squared statistics (and significance levels) and the degrees of freedom for the models
shown in Appendix J, Table J.11. As with the previous models, the Comparative Fit
Index (CFI) is satisfactory (CFI > .95) for each model considered within the Well-
Being model and did not provide a distinct difference between models. There were
differences between the Normed Chi-Squared, RMSEA and AIC which are used to
determine the best fitting model. As with the Well-Being, Mental Distress, Well-
Being-Mental Health and the Work Engagement model the Stability model of the
Integrated, model was the least well-fitting of the set of models (X2/df = 2.079),
although its fit would be still acceptable if considered alone. In a similar pattern to
the previous models, the Reverse Causality model had improved ft (X2/df = 1.680)
and parsimony (AIC = 318.97) whilst the Causality and the Reciprocal models could
be considered similar in terms of fit, with nearly matching Normed Chi-Squared
statistics (1.346 and 1.342, respectively) and estimates of RMSEA (both .042),
although the Causality model did have a lower AIC (294.90) than the Reciprocal
model (306.45).
For Model E, all the non-significant paths of the Reciprocal model were
considered for removal, using the same criteria as for the previous models (minimal

324
IFcm1 PWFcm1 NSPcm1 OWBcm1 MIcm1 WEcm1
IFcm2 PWFcm2 NSPcm2 OWBcm2 MIcm2 WEcm2
IFcm3 PWFcm3 NSPcm3 OWBcm3 MIcm3 WEcm3
e11
e21
e31
e41
e51
e61
e71
e81
e91
e101
e111
e121
e13 e14 e15 e16 e17 e18
1 1 1 1 1 1
Table 3.12
Results of longitudinal model testing for the Integrated model
Model X2/df CFI RMSEA (90%CI) AIC ECVI (90%CI)
A. Stability 2.079 .988 .074 (.059-.089) 349.07 1.77 (1.59-1.99)
B. Causality 1.346 .997 .042 (.015-.062) 294.90 1.50 (1.39-1.65)
C. Reverse Causality 1.680 .994 .059 (.040-.077) 318.97 1.62 (1.49-1.79)
D. Reciprocal 1.342 .998 .042 (.005-.065) 306.45 1.56 (1.46-1.69)
E. Trimmed 1.269 .998 .037 (.000-.058) 287.91 1.46 (1.36-1.61) Note. X
2/df – good fit in the range 2 < X
2/df > 1, close to 1 indicates good fit, <1 overfit; CFI
(Comparative Fit Index), good fit >.950; RMSEA (Root Mean Square Error of Approximation), good
fit if RMSEA < .050; 90%CI for RMSEA, range with lower end including .000 (indicates exact fit)
and upper range of < .08; AIC (Akaike‟s Information Criteria), lowest AIC is most parsimonious, AIC
of saturated model = 342.00; ECVI (Expected Cross-Validation Index), lowest is most likely to be
replicated, ECVI of Saturated model = 1.74.
Figure 3.8. The best fitting of the Integrated models, the Trimmed Reciprocal model Note. IF: Individual Factors; PWF: Positive Workplace Factors; NSP: Negative Spillover; OWB:
Overall Well-Being; MI: Mental Illness; WE: Work Engagement; „cm‟ composite variables from the
Integrated model; 1,2,3: Times 1, 2 and 3 respectively

325
β, p >.20). The Trimmed Reciprocal model had improved fit (X2/df = 1.269,
RMSEA= .037, 90%CI = .000-.058) and parsimony (AIC = 287.91) over the
Causality and the Reciprocal models, and with the lowest ECVI (1.46), the Trimmed
Reciprocal model was the most likely to be replicated in a similar sample of
participants. Figure 3.8 showed the Trimmed Reciprocal model. The correlations, the
auto-lagged and cross-lagged paths (shown in Appendix J, Tables J.16 and J.21) are
reported in the next section on the standardized regression weights and significance
of the paths.
3.6.7 Synchronous correlations, standardized regression weights and significance of
paths in the longitudinal models
In the previous section, the Trimmed Reciprocal models were shown to
represent the best fit in each of the models examined. Removing trivial pathways has
allowed the true non-zero paths to be seen and this next section examined the relative
importance of paths within the models, comparing the cross-sectional, auto-lagged
and cross-lagged paths.
First, the synchronous correlations between the composite variables at each
time are shown in Appendix J, Tables J.12 to J.16. In summary, for all models, the
correlations were in the expected directions and mostly highly significant. Not
unexpectedly, where „predictor‟ and „outcome‟ variables were closely aligned in the
factor score weights and the calculations of the composite variables, for example,
between Individual Factor and Overall Well-Being, there were very strong
correlations between the composite variables. However, collapsing the predictor and
outcomes merely collapsed the processes into one variable, which did not allow any
understanding of how these variables may influence each other. In the Well-Being
model, the correlations range upwards from r = .216, p < .001 (OWBwb3

326
↔WWBwb3) and the strongest associations were found between Individual Factors
and Overall Well-Being and between Positive Workplace Factors and Work Well-
Being (r‟s > .80, p < .001) at each time period. In the Mental Distress model,
correlations range upwards from r = -.229, p < .001 (PWFmi2 ↔ MImi2) and the
strongest correlations were found between Positive Workplace Factors and Burnout
(r‟s > -.90, p < .001) and between Individual Factors and Mental Illness (r‟s > .74, p
< .001) at each time period. In the Well-Being - Mental Health model, correlations
range upward from r = -.236, p < .001 (PWFwbmh3 ↔ MIwbmh3) and r = -.260, p <
.001 (PWFwbmh2 ↔ MIwbmh2). The strongest correlations were found between
Individual Factors and Overall Well-Being (r‟s > .93, p < .001), Individual Factors
and Mental Illness (r‟s > .72, p < .001) and Negative Spillover and Mental Illness (r‟s
> .78, p < .001), with most correlations ranging between r = .40 and .70. In the Work
Engagement model, the correlations range upward from r = -.294, p < .001 (PWFwa3
↔ NSPwa3) and r = -.302, p < .001 (PWFwa2 ↔ NSPwa2). The strongest
correlation was between Positive Workplace Factors and Work Engagement (r‟s >
.93, p < .001) and the balance of the associations range between r = .40 and .60.
Unlike the previous models, the Integrated model had correlations that were
weaker, although all correlations were still significant. For example, the correlations
between Positive Workplace Factors and Mental Illness at Time 2 (r = -.188, p
=.021) and at Time 3 (r = -.187, p = .010) were the smallest within the model. There
were similar correlations, although with greater significance, between Work
Engagement and Mental Illness at Time 2 (r = -.203, p = .005) and at Time 3 (r = -
.230, p = .002) and between Positive Workplace Factors and Negative Spillover at
Time 2 (r = -.208, p = .004). The strongest correlations were between Positive
Workplace Factors and Work Engagement (r‟s > .90, p < .001) and Individual

327
Factors an Overall Well-Being (r‟s > .90, p < .001) at each time, whilst the
correlations at each time between Individual Factors and Mental Illness and Negative
Spillover and Mental Illness ranged from r = .60 to .80.
Based on Cohen‟s (1988) estimation of the effect size of correlations, r >
.100 is a small effect size, r > .243 is a medium effect size, and r > .371 is a large
effect size. From the correlations described here, with the exception of the lowest
correlations in each model (which are medium-small), all correlations can be classed
as having moderate to very strong effect sizes. In the context of understanding the
dynamic relationships between the individual, their workplace and their well-being,
mental health and work engagement, these correlations indicated that the cross-
sectional component, which captured how the individual feels on the day, was
important to understanding the models.
Whilst the correlations are reasonably straight forward, there was a challenge
to describe and discuss the standardized regression weights of the five longitudinal
models in this section in a clear and concise manner. Adding numbers to the figures
of the best fitting models can overload the diagrams beyond reasonable levels. To
overcome these difficulties, the standardized regression weights and their
significance levels were presented in tables, which were given separately for each
model in Appendix J Tables J.17 to J.21. Rather than examine each model separately,
however, the tables of standardized regression weights for the paths in each of the
five models have been combined and the beta weights have been colour coded to
reflect their effect sizes to gauge the relative importance of the auto-lagged and
cross-lagged paths. As a general conclusion, the auto-lagged paths within each model
have greater beta weights than the cross-lagged paths, indicating that the stability of
a variable over time is important. Given also that the fit of the models was improved

328
by adding the auto-lagged Time 1 to Time 3 paths, it can be seen that variables at
Time 3 were dependent not only on the recent past (i.e. Time 2) but on levels of
those variable in the more distant past (i.e. Time 1) as well. Whilst the cross-lagged
paths had smaller beta weights than the auto-lagged paths, these paths were crucial to
models because it is the addition of these paths that provided the best fit of the
models in all cases.
For the following discussion on the beta weights of paths between variables,
it was possible to state the effect size of the standardized paths between variables (as
the standardized direct effects) and standardized regression weights between
variables were equal. For example, a 1 standard deviation increase in variable A (at
the head of the causal arrow) lead to a change in variable B (the end of the causal
arrow) represented by the effect size, which was expressed as a proportion of a
standard deviation (Arbuckle, 2006). For example, in the Well-Being model, the
direct effect of IFwb1 on IWwb2 is .685, such that as IFwb1 went up by 1 standard
deviation, IFwb2 increased by .685 standard deviations. The equivalent standardized
regression weight of the direct causal path for IFwb1 to IFwb2 was β = .685, p <
.001.
Interpretation of these standardized effect sizes is done was on similar metric
as effect sizes which were based on the standardized difference between group
means, that of small (d = .20), medium (d = .50) and large (d = .80) effect sizes
(Cohen, 1988). The current thesis will follow the rules given by Holmes-Smith et al.
(2006), such that the effect size of beta weights, β < .20, are weak effects, β weights
from .20 to .30 are mild effects, β weights from .30 to .50 are moderately strong
effects, β weights from .50 to .80 are strong effects, whilst β weights over .80 are
considered to be very strong effects. To make the varying effect sizes easier to see in

329
a large table, rather than just a collection of numbers, the beta weights have been
colour coded, with grey for weak effects, green for mild effects, pink for moderately
strong effects and red for strong and very strong effect sizes. The increasing intensity
of the colour is designed to highlight the increasing strength, and therefore
importance, of the pathways.
To read Table 3.13, several points need to be considered. First, the Time 2
and Time 3 variables for all models have been collapsed into single columns,
labelled for example „IFxx2‟ and „IFxx3‟ for Individual Factors. The purpose of this
arrangement was to allow the longitudinal effect in one model to be compared with
another. For example, was the effect of the Individual Factor on Mental Illness
similar in the different models in which both appear? By collapsing the Mental
Illness variables at Time 2 in each model into one column, it can be seen that
Individual Factors at Time 1 reduced Mental Illness at Time 2 in the Mental Distress
model (β = -.162, p = .029), in the Well-Being-Mental Health model (β = -.213, p <
.001) and in the Integrated model (β = -.221, p =.001) and with similar results from
Time 2 to Time 3. This combination allowed the conclusion to be drawn that the
individual who had higher levels of the Individual Factor would generally have lower
levels of Mental Illness at a later time.
Second, for the outcome columns WExx2 and WExx3, these columns
collapse Work Well-Being, Work Engagement and Burnout from each of the
different models and can be distinguished by (W), (E) or (B) respectively after the
beta weights. The separation into rows, of course, allowed the models to be regarded
separately. As noted in the CFAs in the previous section, Work Well-Being, Work
Engagement and Burnout are similar constructs, with opposite loadings (Work Well-
Being and Work Engagement – positive; Burnout – negative) and are based on

330
highly similar scales.
Third, the table was arranged such that the auto-lagged (those paths between
the same variable over time) are shown on the leading diagonal (top left to bottom
right of the table) with the cross-lagged causality paths in the upper triangular matrix
(top right triangle of the table) and the cross-lagged reverse causality paths are in the
lower triangular matrix (bottom left triangle of the table).
3.4.8 Individual Factors in the longitudinal models
The auto-lagged paths have strong to very strong effects from Time 1 to Time
2, strong to moderately strong effects from Time 2 to Time 3, and mild to moderately
strong effect sizes from Time 1 to Time 3. Individual factors had a positive, weak
effect on Overall Well-Being over time in the Well-Being model and significant,
weak to mild positive effects from Time 2 to Time 3 on Overall Well-Being in the
Integrated and Well-Being- Mental Health models.
Individual Factors also had significant, weak to mild effects in the Integrated,
Well-Being- Mental Health models on reducing Mental Illness over time; in the
Mental Distress model, and Well-Being- Mental Health and Integrated models.
Individual Factors also had a weak, but significant effect on reducing Burnout in the
Mental Distress model.
3.6.9 Positive Workplace Factors in the longitudinal models
The auto-lagged paths for Positive Workplace Factors for Time 1 to 2 and
Time 2 to Time 3 have strong to very strong effects. For the auto-lagged paths from
Time 1 to Time 3, there are mild to moderately strong effects. The auto-lagged paths
for Positive Workplace Factors in the Mental Distress model were interesting as the
Time 1 to Time 2 path was very strong, the Time 1 to Time 3 was mild, whilst the
Time 2 to Time 3 was trivial and not included in the final model. A beta weight

331
above 1 did not negate the solution of the longitudinal model, as a linear dependency
would make an inadmissible solution in a CFA, but may indicate the presence of a
suppressor variable. It was not clear which variable could be acting as a suppressor
variable and this will require further investigation in the future.
There are weak effects from Time 1 to Time 2 for Positive Workplace Factors
to boost Overall Well-Being in the Well-Being and Integrated models and reduce
Mental Illness in the Mental Distress and Integrated models. However, Positive
Workplace Factors had greater, significant effects on Work Engagement, increasing
Work Well-Being and Work Engagement (weak to moderately strong effects in the
Well-Being, Work Engagement and Integrated models) and reducing Burnout with
moderately strong effects in the Mental Distress model.
3.6.10 Negative Spillover in the longitudinal models
The auto-lagged paths for Negative Spillover were all highly significant and
strong from Time 1 to Time 2, moderately strong to strong for Time 2 to Time 3 and
mild to moderately strong from Time1 to Time 3. Negative Spillover had a mild
effect that increased Mental Illness in the Mental Distress model, the Well-Being
Mental Health model and the Integrated model. Negative Spillover also had a weak,
negative effect on Work Engagement in the Integrated model.
3.6.11 Overall Well-Being in the longitudinal models
The auto-lagged paths for Overall Well-Being had very strong to strong
effects from Time 1 to Time 2, moderately strong to strong effects from Time 2 to
Time 3 and mild to moderately strong effects from Time 1 to Time 3. Overall Well-
Being had a positive weak to mild, significant effect on Individual Factors in the
Well-Being model, in the Well-Being - Mental Health model and in the Integrated
model. Overall Well-Being also led to a mild, significant reduction of Negative

332
Table 3.13
Effect sizes of the standardized regression weights for the auto-lagged and cross-lagged paths for all the longitudinal models
„Input‟ „Outcome‟ variablesa
Variablesa
IFxx2 IFxx3 PWFxx2 PWFxx3 NSPxx2 NSPxx3 OWBxx2 OWBxx3 MIxx2 MIxx3 WExx2 WExx3
IFwb1 .685*** .304*** .143
IFmi1 .897*** .270*** -.162* -.048** (B)
IFwbmh1 .647*** .256*** -.213***
IFwa1 .867*** .240***
IFcm1 .633*** .269*** -.221**
IFwb2 .444***
IFmi2 .496***
IFwbmh2 .651*** .229*** -.175**
IFwa2 .653***
IFcm2 .616*** .176*** -.139*
PWFwb1 .860*** .395*** .077** .219*** (W)
PWFmi1 1.059*** .266*** -.142* -.331** (B)
PWFwbmh1 .840*** .361***
PWFwa1 .997*** .291*** .422** (E)
PWFcm1 .845*** .329*** .084** -.054 .166*** (E)
PWFwb2 .808*** .484*** (W)
PWFmi2 .352*** (B)
PWFwbmh2 .509***
PWFwa2 .679*** .334* (E)
PWFcm2 .736*** .348* (E)
NSPmi1 .631*** .291*** .125*
NSPwbmh1 .803*** .254*** .134*
NSPwa1 .749*** .271***
NSPcm1 .762*** .304*** .185***
NSPmi2 .441*** .065†
NSPwbmh2 .604*** .171*** † p < .10, * p < .05, ** p < .01, *** p < .001
Strong effect β > .50 moderately strong effect β= .30 to .50 mild effect β= .20 to .30 weak effect β< .20 Note. Auto-lagged paths on the leading diagonal; Causality paths in upper triangular matrix; Reverse Causality paths in lower triangular matrix a „Input‟ and „Outcome‟ variables refer to variables at the beginning and the end of the causal arrow, respectively

333
Table 3.13 (continued)
„Input‟ „Outcome‟ variablesa
Variablesa IFxx2 IFxx3 PWFxx2 PWFxx3 NSPxx2 NSPxx3 OWBxx2 OWBxx3 MIxx2 MIxx3 WExx2 WExx3
NSPwa2 .561***
NSPcm2 .540*** .094* -.015† (W)
OWBwb1 .184 .699*** .340***
OWBwbmh1 .259*** .882*** .288***
OWBcm1 .253*** .828*** .317***
OWBwb2 .181*** .589***
OWBwbmh2 . -.141** .357**
OWBcm2 -.115* .434***
MImi1 .179** -.119** -.106† .310** .244***
MIwbmh1 .050* -.136† .344*** .218***
MIcm1 .048*** .311*** .208***
MImi2 -.158*** .067** .102** .472***
MIwbmh2 -.179* .237***
MIcm2 -.113† .354***
WWBwb1 .054* .611***(W) .366*** (W)
WEwa1 -.150 .415** (E) .270*** (E)
WEcm1 .065* .651*** (E) .315*** (E)
WWBwb2 -.340***
WEwa2 -.114 .226 (E)
WEcm2 -.119 .184 (E)
BURNmi1 -.124* .315† .208** .468*** (B) .265*** (B)
BURNmi2 -.609*** .904*** (B) † p < .10, * p < .05, ** p < .01, *** p < .001
Strong effect β > .50 moderately strong effect β= .30 to .50 mild effect β= .20 to .30 weak effect β< .20 Note: The composite variables in the longitudinal models are IF: Individual Factors, PWF: Positive Workplace Factors, NSP: Negative Spillover, OWB: Overall Well-Being, MI:
Mental Illness; WWB (or W) Work Well-Being, WE (or E) Work Engagement, and BURN (or B): Burnout. WWB, WE & BURN are similar constructs (WE overall term) but with
opposite loadings; W, E or B indicates which outcome was used in that model; The letters after the name of the composite variables, „wb‟, „mi‟, „wbmh‟, „wa‟, „cm‟, indicate that
the variable is from the Well-being, Mental Distress, Well-Being-Mental Health, Work Engagement, and Integrated models respectively. „1‟, „2‟ and „3‟ indicate the variables at
Times 1, 2, and 3 respectively. The „xx‟ after the outcome variables indicate that all Time 2 or Time3 variables are collapsed into the one column, to allow comparison of β weights
between all models
Note. Auto-lagged paths on the leading diagonal; Causality paths in upper triangular matrix; Reverse Causality paths in lower triangular matrix a „Input‟ and „Outcome‟ variables refer to variables at the beginning and the end of the causal arrow, respectively

334
Spillover from Time 2 to Time 3 in the Well-Being – Mental Health and Integrated
models.
3.6.12 Mental Illness in the longitudinal models
Unlike the auto-lagged paths for Individual Factors, Positive Workplace
Factors, Negative Spillover and Overall Well-Being, the auto-lagged paths for
Mental Illness had only moderately strong effects from Time 1 to Time 2, mild to
moderate effects from Time 2 to Time 3 and mild effects from Time 1 to Time 3.
However, the mild effect of Mental Illness on Individual Factors was both
interesting and counterintuitive. There was no evidence that the effect of mental
illness had been enhanced by suppressor variables (i.e. negative suppression)
(Tabachnick & Fidell, 2001), as the correlations between the variables was greater
than the beta weights (r‟s > .530, β‟s < .180). From Mental Illness to Individual
Factors for Time 1 to Time 2, there was a significant positive influence in the Mental
Distress, Well-Being-Mental Health and Integrated models. However, the bivariate
correlations between Mental Illness at Time 1 and Individual Factors at Time 2 were
negative; r = -.649, p < .001 Mental Distress model; r = -.615, p < .001, Well-being
Mental Health model; and r = -.624, p < .001 in the Integrated model. These
relationships would indicate that Mental Illness at Time 1 would lead to higher levels
of the Individual Factors at Time 2.Although there was a positive effect from Time 1
to Time 2, in the Integrated model, the Time 2 to Time 3 relationships were in the
expected direction. Further research could try to separate which of the variables may
be involved with the negative suppression of Mental Illness, which may then in turn
lead to better understanding of the persistence of mental illnesses and whether the
individual could have indeed gained insights from having a mental illness.
Mental Illness had a mild, negative effect on Negative Spillover from Time 1

335
to Time 2 in the Mental Distress and Well-Being-Mental Health models, although, as
with the effect on Individual Factors, this was not an effect of negative suppression.
However, the effect was varied from Time 2 to Time 3, having a mild, positive effect
in the Mental Distress model and a mild negative effect in the Well-Being Mental
Health and in the Integrated models.
3.6.13 Work Engagement in the longitudinal models
Engagement and disengagement (i.e. burnout) in work did not have the
consistent patterns over time that are seen in the Individual Factors, Positive
Workplace Factors, Negative Spillover and Overall Well-Being factors and to a
certain extent, the Mental Illness factor. The auto-lagged paths were mostly highly
significant, first as Work Well-Being, showed strong effects from Time 1 to Time 2,
moderately strong effects from Time 1 to Time 3 but the trivial path between Time 2
and Time 3 was not included in the final Well-Being model. Second, as Work
Engagement, there was a moderately strong to strong effect from Time 1 to Time 2, a
weak to mild, but non-significant, effect from Time 2 to Time 3 and a mild to
moderately strong, significant effect from Time 1 to Time 3 in the Work Engagement
and Integrated models. Third, as Burnout, there was a moderately strong effect from
Time 1 to Time 2, a very strong effect from Time 2 to Time 3, yet only a mild effect
from Time1 to Time 3 in the Mental Distress model.
Work Well-Being and Work Engagement had weak, significantly positive
effects on Individual Factors from Time 1 to time 2 in the Well-being model and in
the Integrated model, whilst Burnout had a weak, negative effect on Individual
Factors in the Mental Distress model. There were weaker, counterintuitive
relationships between Work Engagement in its various forms and Positive
Workplace Factors, despite the strong positive correlations between the two

336
variables, which would discount the possibility that suppression was occurring
(Tabachnick & Fidell, 2001). There were negative, weak to mild effects on Positive
Workplace Factors in the Work Engagement model, weak to moderately strong
negative effects from Time 2 to Time 3 in the Well-Being and Integrated models.
Burnout also had a mixed influence with a moderately strong, although only
marginally non-significant positive effect for Time 1 to Time 2 and a strong, highly
significant negative influence from Time 2 to Time 3 on Positive Workplace Factors
in the Mental Distress model. In all forms, work engagement led to reduced
perceptions of the positive workplace over time, indicating that there is a complex
relationship between the conditions of work and the individual‟s feelings of
engagement or disengagement with their work. Further research is necessary to better
understand how and why strong positive synchronous relationships could lead to the
loss of engagement in work over time.
3.6.14 Gain and loss spirals
Whilst the hypothesis that largest influences on a variable over time were the
direct effects of the same variable on itself over time was supported, the summaries
for the effects of each composite variable show that there are many significant cross-
lagged paths between the variables, which supported the hypothesis of the presence
of gain and loss spirals. In this section, these are brought together to show where gain
and loss spirals were occurring. Whilst the gain and loss spirals are described
separately, these occur within the same models, so the final step considered the net
effect of gain and loss. Gain (or loss) spirals occur where variable A at Time 1
increased (or decreased) variable B at Time 2, then variable B at Time 2 increased
(or decreased) variable A at Time 3, leading to the individual having more or less
resources over time.

337
Gain spirals can be seen between Individual Factors and Overall Well-Being
in three of the models, increasing these resources over time. First, in the Well-Being
model (IFwb1 to OWBwb2, β = .143, OBWwb2 to IFwb3, β = .184), second, in the
Well-Being –Mental Health model (OWBwbmh1 to IFwbmh2, β = .259, IFwbmh2 to
OWBwbmh3, β = .229) and third, in the Integrated model (OWBcm1 to IFcm2, β =
.253, IFcm2 to OWBcm3, β = .176). Gain spirals were also shown for Individual
Factors and Mental Illness in the Well-Being-Mental Health model (MIwbmh1 to
IFwbmh2, β = .050, IFwbmh2 to MIwbmh3, β = -.175) and in the Integrated model
(MIcm1 to IFcm2, β = .048, IFcm2 to MI3, β = -.139). A gain spiral occurred in this
case as Mental Illness will be decreased over time, although this did not account for
the negative effect of Mental Illness on Individual Factors at Time 3 in the Mental
Distress model.
Loss spirals can be seen in the Mental Distress model between Negative
Spillover and Mental Illness (NSPmi1 to Mimi2, β = .125, Mimi2 to NSPmi3, β =
.102), but the nature of the spiral was more complicated in the other models that
involved Negative Spillover and Mental Illness. In the Well-Being-Mental Health
and Integrated models, Negative Spillover had a consistent effect of increasing
Mental Illness from Time 1 to Time 2 (β = .134, WBMH; β = .185, Integrated) and
Time 2 to Time 3 (β = .171, WBMH; β = .094, Integrated) in both models. However,
the effect of Mental Illness to Negative Spillover was more varied, with Mental
Illness at reducing Negative Spillover in the Well-Being –Mental Health model
(MIwbmh1 to NSPwbmh2, β = -.136; MIwbmh2 to NSpwbmh3, β = -.179) and in
the Integrated model (MIcm2 to NSPcm3, β = -.113). As the beta weights of the
Negative Spillover paths were similar to those of the Mental Illness paths, the net
outcome appeared to be neither clearly a gain or loss in resources (i.e. a gain would

338
be a reduction in mental illness), rather maintenance of the current level of
functioning.
The counterbalancing of positive influence and negative influence was seen
in other parts of the models. Positive Workplace Factors had a consistently positive
effect on increasing Work Engagement and reducing Burnout from Time 1 to Time 2
and Time 2 to Time 3 in all the models in which both variables appear (β‟s range
from .166 (Integrated) to .484 (Well-Being)). However, Work Engagement had a
mostly negative effect on Positive Workplace Factors (range: β = -.340, Time 2 to
Time 3, Well-Being model; to β= -.114, Time 2 to Time 3, Work Engagement
model). When considering the net outcome of these opposing influences, it appeared
that there was small net gain in resources (i.e. increases in Work Engagement), as the
Positive Workplace Factor paths were somewhat greater than the Work Engagement
paths. The downward trend from Work Engagement could be felt however, should
there be a loss of workplace resources and any changes in the individual‟s view of
the intrinsic reward that would decrease the value of the Positive Workplace Factors.
Within the models, there were mutual reinforcement effects over same time
period, rather than occurring over the longer time periods. For example, Individual
Factors and Overall Well-Being also reinforced each other between Time 1 and Time
2 (IFwb1 to OWBwb2, β = .143, OWBwb1 to IFwb2 = .184) as well as the further
gain from Time 2 to Time 3 (OWBwb2 to IFwb3, β = 181). There were also effects
that were counterbalanced between individual Factors and Burnout in the Mental
Distress model (IFmi1 to BURNmi2, β = -.048, BURNmi2 to IFmi3, β = -.124) and
the effect of Overall Well-Being on Negative Spillover was unopposed
(OWBwbmh2 to NSPwbmh3, β = -.141, OWBcm2 to NSPcm3, β = -.115).
The models show the presence of both gain and loss spirals, and the more

339
Scale
Figure 3.9
Weighting of the auto-lagged and Cross-lagged paths in the integrated model Note. IF Individual Factors; PWF Positive Workplace Factors; NSP Negative Spillover; OWB Overall
Well-Being; MI Mental Illness; WE Work Engagement; „tm1‟ Time 1; „tm2‟ Time 2; „tm3‟ Time3
complex counterbalancing of the gain and loss of resources. It may not be reasonable
to „add‟ up the beta weights, but the net sum of all the paths would appear to be
slightly positive. As such, this would suggest that the usual progress of development
over time is for individuals to gradually gain in resources, where there are no
external events that „challenge‟ the individual. This gradual drift toward the positive
supplements the stability of functioning that was seen across time, seeing the gradual
accumulation of resources in the longer term. In summary, paths within and between
variables were both important to individual functioning over time. Using arrows of
differing widths, Figure 3.9 give a visible weighting to the different paths, from the
strongest to the weakest effect in the Integrated model. The resulting „web‟ gives a
sense of the relative importance of the paths; the constancy of the variables, with the
lighter, cross-linkages indicating where change may occur.

340
3.6.15 Squared multiple correlations from the models
Whilst the models have good fit, the final consideration of the longitudinal
models was to whether the models explain sufficient variance in the composite
variables to be considered satisfactory. Table 3.14 showed the squared multiple
correlations for each composite variable, which was equivalent to the variance but
expressed as 0 to 1.0, rather than as a percentage. Time 1 was not included, as these
variables were considered the „cause‟ of the composite variable at the later times.
The squared multiple correlations allowed an estimate of the reliability of the
models, with the convention is that > .50 is acceptable (Holmes-Smith et al., 2006).
In all models, a large, substantial portion of the variance in each composite variable
was explained by the modelling, with the highest accounting for 82.5% of Individual
Factors and82.2% of Overall Well-Being at Time 3 in the Well-Being model. The
least amount of variance explained was for Burnout and Mental Illness with 42% and
42.2%, respectively of the variance at Time 3 explained which was still a large effect
(J. Cohen, 1992).The explanation of Individual Factors, Positive Workplace Factors,
Negative Spillover, Overall Well-Being and Work Engagement (also as Work Well-
Being) were considerably higher, indicating that the models were well able to capture
the longitudinal relationships.
3.6.16 Summary of the results of the longitudinal models
The results of this chapter have demonstrated that longitudinal relationships
could be successfully modelled in this data sample. The initial structural models at
Time 1 showed that the models were tenable. The confirmatory factor analyses then
established the measurement models that gave rise to the factor score weights, which
were used to construct the composite variables for use in the longitudinal models.
These composite variables overcome a major limitation of longitudinal models,
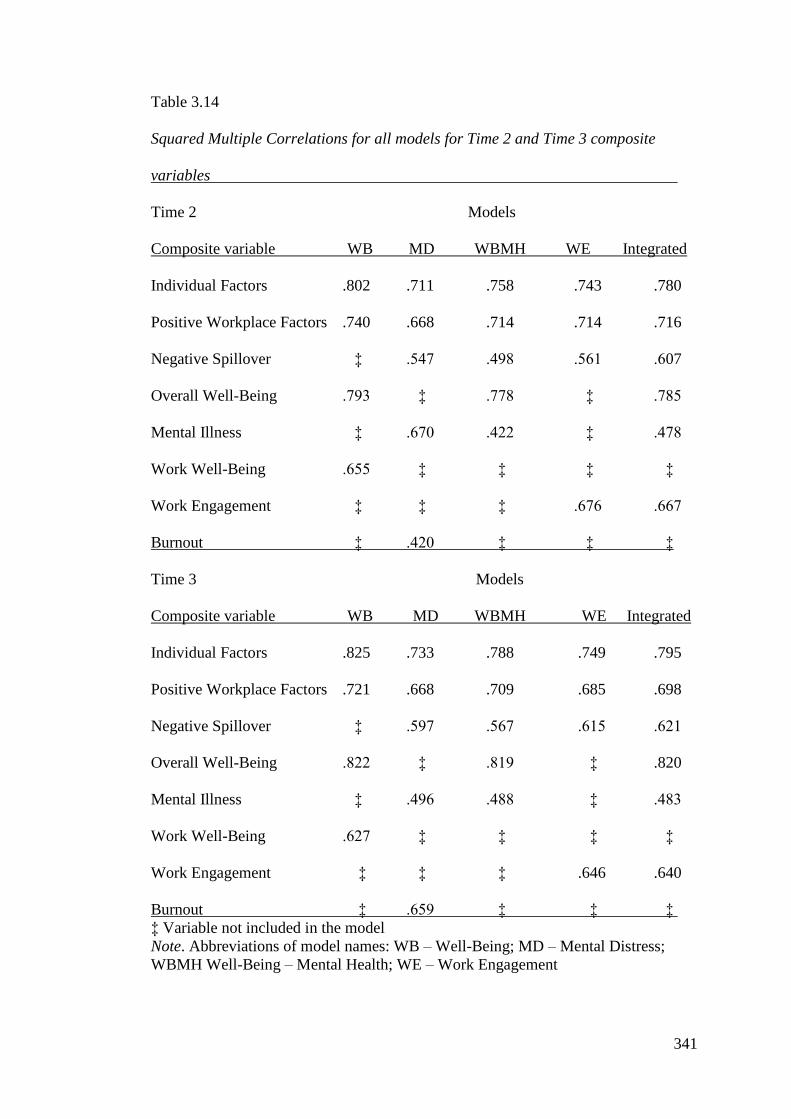
341
Table 3.14
Squared Multiple Correlations for all models for Time 2 and Time 3 composite
variables
Time 2 Models
Composite variable WB MD WBMH WE Integrated
Individual Factors .802 .711 .758 .743 .780
Positive Workplace Factors .740 .668 .714 .714 .716
Negative Spillover ‡ .547 .498 .561 .607
Overall Well-Being .793 ‡ .778 ‡ .785
Mental Illness ‡ .670 .422 ‡ .478
Work Well-Being .655 ‡ ‡ ‡ ‡
Work Engagement ‡ ‡ ‡ .676 .667
Burnout ‡ .420 ‡ ‡ ‡
Time 3 Models
Composite variable WB MD WBMH WE Integrated
Individual Factors .825 .733 .788 .749 .795
Positive Workplace Factors .721 .668 .709 .685 .698
Negative Spillover ‡ .597 .567 .615 .621
Overall Well-Being .822 ‡ .819 ‡ .820
Mental Illness ‡ .496 .488 ‡ .483
Work Well-Being .627 ‡ ‡ ‡ ‡
Work Engagement ‡ ‡ ‡ .646 .640
Burnout ‡ .659 ‡ ‡ ‡
‡ Variable not included in the model
Note. Abbreviations of model names: WB – Well-Being; MD – Mental Distress;
WBMH Well-Being – Mental Health; WE – Work Engagement

342
allowing measurement errors of the latent variables to be contained within these new
observed variables. The fit of the longitudinal models was tested with a set of five
models (A to E). In each case, the best fit was achieved by trimming trivial paths out
of the models (model E) to limit both Type I and Type II errors, achieving a balance
between not accepting chance associations (Type I errors) but not removing true non-
zero paths that were not significant in these particular models (Type II errors).
Further, the factor score weights illustrate the underlying linkages between
variables that are usually taken as being at either end of the causal arrow, as predictor
and outcome. For example, the construction of Individual Factors and Overall Well-
Being, and of Positive Workplace Factors and Work Engagement showed that these
constructs are intertwined, despite being conceived as separate constructs. Given the
linkages, individuals who are high in dispositional optimism will be high in life
satisfaction and psychological well-being, whilst those who are dedicated to their
work will experience greater opportunities to use their talents and skills, in a positive
workplace.
Collating the beta weights of all the models into one table allowed for the
consideration of what were the influential pathways over time, adding to the results
of the synchronous correlations. The strongest influences were between the variables
at each time and within the same variables over time, with weaker cross-lagged paths
between the variables over time. The mutual reinforcement of the variables over time
lends support for gain spirals, for example between Individual Factors and Overall
Well-being over time, and loss spirals, for example between Negative Spillover and
Mental Illness over time. However, there were also counterbalanced effects between
Positive Workplace Factors and Work Engagement in its various forms, which
indicate that the relationships were more complex than would be supposed from the

343
strong bivariate correlations between the variables.
3.7 Discussion of the longitudinal models
The hypotheses for Study 2, that the longitudinal models would show
evidence of stability and change over time have been supported. The hypothesis that
the strongest influence on a variable would be it‟s previous levels was supported and
the modelling found that Individual Factors, Positive Workplace Factors, Negative
Spillover and Overall Well-Being had strong effects on themselves across time
whilst Mental Illness had more moderate effects and the effects of Work Engagement
was more variable. Further, the hypothesis that the cross-lagged paths would also be
influential was also supported. The modelling showed that gain and loss spirals were
present in the longitudinal modelling, with a slight positive net gain in the
individual‟s resources shown over time. Rather than a spiral (which implies a large,
noticeable effect), the net increase over time in the time frame of the current research
is more of a „drift‟, as the effects are weak and would not be seen until a number of
years had passed. The gradual accumulation of benefits from positive psychological
functioning has been found in longstanding longitudinal studies, such as the Study of
Adult Development (Peterson et al., 1988; Vaillant, 2002) where differences in
outcomes were not apparent until the participants had been studied for a number of
decades. The Nun Study similarly found that early positivity led to increased
longevity and better cognitive functioning five or six decades later (Danner et al.,
2001). Whilst the longitudinal models in the current study are over a short period
(less than 12 months), the net gain in resources could be expected to be ongoing into
the future, gradually accumulating until the gain was sufficiently large to be seen as a
difference between individuals. In this way, the longitudinal models may provide the
mechanism by which personality differences become manifest across a lifespan.

344
The extensive results of the longitudinal models and the analyses that lead to
their establishment will be discussed in several parts. First, the results of the Time 1
SEMs are considered, as their framework reflected the relationships already seen in
the multiple regressions. Second, the CFAs are considered, particularly the CFA that
involved Burnout and Work Engagement as these results were in contradiction to the
prevailing European research on these constructs. The discussions on the CFAs are
followed by an examination of the factor score weights that were generated by each
CFA. The factor score weights were very revealing about the underlying
relationships between each of the indicator variables, and uncovered how some
variables, usually described as „cause and effect‟ were intimately entwined; to have
one is to have the other. The „entwined‟ variables were the individual difference and
well-being indicator variables, as well as work dedication and skill discretion that
were tightly linked together.
Finally, the models themselves are discussed. The stability and change
captured by the models provided insight into the mechanism by which resources may
be accumulated or lost over time. As hypothesized, the strongest relationships were
between the variables are each time (concurrent functioning) and within the same
variables over time, with mild to weak reciprocal relationships between the variables
over time. Importantly, these reciprocal relationships show the leverage points at
which psychological or management interventions can be made, therefore improving
the developmental outcomes for working adults.
3.7.1 Discussion of the Time 1 SEMs
The results of the Time 1 SEMs showed that satisfactory models can be
obtained from the data available in this thesis. Following on from the multiple
regressions in Chapter 3, the expected relationships were found between individual

345
resources, the workplace resources and the negative spillover between work and
family domains. Individual Factors, measured as dispositional optimism and coping
self-efficacy, were positively related to Positive Workplace Factors, the supportive
working conditions that were measured as skill discretion, affective commitment and
job autonomy, but both were negatively related to Negative Spillover, measured as
the problems that spill over between work and family domains. Further, these three
factors then had the expected positive and negative effects on well-being, mental
illness, work engagement and burnout.
The final Time 1 model that combined the positive and negative outcomes
had a satisfactory fit and showed that Individual Factors, Positive Workplace Factors
and Negative Spillover had slightly different influences on well-being, work
engagement and the mental health outcomes. Individuals with higher levels of the
Individual Factor, that is more optimism and had greater self-efficacy, had greater
Overall Well-Being, as more satisfaction and purpose in their lives and an added
sense of professional efficacy in their work and less mental illnesses. As such, the
model added further confirmation to previous research, where both dispositional
optimism and coping self-efficacy were central to well-being and mental health
(Atienza et al., 2004; Chang, 1998; Hart et al., 2008; Jex & Bliese, 1999; Judge et al.,
1998; Major et al., 1998). Similarly, the link between Positive Workplace Factors,
with more job autonomy and more skill discretion, leading to high levels of Work
Engagement, as the enthusiasm and zest (work dedication) and absorption in one‟s
work, was similar to that found in previous research (for example, Bakker et al.,
2005; Schaufeli & Bakker, 2004). However, Positive Workplace Factors also
increased the individual‟s mental illnesses. This was unexpected, although it could be
speculated that increasing responsibilities and decision-making associated with more

346
complex challenging jobs add to perceptions of mental illness, perhaps to stress in
particular.
Negative Spillover, as the problems or tiredness that come from one domain
to another, lead as expected to an increase in Mental Illnesses, and reductions in
Work Engagement, but did not have an influence of Overall Well-being. As the
regressions in Chapter 2 have shown, Negative Spillover can account for any lack of
social support at work. These results add further support to the link between adequate
workplace supports and increased work engagement and reductions in burnout
(Bakker et al., 2006; Houkes et al., 2003; Klusmann et al., 2008a). These results form
a solid basis to explore the longitudinal relationships between these variables, with
the differences in influences hinting that there may be more complex relationships in
the analyses that follow. The next step of the modelling process was to conduct
confirmatory factor analyses as the basis for the longitudinal models.
3.7.2 Confirmatory factor analyses
The Confirmatory Factor Analyses (CFAs) separately examined and formed
the basis for the five proposed longitudinal models. For four of the five analyses, the
Well-Being, Mental Distress, Well-Being-Mental Health, and Integrated CFAs, the
CFAs were easily established, well fitting and with few additional paths over and
above the relationships through the latent factors. However, the CFA for
Burnout/Work Engagement was unexpectedly difficult and required extensive
additional analyses to understand why the CFA with these two factors did not work
as initially proposed. Using burnout and work engagement as separate factors based
the two scales for Burnout (i.e. emotional exhaustion, cynicism and professional
efficacy) (Maslach et al., 1996) and Work Engagement (i.e. work vigour, work
dedication and work absorption) (Schaufeli et al., 2002), the initial CFA was

347
hopelessly complicated in an effort to achieve any sort of reasonable fit. As such, the
CFA using the two scales was unacceptable and other solutions were explored, as
outlined in the Results of this chapter, with the single factor as the only satisfactory
solution.
Re-examining the original development of the work engagement scale, it was
seen that Schaufeli et al. (2002) had found that the best fit for Burnout and Work
Engagement was indeed two factors, but not as the two separate scales. The two
factors were the „core‟ of burnout as the first factor (i.e. emotional exhaustion and
cynicism) and the engagement scales (i.e. work vigour, dedication and absorption)
with professional efficacy as the second factor. When this arrangement of factors was
tried in the current analyses, the CFA was not successful and could not be defined as
the matrices were non-positive definite. That the two scales would not be separate
factors was surprising to say the least, as it appears contrary to published results. It
also raises questions about the initial scale development and why work engagement
was proposed without the addition of professional efficacy. It is puzzling that the
research would suggest a broader conception of work engagement than the
researchers themselves have found and used (for example, Schaufeli & Bakker,
2004; Schaufeli et al., 2008).
In this sample, these results indicate that the two-factor solution as proposed
by Schaufeli and colleagues (2002) can not be supported. Instead, the results indicate
that Work Engagement should be considered as a single factor or continuum with a
positive end (i.e. work engagement) and a negative end (i.e. burnout). The single
factor of work engagement-to-burnout of the current results is similar to Maslach and
Leiter‟s view that work engagement is the positive opposite of burnout (i.e. having
energy, involvement and professional efficacy). Work in these situations is

348
challenging, meaningful and important (Maslach & Leiter, 1997; Maslach et al.,
2001), whereas burnout is the opposite and the loss of engagement is therefore
defined as the components of exhaustion (i.e. the loss of energy), cynicism (i.e. lack
of involvement) and the loss of professional efficacy. The previously meaningful job
has become uninviting and uninspiring (Maslach, 1998; Maslach et al., 1996;
Maslach & Leiter, 2008; Maslach et al., 2001). The current research would define the
positive end of the continuum similarly, but more broadly than Maslach‟s view. In
the current research, work engagement is measured as being high in work dedication
(the zest for work), work absorption (the focus of work), professional efficacy (the
competence the individual feels about work) and with a lack of cynicism (to not be
jaded by work and remain involved).
From the CFAs and the factor score weights, work dedication is central to the
continuum of work engagement, being part of both the calculation of work
engagement and the workplace factors and capturing the energy of work
engagement. Interestingly, the wording of the work dedication items (Schaufeli et al.,
2002) may also capture the intrinsic value of work (Baard et al., 2004). Individuals
are asked if their jobs are „inspiring‟, „challenging‟, and „meaningful‟ and if they are
„enthusiastic‟ and „proud‟ of their work. Agreeing with these items implies an
energetic approach to work, as zest and joy for the job at hand. Further, being
absorbed in work also implies an energetic approach to work, as being engrossed and
deeply interested in what is to be done. The loss of dedication, losing that energy,
that zest and focus, in addition to losing feelings of competence and a feeling of
worth in the work that they do will bring about the negative, burnt out end of the
continuum when the positive attributes are eroded and then lost. Taking in the
perspective of the Conservation of Resources theory (Hobfoll, 1989, 2001, 2002),

349
burnout occurs as the result of the actual or potential loss of resources and the loss of
possible gains in resources (i.e. rewards are not obtained as could be expected for the
work done). Resources can be objects, work conditions, energy or personal
characteristics. Work engagement, as the single factor, captures the individual who is
highly engaged in their work and in work situations that allow some or all of the
individual‟s resources to be gained and replenished, by the intrinsic rewards from
challenging interesting work and the satisfaction of competence and „doing well‟.
Burnout will result where the individual is unable to replace resources lost through
difficult working conditions, for example, where workloads are high or the sense of
community is reduced or lost in the workplace. Coping requires resources and if not
restored, burnout will occur as positive emotions and motivations are lost (Hobfoll &
Freedy, 1993).
Returning to the general discussion on the CFAs, the next point is to consider
the additional paths that were added between the errors of the indicator variables path
to improve the fit of the CFAs. The correlations between the latent factors were all in
the expected directions, with like constructs being positively correlated (for example,
Individual Factors and Overall Well-Being) and opposite constructs being negatively
correlated (for example, Individual Factors and Negative Spillover). The additional
paths between the indicator variables indicate that there are „extra‟ relationships over
and above the main relationships through the latent factors. As such, it could be
considered that it is the extreme ends of a measure that are captured by the
correlations and which are not explained by the relationships between the latent
factors alone (Holmes-Smith et al., 2006).
In the Well-Being model, there is only one but in the other models there are
more additional paths that improved the fit, with the sign of the correlations shown in
350
the diagrams of the CFAs. Whilst it is not ideal to have these paths and in a perfect
model they would not be necessary, it could be argued that these paths represent an
interesting insight into the relationships that are not accounted for by the dominant
relationships between the latent factor and their indicator variables (Holmes-Smith et
al., 2006). For example, in the Mental Distress CFA, there are additional positive
correlations between dispositional optimism and stress and between coping self-
efficacy and cynicism. These paths would be interpreted after the main relationships
(i.e. Individual Factors is negative correlated with both Mental Illness and Burnout)
and therefore, Individual Factors are associated with less Mental Illness and Burnout.
Over and above this however, the over-optimistic person may be more stressed, and
the person with greater self-efficacy could become more cynical, perhaps comparing
themselves to less capable others. This latter situation occurred among community
nurses in Norway, who were rated by their peers as thriving and highly engaged in
their challenging jobs. These high performing nurses judged other nurses by their
own standards and were often frustrated by others‟ perceived underperformance. The
nurses felt that they would be better do all the work themselves, increasing their
overload and fatigue and leading to burnout (Vinje & Mittelmark, 2007).
Again considering the Mental Distress CFA, there are other relationships that
extend beyond the relationships between the latent factors. For example, the
correlations between exhaustion and skill discretion could indicate that when taken to
the extreme, a job that requires a high level of creativity and skill usage can be tiring
or unsustainable, when that level is needed or maintained on a long-term basis. Given
the discussion in the previous paragraphs of the continuum between work
engagement and burnout, this link between skill discretion and exhaustion may be a
step in the decline of engagement that the individual has for their work. Where

351
negative work-to-family spillover adds directly to stress and exhaustion, this could
indicate that not only is Negative Spillover is a general malaise, problems and
tiredness stemming from the workplace are tied directly to the individual‟s feelings
of stress and exhaustion.
These additional paths occurred in the other CFAs and can be viewed as
beneficial or detrimental additions to overall functioning, either reinforcing or
eroding the individual‟s resources. Examples of the beneficial pathways would be the
positive correlation between autonomy and professional efficacy and between
professional efficacy and psychological well-being (Integrated CFA) and the
negative correlations between affective commitment and firstly cynicism (Work
Engagement CFA) and secondly, exhaustion (Integrated CFA). These additions
could be explained as extra autonomy that directly enhances the individual‟s view of
themselves as competent at work, as well as feeling capable at work directly added to
their overall sense of psychological well-being. Further, the benefits of being
attached to one‟s work also have direct benefits to guard specifically against
exhaustion and cynicism.
Examples of the detrimental linkages would be positive correlations between
skill discretion and stress and skill discretion and negative work-to-family spillover
(both in Well-Being-Mental Health CFA) and work absorption and negative work-to-
family spillover (Work Engagement and Integrated CFAs). It could be considered
that the detrimental effects arise from „too much of a good thing‟, as was the case
with optimism and stress and coping self-efficacy and cynicism in the Mental
Distress model. These are speculative conclusions, but may explain why over-
confidence could be detrimental to the individual (Erhlinger et al., 2008) and why
realistic optimism protects self-esteem (Schneider, 2001) and focuses behaviour

352
towards more realistic goals (Armor & Sackett, 2006; Armor & Taylor, 1998;
Aspinwall et al., 2002). The link between too much absorption in work and negative
work-to-family spillover was found also in the moderated regressions and may be
linked to not disengaging from work. Recent research has found that persisting with
work outside the usual working hours, rather than taking time for other activities lead
to more negative affect, more fatigue and less positive affect (Sonnentag & Bayer,
2006; Sonnentag & Zijlstra, 2006). Further research is necessary to understand if this
will provide the link between absorption in work and negative spillover.
In summary, the CFAs found that most of the relationships between the
indicator variables could be explained by the relationships between the latent factors.
The small number of addition paths directly between the indicator variables adds to
the explanations of psychological functioning by capturing what happens over and
above the main relationships, perhaps showing why excess in any domain may be
detrimental or indeed more beneficial.
3.7.3 Factor score weight from the CFAs
From the CFAs, the next step was to convert each of the latent variables into
observed variables that could be used in the longitudinal models. For example, the
latent variable Individual Factors became the observed variable, Individual Factors,
using the factor score weights generated by the CFAs. As noted previously, this step
was necessary to minimise the errors within the longitudinal models, which would
otherwise make the models extremely unwieldy and unstable (de Jonge et al., 2001;
Zapf et al., 1996). The factor score weights give an indication of the contribution of
the indicator variables to the new, observed composite variable, ranging from
substantial contributions to little or no effect from the indicator variables (Holmes-
Smith et al., 2006). As with the CFAs, this was mostly straight forward but with

353
some extremely interesting patterns of associations. First, the straight forward factor
score weights. Across the models, Mental Illness was mainly the sum of the
depression and stress scores, Negative Spillover was the sum of the negative work-
to-family spillover and negative family-to-work spillover scores with the addition of
exhaustion score in the Integrated model, and Burnout (in the Mental Distress model)
was the sum of the exhaustion and cynicism scores.
However, there are interesting and unexpected combinations for the
calculations of the observed variables: first for Individual Factors and Overall Well-
Being and second, for Positive Workplace Factors and Work Engagement. Individual
Factors and Overall Well-Being were closely linked in their construction when they
occur in the same models. Individual Factors were the sum of dispositional optimism
and psychological well-being and life satisfaction, whilst Overall Well-Being was the
sum of life satisfaction and psychological well-being and dispositional optimism in
the Well-Being, Well-Being-Mental Health and Integrated CFAs. From the literature,
positive illusions and happiness are closely tied to good physical and mental health
and are adaptive in challenging situations (Taylor, Kemeny, Reed, Bower, &
Gruenewald, 2000), with realistic optimism and a positive self-bias being important,
consistent predictors of well-being (Shmotkin, 2005). Further, as shown by the
regressions in Chapter 2, dispositional optimism was a powerful resource for the
individual and was a predictor of many psychological outcomes. Hobfoll (2001,
2002) considered that resources occur together as resource caravans, reinforcing and
supporting each other over time. It is likely that the factor score weights are showing
that Individual Factor and Overall Well-Being do mathematically co-exist: to be
optimistic is to have well-being and to have well-being is to be optimistic. This
would support the concept of resource caravans as well as providing the mechanism
354
for the previous findings that positive illusions and happiness are closely linked.
The other close linkage was shown for the Positive Workplace Factors and
Work Engagement, such that how an individual perceived the conditions of their job
was largely determined by their enthusiasm for the job. This added further to the
interesting results for Work Engagement, which have been discussed previously. In
the Mental Distress model with Burnout rather than Work Engagement, Positive
Workplace Factors was the sum of (the absence of) both cynicism and exhaustion as
well as the workplace resources themselves. In the other models, Positive Workplace
Factors was the sum of work dedication with supplements from the workplace
resources. For the individual, it appears that being able to use their skills and be
creative and have autonomy in their working conditions was enhanced by their
enjoyment of their work. Perhaps this weighting could be considered as the joy that
comes from a job that challenges one‟s skills and abilities. Work Engagement is
substantially focused on work dedication which is how much the individual enjoys
the challenges of their work and how much meaning, pride and enthusiasm the
individual gains from their work. In other words an engaged worker is an individual
who relishes their work, with minor input from skill discretion. As noted previously,
work dedication appears to share commonality with intrinsic rewards of work (Baard
et al., 2004). Perhaps what is measured by skill discretion, job autonomy and
affective commitment is filtered by the feelings of enthusiasm and joy of being able
to do a worthwhile job which may account for the close linkages between workplace
resources and enthusiasm for work. As with optimism and well-being, perhaps the
internal rewards and motivation that come from a challenging, interesting job are
only seen in jobs where skills and talents are challenged by that job. This seems to be
a circular argument but may explain the findings in the factor score weights and
355
further research will allow a better understanding of the results.
Given these close linkages in the construction of these four observed
variables, the longitudinal analyses were rerun with the composite variables
combined (e.g. Positive Workplace Factors and Work Engagement combined into
Work Engagement only) rather than kept separate. However, these analyses did not
shed light on the reciprocal processes involved. Collapsing Individual Factors and
Overall Well-Being, and collapsing Positive Workplace Factors and Work
Engagement into single factors merely hid the processes, such that the Stability
model (i.e. auto-lagged paths only) was the best fit of the longitudinal data rather
than a model with any cross-lagged paths. As the purpose of the current thesis was to
explore the reciprocal relationships over time, keeping the variables separate allowed
the interplay over time to be seen, although this may make the results more
challenging to interpret. Further, although work dedication was an overwhelming
part of the motivation and affect associated with working, rerunning the CFA with
work dedication as the single indicator for the Work engagement waws not practical
in SEM, as one of the underlying mathematical assumptions is that latent factors
have two or more indicator variables (Byrne, 2001; Kline, 2006). The contributions
of the other indicator variables, although small, do add to the nuances of
understanding work engagement in its entirety and as such, were retained in the
subsequent analyses.
3.7.4 How factor score weights explain the relationships of the Integrated model
To illustrate how the factor score weights can explain the balance of the
relationships found in the CFA and the weighted contribution of each indicator
variable to the composite variables, the Integrated model will be spelt out in detail.
There are many similarities to the simpler CFAs, which is to be expected as the

356
Integrated CFA is the combination of these earlier CFAs. As with the Well-Being
and Well-Being-Mental Health CFAs, the Individual Factors composite variable
showed that a large part of individual differences are due to the individual‟s
dispositional optimism and coping self-efficacy (weighted for the large number of
items in the scale) with support from the individual‟s happiness (as life satisfaction),
sense of purpose (as psychological well-being) and enjoyment of their work (as work
dedication) but with the dampening effect of any depression that they may have.
How the individual experiences their workplace (Positive Workplace Factors) was
strongly influenced by the enjoyment and sense of challenge that their work brought
(as work dedication), in addition to the conditions of their work, as the skills and
creativity that they can express (as skill discretion) and the control that they had over
work conditions (as job autonomy). Negative Spillover was the sum of the troubles
that the individual experiences that came from the problems and tiredness that were
domain-specific and from the work domain in particular and spillover was
exacerbated by the individual‟s feelings of exhaustion in general.
When considering the composite variables that represent the well-being and
mental health outcomes, the patterns of the factor score weights were also similar to
those of the previous CFAs. The individuals‟ Overall Well-Being came mainly from
their hedonic satisfaction (as life satisfaction) and sense of purpose (as psychological
well-being), with positive support from their optimism (as dispositional optimism),
their sense of managing difficult situations (as coping self-efficacy) and the skills
and creativity if their work (as skill discretion). Interestingly, Overall Well-Being
was lessened by greater levels of competence about the work that the individual did
(as professional efficacy) which would suggest that a narrow focus on succeeding at
one‟s work did not add to the individual‟s general sense of well-being. An

357
individual‟s measure of Mental Illness came principally from the individual‟s level
of depression, with stress and anxiety following in importance, with an interesting
and substantial contribution of exhaustion to Mental Illness and a small buffering
from the individual‟s level of optimism (as dispositional optimism). As was the case
in the Work Engagement CFA, the zest and enthusiasm that the individual felt about
their work (as work dedication) dominated Work Engagement, with small
contributions from how involved the individual is (as work absorption), the sense of
competence about their (professional efficacy) and the skills and creativity in their
work (as skill discretion).
The description of how the factor score weights were used to construct the
composite variables for the longitudinal models is unusual but there is little literature
with which to compare it. CFAs are usually only included as the first step of the
longitudinal modelling process, rather than an informative window on the complexity
of psychological functioning. It is likely that the space requirements of a journal
article would limit the description and analyses of these relationships, despite the
usefulness to understanding the web of influences on each latent variable at that
particular time.
3.7.5 The longitudinal models
Following on from the Time 1 models and the CFAs, the final step was to
construct and analyse the longitudinal models. The longitudinal models allow the
calculation of the relative importance of three separate influences on individual
functioning. First are the concurrent influences, which have been explored in the
CFAs and which are measured by the synchronous correlations in the longitudinal
models. In this way the influences of the present time are seen. Second is the stability
of functioning over time, measured as the auto-lagged paths between the same

358
variables over time. The last component of the model to be tested is the cross-lagged
paths which are the reciprocal relationships between variables over time, which will
show if and how change occurs over time. The results of the longitudinal models
show that the strongest paths within the models are the synchronous correlations and
the stability paths over time, with weak to mild paths between the composite
variables over time. In summary, how the individual functions over time is the sum
of their current self and situation (i.e. their personal and work place resources, any
negative spillover and their well-being, mental health and work engagement at the
present time), how these factors were in the near and distant past (i.e. carrying
forward past levels of each variable), with some reciprocal paths over time leading to
a drift toward more positive functioning. It is in the reciprocal paths that the gain and
loss spirals are seen, as these paths show how resources can be gained and lost over
time, with the stability of functioning acting as a solid foundation for these spirals to
occur.
The influences were compared using the set of four, non-nested models
(Stability, Causal, Reverse Causal and Reciprocal), with the additional step
(Trimmed) that removed the trivial paths from the model. Whilst the set of four
variations within a longitudinal models has provided a sound platform to examine the
important relationships within the models, trimming the models of trivial paths, an
innovation of the current thesis, goes further to clarify the paths that are influential.
Rather than accept a model as a whole, looking at each path allows those paths that
do not contribute to be removed and Type I errors to be avoided. The improvement
in fit without the model becoming overfitted, would indicate that this was successful,
statistically sound and a useful analytic strategy for future research. Previous
research has shown that both Causal (de Jonge et al., 2001; ter Doest & de Jonge,

359
2006) and Reciprocal (Demerouti, Bakker et al., 2004; Hakanen et al., 2008) models
can be better fitting in different studies, over various time periods and this additional
step of trimming trivial paths may add to the understanding of the outcomes by only
leaving those paths that are important.
After establishing that the Trimmed models were the best fitting longitudinal
models, it became obvious that presenting the results would be more challenging
than conducting the analyses themselves. It is not possible to put the values for all
the pathways onto a diagram as this would become illegible, unless the diagram is
very large. To this end, the values of the paths have been collated into a single table
(Table 4.13, pages 404 and 405) and colour coded to show the relative strength of the
paths (i.e. from red: strong effect, to grey: weak effect). Another reason for collating
the paths in the various models was to facilitate an understanding of what are the
common relationships between the variables and to see if the same types of
relationships occur across models. Looking at the models separately gives an
indication of what is happening there but when taken together there is sense of
overall functioning. Individuals are not just the positive or not just negative outcomes
but the sum of all of these at the same time.
3.7.6 Stability and change in the longitudinal models
3.7.6.1 Stability in the longitudinal models. The stability of competent
development can be seen in the strength of the synchronous correlations and the
auto-lagged paths in the longitudinal models. The results of the synchronous
correlations and the auto-lagged paths illustrate the relative importance of concurrent
functioning (as captured by the correlations) and the constancy of each component
over time (as captured by the auto-lagged paths) of the longitudinal model. The
results for Individual Factors, Positive Workplace Factors, Negative Spillover and

360
Overall Well-Being indicated that these variables were firmly anchored in the near
and more distant past whilst the Mental Illness was less robust and therefore more
likely to change over time. Work Engagement showed more variation depending on
how it was measured and further research is required to understand the construct.
The Stability models provided a sound basis for understanding longitudinal effects,
even though those models were less well fitting when compared to more complex
Causality, Reverse Causality and Reciprocal models. The strong link between the
variables across the time periods found in the current longitudinal models is similar
to that found in the literature, where in SEMs and multiple regression analyses, the
strongest predictor of a variable‟s time 2 score was the corresponding time 1 variable
(Barnett & Brennan, 1997; Dikkers et al., 2004; Kelloway et al., 1999; Mauno et al.,
2007). The stability of personality and well-being in the models has support from the
literature in the set-point of well-being (Fujita & Diener, 2005) and the constancy of
temperament (Vaillant, 2002), happy dispositions (Diener, Nickerson et al., 2002)
and core self-evaluations (Judge & Hurst, 2008) over many decades.
The stability of the workplace was also not unexpected and job conditions
would continue to be the same unless the individual changes their job entirely.
Constancy of job conditions have been shown for both Dutch police officers
(Dikkers et al., 2004) and employees (Demerouti, Bakker et al., 2004) and for
healthcare workers (de Jonge et al., 2001) when this is reported. The stability of
negative spillover should also follow the same logic: if the individual and their work
are reasonably stable, then the problems between domains are likely to be similar
over time. This stability of negative spillover was found over 3 months in Dutch
employees (Demerouti, Bakker et al., 2004), over six months in US employees
(Kelloway et al., 1999), over 12 months in dual earner couples (Huang, Hammer,

361
Neal, & N.A., 2004) and Dutch police officers (Dikkers et al., 2004; van Hooff et al.,
2005) and over one year and over six years for Finnish employees (Rantenan,
Kinnunen, Feldt, & Pulkkinen, 2008). Exhaustion was also persistent for many of the
participants (de Jonge et al., 2001; Demerouti, Bakker et al., 2004; Rantenan et al.,
2008; ter Doest & de Jonge, 2006; van Hooff et al., 2005), whilst work engagement
was also stable over time for Finnish dentists and health care workers (Hakanen et
al., 2008; Mauno et al., 2007).
Depression, as part of the Mental Illness composite variable, was less
persistent over time in the current longitudinal models and this in the case where it
was measured in other longitudinal models (van Hooff et al., 2005) although stress
was more stable over time (Kelloway et al., 1999). The lack of persistence of
depression may be accounted for spontaneous remission of depression. In a meta-
analysis of depression among the wait-list control groups for antidepressant trials, it
was estimated that up to 20% of participants in the control groups (who did not take
any medication or have any treatment) were no longer considered depressed as their
symptoms had reduced substantially (Posternak & Miller, 2001). Understanding the
course of untreated depression would assist with treatment and the current models
would indicate that mental illnesses do not carry forward their effects as strongly as
do individual differences, well-being, work conditions and negative spillover.
It is possible to find stability in the reviewed literature but the emphasis of the
literature is on how change occurs over time, rather than the stability that has just
been described. Change can tell how resources are lost and gained and successful
development is achieved but the stability of the variables can show where the
individual starts from and how that level of functioning is maintained over time.
Both parts, of course are necessary to fully understand individual functioning.

362
3.7.6.2 Change in the longitudinal models. The possibility of change over
time can be seen from the addition of the cross-lagged paths to the Stability models.
Whilst these paths are mostly weak to mild, these reciprocal relationships add
valuable and important explanatory power to the models and indeed, improve the fit
substantially over the Stability models. The literature has focused on the existence of
gain and loss spirals separately but the current research has shown that there can also
be mutual reinforcement and counterbalanced effects between variables between two
time periods, without the full spiral being shown. In the literature, both gain spirals
(Hakanen et al., 2006; Llorens et al., 2007; Salanova et al., 2006) and loss spirals (de
Jonge et al., 2001; Demerouti, Bakker et al., 2004) have been shown to occur over
time and gain and loss spirals are present in the current longitudinal models.
When looking at the gain spirals, a gain spiral was found in the Well-Being
model with Individual Factors at Time 1 increasing Overall Well-Being at Time 2
and Overall Well-Being increasing Individual Factors at Time 3. Further, there are
gain spirals in the Well-Being – Mental Health and Integrated models where Overall
Well-Being at Time 1 increased the Individual Factors at Time 12 and Individual
Factors at Time 2 increased Overall Well-Being at Time 3. The close link between
Individual Factors and Overall Well-being further suggests that personal resources
and well-being are a resource caravan (Hobfoll, 2002), closely linked at any one
time and reinforcing each other over time. There is also support for these close
linkages from the developmental and occupational longitudinal studies. In the Study
of Adult Development (Peterson et al., 1988; Vaillant, 2002) and the Nun Study
(Danner et al., 2001), positive emotions and behaviours in early life ere linked to
better psychological outcomes and cognitive function in later life. Similarly,
individuals with more positive core self-perceptions as adolescents and young adults

363
were more satisfied with their jobs, had greater occupational status and better health
than their less positive peers 25 years later, as positive perceptions about themselves
led to the accumulation of advantage in these individuals‟ working lives (Judge &
Hurst, 2008). Further, active problem solving increased mastery over time among
employees (Thoits, 1994) and happy people view their lives as subjectively better
terms that unhappy people, perpetuating their positive view of the world (Abbe et al.,
2003; Lyubormirsky & Tucker, 1998). Dispositional optimism is an expression of
self-regulation, which carries the notion of feedback loops that individuals can use to
direct their behaviours (Carver & Scheier, 1998). Gaining confidence in one‟s
abilities is akin to increases in mastery that comes from successful completion of
tasks be seen to be assist the self-perpetuation of a positive view of self and one‟s
well-being. The gain spirals and mutual reinforcement of Individual Factors and
Overall Well-Being found in the current research could be a mechanism for the
resource caravan and the accumulation of well-being and the personal resources in
the longer term.
The evidence for loss spirals was not as common, with only one found in the
Mental Distress model with Negative Spillover at Time 1 increasing Mental Illness at
Time 2 and Mental Illness at Time 2 increasing Negative Spillover at Time 3.This
outcome is similar to previous research where a loss spiral of poor work situations
and work-home interference increased exhaustion over time (Demerouti, Bakker et
al., 2004). However, whilst negative spillover had consistently increased the
individual‟s level of mental illnesses as has been shown in previous research
(Kelloway et al., 1999; van Hooff et al., 2005), the effect of mental illnesses in
increasing the negative spillover that the individual experienced at a later time was
not as consistent. The longitudinal models also showed some evidence that the

364
experience of a mental illness could reduce Negative Spillover in the future, in the
Well Being –Mental Health and Integrated models. This unexpected result, where a
benefit is gained from an earlier experience of mental illness was also found between
Mental Illness and Individual Factors in the Mental Distress, Well-Being-Mental
Health, and Integrated models. While Mental Illness was increasing Individual
Factors, at the same time, Individual Factors was reducing Mental Illnesses over
time. This can be considered as another gain in resources as the individual would
experience fewer mental illnesses at the later time.
Given that the correlations between Individual Factors, Negative Spillover
and Mental Illness were in the expected directions, it is not clear why these
counterintuitive results have occurred. Mental Illness at an earlier time increased the
level of the Individual Factors (e.g. the individual would have more dispositional
optimism at the later time) and reduced Negative Spillover at a later time
(particularly from Time 1 to Time 2). It could be speculated that the modelling may
capture some underling relationships that are considerably more complex than the
simple corresponding bivariate relationships. For example, following the experiences
of a mental illness, an individual may gain insight into themselves and grow
psychologically to be more optimistic or have greater self-efficacy or a mental illness
may provide insights that make problems at work or at home less salient or
troublesome. This would be similar to an individual who responds adaptively to a
challenging situation and grows as opposed to the individual who is overwhelmed by
the same type of challenge and is stressed by the event (Christopher, 2004). In the
initial data analyses for the multiple regressions, it was found that the scores for
dispositional optimism were mildly negatively skewed, indicating that the
participants in the current study were mostly optimistic. Further, the participants in

365
the current study mostly fell in to the upper end of the „normal‟ ranges or into the
„mild‟ ranges of the published data for depression and stress (S. H. Lovibond & P. F.
Lovibond, 1995). As more optimistic individuals are more likely to favour adaptive
and problem-solving coping strategies, being realistic, and/or reframing challenging
situations (for example, Armor & Taylor, 1998; Aspinwall & Taylor, 1997;
Schneider, 2001), it may be reasonable to conclude that for the participants of this
study, this heightened sense of optimism had provided some tools by which they had
mitigated any lasting effects of any mental illness that they had experienced.
Similarly, given the milder levels of mental illness in the sample, the participants
would be less likely to be adversely affected by mental illnesses and better able to
use optimistic, adaptive strategies in their lives. Earlier in the CFAs, there were
additional paths between stress and optimism and these may be important to better
understanding this problem. The positive correlation could not only mean that the
over-optimistic may be more stressed as well as the more stressed individuals may be
more dispositionally optimistic.
As the longitudinal models represent a small snapshot in time, they measure
processes that have no clear beginning or end (Menard, 1991). It is possible that the
Time 1 to Time 2 pathways include the influence of all past actions and it would be
necessary for future research to include additional measurement times to separate out
these possible influences. The influence of Mental Illness toward Individual Factors
and Negative Spillover also warrants further exploration of the sequences or
progression of functioning after a mental illness, to understand the long-term
consequences and whether growth and insight can occur (Christopher, 2004),
whether a cycle of mental illness is inevitable and how spontaneous remission may
occur (Posternak & Miller, 2001). In this way, the interesting, puzzling positive

366
effects of mental illnesses in these longitudinal models may be better understood.
Rather than gain or loss spirals, there was another interesting set of reciprocal
relationships that can be seen between Positive Workplace Factors and Work
Engagement. As was shown in the factor score weights, Positive Workplace Factors
measures the individual‟s enjoyment of a job to which they are attached and which
provides them with control and creativity over their work, whilst work engagement is
largely the individual‟s dedication, zest and joy found in their work. What makes
these cross-lagged paths interesting and puzzling was that Positive Workplace
Factors added to future engagement in work but engagement in work does not add to
how the job is viewed and experienced in the future. There seems to be a
counterbalancing mechanism between the two that takes suggests that higher
engagement in work may deplete then individual‟s resources (energy, enthusiasm,
motivation), while on the other hand, the workplace is providing opportunities to
replenish those resources. However, this was different to the previous research that
had found gain spirals between efficacy beliefs and engagement in students (Llorens
et al., 2007). There were also separate gain spirals between work engagement and job
resources and work engagement and personal initiative among Finnish dentists when
measured over three years (Hakanen et al., 2008). The results of the models in the
current research however indicate that in the current research, there was not mutual
reinforcement between Positive Workplace Factors and Work Engagement rather
there are opposing forces.
Returning to the scales themselves may show some features that could give
rise to these unexpected results. The endorsement of the wording of work dedication
(Schaufeli et al., 2002) implies a state of high energy, of being enthusiastic, focused
and full of one‟s job. The endorsement of work absorption (Schaufeli et al., 2002)

367
has the same implication of becoming engrossed in work and not taking time out. As
noted in the CFAs, work engagement in the current thesis was found to be a
continuum from highly energetic to burnt out, going from high energy to exhaustion.
I would argue that for the individual who is agreeing strongly with the work
dedication and absorption scales is also likely to be overusing their mental and
physical energy in their engagement in work. The question would become then,
when does work engagement become problematic? What is it about highly dedicated
and absorbed employees that would lead to later reductions in the positive way that
they viewed their jobs? Also, what is the „cost‟ to mental and physical energy of
being highly engaged and dedicated to one‟s work?
There are some possible explanations in the literature to these questions,
which may operate separately or together. First, it could be expected that over
committed and highly engaged workers may be less inclined to switch off at night
and to keep working outside of their usual working hours. Sonnentag and colleagues
have recently shown that not detaching from work activities after hours leaves
individuals with insufficient recovery from their work, reducing well-being and
positive affect (Sonnentag & Bayer, 2006; Sonnentag & Zijlstra, 2006) and reducing
work engagement (Sonnentag, 2003). In addition, socialising on the weekend rebuilt
resources (Fritz & Sonnentag, 2005) as did relaxation or learning new skills during
vacations, whilst continuing to think about work increased exhaustion and
disengagement (Fritz & Sonnentag, 2006). It could be speculated that the work
engagement‟s negative effect on positive workplace factors in the models is mediated
by the highly engaged individual‟s lack of detachment from their interesting,
absorbing work which does not allow time for physical recovery and renewal or
involvement in other life roles.

368
Another possibility may come from an over-identification with work. Intense,
challenging interesting work can be seen as a reflection of one‟s identity, such that
working hard to succeed proves one‟s worth (Hewlett & Luce, 2006). Rather than
just pursuing financial success or materialism (Kasser & Ryan, 1993, 1996;
Nickerson et al., 2003), these „extreme‟ careers are personally motivating but involve
many long work hours and limit relationships and outside interests (Hewlett & Luce,
2006). Also, regardless of how much they enjoyed the challenges of their work, these
individuals did acknowledge that such intensity could not be sustained without cost
to their physical and mental health (Hewlett & Luce, 2006). Further, investing and
finding meaning in the accomplishments of one‟s work can be problematic where
there is not a balance between work efforts and the manageability of life overall.
Highly engaged community nurses were more likely to become fatigued and burnt
out where they were not able to delegate tasks, accept the standard of work of others
or use their coping resources to reflect on their situation. The nurses showed the
paradox of being engaged that unless it was balanced with the rest of their life, work
engagement would lead to burnout (Vinje & Mittelmark, 2007). Rather than only an
absorbing commitment and identity tied to work outcomes and accomplishments,
individuals can achieve a balanced commitment to their work by defining themselves
in other ways, while maintaining an interest and enthusiasm for their work (Hallsten,
1993). Teachers who were high in both resilience and engagement maintained the
greater levels of occupational well-being (i.e. less exhaustion and more job
satisfaction) and were rated as better teachers by their students than other teachers
low in either dimensions and particularly those who were low in both engagement
and resilience (Klusmann, Kunter, Trautwein, Ludtke, & Baumert, 2008b). From
these findings, it may not be that work engagement is problematic, rather that it may
369
not be balanced against all of the interests in individual‟s life.
Therefore, rather than the wholly positive conception of work engagement as
outlined by Schaufeli and colleagues (Schaufeli et al., 2002), I believe that the
longitudinal models have shown that high work engagement may be „too much of a
good thing‟ and represent a drain on mental and physical resources. Whether this
occurs from a lack of detachment and recovery from work or from over-
identification and absorption in work can not be determined from the current results.
However, these speculations may provide a basis for future research to understand
the mechanisms by which work engagement could have a downward influence on the
way that the workplace is viewed.
Another interesting aspect of the counterbalancing between the effects of
Positive Workplace Factors and Work Engagement across time may be that these
opposing influences may provide a mechanism whereby work engagement slides into
burnout. The net effect between the beta weights for positive workplace factors and
work engagement appeared to be (roughly) positive such that the enthusiasm for
good working conditions supports any loss of energy from being engaged in work.
However, should there be a change in working conditions (e.g. a new manager,
business conditions change or a new position) that altered the individual‟s enjoyment
of their work and then it is possible that the buffering that existed from Positive
Workplace Factors could be compromised. Maslach and Leiter proposed that burnout
results from work overload, lack of control, reward and fairness, loss of community,
and mismatch of values (Maslach & Leiter, 1997, 2008). Any loss of work
engagement could then escalate into burnout as a result, as the Positive Workplace
Factors were not sufficiently supportive to overcome the loss of energy that occurs.
The net effect over time would then become negative, leading to the erosion of

370
engagement and eventually to burnout. Whilst this is speculation, it is possible that
by following change in the workplace as it occurs, it may be possible to see this
process unfolding. By examining the steps between engagement and burnout, it may
be possible to see how the conditions of the workplace can buffer the individual or
hasten the onset of burnout.
3.7.7. Limitations and strengths of Study 2
The limitations and strengths of Study 2 are similar to those outlined for
Study 1. The sample is largely university educated and mostly female. Another
limitation may be that the time lag between data collection may not reflect the time
over which change naturally occurs. Longer time frames and more measurement
times would strengthen the longitudinal analyses and the understanding of the
dynamic influences unfolding over time. The selection of different predictor
variables from the pool of variables outlined in Study 1 may also yield different
outcomes. Future analyses should include different populations of working adults
(i.e. broader occupational groups and more males) and narrow the focus of
longitudinal modelling, by testing the significant predictors of each outcome, rather
than the broad approach taken in this research. Further, information from other
sources should be included to reduce the reliance on the individual s the only source
and over comes any problems with common method variance. The strength of the
longitudinal modelling was the high proportion of variance explained in the
composite variables, which indicated that the models were adequately explaining the
relationships present in the data. Further, there are enough participants to give the
analyses sufficient power to find the significant pathways and ensure the robustness
of the findings.

371
3.7.8 Conclusions
The Time 1 models, CFAs and longitudinal models show that the present, the
near and distant past are all important to understanding how the individual functions
now and into the future. Whilst the time frame of this thesis represent only a slice in
the passage of an individual‟s life, it gives some insight into processes that have no
clear beginning or end (Menard, 1991). The interactions between the variables in this
small time frame can provide a basis for understanding how the individual develops
over much longer time frames. In the Study of Adult Development (Vaillant, 2002),
there were no differences between the men from the ages of 25 to 45, but after that
time, the life paths diverged and clear differences were evident as a result of
psychological factors. Pessimistic men had poorer mental and physical health, more
stressful life events and died earlier (Peterson et al., 1988). By the end of their lives,
the individual with optimistic outlooks were much more likely to be classed as
„Happy and Well‟ and used mature defenses, were in good health, and had stable
marriages (Vaillant, 2002). These outcomes were the result of long standing patterns
of behaviour by the study participants and the advantages in old age were the results
of years of repeated, adaptive behaviours.
The reciprocal paths here represent mild to weak effects, which in substantive
terms would mean that these paths would have mild to negligible effects (Holmes-
Smith et al., 2006) and lack clinical significance (Kazdin, 2003) especially over the
time frame of the current analyses. However, as the literature has shown, individuals
have a lifespan to accumulate advantage and disadvantage and the small gains that
the models represent can eventually build into more resources that could be used to
meet the challenges of everyday lives. Individuals who are high in dispositional
optimistic and self-efficacy will contribute to their own resource accumulation over

372
time by their everyday behaviours, engaging in adaptive problem solving,
maintaining better relationships with family and friends, using humour and the other
strategies identified through the literature described previously. The resource
caravans ensure that the benefits of having resources accrue together and reinforce
each other over time. These individuals are generative, as Bronfenbrenner
(Bronfenbrenner & Morris, 1998, 2006) foresaw and competent development is the
result. Life is somewhat like an ocean liner that steams ahead and can only slowly
change its direction, but will eventually end up somewhere else rather than straight
ahead. The choices and behaviours that the individual makes every day may not
seem to be momentous, but the models and previous research would indicate that
these will add into a life time of resources that will confer advantages to
psychological functioning.
3.7.9 Indications for where to target future inventions
Another interesting outcome of the longitudinal models is that they indicate
where interventions may be made to improve psychological functioning. In
particular, the influences of Individual Factors and Negative Spillover on Mental
Illnesses could indicate that acting on the components of these factors could act as
leverage points for interventions to improve psychological functioning. For
example, as Individual Factors lead to decreases in Mental Illness over time, a
psychological program to bolster the components of Individual Factors would be
likely to enhance this effect. Likewise, organizational strategies could focus on
reducing the incidence of negative spillover, to improve later levels of mental health.
From the multiple regressions, negative spillover (particularly work-to-family) was
reduced by greater managerial support for work-life issues and general social support
at work and more egalitarian gender role attitudes.

373
Taking the results of Studies 1 and 2, with the results of a workplace
resilience building program (for example, the PAR program (Liossis, Shochet,
Millear, & Biggs, 2009; Millear, Liossis, Shochet, Biggs, & Donald, 2008)), future
preventative mental health programs can be used to target the various important
components that have been identified by the research. Understanding which variables
are influential over time, are important for future well-being, mental health and
burnout prevention programs. The current research indicated that both the individual
and the employer can take steps to improve employee conditions. By strengthening
the individual and giving employers the tools to improve employee conditions, future
prevention programs and intervention strategies can be used to improve the well-
being, mental health and work engagement of working adults.

374

375
Chapter 4: Discussion of research findings and conclusions
The research program for the current thesis has been successfully based on
Bronfenbrenner‟s developmental equation, D f PPCT (Bronfenbrenner & Morris,
1998). Competent development has been shown to be the result of effective and
meaningful interactions between the generative individual and a supportive
environmental context that continue over time. Across the three studies, the person,
context and time components of the equation has been explored, highlighting their
significance toward understanding what leads to successful, competent development.
In the current research, this competent development has been measured by greater
well-being (higher life satisfaction and greater psychological well-being), better
mental health (as the absence of depression, anxiety and stress) and being
engagement in one‟s work (which includes the absence of burnout).
The two studies examined the working adult in cross-section and in the
longer term. Study 1 and 2 were linked through the use of the same sample of
participants. Study 1 was a cross-sectional survey of working adults and Study 2 was
a prospective panel study that built upon the initial wave of data collection. Study 1
identified a group of the most frequent, significant predictors of the outcomes, which
formed the basis of the longitudinal modelling. The significant predictors represented
the person and context components of the developmental equation, with the
modelling in Study 2 showing the stability and change of the outcomes, person and
context variables over time, therefore encapsulating all of the developmental
equation.
This chapter will first summarise which of the predictor variables were
important to capture each part of Bronfenbrenner‟s developmental equation. The
major findings of the research will then be considered, followed by the applications

376
of the research, the limitations and strengths of the research and finally, the future
directions for research.
4.1 The developmental equation, D f PPCT
The discussion of the research will start with considering how well the
framework of Bronfenbrenner‟s equation served as the basis for the research
program. That the „letters‟ contributed to a better understanding of psychological
functioning and development shows that this theoretical approach is a valid
framework in which to examine the life of working adults. The research program has
been able to show the most important parts of the Person, Context and Time
components of the developmental equation, D f PPCT to achieving the highest levels
of psychological functioning. Each of the outcomes had a mosaic of predictor
variables and the significant predictors will be considered in light of each of the parts
of the equation.
4.1.1 P, the person: The generative disposition
In Study1, the hierarchical multiple regressions found that dispositional
optimism and coping self-efficacy were central to predicting the many outcomes.
Dispositional optimism, in particular, was a powerful resource that underpinned the
breadth of psychological functioning. Study 2 further showed the importance of the
person over time as the predictors of both Individual Factors and Overall Well-Being
were entwined at each time and reinforced each other over time with Individual
Factors also leading to decreases in Mental Illness over time.
4.1.2 P, the person: Their demand characteristics
Rather than acting as separate influences in Study 1, humour as a coping
strategy was found to be completely mediated by optimism and self-efficacy, rather
than act as a significant predictor on its own. As such, humour could best be

377
considered as part of the suite of behaviours that could be used by a person who was
optimistic and had high self-efficacy rather than separate abilities to manage
distressing situations.
4.1.3 C, the context.
In Study 1, the significant contextual predictors of the outcomes came from
having more workplace resources and less negative spillover in both directions
between work and family roles. Being attached to a job that allowed the individual to
use their skills and abilities and allowed input into decision making were the
important workplace resources. However, negative work-to-family spillover, in
particular, mediated between the outcomes and feeling in control of time and not
feeling busy, having egalitarian gender role attitudes, more managerial support for
work-life issues and social support from supervisors and co-workers generally. In
Study 2, Positive Workplace Factors positively influenced Work Engagement over
time, but did not impact on Overall Well-Being or Mental Illness, whereas Negative
Spillover dampened Overall Well-Being and increased Mental Illness over time.
4.1.4 T, Time.
In Study 1, time was not overtly considered but in Study 2, the longitudinal
modelling allowed cause and effect over time to be established and gain and loss
spirals to be seen. For example, Individual Factors and Overall Well-Being were
closely aligned at each time and give mutual reinforcement over time, leading to a
gain spiral in personal resources. Positive Workplace Factors boosted Work
Engagement but Work Engagement dampened Positive Workplace Factors over time
which would indicate that being highly engaged in work has detrimental effects in
the longer term unless workplace conditions can offset any losses in dedication and
enthusiasm for work. Overall there was a slight positive drift over time, when all the
378
variables were considered together in the Integrated longitudinal model. The
longitudinal models showed that there are leverage points for mental health
interventions which could be targeted by workplace mental health programs.
4.1.5 Summary of D f PPCT.
By taking control of their own life, the individual can craft a life path that is
most suited to their own needs. Competent developmental outcomes were most likely
where the person was optimistic and had high self-efficacy, worked in a job that they
were attached to and which allowed them to use their talents and without too much
negative spillover between their work and family domains. Over time, there was
evidence of both gain and loss spirals in resources. In this way, individuals had
greater well-being, better mental health and greater work engagement at any one time
and across time, although there were some indications that excessive work
engagement could be problematic in the long term.
4.2 Major findings
Bronfenbrenner‟s developmental equation has been very useful in framing the
research on the working adult and the previous section has illustrated the important
points around each of the equation‟s parts. In addition, the research program has a
number of major findings and some interesting „non-findings‟ that will be discussed
in more detail.
The most important finding to me is the confirmation that the „active person‟
is central to the way that life is lived, as shown in previous research (Carver &
Scheier, 1998; Thoits, 1994). Research about the work-life interface that focused
primarily on the conditions of work, family characteristics or spillover between roles
has missed the most important ingredient, that of the person who is „doing‟ that
work-life interaction. In both studies, the individual is strongly represented as the

379
main driver of how life is experienced and not as a passive recipient of working
conditions or spillover between roles. Study 1 and 2 measured individual differences
among larger samples to understand the underlying relationships at one time and
across time. Throughout the research, the importance of the individual in their own
life is highlighted, first by their actions on job and life choices and second, as an
optimistic active person predicting greater well-being and better mental health at the
same time and across time, with mutual reinforcement. The active person can design
their own life by being organized and choosing jobs that suit themselves and their
families, using humour and being reasonable with their time and energy.
Why are dispositional optimism (in particular) and coping self-efficacy such
powerful personal resources? Optimism is linked to better problem solving,
persistence toward solvable goals and more pleasant interpersonal relationships
(Armor & Taylor, 1998; Aspinwall & Brunhart, 2000; Scheier et al., 1994) and being
proactive toward the future (Aspinwall, 2005; Aspinwall & Taylor, 1997). In solving
anagrams, optimists used problem-focused coping rather than avoidance coping to
reduce their stress levels whereas pessimists adopted avoidant strategies that did not
reduce their stress levels (Iwanaga et al., 2004). Optimism is seen as flexible self-
regulation that adapts and manages the changes that occur around the individual,
foreseeing possible problems in the future and preparing for what is ahead by using
proactive coping (Aspinwall & Taylor, 1997).
Optimism and self-efficacy appear to be habitual ways of thinking and
responding to challenges that are over-learnt, in the way that well learnt skills
become automatic. I would argue that the habits of problem solving and adaptability,
inherent in the optimistic way of doing things are so well learnt in everyday
situations that when something difficult happens, such as sudden job loss or financial

380
problems, the response is automatic and adaptive. In the way that sports people,
soldiers and firemen train for the heat of competition or battle or an emergency, the
optimistic individual will respond to confronting problems in the habitual way that
they usually do, so that they can solve problems they face or accept the inevitable.
Masten and Reed (2002) differentiated resilient and maladaptive children on the
basis of two dimensions of competence (competent or vulnerable) and adversity
(high or low). In situations of high adversity, competent children became resilient,
whilst vulnerable children behaved maladaptively. It is reasonable to expect that
competent adults, as defined by Bronfenbrenner‟s developmental equation
(Bronfenbrenner & Morris, 1998) and represented by dispositional optimism and
coping self-efficacy would also act resiliently when they faced challenges in their
lives. The usual habits of a competent life can then translate into a resilient
personality when faced with adversity, providing resources and reserves to overcome
losses. The results of the analyses and of the PAR program show that preventative
programs should be directed to improve individual functioning and that these
valuable, resilient skills can be taught.
The second group of major findings comes from the longitudinal models.
Using and extending previous research from Europe (for example, de Jonge et al.,
2001; Demerouti, Bakker et al., 2004; Llorens et al., 2007), the longitudinal models
in the current thesis are a novel extension to previous analytic processes. Removing
trivial paths in the models has clarified the influential pathways and allows the
analyses to move beyond accepting and interpreting the best fitting model. The
analytic process leading up to and including the final longitudinal models has given a
number of important findings. First is the close link between the individual and well-
being at any time and across time; second is the net effect between the individual and

381
negative spillover on mental illness; and third is the exploration of work
engagement-burnout continuum and the effects of work engagement on workplace
resources.
The confirmatory factor analyses generated the factor score weights to
calculate the composite variables used for the longitudinal models and provided
insight into the underlying relationships between the indicator variables. The
calculations for the composite variables, Individual Factors and Overall-Well-Being
showed that dispositional optimism, life satisfaction, psychological well-being and
coping self-efficacy are entwined to the extent that all occur together, although in
differing combinations in the calculations of the respective composite variables. This
is an interesting result as the causal „arrow‟ is nearly always that dispositional
optimism leads to greater well-being rather than these co-occurring. In addition to the
cross-loadings in their calculations, the longitudinal analyses also showed that there
was reinforcement between Individual Factors and Overall Well-Being over time as a
gain spiral of resources. The strong links between individual differences and well-
being provide a mechanism for resource caravans (Hobfoll, 2002) to be established
and maintained over time. Following on from the conclusions about dispositional
optimism and coping self-efficacy as resources, well-being becomes tied to how the
individual views themselves rather than only as a summation of satisfaction with life
domains (Easterlin, 2006), which accords with previous research (Leonardi,
Sopazzafumo, & Marcellini, 2005; Shmotkin, 2005).
Whilst Individual Factors has mutually beneficial effect on well-being, it also
reduces the level of mental illness an individual experiences across time. In contrast,
Negative Spillover, measuring the problems and tiredness that flowed between roles,
had a consistently negative effect on mental illness over time. The net effect of

382
Individual Factors and Negative Spillover on Mental Illness over time was slightly
positive, i.e. the individual had less mental illness. In addition there was another
intriguing finding: Mental Illness at Time 1 had positive effects at Time 2, by adding
to Individual Factors (i.e. increasing dispositional optimism and well-being) and
reducing negative spillover. I can only speculate that this counterintuitive result was
linked to the milder levels of mental illness among the participants and that they have
used their experiences to gain insight into themselves. In addition, mental illnesses
were not strongly persistent over time which may explain why individuals with
depression may have spontaneous remission (Christopher, 2004). Further research is
necessary to understand the experiences of mildly depressed individuals, whether
their depression would intensify or dissipate over time and what the influences on
this process may be.
Possibly the most unexpected results were the confirmatory factor analyses of
burnout and work engagement. The Utrecht Work Engagement Scale (Schaufeli et
al., 2002) was developed and proposed to be distinct from the Maslach Burnout
Inventory (Maslach et al., 1996) but in the current research, the two scales could not
be used as separate scales in the same analysis. Unlike the two factors found in
European research (for example, Schaufeli & Bakker, 2004; Schaufeli et al., 2008),
the current results showed that engagement and burnout were opposite ends of a
single factor or continuum. The single factor is in accordance with the alternative
way that burnout and work engagement are seen by Maslach and colleagues (2001).
When the two scales were used together in the Work Engagement and Integrated
longitudinal models, the solution was inadmissible and could not be improved. The
Burnout and Work Engagement scales were therefore reduced to a single
combination of Work Engagement, being defined as work dedication, work

383
absorption and professional efficacy. In the Well-Being and Mental Distress
longitudinal models, the scales were used separately (as Work Well-Being and
Burnout, respectively) and successfully in the models.
After establishing work engagement as a single factor, the calculations of the
composite variables for the longitudinal models brought another interesting cross-
loading between work dedication (capturing the zest and enthusiasm for work) and
the workplace resources. From the factor score weights, Work Engagement was
largely due to work dedication, the enthusiasm and zest for work. The interesting link
however was that Positive Workplace Factors relied not only on the workplace
resources but was again strongly influenced by the individual‟s enjoyment of their
work. As such, greater dedication or enthusiasm for work was likely to occur in jobs
which the individual is attached to and which allow the individual to use their talents
and make their own decisions, a somewhat circular argument. These links make the
results of the longitudinal modelling more complex to understand. As noted in the
section on Time, Positive Workplace Factors consistently boosted Work Engagement
over time yet Work Engagement dampened Positive Workplace Factors. This
counterbalancing suggests that being constantly highly engaged in work is not
necessarily beneficial to the individual and may be „too much of a good thing‟.
Further, the counterbalancing may provide a mechanism for the loss of engagement
to lead to burnout. If the buffering offered by the Positive Workplace Factors is lost
by worsening job conditions (e.g. a new manager or new corporate structures), the
downward pressure from over commitment to work will not be countered, leading
possibly to burnout. Work dedication appears to have mostly positive effects on the
individual, by supporting appreciation of working conditions but balanced against
too much involvement and absorption in work that may run down physical and

384
mental reserves. The mind-body connection was beyond the scope of the current
study but should be considered in future research of work engagement.
4.3 Interesting non-findings
There were a number of findings that were interesting because they were not
significant. Firstly, gender was not a significant predictor of the outcomes with the
only difference being that women enjoyed their work more than men. Given the
breadth of the outcomes measured and the diversity of predictors included in the
analyses, it can be concluded that men and women in the current sample do not differ
on important aspects of psychological functioning. They may have differently shaped
lives with different work hours and caring responsibilities, but they are neither more
nor less satisfied with their lives and have similar levels of psychological well-being,
work engagement and burnout. Perhaps more important than gender per se was
having an egalitarian gender role attitude, which were important to how much
negative work-to-family spillover the individual experienced. Without the fairness
implicit in egalitarianism, the individual experiences more negative work-to-family
spillover which was a significant predictor of many outcomes, including emotional
exhaustion and cynicism. Including gender role attitudes in future research would
shed more light on how egalitarian attitudes toward gender protect against negative
spillover. Further, the loss of fairness in the workplace is linked to increased burnout
(Maslach, 2006; Maslach & Leiter, 1997) and it would be useful to compare fairness
with egalitarian gender role attitudes, to understand the similarities and differences
between the two constructs.
Second, the presence of children did not negatively impact on their parents by
reducing psychological functioning compared to non-parents. Indeed for cynicism,
children provided a buffer toward its incidence and the greater family demands from

385
younger children protected against anxiety. Both outcomes may be due to younger
and more children providing an alternative view and value to life that is not
contingent on work. Parental role commitment, even among individuals who did not
have children themselves, was a significant predictor of life satisfaction and
psychological well-being. The value of children, present or future, should be
considered in future research to understand if children and the perception of the
parental role is linked to the developmental of generativity (McAdam et al., 1993),
an important psychosocial outcome linked to mentoring the next generation.
Contrary to the headlines in the popular press, the length of the working week
was not of particular importance to any of the outcomes. In the current sample, hours
could not be considered responsible for any „unexpected tragedy‟ (Relationships
Forum Australia, 2007) or part of any „work-life collision‟ (Pocock, 2003). Working
hours was only a predictor of work vigour and only in the presence of suppressor
variables. The analyses found that it is the nature of the working conditions that is far
more important to understanding the individual‟s life that simply the hours they
work. As noted in Chapter 3, an hour in a job you do not like is too long, whilst 60
hours in an interesting, challenging and absorbing job may fly past. High levels of
work engagement may be problematic as noted in the longitudinal models but is
more important to consider engagement and workplace conditions rather than
looking at hours alone. Jobs come in many shapes and sizes, with differing
combinations of interest, challenge, workplace resources and annoyances, and hours
alone do not capture the complexity of the workplace experience.
4.4 Applications of the research
The research program has shown the importance of each part of
Bronfenbrenner‟s developmental equation. Both the multiple regressions and the

386
longitudinal studies offered insight into the leverage points at which personal,
psychological, or managerial changes could be targeted. In both analyses, the results
have identified that bolstering the individual, improving workplace conditions and
minimising negative spillover will each have influences on increasing well-being,
mental health and work engagement immediately and into the future. In research that
I have been concurrently involved with, the Promoting Adult Resilience (PAR)
program targeted the leverage points identified in Studies 1 and 2 to target the
individual‟s strengths. In doing so, coping self-efficacy was increased and
maintained over time, in addition to reducing stress and depression and increasing
work-life fit over time among resource sector employees (Millear et al., 2008). A
second, shorter trial of the PAR program was undertaken with similar results among
government employees (Liossis et al., 2009).
Workplace resources were both directly and indirectly important to the
outcomes. The direct effects have been shown with the Positive Workplace Factors
and the indirect effect is those variables that were mediated by negative work-to-
family spillover. The effects of job social support generally and managerial support
for work-life issues were mediated by negative work-to-family spillover. Both forms
of support are more responsive to the direct efforts of supervisors and managers than
as a general corporate culture (T. D. Allen, 2001; Behson, 2002; C. A. Thompson et
al., 1999), indicating that this is an important and effective area that employers can
directly support and encourage among their staff. Taking steps to minimise negative
work-to-family spillover would benefit the employer by reducing losses due to
mental illness, through the lost productivity from absenteeism and presenteeism
(Andrews et al., 2001; Hawthorne et al., 2003). Minimising negative work-to-family
spillover benefits the employee by increasing job satisfaction, work engagement and
387
reducing the burden of mental illness and burnout.
An extension of the considerations of the workplace resources, job autonomy
and skill discretion, is the recognition that an individual can face the conflict between
their employer‟s need for flexibility in their commercial operations and the
individual‟s need for flexibility in their own interests (Costa & Sartori, 2005). This
conflict can lead to more negative spillover as well, when managers do not support
their employees‟ family and life requirements (C. A. Thompson et al., 1999). In a
globally competitive marketplace, organizations may need to be open for business
„24/7‟ to be responsive to customers‟ needs and to be competitive. Employees are
expected to be responsive to change, constantly available and are often paid
extremely large salaries for their work (Hewlett & Luce, 2006). The attractions of
ambition, status and income do not change that these intense working conditions can
leave little time for personal matters. On the other hand are the jobs that are
personally flexible, such that the individual is more available for their families and
responsive to family‟s changing needs (Costa & Sartori, 2005). However, these jobs
are less likely to be highly paid and can limit career opportunities and can be
resented by other employees if someone has to cover for the employee‟s absence (C.
A. Thompson et al., 1999). In counselling individuals who may be faced with the
dilemma of organisational versus personal flexibility, it would be helpful to take into
account personal ambition, such that individuals can come to recognise their own
level of ambition, which could „drive‟ them to work long hours. Gaining a greater
understanding of their own needs and values allowed the participants to chose jobs or
craft careers that were challenging and interesting but not onerous. Designing
individual therapy programs or more general prevention programs should take into
account the individual‟s needs in the context of the flexibility that their work

388
provides. A proviso however should be a recognition that ambition exists and that
working long hours need not be problematic if it is in balance with the individuals‟
other interests and concerns.
The results of the research highlight that interventions for the individual and
the workplace are important to sound psychological functioning. Interventions that
bolster the individual can sit alongside managerial actions that promote workplaces
where jobs provide resources that increase work engagement and limit negative
spillover between work and family roles. Managers can use these results to direct
their efforts to support their employees‟ work-life choices through the structure and
content of their jobs, to the benefit of both parties.
4.5 Future research
The research program of the current thesis has answered many questions but
more questions have arisen. As noted previously in this chapter, egalitarian gender
roles and their links to negative work-to-family spillover and burnout warrant further
research to better understand the linkages, whilst children, present and future, and
parent role commitment provide an interesting possible connection with the
development of generativity. The counterintuitive finding of mental illness can boost
the individual and reduce negative spillover opens up a window on the reasons why
an individual may recovery from a mental illness without intervention and may be
linked to post-traumatic growth. Of further research interest is the lack of persistence
of mental illness over time in contrast to the strength of the effect of well-being over
time. This could be studied by a longitudinal study that involved diaries, more
frequent measurement times or interviews with individuals that followed mildly or
moderately depressed individuals to assess the way that depression or stress unfold
and may be resolved over time.

389
The close linkages between individual differences and well-being warrant
further investigation to understand how these are interwoven and how they contribute
to resource caravans. In the context of a lifespan, understanding the mechanism for
accumulating advantages for a successful old age are important as the population is
aging. Hobfoll‟s Conservation of Resources (Hobfoll, 1989, 2001, 2002) theory has
been a very useful addition to the research by focusing attention on the gain and loss
of resources over time. The next phase of research would be a longitudinal study that
links behaviours and affect of dispositional optimism with well-being, using event
sampling, diaries or interviews to capture how the mutual reinforcement is occurring.
Another area where close linkages were seen was between work dedication
and the workplace resources. Future research is necessary to understand at which
point high levels of work engagement becomes problematic taking into account
personal preferences (including ambition and individual differences) for work and
family. Recent research has included the calculation of curvilinear effects for the risk
assessment of work-related health (Karanika-Murray, Antoniou, Michaelides, &
Cox, 2009) which has increased the variance explained by the analyses. Including
curvilinear effects may allow closer examination of work engagement to assess
whether higher levels are „too much of a good thing‟. There is limited evidence of
cross-sectional curvilinear effects but not in longitudinal analyses of the effects of
job characteristics (de Jonge & Schaufeli, 1998) but this research did not include
work engagement.
Further research is also needed to better understand the factorial relationships
between burnout and work engagement and why the results of the current thesis
diverge from the published European research. It is possible that the diversity of
occupations on the current sample has diffused some unaccounted or unknown

390
occupational factor that is salient for the helping professions (for example, police and
health care workers used in previous research) but which is not as salient across
occupations more generally. One example could be the importance of decisions that
are involved in a job. For example a nurse making a mistake may seriously harm a
patient, whereas a salesperson making a mistake only annoys their customer. To
explore this possibility, comparing occupational work pressures (for example, task
emotiveness and responsibility for others; Roe & Zijlstra, 2000) may tease out
whether the importance of the decisions that the job requires influences the factorial
structure of burnout and work engagement. More critical responsibilities and risks in
a job (e.g. as a policeman or nurse) that lacks adequate supports may make the
change from burnout to work engagement more sudden than the linear decline
implied by a single factor or the curvilinear possibilities mentioned in the previous
paragraph. A possible framework for work engagement to burnout could be a
nonlinear, cusp catastrophe as proposed by Carver and Scheier (1998, p297) to
explain persistence toward goals. For work engagement, the change from
engagement to burnout (a large drop in engagement) would come from only a small
reduction in resources and can be thought of as the „straw that broke the camel‟s
back‟. Figure 4.1 shows the possible relationships between the individual‟s resources
(x-axis) and their engagement (z-axis) which would change with the importance of a
task or work (y-axis). At low importance or pressure from work decisions (i.e. low
„risk‟ occupations), there is a continuous relationship between resources and
engagement (Path B on Figure 4.1). In contrast, when the occupation has high
importance or pressure for decisions (i.e. high „risk‟ occupations), the relationship
could become suddenly discontinuous (i.e. the cusp or „fold‟ between work
engagement and burnout) (Path A in Figure 4.1). Work engagement would change to

391
Figure 4.1
Proposed cusp catastrophe for the relationship between work engagement and
burnout. Diagram from http://users.fmg.uva.nl/hvandermaas/cusp.GIF
burnout very suddenly rather than a gradual decline implied by the continuum of
Path B. High engagement (high scores on x, y and z axes) would be evident in
individuals more personal and workplace resources, even where occupations are
more challenging (high scores on x and y axes, lower scores on z axis). However, the
loss of confidence would be seen to have different effects in different types of
occupations, being more sudden in more pressured jobs, leading to burnout (low
scores on x, y and z axes). Research is necessary to test this proposal by finding the
quantitative differences in work pressure across occupations which can then test the
way the burnout develops from work engagement, either as a steady progression or a
sudden change. The steady progression would represent the back surface as work
engagement peters out into burnout. The sudden change from engaged to burnout

392
would be represented by the cusp catastrophe (i.e. the fold) at the front of the surface.
Understanding the progression of work engagement to burnout will further inform
psychological and managerial practices to prevent burnout developing in the future.
Negative spillover between work and family domains proved to be important
with strong and pervasive negative effects on the outcomes. There was evidence of
both mediation and moderation involving negative spillover that warrants further
investigation, as does the link between negative spillover and exhaustion which may
indicate that the effect of burnout is not confined to feelings about work but the
family domain as well. It was interesting that positive and negative spillover were
not particularly related in the current data which limits conclusions about work-life
balance being the sum of positive and negative spillover. It may be useful in future
research to consider these as having separate, unrelated effects rather than
complementary effects. Future research should also consider that although negative
spillover was important, it was buffered by the presence of personal resources and
the absence of workplace resources. It would be useful to establish the level of
resources a person can have before they are overwhelmed by negative spillover and
these findings could be added to psychological and managerial practices to buffer the
individual from negative spillover.
A last area for future research to be considered is to gain a better
understanding of positive spillover. The predictors of positive work-to-family
spillover were the same workplace resources that led to more competent
development and show similarities to Greenhaus and Powell‟s (2006) recent
theorising on work-family enrichment. The workplace resources are possibly
indicative of the beneficial, affective path between work and family roles and future
research can extend on this platform to understand how the workplace resources

393
transfer positive affect to the family domain. Positive family-to-work spillover
captured the support from home that encourages the individual at work and was an
important predictor of life satisfaction and psychological well-being. Research could
be extended to understand the overlap between positive family-to-work spillover and
other forms of social support generally.
4.6 A final word
Study 1 found generally that the best psychological outcomes were more
likely when the individual is optimistic and confident in themselves, works in a job
that they are attached to and that allows them to decide how to use their talents and
skills and where there are lower levels of negative spillover between their work and
family roles. Study 2 added to this by showing the linkages and influences between
personal and workplace resources, negative spillover and psychological functioning
over time. There are many folk sayings about personal mastery but perhaps the Dalai
Lama said it most succinctly, „happiness is not ready made, it is the result of our
actions‟. My final word of this thesis is that you should be active in your own life
with all its ups and downs, it is the only one you have.

394

395
References
Abbe, A., Tkack, C., & Lyubormirsky, S. (2003). The art of living by dispositionally
happy people. Journal of Happiness Studies, 4, 385-404.
Abel, M. H. (2002). Humor, stress, and coping strategies. Humor, 15(4), 365-381.
Abel, M. H., & Maxwell, D. (2002). Humor and affective consequences of a stressful
task. Journal of Social and Clinical Psychology, 21(2), 165-190.
Abramson, L. Y., Metalsky, G. I., & Alloy, L. B. (1989). Hopelessness depression: A
theory-based sub-type of depression. Psychological Review, 96(2), 358-372.
Adams, G. A., & Jex, S. M. (1999). Relationships between time management,
control, work-family conflict, and strain. Journal of Occupational Health
Psychology, 4(1), 72-77.
Adler, N. E., Boyce, T., Chesney, M. A., Cohen, S., Folkman, S., Kahn, R. L., et al.
(1994). Socioeconomic status and health: The challenge of the gradient.
American Psychologist, 49(1), 15-24.
Akerboom, S., & Maes, S. (2006). Beyond demand and control: The contributions of
organizational risk factors in assessing the psychological well-being of health
care employees. Work and Stress, 20(1), 21-36.
Allen, N. J., & Meyer, J. P. (1990). The measurement and antecedents of affective,
continuance, and normative commitment to the organization. Journal of
Occupational Psychology, 63(1), 1-18.
Allen, T. D. (2001). Family-supportive work environments: The role organizational
perceptions. Journal of Vocational Behavior, 58, 414-435.
Allen, T. R., Herst, D. E. L., Bruck, C. S., & Sutton, M. (2000). Consequences
associated with work-to-family conflict: A review and agenda for future
research. Journal of Occupational Health Psychology, 5(2), 278-308.
Alloy, L. B., Abramson, L. Y., Hogan, M. E., Whitehouse, W. G., Rose, D. T.,
Robinson, M. S., et al. (2000). The Temple-Wisconsin Cognitive
Vulnerability to Depression Project: Lifetime history of Axis I
psychopathology in individuals at high and low cognitive risk of depression.
Journal of Abnormal Psychology, 109(3), 403-418.
Alloy, L. B., Abramson, L. Y., Whitehouse, W. G., Hogan, M. E., Tashman, N. A.,
Steinberg, D. L., et al. (1999). Depressogenic cognitive styles: Predictive
validity, information processing and personality characteristics, and

396
developmental origins. Behaviour Research and Therapy, 37, 503-531.
Amatea, E. S., Cross, E. G., Clark, J. E., & Bobby, C. L. (1986). Assessing the work
and family role expectations of career-orientated men and women: The Life
Role Salience Scales. Journal of Marriage & the Family, 48(4), 831-838.
American Psychiatric Association (2000). Diagnostic and Statistical Manual of
Mental Disorders (DSM-IV-TR). Journal. Retrieved from
www.psychiatryonline.com
American Psychiatric Association. (2009). Appendix B: Proposed axes for future
study: Defensive functioning scale. Retrieved 12 February 2009, from
www.psychiatryonline.com
Anderson, S. E., Coffey, B. S., & Byerly, R. T. (2002). Formal organizational
initiatives and informal workplace practices: Links to work-family conflict
and job-related outcomes. Journal of Management, 28(6), 787-810.
Anderson, T., & Kanuka, H. (2003). E-Research: Methods, strategies and issues.
Boston: Allyn and Bacon.
Andrews, G., Henderson, S., & Hall, W. (2001). Prevalence, comorbidity, disability
and service utilization: Overview of the Australian National Mental Health
survey. British Journal of Psychology, 178( ), 145-153.
Arbuckle, J. L. (2006). AMOS 7.0 Spring House, PA: Amos Development
Corporation.
Armor, D. A., & Sackett, A. M. (2006). Accuracy, error, and bias in predictions for
real versus hypothetical events. Journal of Personality and Social
Psychology, 91(4), 583-600.
Armor, D. A., & Taylor, S. E. (1998). Situated optimism: Specific outcome
expectancies and self-regulation. In M. P. Zanna (Ed.), Advances in
experimental social psychology (Vol. 30, pp. 309-379). San Diego: Academic
Press.
Arthaud-Day, M. L., Rode, J. C., Mooney, C. H., & Near, J. P. (2005). The
subjective well-being construct: A test of its convergent, discriminant, and
factorial validity. Social Indicators Research, 74, 445-476.
Aryee, S., Luk, V., Leung, A., & Lo, S. (1999). Role stressors, interrole conflict, and
well-being: The moderating influence of spousal support and coping
behaviors among employed parents in Hong Kong. Journal of Vocational
Behavior, 54, 259-278.
397
Aryee, S., Srinivas, E. S., & Tan, H. H. (2005). Rhythms of life: Antecedents and
outcomes of work-family balance in employed parents. Journal of Applied
Psychology, 90(1), 132-146.
Aspinwall, L. G. (2001). Dealing with adversity: Self-regulation, coping, adaptation,
and health. In A. Tesser & N. Schwarz (Eds.), Blackwell handbook of social
psychology: Intraindividual processes (pp. 591-614). Malden, MA:
Blackwell Publishers.
Aspinwall, L. G. (2005). The psychology of future-orientated thinking: From
achievement to proactive coping, adaptation and aging. Motivation and
Emotion, 29(4), 203-235.
Aspinwall, L. G., & Brunhart, S. M. (2000). What I do know won't hurt me:
Optimism, attention to negative information, coping, and health. In J. E.
Gillham (Ed.), The science of optimism and hope (pp. 163-200). Philadelphia:
Templeton Foundation Press.
Aspinwall, L. G., & Richter, L. (1999). Optimism and self-mastery predict more
rapid disengagement form unsolvable tasks in the presence of alternatives.
Motivation and Emotion, 23(3), 221-245.
Aspinwall, L. G., Richter, L., & Hoffman, R. R. (2002). Understanding how
optimism works: An examination of optimists' adaptive moderation of belief
and behavior. In E. C. Chang (Ed.), Optimism and pessimism. Implications of
theory research. (pp. 217-238). Washington, D.C.: American Psychological
Association.
Aspinwall, L. G., & Taylor, S. E. (1997). A stitch in time: Self-regulation and
proactive coping. Psychological Bulletin, 121(3), 417-436.
Atienza, A. A., Stephens, M. A. P., & Townsend, A. L. (2004). Role stressors as
predictors of changes in women's optimistic expectations. Personality and
Individual Differences, 37(3), 471-484.
Australian Bureau of Statistics. (2006a). Australian social trends. Canberra,
Australia: Commonwealth of Australia.
Australian Bureau of Statistics. (2006b). Patterns of internet access in Australia (No.
8146.0.55.001). Canberra, Australia: Commonwealth of Australia.
Australian Bureau of Statistics. (2007). Household use of information technology,
Australia 2006-07. Canberra, Australia: Commonwealth of Australia.
Baard, P. P., Deci, E. L., & Ryan, R. M. (2004). Intrinsic need satisfaction: A

398
motivational basis of performance and well-being in two work settings.
Journal of Applied Social Psychology, 34(10), 2045-2068.
Bagger, J., Li, A., & Gutek, B. A. (2008). How much do you value your family and
does it matter? The joint effects of family identity salience, family-
interference-with-work, and gender. Human Relations, 61(2), 187-211.
Bakker, A. B. (2005). Flow among music teachers and their students: The crossover
of peak experiences. Journal of Vocational Behavior, 66, 26-44.
Bakker, A. B., Demerouti, E., & Euwema, M. C. (2005). Job resources buffer the
impact of job demands on burnout. Journal of Occupational Health
Psychology, 10(2), 170-180.
Bakker, A. B., Demerouti, E., & Schaufeli, W. B. (2003). Dual processes at work in
a call centre: An application of the job demand-resources model. European
Journal of Work and Organizational Psychology, 12(4), 393-417.
Bakker, A. B., Demerouti, E., & Verbeke, W. (2004). Using the Job Demands-
Resources model to predict burnout and performance. Human Resource
Management, 43(1), 83-104.
Bakker, A. B., & Geurts, S. (2004). Toward a dual-process model of work-home
interference. Work and Occupations, 31(3), 345-366.
Bakker, A. B., Hakanen, J. J., Demerouti, E., & Xanthopoulou, D. (2007). Job
resources boost work engagement, particularly when job demands are high.
Journal of Educational Psychology, 99(2), 274-284.
Bakker, A. B., van Emmerik, H., & Euwema, M. C. (2006). Crossover of burnout
and engagement in work teams. Work and Occupations, 33(4), 464-489.
Baldock, J., & Hadlow, J. (2004). Managing the family: Productivity, scheduling and
the male veto. Social Policy and Administration, 38(6), 706-720.
Baltes, P. B. (1997). On the incomplete architecture of human ontogeny: Selection,
optimization, and compensation as foundation of developmental theory.
American Psychologist, 52(4), 366-380.
Baltes, P. B., Lindberger, U., & Staudinger, U. M. (1998). Life-span theory in
developmental psychology. In W. Damon & R. M. Lerner (Eds.), Handbook
of Child Psychology (5th ed., Vol. 1, pp. 1029-1143). New York: John Wiley
& Sons.
Baltes, P. B., Lindberger, U., & Staudinger, U. M. (2006). Life span theory in
developmental psychology. In R. M. Lerner (Ed.), Handbook of child

399
psychology (6th ed., Vol. 1, pp. 569-664). Hoboken, NJ: John Wiley & Sons.
Bandura, A. (1986). Social foundations of thought and action: A social cognitive
theory. Englewood Cliffs, N.J.: Prentice-Hall.
Bandura, A. (1997). Self-efficacy, the exercise of control. New York: W.H. Freeman
and Company.
Bandura, A. (2001). Social cognitive theory: An agentic perspective. Annual Review
of Psychology, 52, 1-26.
Bandura, A. (2005). The primacy of self-regulation in health promotion. Applied
Psychology: An International Review, 54(2), 245-254.
Bandura, A., Bardaranelli, C., Caprara, G. V., & Pastorelli, C. (1996). Multifaceted
impact of self-efficacy beliefs on academic functioning. Child Development,
67, 1206-1222.
Barling, J., & Mendelson, M. B. (1999). Parents' job insecurity affects children's
grade performance through the indirect effects of beliefs in an unjust world
and negative mood. Journal of Occupational Health Psychology, 4(4), 347-
355.
Barnett, R. C. (1998). Toward a review and reconceptualization of the work-family
literature. Genetic, Social and General Psychology Monographs, 124(2), 125-
182.
Barnett, R. C., & Brennan, R. T. (1997). Change in job conditions, change in
psychological distress, and gender: A longitudinal study of dual-earner
couples. Journal of Organizational Behavior, 18(3), 253-274.
Barnett, R. C., & Gareis, K. (2006). Parental after-school stress and psychological
well-being. Journal of Marriage & the Family, 68, 101-108.
Barnett, R. C., Gareis, K., & Brennan, R. T. (1999). Fit as a mediator in the
relationship between work hours and burnout. Journal of Occupational
Health Psychology, 4(4), 307-317.
Barnett, R. C., & Hyde, J. S. (2001). Women, men, work, and family. American
Psychologist, 56(10), 781-796.
Barnett, R. C., & Rivers, C. (2004). Same difference. New York: Basic Books.
Baron, R. M., & Kenny, D. A. (1986). The moderator-mediator variable distinction
in social psychological research: Conceptual, strategic, and statistical
considerations. Journal of Personality and Social Psychology, 51(6), 1173-
1182.

400
Barrett, P. (2007). Structural equation modelling: Adjudging model fit. Personality
& Individual Differences, 42(3), 815-824.
Baumeister, R. F., & Leary, M. R. (1995). The need to belong: Desire for
interpersonal attachments as a fundamental human motivation Psychological
Bulletin, 117(3), 497-529.
Beasley, M., Thompson, T., & Davidson, J. (2003). Resilience in response to life
stress: The effects of coping style and cognitive hardiness. Personality &
Individual Differences, 34, 77-95.
Beck, A. T. (1991). Cognitive therapy: A 30-year retrospective. American
Psychologist, 46(4), 368-375.
Beck, A. T. (2002). Cognitive models of depression. In R. L. Leahy & E. T. Dowd
(Eds.), Clinical Advances in Cognitive Psychotherapy (pp. 29-61). New
York: Springer Publishing Company.
Beck, A. T. (2004). Cognitive therapy, behavior therapy, psychoanalysis, and
pharmacotherapy: A cognitive continuum. In A. Freeman, M. J. Mahoney, P.
Devito & D. Martin (Eds.), Cognition and Psychotherapy (2nd ed., pp. 197-
220). New York: Springer Publishing Company.
Beehr, T. A., & Glazer, S. (2005). Organizational role stress. In J. Barling & E. K.
Kelloway (Eds.), Handbook of work stress. Thousand Oaks, CA: Sage
Publications.
Behson, S. J. (2002). Which dominates? The relative importance of work-family
organizational support and general organizational context on employee
outcomes. Journal of Vocational Behavior, 61, 53-72.
Behson, S. J. (2005). The relative contribution of formal and informal organizational
work-family support. Journal of Vocational Behavior, 66, 487-500.
Bem, S. L. (1974). The measurement of psychological androgyny. Journal of
Consulting and Clinical Psychology, 42(2), 155-162.
Bentler, P. M. (2007). On tests and indices for evaluating structural models.
Personality & Individual Differences, 42(3), 825-829.
Berg, P., Kallenberg, A. L., & Appelbaum, E. (2003). Balancing work and family:
The role of high-commitment environments. Industrial Relations, 42(2), 168-
188.
Best, R. G., Stapleton, L. M., & Downey, R. G. (2005). Core self-evaluations and job
burnout: The test of alternative models. Journal of Occupational Health

401
Psychology, 10(4), 441-451.
Bianchi, S. M. (1995). The changing demographic and socioeconomic characteristics
of single parent families. Marriage and Family Review, 20(1-2), 71-97.
Bianchi, S. M., Milkie, M. A., Sayer, L. C., & Robinson, J. P. (2000). Is anyone
doing the housework? Trends in the gender division of household labour.
Social Forces, 79(1), 191-228.
Bird, G. W., & Schnurman-Crook, A. (2005). Professional identity and coping
behaviors in dual-career couples. Family Relations, 54, 145-160.
Birnbaum, M. H. (2004). Human research and data collection via the Internet.
Annual Review of Psychology, 55, 803-832.
Block, J., & Kremen, A. M. (1996). IQ and ego-resiliency: Conceptual and empirical
connections and separateness. Journal of Personality and Social Psychology,
70(2), 349-361.
Bohart, A. C. (2002). Focusing on the positive, focusing on the negative:
Implications for psychotherapy. Journal of Clinical Psychology, 58(9), 1037-
1043.
Bolino, M. C., & Turnley, W. H. (2005). The personal costs of citizenship behavior:
The relationship between individual initiative and role overload, job stress,
and work-family conflict. Journal of Applied Psychology, 90(4), 740-748.
Bond, J. T., Galinsky, E., Kim, S. S., & Brownfield, E. (2005). 2005 National study
of employers. New York: Families and Work Institute.
Bovey, W. H., & Hede, A. (2001). Resistance to organizational change: the role of
defense mechanisms. Journal of Managerial Psychology, 16(7), 534-548.
Boyar, S. L., Maetz, C. P., & Pearson, A. W. (2005). The effects of work-family
conflict and family-work conflict on non-attendance behaviours. Journal of
Business Research, 58, 919-925.
Bradbury, T. N., Fincham, F. D., & Beach, S. R. H. (2000). Research on the nature
and determinants of marital satisfaction: A decade in review. Journal of
Marriage & the Family, 62, 964-980.
Brissette, I., Scheier, M. F., & Carver, C. S. (2002). The role of optimism in social
network development, coping, and psychological adjustment during a life
transition. Journal of Personality and Social Psychology, 82(1), 102-111.
Bronfenbrenner, U. (1979). The ecology of human development. Cambridge, MA:
Harvard University Press.
402
Bronfenbrenner, U. (1995). Developmental ecology through space and time: A future
perspective. In P. Moen, G. H. Elder & K. Luscher (Eds.), Examining Lives in
Context; Perspectives on the Ecology of Human Development. Washington,
D.C.: American Psychological Association.
Bronfenbrenner, U., & Ceci, S. J. (1994). Nature-nurture reconceptualized in
developmental perspective: A bioecological model. Psychological Review,
101(4), 568-586.
Bronfenbrenner, U., & Evans, G. W. (2000). Developmental science in the 21st
century: Emerging questions, theoretical models and empirical findings.
Social Development, 9(1), 115-125.
Bronfenbrenner, U., & Morris, P. A. (1998). The ecology of developmental
processes. In W. Damon & R. M. Lerner (Eds.), Handbook of child
psychology (5th ed., Vol. 1, pp. 993-1028). New York: John Wiley & Sons,
Inc.
Bronfenbrenner, U., & Morris, P. A. (2006). The Bioecological Model of human
development. In W. Damon & R. M. Lerner (Eds.), Handbook of child
development (6th ed., Vol. 1, pp. 793-828). Hoboken, NJ: John Wiley &
Sons.
Brotheridge, C. M., & Lee, R. T. (2005). Impact of work-family interference on
general well-being: A replication and extension. International Journal of
Stress Management, 12(3), 203-221.
Brown, S. L., Nesse, R. M., Vinokur, A. D., & Smith, D. M. (2003). Providing social
support may be more beneficial than receiving it: Results from a prospective
study of mortality. Psychological Science, 14(4), 320-327.
Browne, M. W., & Cudeck, R. (1993). Alternative ways of assessing model fit. In K.
A. Bollen & J. S. Long (Eds.), Testing structural equation models (pp. 136-
162). Newbury Park, CA: Sage Publications.
Bruck, C. S., Allen, T. D., & Spector, P. E. (2002). The relation between work-
family conflict and job satisfaction: A finer-grained analysis. Journal of
Vocational Behavior, 60, 336-353.
Bryant, B. K., Zvonkovic, A. M., & Reynolds, P. (2006). Parenting in relations to
child and adolescent vocational development. Journal of Vocational
Behavior, 69, 149-175.
Budig, M. J. (2002). Male advantage and the gender composition of jobs: Who rides

403
the glass elevator? Social Problems, 49(2), 258-277.
Buffardi, L. C., Smith, J. L., O'Brien, A. S., & Erdwins, C. J. (1999). The impact of
dependent-care responsibility and gender on work attitudes. Journal of
Occupational Health Psychology, 4(4), 356-367.
Burke, R. J., & Nelson, D. L. (2001). Organizational men: Masculinity and its
discontents. In C. L. Cooper & I. T. Robertson (Eds.), Well-Being in
Organizations, a Reader for Students and Practioners. (pp. 209-255).
Chichester, U.K.: John Wiley and Sons.
Burns, A. B., Brown, J. S., Plant, E. A., Sachs-Ericcson, N., & Joiner, J., T.E. (2006).
On the specific depressotypic nature of excessive reassurance-seeking.
Personality & Individual Differences, 40, 135-145.
Bussey, K., & Bandura, A. (1999). Social cognitive theory of gender development
and differentiation. Psychological Review, 106(4), 676-713.
Butler, A. B., Grzywacz, J. G., Bass, B. J., & Linney, K. D. (2005). Extending the
demands-control model: A daily diary study of job characteristics, work-
family conflict and work-family facilitation. Journal of Occupational and
Organizational Psychology, 78(2), 155-169.
Butler, A. B., & Skattebo, A. (2004). What is acceptable for women may not be
acceptable for men: The effect of family conflicts with work on job-
performance ratings. Journal of Occupational and Organizational
Psychology, 77, 553-564.
Byrne, B. M. (2001). Structural equation modeling with AMOS: Basic concept,
applications and programming. Mahwah, NJ: Lawrence Erlbaum.
Byron, K. (2005). A meta-analytic review of work-family conflict and its
antecedents. Journal of Vocational Behavior, 67, 169-198.
Campbell, K. M., & Campbell, D. J. (1995). Psychometric properties of the Life Role
Salience Scales: Some construct validation from a sample of non-professional
women. Educational and Psychological Measurement, 55(2), 317-328.
Cardenas, R. A., Major, D. A., & Bernas, K. H. (2004). Exploring work and family
distractions: Antecedents and outcomes. International Journal of Stress
Management, 11(4), 346-365.
Carlson, D. S., Kacmar, K. M., Wayne, J. H., & Grzywacz, J. G. (2006). Measuring
the positive side of the work-family interface: Development and validation of
a work-family enrichment scale. Journal of Vocational Behavior, 68, 131-

404
164.
Carlson, D. S., Kacmar, K. M., & Williams, L. J. (2000). Construction and validation
of a multidimensional measure of work-family conflict. Journal of
Vocational Behavior, 56(2), 249-276.
Carr, A. (2004). Positive psychology. Hove, East Sussex: Brunner-Routledge.
Carver, C. S., & Scheier, M. F. (1998). On the self-regulation of behavior.
Cambridge: Cambridge University Press.
Carver, C. S., & Scheier, M. F. (2000). Perspectives on personality (4th ed.). Boston:
Allyn & Bacon.
Carver, C. S., & Scheier, M. F. (2002). Optimism, pessimism, and self-regulation. In
E. C. Chang (Ed.), Optimism and Pessimism, Implications for Theory,
Research, and Practice. Washington, D.C.: American Psychological
Association.
Casper, W. J., Fox, K. E., Sitzmann, T. M., & Landy, A. L. (2004). Supervisor
referrals to work-family programs. Journal of Occupational Health
Psychology, 9(2), 136-151.
Casper, W. J., Martin, J. A., Buffardi, L. C., & Erdwins, C. J. (2002). Work-family
conflict, perceived organizational support, and organizational commitment
among employed mothers. Journal of Occupational Health Psychology, 7(2),
99-108.
Caspi, A., Bem, D. J., & Elder, G. H. (1989). Continuities and consequences of
interactional style across the lifespan. Journal of Personality, 57(2), 375-
374.376.
Chang, E. C. (1998). Does dispositional optimism moderate the relation between
perceived stress and psychological well-being?: A preliminary investigation.
Personality & Individual Differences, 25, 233-240.
Chesney, M. A., Chambers, D. B., Taylor, J. M., Johnson, L. M., & Folkman, S.
(2003). Coping effectiveness training for men living with HIV: Results from
a randomized clinical trial testing a group-based intervention. Psychosomatic
Medicine, 65, 1038-1046.
Christopher, M. (2004). A broader view of trauma: A biopsychosocial-evolutionary
view of the role of traumatic stress response in the emergence of pathology
and/or growth. Clinical Psychology Review, 24(1), 75-98.
Cinamon, R. G., & Rich, Y. (2005). Work-family conflict among female teachers.
405
Teaching and Teacher Education, 21, 365-378.
Clark, A. E. (1997). Job satisfaction and gender: Why are women so happy at work?
Labour Economics, 4, 341-372.
Clark, S. C. (2002). Employees' sense of community, sense of control, and work-
family conflict in Native American organizations. Journal of Vocational
Behavior, 61, 92-108.
Clarkberg, M., & Moen, P. (2001). Understanding the time squeeze: Married couples
preferred and actual work-hours strategies. The American Behavioral
Scientist, 44(7), 1115-1136.
Clarke, M. C., Koch, L. C., & Hill, E. J. (2004). The work-family interface:
Differentiating balance and fit. Family and Consumer Sciences Research
Journal, 33(2), 121-140.
Clifton, T. J., & Shepard, E. (2004). Work and family programs and productivity:
Estimates applying to a production function model. International Journal of
Manpower, 25(8), 714-728.
Cohen, J. (1988). Statistical power analysis for the behavioral sciences. Hillsdale,
N.J.: Lawrence Erlbaum Associates.
Cohen, J. (1992). A power primer. Psychological Bulletin, 112(1), 155-159.
Cohen, J., Cohen, P. N., West, S. G., & Aiken, L. S. (2003). Applied multiple
regression/correlation analysis for the behavioral sciences (3rd ed.).
Mahwah, NJ: Lawrence Erlbaum Associates, Publishers.
Cohen, S. (2004). Social relationships and health. American Psychologist, 676-684.
Cohen, S., & Wills, T. A. (1985). Stress, social support, and the buffering hypothesis.
Psychological Bulletin, 98(2), 310-357.
Coltrane, S. (2000). Research on household labor: Modeling and measuring the
social embeddedness of routine family work. Journal of Marriage & the
Family, 62, 1208-1233.
Conger, A. J. (1974). A revised definition for suppressor variables: A guide to their
identification and interpretation. Educational and Psychological
Measurement, 34(1), 34-46.
Connelly, C. E., Gallagher, D. G., & Gilley, K. M. (2007). Organizational and client
commitment among contracted employees: A replication and extension with
temporary workers. Journal of Vocational Behavior, 70, 326-335.
Coplan, R. J., Bowker, A., & Cooper, M. L. (2003). Parenting daily hassles, child

406
temperament, and social adjustment in preschool. Early Childhood Research
Quarterly, 18, 376-395.
Corwyn, R. F., & Bradley, R. H. (1999). Determinants of paternal and maternal
investment in children. Infant Mental Health Journal, 20(3), 238-256.
Costa, G., & Sartori, S. (2005). Flexible work hours, ageing and well-being.
International Congress Series, 1280, 23-28.
Coyne, J. C., Thompson, R., & Palmer, S. C. (2002). Marital quality, coping with
conflict, marital complaints, and affection in couples with a depressed wife.
Journal of Family Psychology, 16(1), 26-37.
Crouter, A. C., Bumpus, M. F., Maguire, M. C., & McHale, S. M. (1999). Linking
parents' work pressure and adolescents' well-being: Insights into dynamics in
dual-earner families. Developmental Psychology, 35(6), 1453-1461.
Crowell, L. F. (2004). Weak ties: a mechanism for helping women expand their
social networks and increase their capital. The Social Science Journal, 41(1),
15-28.
Csikszentmihalyi, M. (2002). Finding flow: The psychology of engagement with
everyday life. London: Rider.
Csikszentmihalyi, M., & Rathunde, K. (1998). The development of the person: An
experiential perspective on the ontogenesis of psychological complexity. In
W. Damon & R. M. Lerner (Eds.), Handbook of child psychology (5th ed.,
Vol. 1, pp. 635-682). New York: John Wiley & Sons.
Culver, J. L., Carver, C. S., & Scheier, M. F. (2003). Dispositional optimism as a
moderator of the impact of health threats on coping and well-being. In R.
Jacoby & G. Keinan (Eds.), Between stress and hope: From a disease-
centred to a health-centred perspective. Westport, Connecticut: Praeger
Publishers.
Cummins, R. A., Eckersley, R., Lo, S., Okerstrom, E., Hunter, B., & Davern, M.
(2003). The well-being of Australians - The effects of work, Australian Unity
Well-Being Index Survey 7. Melbourne: Australian Centre on Quality of Life,
Deakin University.
Cummins, R. A., & Nistico, H. (2002). Maintaining life satisfaction: The role of
positive cognitive bias. Journal of Happiness Studies, 3, 37-69.
Cummins, R. A., Walter, J., & Woerner, J. (2007). The well-being of Australians -
groups with the highest and lowest well-being in Australia; Australian Unity

407
Well-Being Index Survey 16.1 Melbourne, Australia: Australian Centre on
Quality of Life, Deakin University.
Cummins, R. A., Woerner, J., Tomym, A., Gibson, A., Lai, L., & Collard, J. (2007).
The well-being of Australians: Changing conditions to make life better,
Australian Unity Well-Being Index, survey 18. Melbourne, Australia:
Australian Quality of Life Centre, Deakin University.
Danner, D. D., Snowdon, D. A., & Friesen, W. V. (2001). Positive emotions in early
life and longevity: Findings from the Nun Study. Journal of Personality and
Social Psychology, 80(5), 804-813.
De Beuckelaer, A., & Lievens, F. (2009). Measurement equivalence of paper-and
pencil and internet organizational surveys: A large scale examination in 16
countries. Applied Psychology: An International Review, 58(2), 336-361.
De Cierci, H., Holmes, B., Abbott, J., & Pettit, T. (2005). Achievement challenges
for work-life balance strategies in Australian organizations. International
Journal of Human Resource Management, 16(1), 90-103.
de Jonge, J., Dollard, M. F., Dormann, C., Le Blanc, P. M., & Houtman, I. L. D.
(2000). The demand-control model: Specific demands, specific control, and
well-defined groups. International Journal of Stress Management, 7(4), 269-
287.
de Jonge, J., Dormann, C., Janssen, P. P. M., Dollard, M. F., Landeweerd, J. A., &
Nijhuis, F. J. N. (2001). Testing reciprocal relationships between job
characteristics and psychological well-being: A cross-lagged structural
equation model. Journal of Occupational and Organizational Psychology, 74,
29-46.
de Jonge, J., Mulder, J. G. P., & Nijhuis, F. J. N. (1999). The incorporation of
different demand concepts in the job demand-control model: Effects on
health care professionals. Social Science and Medicine, 48, 1149-1160.
de Jonge, J., & Schaufeli, W. B. (1998). Job characteristics and employee well-being:
A test of Warr's Vitamin Model in health care workers using structural
equation modelling. Journal of Organizational Behavior, 19, 387-407.
de Vries, M. W., & Wilkerson, B. (2003). Stress, work, and mental health: A global
perspective. Acta Neuropsychiatrica, 15, 44-53.
Demerouti, E., Bakker, A. B., & Bulters, A. J. (2004). The loss spiral of work
pressure, work-home interference and exhaustion: Reciprocal relations in a

408
three-wave study. Journal of Vocational Behavior, 64, 131-149.
Demerouti, E., Bakker, A. B., Nachreiner, F., & Schaufeli, W. B. (2000). A model of
burnout and life satisfaction amongst nurses. Journal of Advanced Nursing,
32(2), 454-464.
Demerouti, E., Bakker, A. B., Nachreiner, F., & Schaufeli, W. B. (2001). The Job
Demands-Resources model of burnout. Journal of Applied Psychology, 86(3),
499-512.
Demerouti, E., Geurts, S., & Kompier, M. A. J. (2004). Positive and negative work-
home interaction: Prevalence and correlates. Equal Opportunity
International, 23(1/2), 6-35.
DeNeve, K. M., & Cooper, H. (1998). The happy personality: A meta-analysis of
137 personality traits and subjective well-being. Psychological Bulletin,
124(2), 197-229.
DiBartolo, M. (2002). Exploring self-efficacy and hardiness in spousal caregivers of
individuals with dementia. Journal of Gerontological Nursing, 28(4), 24-33.
Diener, E., Emmons, R. A., Larsen, G., & Griffin, S. (1985). The Satisfaction with
Life Scale. Journal of Personality Assessment, 49(1), 71-75.
Diener, E., & Lucas, R. E. (2000). Subjective emotional well-being. In M. Lewis &
J. M. Haviland-Jones (Eds.), Handbook of emotions (2nd ed., pp. 325-337).
New York: The Guildford Press.
Diener, E., Lucas, R. E., & Oishi, S. (2002). Subjective well-being: The science of
happiness and well-being. In C. R. Snyder & S. J. Lopez (Eds.), Handbook of
Positive Psychology (pp. 63-73). Oxford: Oxford University Press.
Diener, E., Lucas, R. E., & Scollon, C. N. (2006). Beyond the hedonic treadmill.
American Psychologist, 61(4), 305-314.
Diener, E., Nickerson, C., Lucas, R. E., & Sandvick, E. (2002). Dispositional affect
and job outcomes. Social Indicators Research, 59(3), 229-259.
Diener, E., Suh, E. M., Lucas, R. E., & Smith, H. L. (1999). Subjective well-being:
Three decades of progress. Psychological Bulletin, 125(2), 276-302.
Dierdorff, E. C., & Ellington, J. K. (2008). It's the nature of the work: Examining
behavior-based sources of work-family conflict across occupations. Journal
of Applied Psychology, 93(4), 883-892.
Dikkers, J., Geurts, S., den Dulk, L., Peper, B., & Kompier, M. A. J. (2004).
Relations among work-home culture, the utilization of work-home

409
arrangements, and work-home interference. International Journal of Stress
Management, 11(4), 323-345.
Dobbins, G. H., & Platz, S. J. (1986). Sex differences in leadership: How real are
they? Academy of Management Review, 11(1), 118-127.
Donald, M., & Dower, J. (2002). Risk and protective factors for depressive
symptomatology among a community sample of adolescents and young
people. Australian and New Zealand Journal of Public Health, 26(6), 555-
562.
Drago, R., Wooden, M., & Black, D. (2006). Long work hours: Volunteers and
conscripts. Working paper no. 27/06. Melbourne, Vic.: Melbourne Institute.
Drago, R., Wooden, M., & Black, D. (2007). Long work hours: Volunteers and
conscripts. Paper presented at the HILDA Survey Research Conference 2007.
Eagle, B. W., Miles, E. W., & Icenogle, M. L. (1997). Interrole conflicts and the
permeability of work and family domains: Are there gender differences?
Journal of Vocational Behavior, 50, 168-184.
Eagly, A. H., & Johnson, B. T. (1990). Gender and leadership style: A meta-analysis.
Psychological Bulletin, 108(2), 233-256.
Eagly, A. H., Karau, S. J., & Makhijani, M. G. (1995). Gender and the effectiveness
of leaders: A meta-analysis. Psychological Bulletin, 117(1), 125-145.
Eagly, A. H., Makhijani, M. G., & Klonsky, B. G. (1992). Gender and the evaluation
of leaders: A meta-analysis. Psychological Bulletin, 111(1), 3-22.
Easterlin, R. A. (2006). Life cycle happiness and its sources: Interactions of
psychology, economics, and demographics. Journal of Economic Psychology,
27, 463-482.
Eby, L. T., Casper, W. J., Lockwood, A., Bordeaux, C., & Brinley, A. (2005). Work
and family research in IO/OB: Content analysis and review of the literature
(1980-2002). Journal of Vocational Behavior, 66, 124-197.
Eisenberger, R., Huntington, R., Hutchinson, S., & Sowa, D. (1986). Perceived
organizational support. Journal of Applied Psychology, 71(3), 500-507.
Elavsky, S., & McAuley, E. (2009). Personality, menopausal symptoms, and
physical activity outcomes in middle-aged women. Personality & Individual
Differences, 46(1), 123-128.
Elder, G. H., & Shanahan, M. J. (2006). The life course and human development. In
R. M. Lerner (Ed.), Handbook of child psychology (6th ed., Vol. 1, pp. 665-

410
715). Hoboken, NJ: John Wiley & Sons.
Ellis, A. (2004). Expanding the ABCs of the Rational Emotive Therapy. In A.
Freeman, M. J. Mahoney, P. Devito & D. Martin (Eds.), Cognition and
psychotherapy (2nd ed., pp. 185-195). New York: Springer Publishing
Company.
Emmons, R. A. (2003). Personal goals, life meaning, and virtue: Wellsprings of a
positive life. In C. L. M. Keyes & J. Haidt (Eds.), Flourishing, Positive
Psychology and the Life Well-Lived. (pp. 105-128). Washington, D.C.:
American Association of Psychology.
Emmons, R. A., & McCullough, M. E. (2003). Counting blessings versus burdens:
An experimental investigation of gratitude and subjective well-being in daily
life. Journal of Personality and Social Psychology, 84(2), 377-389.
Erhlinger, J., Johnson, K., Banner, M., Dunning, D., & Kruger, J. (2008). Why the
unskilled are unaware: Further explorations of (absent) self-insight among the
incompetent. Organizational Behavior and Human Decision Processes,
105(1), 98-121.
Erickson, R. J. (2005). Why emotion work matters: Sex, gender, and the division of
household labor. Journal of Marriage & the Family, 67, 337-351.
Erickson, S. J., & Feldstein, S. W. (2007). Adolescent humor and its relationships to
coping, defense strategies, psychological distress, and well-being Child
Psychiatry and Human Development, 37, 255-271.
Faragher, E. B., Cass, M., & Cooper, C. L. (2005). The relationship between job
satisfaction and health: A meta-analysis. Occupational and Environmental
Medicine, 62, 105-112.
Ferris, G. M., Witt, L. A., & Hochwarter, W. A. (2001). Interaction of social skill
and general mental ability on job performance and salary. Journal of Applied
Psychology, 86(6), 1075-1082.
Folkman, S., & Moskowitz, J. M. (2000). Positive affect and the other side of coping.
American Psychologist, 55(6), 647-654.
Folkman, S., & Moskowitz, J. T. (2004). Coping: Pitfalls and promise. Annual
Review of Psychology, 55, 745-774.
Fomby, P., & Cherlin, A. J. (2007). Family instability and child well-being.
American Sociological Review, 72(2), 181-204.
Fortner, M. R., Crouter, A. C., & McHale, S. M. (2004). Is parents' work

411
involvement responsive to the quality of relationships with adolescent
offspring? Journal of Family Psychology, 18(3), 530-538.
Fouard, N. A., & Tinsley, H. E. A. (1997). Work-family balance. Journal of
Vocational Behavior, 50, 141-144.
Fournier, G., & Jeanrie, C. (2003). Locus of control: Back to basics. In S. J. Lopez &
C. R. Snyder (Eds.), Positive psychological assessment (pp. 139-154).
Washington, D.C.: American Psychological Association.
Fox, J. W. (1990). Social class, mental illness, and social mobility: The social
selection-drift hypothesis for serious mental illness. Journal of Health and
Social Behavior, 31(4), 344-353.
Fredrickson, B. L. (1998). What good are positive emotions? Review of General
Psychology, 2(3), 300-319.
Fredrickson, B. L., & Joiner, J., T.E. (2002). Positive emotions trigger upward spirals
toward emotional well-being. Psychological Science, 13(2), 172-175.
Freud, S. (1995). Jokes and their relation to the unconscious. In J. Strachey (Ed.),
The standard edition of the complete psychological works of Sigmund Freud
(Vol. 8, 1905). London: The Hogarth Press.
Fritz, C., & Sonnentag, S. (2005). Recovery, health, and job performance: Effects of
weekend experiences. Journal of Occupational Health Psychology, 10(3),
187-199.
Fritz, C., & Sonnentag, S. (2006). Recovery, well-being, and performance-related
outcomes: The role of workload and vacation experiences. Journal of Applied
Psychology, 91(4), 936-945.
Frone, M. R. (2003). Work-family balance. In J. C. Quick & L. E. Tetrick (Eds.),
Handbook of occupational health psychology (pp. 143-162). Washington,
D.C.: American Psychological Association.
Frone, M. R., Russell, M., & Barnes, G. M. (1996). Work-family conflict, gender,
and health-related outcomes: A study of employed parents in two community
samples. Journal of Occupational Health Psychology, 1(1), 57-69.
Frone, M. R., Russell, M., & Cooper, M. L. (1992a). Antecedents and outcomes of
work-family conflict: Testing a model of the work-family interface. Journal
of Applied Psychology, 77(1), 65-78.
Frone, M. R., Russell, M., & Cooper, M. L. (1992b). Prevalence of work-life
conflict: Are work and family boundaries asymmetrically permeable? Journal

412
of Organizational Behavior, 13(7), 723-729.
Frone, M. R., & Yardley, J. K. (1996). Workplace family-supportive programmes:
Predictors of employed parents' importance ratings. Journal of Occupational
and Organizational Psychology, 69, 351-366.
Frone, M. R., Yardley, J. K., & Markel, K. S. (1997). Developing and testing an
integrative model of the work-family interface. Journal of Vocational
Behavior, 50, 145-167.
Fujita, F., & Diener, E. (2005). Life satisfaction set point: Stability and change.
Journal of Personality and Social Psychology, 88(1), 158-164.
Galinsky, E. (2003). Dual-centric, a new concept of work-life. Executive summary.
Boston, Ma.: Families and Work Institute.
Galinsky, E., Friedman, D. E., & Hernandez, C. A. (1991). The corporate reference
guide for work-family programs. New York: Families and Work Institute.
Galinsky, E., Kim, S. S., & Bond, J. T. (2001). Feeling overworked: When work
becomes too much. New York: Families and Work Institute.
Galinsky, E., Salmond, K., Bond, J. T., Kropft, M. B., Moore, M., & Harrington, B.
(2003). Leaders in a Global Economy, A Study of Executive Men and Women.
New York: Families and Work Institute.
Garson, G. D. (2007). Structural equation modeling. Retrieved 3 September, 2007,
from http://www2.chass.ncsu.edu/garson/PA765/structur.htm
Geurts, S., & Demerouti, E. (2003). Work/non-work interface: A review of theories
and findings. In M. J. Schabracq, J. A. M. Winnubst & C. L. Cooper (Eds.),
Handbook of work and health psychology (2nd ed., pp. 279-312). Chichester,
U.K.: John Wiley and Sons.
Geurts, S., Kompier, M. A. J., Roxburgh, S., & Houtman, I. L. D. (2003). Does
work-home interference mediate the relationship between workload and well-
being? Journal of Vocational Behavior, 63, 532-559.
Giuliani, N. R., McRae, K., & Gross, J. J. (2008). The up and down-regulation of
amusement: Experiential, behavioral, and autonomic consequences Emotion,
8(5), 714-719.
Goffin, R. D. (2007). Assessing the adequacy of structural equation models: Golden
rules and editorial policies. Personality & Individual Differences, 42(3), 831-
839.
Golembiewski, R. T., Boudreau, J. W., Munzenrider, R. F., & Luo, H. (1996).

413
Global burnout: A worldwide pandemic explored by the phase model.
Greenwich, Connecticut: JAI Press Inc.
Gonzalez-Roma, V., Schaufeli, W. B., Bakker, A. B., & Lloret, S. (2006). Burnout
and work engagement: Independent factors or opposite poles? Journal of
Vocational Behavior, 68(1), 165-174.
Goode, W. J. (1960). A theory of role strain. American Sociological Review, 25, 483-
496.
Gosling, S. D., Varize, S., Srivastava, S., & John, O. P. (2004). Should we trust web-
based studies? American Psychologist, 59(2), 93-104.
Gottlieb, G., Wahlsten, D., & Lickliter, R. (1998). The significance of biology for
human development: A developmental psychobiological systems view. In W.
Damon & R. M. Lerner (Eds.), Handbook of child psychology (5th ed., Vol.
1: Theoretical models of human development, pp. 233-273). New York: John
Wiley & Sons, Inc.
Gowan, M. A., Craft, S. L. S., & Zimmerman, R. A. (2000). Response to work
transitions by Unites States Army personnel: effects on self-esteem, self-
efficacy, and career resilience. Psychology Reports, 911-921.
Grandey, A. A., Cordeiro, B. L., & Crouter, A. C. (2005). A longitudinal and multi-
source test of the work-family conflict and job satisfaction relationship.
Journal of Occupational and Organizational Psychology, 78, 305-323.
Grandey, A. A., Fisk, G. M., & Steiner, D. D. (2005). Must 'service with a smile' be
stressful? The moderating role of personal control for American and French
employees. Journal of Applied Psychology, 90(5), 893-904.
Granovetter, M. S. (1973). The strength of weak ties. American Journal of Sociology,
78(6), 1360-1380.
Grawitch, M. J., Trares, S., & Kohler, J. M. (2007). Healthy workplace practices and
employee outcomes. International Journal of Stress Management, 14(3), 275-
293.
Grebner, S., Semmer, N. K., Lo Faso, L., Gut, S., Kalin, W., & Elfering, A. (2003).
Working conditions, well-being and job-related attitudes among call centre
agents. European Journal of Work and Organizational Psychology, 12(4),
341-365.
Greenberger, E., & Goldberg, W. A. (1989). Work, parenting, and the socialization
of children. Developmental Psychology, 25(1), 22-35.
414
Greenberger, E., & O'Neil, R. (1990). Parents' concerns about their childs'
development: Implications for fathers' and mothers' well-being and attitudes
towards work. Journal of Marriage & the Family, 52(3), 621-636.
Greenberger, E., O'Neil, R., & Nagel, S. K. (1994). Linking workplace and
homeplace: Relations between the nature of adults' work and their parenting
behaviors. Developmental Psychology, 30(6), 990-1002.
Greenglass, E. R., & Burke, R. J. (2002). Hospital restructuring and burnout. Journal
of Health and Human Services Administration, 25(1/2), 89-114.
Greenhaus, J. H., & Beutell, N. J. (1985). Sources of conflict between work and
family roles. Academy of Management Review, 10, 76-88.
Greenhaus, J. H., Collins, K. M., & Shaw, J. D. (2003). The relation between work-
family balance and the quality of life. Journal of Vocational Behavior, 63,
510-531.
Greenhaus, J. H., Parasuraman, S., & Collins, K. M. (2001). Career involvement and
family involvement as moderators of relationships between work-family
conflict and withdrawal from a profession. Journal of Occupational Health
Psychology, 6(2), 91-100.
Greenhaus, J. H., & Powell, G. N. (2003). When work and family collide: Deciding
between competing role demands. Organizational Behavior and Human
Decision Processes, 90, 291-303.
Greenhaus, J. H., & Powell, G. N. (2006). When work and family are allies: A theory
of work-family enrichment. Academy of Management Review, 31(1), 72-82.
Grover, S. L., & Crooker, K. J. (1995). Who appreciates family-responsive human
resource policies: The impact of family-friendly policies on the
organizational attachment of parents and non-parents. Personnel Psychology,
48(2), 271-288.
Grzywacz, J. G. (2000). Work-family spillover and health during mid-life: Is
managing conflict everything? American Journal of Health Promotion, 14(4),
236-243.
Grzywacz, J. G., Almeida, D. M., & McDonald, D. A. (2002). Work-family spillover
and daily reports of work and family stress in the adult work force. Family
Relations, 51(1), 28-36.
Grzywacz, J. G., & Bass, B. J. (2003). Work, family, and mental health: Testing
different models of work-family fit. Journal of Marriage & the Family, 65,

415
248-262.
Grzywacz, J. G., & Butler, A. B. (2005). The impact of job characteristics on work-
to-family facilitation: Testing a theory and distinguishing a construct. Journal
of Occupational Health Psychology, 10(2), 97-109.
Grzywacz, J. G., & Marks, N. F. (2000a). Family, work, work-family spillover, and
problem drinking during midlife. Journal of Marriage & the Family, 62(2),
336-348.
Grzywacz, J. G., & Marks, N. F. (2000b). Reconceptualizing the work-family
interface: An ecological perspective on the correlates of positive and negative
spillover between work and family. Journal of Occupational Health
Psychology, 5(1), 111-126.
Hahn, J., & Oishi, S. (2006). Psychological need and emotional well-being in older
and younger Koreans and Americans. Personality & Individual Differences,
40, 689-698.
Hair, J. H., Anderson, R. E., Tatham, R. L., & Black, W. C. (1998). Multivariate
data analysis (5th ed.). Upper Saddles River, N.J.: Prentice Hall
International.
Hakanen, J. J., Bakker, A. B., & Schaufeli, W. B. (2006). Burnout and work
engagement among teachers. Journal of School Psychology, 43, 495-513.
Hakanen, J. J., Perhoniemi, R., & Toppinen-Tanner, S. (2008). Positive gain spirals
at work: From job resources to work engagement, personal initiative and
work-unit effectiveness. Journal of Vocational Behavior, 73(1), 78-91.
Hall, J. A., & Friedman, G. B. (1999). Status, gender, and non-verbal behavior: A
study of structured interactions between employees of a company.
Personality and Social Psychology Bulletin, 25(9), 1082-1091.
Haller, M., & Hadler, M. (2006). How social relations and structures can produce
happiness and unhappiness: An international comparative analysis. Social
Indicators Research, 75, 169-216.
Hallsten, L. (1993). Burning out: A framework. In W. B. Schaufeli, C. Maslach & T.
Marek (Eds.), Professional burnout: Recent developments in theory and
research (pp. 95-113). Washington DC: Taylor & Francis.
Hand, K. (2006). Mothers' accounts of work and family decision-making in couple
families: An analysis of the Family and Work Decisions Study. Family
Matters, 75, 70-76.

416
Hand, K., & Hughes, J. (2004). Mothers' reflections about work and family life.
Family Matters, 69, 44-49.
Hart, S. L., Vella, L., & Mohr, D. C. (2008). Relationships among depressive
symptoms, benefit-finding, optimism and positive affect in multiple sclerosis
patients after psychotherapy for depression. Health Psychology, 27(2), 230-
238.
Harter, J. K., Schmidt, F. L., & Hayes, T. L. (2002). Business-unit-level relationship
between employee satisfaction, employee engagement, and business
outcomes: A meta-analysis. Journal of Applied Psychology, 87(2), 268-279.
Hatchett, G. T., & Park, H. L. (2004). Relationships among optimism, coping styles,
psychopathology, and counselling outcome. Personality and Individual
Differences, 36(8), 1755-1769.
Hawthorne, G., Cheok, F., Goldney, R., & Fisher, L. (2003). The excess cost of
depression in South Australia: A population-based study. Australian and New
Zealand Journal of Psychiatry, 37(3), 362-373.
Hawton, K., Salkovskis, P. M., Kirk, J., & Clark, D. M. (2000). Cognitive Behaviour
Therapy for psychiatric problems: A practical guide. Oxford: Oxford
University Press.
Hayduck, L., Cummings, G., Boadu, K., Pazderka-Robinson, H., & Boulianne, S.
(2007). Testing! testing! one, two, three - Testing the theory in structural
equation models! Personality & Individual Differences, 42(3), 841-850.
Henley, J. R., Danziger, S. K., & Offer, S. (2005). The contribution of social support
to the material well-being of low-income families. Journal of Marriage & the
Family, 67, 122-140.
Hewlett, S. A., & Luce, C. B. (2006). Extreme jobs: The dangerous allure of the 70-
hour work week. Harvard Business Review, 84(12), 49-59.
Hewson, C., Yule, P., Laurent, D., & Vogel, C. (2003). Internet research methods: A
practical guide for the social and behavioral sciences. London: Sage
Publications.
Higgins, C., & Duxbury, L. (1992). Work-family conflict: A comparison of dual-
career and traditional-career men. Journal of Organizational Behavior, 13,
389-411.
Hill, E. J. (2005). Work-family facilitation and conflict, working fathers and mothers,
work-family stressors and support. Journal of Family Issues, 26(6), 793-819.
417
Hill, E. J., Yang, C., Hawkins, A. J., & Ferris, M. (2004). A cross-cultural test of the
work-family interface in 48 countries. Journal of Marriage & the Family, 66,
1300-1316.
Hobfoll, S. E. (1989). Conservation of resources: A new attempt at conceptualizing
stress. American Psychologist, 44(3), 513-524.
Hobfoll, S. E. (2001). The influence of culture, community, and the nested-self in the
stress process: Advancing Conservation of Resources theory. Applied
Psychology: An International Review, 50(3), 337-369.
Hobfoll, S. E. (2002). Social and psychological resources and adaptation. Review of
General Psychology, 6(4), 307-324.
Hobfoll, S. E., & Freedy, J. (1993). Conservation of resources: A general stress
theory applied to burnout. In W. B. Schaufeli, C. Maslach & T. Marek (Eds.),
Professional burnout: Recent developments in theory and research (pp. 115-
129). Washington DC: Taylor and Francis.
Hochschild, A. R. (1997). The time bind. New York: Metropolitan Books.
Hochwarter, W. A., Witt, L. A., Treadway, D. C., & Ferris, G. M. (2006). The
interaction of social skill and organizational support on job performance.
Journal of Applied Psychology, 91(2), 482-489.
Hodges, T. D., & Clifton, D. O. (2004). Strengths-based development in practice. In
P. A. Linley & S. Joseph (Eds.), Positive psychology in practice (pp. 256-
268). Hoboken, N.J.: John Wiley & Sons.
Holmes-Smith, P., Cunningham, E., & Coote, L. (2006). Structural equation
modelling: From the fundamentals to advanced topics. Melbourne: School
Research, Evaluation, and Measurement Services.
Houkes, I., Janssen, P. P. M., de Jonge, J., & Bakker, A. B. (2003). Personality, work
characteristics, and employee well-being: A longitudinal analysis of additive
and moderating effects. Journal of Occupational Health Psychology, 8(1),
20-38.
Houkes, I., Janssen, P. P. M., De Jonge, J., & Nijhuis, F. J. N. (2001). Work and
individual determinants of intrinsic motivation. emotional exhaustion and
turnover intention: A multi-sample analysis. International Journal of Stress
Management, 8(4), 257-283.
Howard, A. (1992). Work and family crossroads spanning the career. In S. Zedeck
(Ed.), Work, family, and organizations. San Francisco: Jossey-Bass
418
Publishers.
Hu, L., & Bentler, P. M. (1998). Fit indices in covariance structure modeling:
Sensitivity to underparameterized model specification. Psychological
Methods, 3(4), 424-453.
Huang, Y.-H., Hammer, L. B., Neal, M. B., & N.A., P. (2004). The relationship
between work-to-family conflict and family-to-work conflict: A longitudinal
study. Journal of Family and Economic Issues, 25(1), 79-100.
Hyman, J., Baldry, C., Scholaris, D., & Bunzel, D. (2003). Work-life imbalance in
call-centres and software development. British Journal of Industrial
Relations, 41(2), 215-239.
Idler, E. L., & Benyamini, Y. (1997). Self-rated health and mortality: A review of
twenty-seven community studies. Journal of Health and Social Behavior,
38(1), 21-37.
Ilies, R., Schwind, K. M., Johnson, M. D., DeRue, D. S., & Ilgen, D. R. (2007).
When can employees have a family life? The effects of daily workload and
affect on work-family conflict and social behaviors at home. Journal of
Applied Psychology, 92(5), 1368-1379.
Ito, J. K., & Brotheridge, C. M. (2005). Does supporting employees' career
adaptability lead to commitment, turnover, or both? Human Resource
Management, 44(1), 5-19.
Iverson, R. D., & Macguire, C. (2000). The relationship between job and life
satisfaction: Evidence from a remote mining community. Human Relations,
53(6), 807-839.
Iwanaga, M., Yokoyama, H., & Seiwa, H. (2004). Coping availability and stress
reduction for optimistic and pessimistic individuals. Personality and
Individual Differences, 36(1), 11-22.
Jackson, L. M., Pratt, M. W., & Pancer, S. M. (2005). Optimism as a mediator of the
relation between perceived parental authoritativeness and adjustment among
adolescents: Finding the sunny side of the street. Social Development, 14(2),
273-304.
James, I. A., & Blackburn, I.-M. (2004). Schemas revisited. Clinical Psychology and
Psychotherapy, 11, 369-377.
Janssen, P. P. M., Peeters, M. C. W., De Jonge, J., Houkes, I., & Tummers, G. E. R.
(2004). Specific relationships between job demands, job resources and
419
psychological outcomes and the mediating role of negative work-home
interference. Journal of Vocational Behavior, 62, 411-429.
Jex, S. M., Adams, G. A., Bachrach, D. G., & Sorenson, S. (2003). The impact of
situational constraints, role stressors, and commitment to employee altruism.
Journal of Occupational Health Psychology, 8(3), 171-180.
Jex, S. M., & Bliese, P. D. (1999). Efficacy beliefs as a moderator of the impact of
work-related stressors: A multi-level study. Journal of Applied Psychology,
84(3), 349-361.
Jex, S. M., Bliese, P. D., Buzzell, S., & Primeau, J. (2001). The impact of self-
efficacy on stressor-strain relations: Coping styles as an explanatory
mechanism. Journal of Applied Psychology, 86(3), 401-409.
Jimmieson, N. L. (2000). Employee reactions to behavioural control under
conditions of stress: The moderating role of self-efficacy. Work and Stress,
14(3), 262-280.
John, O. P., & Srivastava, S. (1999). The big five trait taxonomy: History,
measurement, and theoretical perspectives. In L. A. Pervin & O. P. John
(Eds.), Handbook of personality: Theory and research (2nd ed., pp. 102-138).
New York: The Guildford Press.
Johnson, D. W. (2003). Reaching out: Interpersonal effectiveness and self-
actualization (8th ed.). Boston: Allyn & Bacon.
Johnson, J. V., & Hall, E. M. (1988). Job strain, workplace social support, and
cardiovascular disease: A cross-sectional study of a random sample of the
Swedish working population. American Journal of Public Health, 78(10),
1336-1342.
Johnson, M. K. (2005). Family roles and work values: Processes of selection and
change. Journal of Marriage & the Family, 67, 352-369.
Johnson, S. K., Murphy, S. E., Zewdie, S., & Reichard, R. J. (2008). The strong,
sensitive type: Effects of gender stereotypes and leadership prototypes on the
evaluation of male and female leaders. Organizational Behavior and Human
Decision Processes, 106, 39-60.
Joiner, J., T.E. (1994). Contagious depression: Existence, specificity to depressed
symptoms and the role of reassurance seeking. Journal of Personality and
Social Psychology, 67(2), 287-296.
Joiner, J., T.E., & Metalsky, G. I. (1995). A prospective test of an integrative

420
interpersonal theory of depression: A naturalistic study of college roommates.
Journal of Personality and Social Psychology, 69(4), 778-788.
Joiner, J., T.E., & Metalsky, G. I. (2001). Excessive reassurance seeking: Delineating
a risk factor involved in the development of depressive symptoms.
Psychological Science, 12(5), 371-378.
Judge, T. A., Boudreau, J. W., & Bretz, R. D. (1994). Job and life attitudes of male
executives. Journal of Applied Psychology, 79(5), 767-782.
Judge, T. A., & Hurst, C. (2008). How the rich (and happy) get richer (and happier):
Relationship of core self-evaluations to trajectories in attaining work success.
Journal of Applied Psychology, 93(4), 849-863.
Judge, T. A., Locke, E., Durham, C. C., & Kluger, A. N. (1998). Dispositional effect
on job and life satisfaction: The role of core evaluations. Journal of Applied
Psychology, 83(1), 17-34.
Kahn, R. L., Wolfe, D. M., Quinn, R. P., Snoek, J. D., & Rosenthal, R. A. (1964).
Organizational stress: Studies in role conflict and ambiguity. New York:
John Wiley & Sons.
Karanika-Murray, M., Antoniou, A. S., Michaelides, G., & Cox, T. (2009).
Expanding risk assessment methodology for work-related health: A technique
for incorporating multivariate curvilinear effects. Work and Stress, 23(2), 99-
119.
Karasek, R. (1979). Job demands, job decision latitude, and mental strain:
Implications for job redesign. Administrative Science Quarterly, 24(2), 285-
308.
Karasek, R., & Theorell, T. (1990). Healthy work: Stress, productivity, and the
reconstruction of working life. New York: Basic Books.
Kasser, T., & Ryan, R. M. (1993). A darker side of the American dream: Correlates
of financial success as a central life aspiration. Journal of Personality and
Social Psychology, 65(2), 410-422.
Kasser, T., & Ryan, R. M. (1996). Further examining the American Dream:
Differential correlates of intrinsic and extrinsic goals. Personality and Social
Psychology Bulletin, 22(3), 280-287.
Katz, D., & Kahn, R. L. (1978). The social psychology of organizations (2nd ed.).
New York: John Wiley & Sons.
Kavanaugh, A. L., Reece, D. D., Carroll, J. M., & Rosson, M. B. (2005). Weak ties

421
in networked communities. The Information Society, 21, 119-131.
Kazdin, A. E. (2003). Clinical significance: Measuring whether interventions make a
difference. In A. E. Kazdin (Ed.), Methodological issues and strategies in
clinical research (3rd ed., pp. 691-710). Washington DC: American
Psychological Association.
Kelloway, E. K., Gottlieb, B. H., & Barham, L. (1999). The source, nature, and
direction of work and family conflict: A longitudinal investigation. Journal of
Occupational Health Psychology, 4(4), 337-346.
Kenny, D. A. (2008). Structural equation modeling. Retrieved 21 February 2008,
from http://davidakenny.net/cm/causalm.htm
Kessler, R. C., DuPont, R. L., Berglund, P., & Wittchen, H.-U. (1999). Impairment
in pure and comorbid Generalized Anxiety Disorder and Major Depression at
12 months in two national surveys. American Journal of Psychiatry, 156(12),
1915-1923.
Kessler, R. C., & Frank, R. G. (1997). The impact of psychiatric disorders on work
lost days. Psychological Medicine, 27, 861-873.
Keyes, C. L. M. (2002). The mental health continuum: From languishing to
flourishing in life. Journal of Health and Social Behavior, 43(2), 207-222.
Keyes, C. L. M. (2005). Mental illness and/or mental health? Investigating axioms of
the complete state model of health. Journal of Consulting and Clinical
Psychology, 73(3), 539-548.
Keyes, C. L. M., & Grzywacz, J. G. (2005). Health as a complete state: The added
value in work performance and health care costs. Journal of Occupational
and Environmental Medicine, 47(5), 523-532.
Keyes, C. L. M., Shmotkin, D., & Ryff, C. D. (2002). Optimising well-being: The
empirical encounter of two traditions. Journal of Personality and Social
Psychology, 82(6), 1007-1022.
Kinnunen, U., Feldt, T., Geurts, S., & Pulkkinen, L. (2006). Types of work-family
interface: Well-being correlates of negative and positive spillover between
work and family. Scandinavian Journal of Psychology, 47, 149-162.
Kinnunen, U., Vermulst, A., Gerris, J., & Makikangas, A. (2003). Work-family
conflict and its relations to well-being: The role of personality as a
moderating factor. Personality & Individual Differences, 35, 1669-1683.
Kirchmeyer, C. (2000). Work-life initiatives: Greed or benevolence regarding

422
worker's time? In C. L. Cooper & D. M. Rousseau (Eds.), Time in
Organisational Behavior (Vol. 7, pp. 79-94). Chichester, England: John
Wiley and Sons.
Kirchmeyer, C. (2006). The different effects of family on objective career success
across gender: A test of alternative explanations. Journal of Vocational
Behavior, 68, 323-346.
Kline, R. B. (2006). Principles and practices of structural equation modeling. New
York: Guildford Press.
Klusmann, U., Kunter, M., Trautwein, U., Ludtke, O., & Baumert, J. (2008a).
Engagement and emotional exhaustion in teachers: Does the school context
make a difference? . Applied Psychology: An International Review, 57, 127-
151.
Klusmann, U., Kunter, M., Trautwein, U., Ludtke, O., & Baumert, J. (2008b).
Teachers' occupational well-being and quality of instruction: The important
role of self-regulatory patterns. Journal of Educational Psychology, 100(3),
702-715.
Koropeckyj-Cox, T. (2002). Beyond parental status: Psychological well-being in
middle and older age. Journal of Marriage & the Family, 64, 957-971.
Kossek, E. E., Colquitt, J. A., & Noe, R. A. (2001). Caregiving decisions, well-being,
and performance: The effects of place and provider as a function of
dependent type and work-family climates. Academy of Management Journal,
44(1), 29-44.
Kossek, E. E., & Ozeki, C. (1998). Work-family conflict, policies, and the job-life
satisfaction relationship: A review of directions for organizational behavior-
human resources research. Journal of Applied Psychology, 83(2), 139-149.
Kraut, R., Olson, J., Banaji, M., Bruckman, A., Cohen, J., & Couper, M. (2004).
Psychological research online: Report of Board of Scientific Affairs'
Advisory Group on the conduct of research on the internet. American
Psychologist, 59(2), 105-117.
Krauth, B. V. (2004). A dynamic model of job networking and social influences on
employment. Journal of Economic Dynamics and Control, 28(6), 1185-1204.
Kuiper, N. A., Grimshaw, M., Leite, C., & Kirsh, G. (2004). Humor is not always the
best medicine: Specific components of sense of humor and psychological
well-being. Humor, 17(1/2), 135-168.

423
Kuiper, N. A., & Nicholl, S. (2004). Thoughts of feeling better? Sense of humor and
physical health. Humor, 17(1/2), 37-66.
Kumpfer, K. L. (1999). Factors and processes contributing to resilience. In M. D.
Glantz & J. L. Johnson (Eds.), Resilience and development: Positive life
adaptations. New York: Kluwer Academic/Plenum Publishers.
Kwon, S.-M., & Oei, T. P. S. (2003). Cognitive change processes in a group
cognitive behaviour therapy of depression. Journal of Behavior Therapy and
Experimental Psychiatry, 34, 73-85.
Lachman, M. E., & Firth, K. M. P. (2004). The adaptive value of feeling control
during mid-life. In O. G. Brim, C. D. Ryff & L. L. Bumpass (Eds.), How
healthy are we? A national study of well-being in mid-life (pp. 320-349).
Chicago: The University of Chicago Press.
Lapierre, L. M., Spector, P. E., Allen, T. D., Poelmans, S., Cooper, C. L., O'Driscoll,
M. P., et al. (2008). Family-supportive organization perceptions, multiple
dimensions of work-family conflict, and employee satisfaction: A test of
model across five samples. Journal of Vocational Behavior, 73(1), 92-106.
Larsen, R. J., & Prizmic, Z. (2004). Affect regulation. In R. F. Baumeister & K. D.
Vohs (Eds.), Handbook of self-regulation (pp. 40-61). New York: The
Guildford Press.
Lazarus, R. S. (1993). From psychological stress to the emotions: A history of
changing outlooks. Annual Review of Psychology, 44, 1-21.
Le Fevre, M., Matheny, J., & Kolt, G. S. (2003). Eustress, distress, and interpretation
in occupational stress. Journal of Managerial Psychology, 18(7/8), 726-744.
Lee, R. M., & Robbins, S. B. (1995). Measuring belongingness: The social
connectedness and social assurance scales. Journal of Counseling
Psychology, 42(2), 232-241.
Lefcourt, H. M. (2002a). Humor. In C. R. Snyder & S. J. Lopez (Eds.), Handbook of
positive psychology (pp. 619-631). Oxford: Oxford University Press.
Lefcourt, H. M. (2002b). Humor as a moderator of life stress in adults. In C. Schaefer
(Ed.), Play therapy for adults (pp. 144-165). New York, N.Y.: Wiley and
Sons.
Lefcourt, H. M., Davidson, K., Prkachin, K. M., & Mills, D. E. (1997). Humor as a
stress moderator in the prediction of blood pressure obtained in five stressful
tasks. Journal of Research in Personality, 31, 523-542.

424
Leonardi, F., Sopazzafumo, L., & Marcellini, F. (2005). Subjective well-being: The
constructionist point of view. A longitudinal study to verify the predictive
power of top-down effects and bottom-up processes. Social Indicators
Research, 70, 53-77.
Levin, D. Z., & Cross, R. (2004). The strength of weak ties you can trust: The
mediating role of trust in effective knowledge transfer. Management Science,
50(11), 1477-1490.
Lewis, M. D. (1995). Cognitive-emotional feedback and the self-organization of
developmental paths. Human Development, 38, 71-102.
Lin, N., Ye, X., & Ensel, W. M. (1999). Social support and depressed mood: A
structural analysis. Journal of Health and Social Behavior, 40(4), 344-359.
Lingard, H., & Francis, V. (2004). The work-life experiences of office and site-based
employees in the Australian construction industry. Construction Management
and Economics, 22, 991-1002.
Liossis, P., & Noller, P. (2004). The daily lives of dual working families. Paper
presented at the International Conference on Work and Family, University of
Edinburgh, Edinburgh, Scotland.
Liossis, P., Shochet, I. M., Millear, P. M. R., & Biggs, H. (2009). The Promoting
Adult Resilience (PAR) program: The effectiveness of a second, shorter pilot
of a workplace prevention program Behaviour Change, 26(2), 97-112.
Lipkus, I. M., Martz, J. M., Panter, A. T., Drigotas, S. M., & Feaganes, J. R. (1992).
Do optimists distort their prediction for future positive and negative events?
Personality & Individual Differences, 15(5), 577-589.
Llorens, S., Schaufeli, W. B., Bakker, A. B., & Salanova, M. (2007). Does a positive
gain spiral of resources, efficacy beliefs and engagement exist? Computers in
Human Behavior, 23, 825-841.
Loscoco, K. A. (1997). Work-family linkages among self-employed women and
men. Journal of Vocational Behavior, 50, 204-226.
Lovibond, P. F., & Lovibond, S. H. (1995). The structure of negative emotional
states: Comparison of the Depression, Anxiety, and Stress Scale (DASS) with
the Beck Depression and Anxiety Inventories. Behaviour Research and
Therapy, 33(3), 335-343.
Lovibond, S. H., & Lovibond, P. F. (1995). Manual for the Depression Anxiety
Stress Scales. Sydney, Australia: Psychology Foundation of Australia.
425
Lucas, R. E., Clark, A. E., Georgellis, Y., & Diener, E. (2003). Re-examining
adaptation and the set point model of happiness: Reactions to changes in
marital status. Journal of Personality and Social Psychology, 84(3), 527-539.
Luppa, M., Heinrich, S., Angermeyer, M. C., Konig, H.-H., & Riedel-Heller, S. G.
(2007). Cost-of-illness studies of depression: A systematic review. Journal of
Affective Disorders, 98(1), 29-43.
Lykken, D., & Tellegen, A. (1996). Happiness is a stochastic phenomenon.
Psychological Science, 7(3), 186-189.
Lyttle, J. (2007). The judicious use and management of humor in the workplace.
Business Horizons, 50, 239-245.
Lyubormirsky, S., Sheldon, K. M., & Schkade, D. (2005). Pursuing happiness: The
architecture of sustainable change. Review of General Psychology, 9(2), 111-
131.
Lyubormirsky, S., & Tucker, K. L. (1998). Implications of individual differences in
subjective happiness for perceiving, interpreting, and thinking about life
vents. Motivation and Emotion, 22(2), 155-185.
Macan, T. H. (1994). Time management: Test of a process model. Journal of Applied
Psychology, 79(3), 381-391.
Macan, T. H., Shahani, C., Dipboye, R. L., & Phillips, A. P. (1990). College
students' time management: Correlations with academic performance and
stress. Journal of Educational Psychology, 82(4), 760-768.
MacCallum, R. C., Browne, M. W., & Sugawara, H. M. (1996). Power analysis and
determination of sample size for covariance structure modeling.
Psychological Methods, 1(2), 130-149.
Major, B., Richards, C., Cooper, M. L., Cozzarelli, C., & Zubek, J. (1998). Personal
resilience, cognitive appraisals, and coping: An integrative model of
adjustment to abortion. Journal of Personality and Social Psychology, 74(3),
735-752.
Makikangas, A., & Kinnunen, U. (2003). Psychosocial work stressors and well-
being: Self-esteem and optimism as moderators in a one-year longitudinal
sample. Personality & Individual Differences, 35, 537-557.
Marks, S. R. (1977). Multiple roles and role strain: Some notes on human energy,
time and commitment. American Sociological Review, 42, 921-936.
Marks, S. R., Huston, T. L., Johnson, E. M., & MacDermid, S. M. (2001). Role
426
balance among white married couples. Journal of Marriage & the Family,
63(4), 1083-1098.
Marks, S. R., & MacDermid, S. M. (1996). Multiple roles and the self: A theory of
role balance. Journal of Marriage & the Family, 58(2), 417-432.
Marshall, M. A., & Lang, E. L. (1990). Optimism, self-mastery, and the symptoms of
depression in women professionals. Journal of Personality and Social
Psychology, 59(1), 132-139.
Martin, C. L., & Halverson, C. F. (1981). A schematic processing model of sex
typing and stereotyping in children. Child Development, 52(4), 1119-1134.
Martin, R. A. (2001). Humor, laughter, and physical health: Methodological issues
and research findings. Psychological Bulletin, 127(4), 504-519.
Martin, R. A., & Lefcourt, H. M. (1983). Sense of humor as a moderator of the
relation between stressors and moods. Journal of Personality and Social
Psychology, 45(6), 1313-1324.
Martin, R. A., Puhlik-Doris, P., Larsen, G., Gray, J., & Weir, K. (2003). Individual
differences in uses of humor and their relation to psychological well-being:
Development of the Humor Styles Questionnaire. Journal of Research in
Personality, 37, 48-75.
Martinussen, M., Richardsen, A. M., & Burke, R. J. (2007). Job demands, job
resources and burnout among police officers. Journal of Criminal Justice, 35,
239-249.
Maslach, C. (1993). Burnout: A multidimensional perspective. In W. B. Schaufeli, C.
Maslach & T. Marek (Eds.), Professional burnout: recent developments in
theory and research (pp. 19-32). Washington DC: Taylor & Francis.
Maslach, C. (1998). A multidimensional theory of burnout. In C. L. Cooper (Ed.),
Theories of organizational stress (pp. 68-85). Oxford: Oxford University
Press.
Maslach, C. (2006). Understanding job burnout. In A. M. Rossi, P. L. Perrewé & S.
L. Sauter (Eds.), Stress and the quality of working life: Current perspectives
in occupational health. Greenwich, Connecticut: Information Age Publishing.
Maslach, C., Jackson, L. M., & Leiter, M. P. (1996). Maslach Burnout Inventory
manual. Palo Alto, CA: CPP Inc.
Maslach, C., & Jackson, S. E. (1981). The measurement of experienced burnout.
Journal of Occupational Behaviour, 2(2), 99-113.

427
Maslach, C., & Leiter, M. P. (1997). The truth about burnout: How organizations
cause personal stress and what to do about it. San Francisco Josie Bass
Publishers.
Maslach, C., & Leiter, M. P. (2008). Early predictors of job burnout and engagement.
Journal of Applied Psychology, 93(3), 498-512.
Maslach, C., Schaufeli, W. B., & Leiter, M. P. (2001). Job burnout. Annual Review
of Psychology, 52, 397-422.
Masten, A. S. (2001). Ordinary magic. American Psychologist, 56(3), 227-238.
Masten, A. S., & Reed, M.-G. J. (2002). Resilience in development. In C. R. Snyder
& S. J. Lopez (Eds.), Handbook of positive psychology (pp. 74-88). Oxford:
Oxford University Press.
Maume, D. J., & Bellas, M. L. (2001). The overworked American or the time bind?
The American Behavioral Scientist, 44(7), 1137-1156.
Mauno, S., Kinnunen, U., & Ruokolainen, M. (2007). Job demands and resources as
antecedents of work engagement: A longitudinal study. Journal of Vocational
Behavior, 70, 149-171.
Maurer, T. W., & Pleck, J. H. (2006). Fathers' caregiving and breadwinning: A
gender congruence analysis. Psychology of Men and Masculinity, 7(2), 101-
112.
Maxwell, G. A. (2005). Checks and balances: The role of managers in work-life
balance policies and practices. Journal of Retailing and Consumer Services,
12, 179-189.
McAdam, d. P., de St Aubin, E., & Logan, R. L. (1993). Generativity among young,
midlife and older adults. Psychology and Aging, 8(2), 221-230.
McDaid, D., Curran, C., & Knapp, M. (2005). Promoting mental well-being in the
workplace: A European policy perspective. International Review of
Psychiatry, 17(5), 365-373.
McGregor, B. A., Bowen, D. J., Ankerst, D. P., Andersen, M. R., Yasui, Y., &
McTiernan, A. (2004). Optimism, perceived risk of breast cancer, and cancer
worry among a community-based sample of women. Health Psychology,
23(4), 339-344.
McManus, K., Korabik, K., Rosin, H. M., & Kelloway, E. K. (2002). Employed
mothers and the work-family interface: Does family structure matter? Human
Relations, 55(11), 1295-1324.
428
Meade, A. W., Michels, L. C., & Lautenschlanger, G. J. (2007). Are internet and
paper-and-pencil personality tests truly comparable? Organizational
Research Methods, 10(2), 322-345.
Menard, S. (1991). Longitudinal research. Newbury Park, CA: Sage Publications.
Meyer, J. P., & Allen, N. J. (1991). A three-component conceptualization of
organizational commitment. Human Resource Management Review, 1(1), 61-
89.
Meyer, J. P., Stanley, D. J., Herscovitch, L., & Topolnytsky, L. (2002). Affective,
continuance, and normative commitment to the organization: A meta-analysis
of antecedents, correlates, and consequences. Journal of Vocational
Behavior, 61, 20-52.
Miech, R. A., Caspi, A., Moffitt, T. E., Wright, B. R. E., & Silva, P. A. (1999). Low
socioeconomic status and mental disorders: A longitudinal study of selection
and causation during young adulthood. The American Journal of Sociology,
104(4), 1096-1131.
Milkie, M. A., & Peltola, P. (1999). Playing the roles: Gender and the work-family
balancing act. Journal of Marriage & the Family, 61(2), 476-490.
Millear, P. M. R., Liossis, P., Shochet, I. M., Biggs, H., & Donald, M. (2008). Being
on PAR: Outcomes of a pilot trial to improve mental health and well-being in
the workplace with the Promoting Adult Resilience (PAR) program.
Behaviour Change, 25(4), 215-228.
Moen, P. (1992). Women's two roles: A contemporary dilemma. New York: Auburn
House.
Moen, P. (2003). It's about time: Couples and careers. Ithaca, N.Y.: ILR Press,
Cornell University Press.
Moen, P., Dempster-McClain, D., Altobelli, J., Wimonsate, W., Dahl, L., Roehling,
P. V., et al. (2004). The new 'middle' work force. Ithaca, N.Y.:
Bronfenbrenner Life Course Centre, Cornell University.
Moen, P., & Erickson, M. A. (1995). Linked lives: A transgenerational approach to
resilience. In P. Moen, G. H. Elder & K. Luscher (Eds.), Examining lives in
context: perspectives on the ecology of human development (pp. 169-210).
Washington DC: American Psychological Association
Moen, P., Harris-Abbott, Lee, S., & Roehling, P. V. (1999). The Cornell couples and
careers study. Ithaca, N.Y.: Cornell Employment and Family Careers

429
Institute, Cornell University.
Moen, P., & Sweet, S. (2003). Time clocks: Work-hour strategies. In P. Moen (Ed.),
It's about time: Couples and careers. (pp. 18-34). Ithaca, N.Y.: Cornell
University Press.
Moen, P., Waismel-Manor, R., & Sweet, S. (2003). Success. In P. Moen (Ed.), It's
about time: Couples and careers. (pp. 133-152). Ithaca, N.Y.: Cornell
University Press.
Moen, P., & Yu, Y. (2000). Effective work/life strategies: Working couples, work
conditions, gender, and life quality. Social Problems, 47(3), 291-326.
Muller, D., Judd, C. M., & Yzerbyt, V. Y. (2005). When moderation is mediated and
mediation is moderated. Journal of Personality and Social Psychology, 89(6),
852-863.
Myers, D. G., & Diener, E. (1996). The pursuit of happiness. Scientific American,
May, 70-72.
Needles, D. J., & Abramson, L. Y. (1990). Positive life events, attribution style, and
hopefulness: Testing a model for the recovery from depression. Journal of
Abnormal Psychology, 99(2), 156-165.
Nelson, D. L., & Simmons, B. L. (2003). Health psychology and work stress: A more
positive approach. In J. C. Quick & L. E. Tetrick (Eds.), Handbook of
occupational health psychology (pp. 97-122). Washington, D.C.: American
Psychological Association.
Nezlek, J. B., & Derks, P. (2001). Use of humor as a coping mechanism,
psychological adjustment, and social interaction. Humor, 14(4), 395-413.
Ng, T. W. H., Butts, M. M., Vandenburg, R. J., DeJoy, D. M., & Wilson, M. G.
(2006). Effects of management communication, opportunity for learning, and
work schedule flexibility on organizational commitment. Journal of
Vocational Behavior, 68, 74-489.
Nickerson, C., Schwartz, N., Diener, E., & Kahneman, D. (2003). Zeroing in on the
dark side of the American dream: A close look at the negative consequences
of the goal for financial success. Psychological Science, 14(6), 531-536.
Olsen, M. L., Hugelshofer, D. S., Kwon, P., & Reff, R. C. (2005). Rumination and
dysphoria: The buffering role of adaptive forms of humor. Personality &
Individual Differences, 39, 1419-1428.
Palkovitz, R. (1996). Parenting as a generator of adult development: Conceptual

430
issues and implications. Journal of Social and Personal Relationships, 13(4),
571-592.
Parasuraman, S., & Simmers, C. A. (2001). Type of employment, work-family
conflict and well-being: A comparative study. Journal of Organizational
Behavior, 22, 551-568.
Park, N., Peterson, C., & Seligman, M. E. P. (2004). Strengths of character and well-
being. Journal of Social and Clinical Psychology, 23(5), 603-619.
Patterson, G. T. (2003). Examining the effects of coping and social support on work
and life stress among police officers. Journal of Criminal Justice, 31(3), 215-
226.
Patterson, J. M. (2002). Integrating family resilience and family stress theory.
Journal of Marriage & the Family, 64, 349-360.
Peeters, M. C. W., Montgomery, A. J., Bakker, A. B., & Schaufeli, W. B. (2005).
Balancing work and home: How job and home demands are related to
burnout. International Journal of Stress Management, 12(1), 43-61.
Perrewé, P. L., & Hochwarter, W. A. (2001). Can we really have it all? The
attainment of work and family values. Current Directions in Psychological
Science, 10(1), 29-33.
Perrons, D. (2003). The new economy and the work-life balance: Conceptual
explorations and a case study of new media. Gender, Work and Organization,
10(1), 65-93.
Peterson, C. (1999). Personal control and well-being. In D. Kahneman, E. Diener &
N. Schwartz (Eds.), Well-being: The foundations of hedonic psychology (pp.
288-301). New York: Russell Sage Foundation.
Peterson, C., & Chang, E. C. (2003). Optimism and flourishing. In C. L. M. Keyes &
J. Haidt (Eds.), Flourishing: Positive Psychology and The Life Well-Lived.
(pp. 55-79). Washington, D.C.: American Psychological Association.
Peterson, C., Seligman, M. E. P., & Vaillant, G. (1988). Pessimistic explanatory style
is a risk for physical illness: A thirty-five-year longitudinal study Journal of
Personality and Social Psychology, 55(1), 23-27.
Peterson, C., Semmel, A., von Baeyer, C., Abramson, L. Y., Metalsky, G. I., &
Seligman, M. E. P. (1982). The attributional style questionnaire. Cognitive
Therapy and Research, 6(3), 287-300.
Pienaar, J., & Willemse, S. A. (2007). Burnout, engagement, coping and general

431
health in service employees in the hospitality industry. Tourism Management,
in press.
Pierce, G. R., Sarason, I. G., & Sarason, B. R. (1996). Coping and social support. In
M. Zeidner & N. S. Endler (Eds.), Handbook of coping: Theory, research,
applications (pp. 434-451). New York: John Wiley & Sons.
Pines, A. M. (1993). Burnout: An existential perspective. In W. B. Schaufeli, C.
Maslach & T. Marek (Eds.), Professional burnout: Recent developments in
theory and research (pp. 33-51). Washington DC: Taylor & Francis.
Pleck, J. H., & Stueve, J. L. (2001). Time and paternal involvement. In K. J. Daly
(Ed.), Minding the time in family experience (Vol. 3, pp. 205-226).
Amsterdam: JAI, Elsevier Science.
Plomin, R., Scheier, M. F., Bergeman, C. S., Pedersen, N. L., Nesselroade, J. R., &
McClearn, G. E. (1992). Optimism, pessimism and mental health: A
twin/adoption analysis. Personality & Individual Differences, 13(8), 921-930.
Plutchnik, R. (1995). A theory of ego defenses. In H. R. Conte & R. Plutchnik (Eds.),
Ego defenses: Theory and measurement (pp. 13-37). New York: John Wiley
& Sons.
Pocock, B. (2003). The work-life collision. Sydney: The Federation Press.
Pocock, B. (2005). Work-life 'balance' in Australia: Limited progress, dim prospects.
Asia Pacific Journal of Human Resources, 43(2), 198-209.
Posternak, M. A., & Miller, I. (2001). Untreated short-term course of major
depression: A meta-analysis of outcomes from studies using wait-list control
groups. Journal of Affective Disorders, 66(2), 139-146.
Powell, G. N., & Eddlestone, K. A. (2008). The paradox of the contented female
business owner. Journal of Vocational Behavior, 73(1), 24-36.
Powell, G. N., & Graves, L. M. (2003). Women and men in management (3rd ed.).
Thousand Oakes, CA: Sage Publications.
Preacher, K. J., & Hayes, A. F. (2008). Asymptotic and resampling strategies for
assessing and comparing indirect effects in multiple mediator models.
Behaviour Research Methods, 40(3), 879-891.
Pretzer, J. L., Beck, A. T., & Newman, C. F. (2002). Stress and stress management:
A cognitive view. In R. L. Leahy & E. T. Dowd (Eds.), Clinical advances in
cognitive psychotherapy (pp. 345-360). New York: Springer Publishing
Company.

432
Prottas, D. J., & Thompson, C. A. (2006). Stress, satisfaction, and the work-family
interface: A comparison of self-employed business owners, independents, and
organizational employees. Journal of Occupational Health Psychology,
11(4), 366-378.
Proulx, C. M., Helms, H. M., & Buehler, C. (2007). Marital quality and personal
well-being: A meta-analysis. Journal of Marriage & the Family, 69, 576-593.
Puskar, K., Ren, D., Bernardo, L. M., Haley, T., & Stark, K. H. (2008). Anger
correlated with psychosocial variables in rural youth. Issues in
Comprehensive Pediatric Nursing, 31(1), 71-87.
Raghuram, S., Garud, R., Wiesenfeld, B., & Gupta, V. (2001). Factors contributing
to virtual work adjustment. Journal of Management, 27, 383-405.
Rantenan, J., Kinnunen, U., Feldt, T., & Pulkkinen, L. (2008). Work-family conflict
and psychological well-being: Stability and cross-lagged relations within one-
and six-year follow-ups. Journal of Vocational Behavior, 73(1), 37-51.
Reed, T. S., Heppard, K. A., & Corbett, A. C. (2004). I get by with a little help from
my friends. Management Communication Quarterly, 17(3), 452-477.
Reijneveld, S. A. (2005). Mental health as a public health issue. European Journal of
Public Health, 15(2), 111.
Reis, H. T., Collins, W. A., & Berscheid, E. (2000). The relationship context of
human behavior and development. Psychological Bulletin, 126(6), 844-872.
Relationships Forum Australia. (2007). An unexpected tragedy: Evidence of the
connection between working patterns and family breakdown in Australia.
Sydney, Australia: Relationships Forum Australia.
Roberts, B. W., Helson, R., & Klohen, E. C. (2002). Personality development and
growth in women across 30 years: Three perspectives. Journal of Personality,
70(1), 79-102.
Roe, R. A., & Zijlstra, F. R. H. (2000). Work pressure: Results of a conceptual and
empirical analysis. In M. Vartiainen, F. Avallone & N. Anderson (Eds.),
Innovative theories, tools and practices in work and organizational
psychology. Seattle: Hogrefe & Huber Publishers.
Ryan, R. M., & Deci, E. L. (2000). Self-determination theory and the facilitation of
intrinsic motivation, social development, and well-being. American
Psychologist, 55(1), 68-78.
Ryan, R. M., & Deci, E. L. (2001). On happiness and human potentials: A review of

433
research on hedonic and eudaimonic well-being. [Article]. Annual Review of
Psychology, 52(1), 141.
Ryff, C. D. (1989). Happiness is everything, or is it? Explorations on the meaning of
psychological well-being. Journal of Personality and Social Psychology,
57(6), 1069-1081.
Ryff, C. D., & Keyes, C. L. M. (1995). The structure of psychological well-being
revisited. Journal of Personality and Social Psychology, 69(4), 719-727.
Ryff, C. D., & Singer, B. (1998). The contours of positive human health.
Psychological Inquiry, 9(1), 1-28.
Ryff, C. D., Singer, B., Love, G. D., & Essex, M. J. (1998). Resilience in adulthood
and later life. In J. Lomranz (Ed.), Handbook of aging and mental health, an
integrative approach. (pp. 69-96). New York: Plenum Press.
Salanova, M., Bakker, A. B., & Llorens, S. (2006). Flow at work: Evidence of an
upward spiral of personal and organizational resources. Journal of Happiness
Studies, 7(1), 1-22.
Schaubroeck, J., Jones, J. R., & Xie, J. L. (2001). Individual differences in ulitilizing
control to cope with job demands: Effects of susceptibility to infectious
disease. Journal of Applied Psychology, 86(2), 265-278.
Schaufeli, W. B., & Bakker, A. B. (2004). Job demands, job resources, and their
relationship with burnout and engagement: A multi-sample study. Journal of
Organizational Behavior, 25, 293-315.
Schaufeli, W. B., & Buunk, B. P. (1996). Professional burnout. In M. J. Schabracq, J.
A. M. Winnubst & C. L. Cooper (Eds.), Handbook of work and health
psychology (pp. 311-346). New York: John Wiley & Sons Ltd.
Schaufeli, W. B., Salanova, M., Gonzalez-Roma, V., & Bakker, A. B. (2002). The
measurement of engagement and burnout: A two sample confirmatory factor
analytic approach. Journal of Happiness Studies, 3, 71-92.
Schaufeli, W. B., Taris, T. W., & van Rhenen, W. (2008). Workaholism, burnout and
work engagement: Three of a kind or three different kinds of employee well-
being? . Applied Psychology: An International Review, 57(2), 173-203.
Scheier, M. F., & Carver, C. S. (1992). Effects of optimism on psychological and
physical well-being: Theoretical overview and empirical update. Cognitive
Therapy and Research, 16(2), 201-228.
Scheier, M. F., Carver, C. S., & Bridges, M. W. (1994). Distinguishing optimism

434
from neuroticism (and trait anxiety, self-mastery, and self-esteem): A
reevaluation of the Life Evaluation Test. Journal of Personality and Social
Psychology, 67(6), 1063-1078.
Scheier, M. F., Carver, C. S., & Bridges, M. W. (2002). Optimism, pessimism, and
psychological well-being. In E. C. Chang (Ed.), Optimism and Pessimism,
implications for Theory and Research. (pp. 189-216). Washington. D.C.:
American Psychological Association.
Schmacker, R. E., & Lomax, R. G. (2004). A beginner's guide to structural equation
modeling. Mahwah, NJ: Lawrence Erlbaum.
Schmutte, P. S., & Ryff, C. D. (1997). Personality and well-being: Reexamining
methods and meanings. Journal of Personality and Social Psychology, 73(3),
549-559.
Schneider, S. L. (2001). In search of realistic optimism. American Psychologist,
56(2), 250-263.
Scholarios, D., & Marks, A. (2004). Work-life balance and the software worker.
Human Resource Management Journal, 14(2), 54-74.
Scholz, U., Gutierrez, B., Sud, S., & Schwarzer, R. (2002). Is general self-efficacy a
universal construct?: Psychometric findings from 25 countries. European
Journal of Psychological Assessment, 18(3), 242-251.
Schwartz, J. E., Pieper, C. F., & Karasek, R. (1988). A procedure for linking
psychosocial job characteristics data to health surveys. American Journal of
Public Health, 78(8), 904-909.
Schwartz, J. E., & Stone, A. A. (1993). Coping with daily work problems:
Contributions of problem content, appraisals, and person factors. Work and
Stress, 7(1), 47-62.
Schwarzer, R. (1992). Self-efficacy in the adoption and maintenance of health
behaviors: Theoretical approaches and a new model. In R. Schwarzer (Ed.),
Self-efficacy: Thought control in action (pp. 217-243). Washington, D.C.:
Hemisphere Publishing Corporation.
Schwarzer, R. (2001). Social-cognitive factors in changing health-related behaviours.
Current Directions in Psychological Science, 10(2), 47-51.
Schwarzer, R., & Renner, B. (2000). Social-cognitive predictors of health behavior:
Action self-efficacy and coping self-efficacy. Health Psychology, 19(5), 487-
495.

435
Schwarzer, R., & Taubert, S. (2002). Tenacious goal pursuit and striving toward
personal growth: Proactive coping. In E. Frydenberg (Ed.), Beyond coping:
Meeting goals, visions, and challenges (pp. 19-36). Oxford: Oxford
University Press.
Seaward, B. L. (2004). Managing Stress, Principles and Strategies for Health and
Well-Being (4th ed.). Boston: Jones and Bartlett Publishers.
Segrin, C., & Abramson, L. Y. (1994). Negative reactions to depressive behaviors: A
communication theories analysis. Journal of Abnormal Psychology, 103(2),
655-668.
Seligman, M. E. P. (2002). Positive psychology, positive prevention, and positive
therapy. In C. R. Snyder & S. J. Lopez (Eds.), Handbook of Positive
Psychology (pp. 3-9). Oxford: Oxford University Press.
Seligman, M. E. P., & Csikszentmihalyi, M. (2000). Positive psychology. American
Psychologist, 55(1), 5-14.
Selye, H. (1976). Stress in health and disease. Boston: Butterworth Publishers.
Semmer, N. K. (2003). Individual differences, work stress, and health. In M. J.
Schabracq, J. A. M. Winnubst & C. L. Cooper (Eds.), Handbook of work and
health psychology (pp. 83-120). Chichester, UK.: John Wiley & Sons, Ltd.
Senecal, C., Vallerand, R. J., & Guay, F. (2001). Antecedents and outcomes of work-
family conflict: Toward a motivational model. Personality and Social
Psychology Bulletin, 27(2), 176-186.
Shahar, G., Joiner, J., Thomas E., Zuroff, D. C., & Blatt, S. J. (2004). Personality,
interpersonal behavior, and depression: co-existence of stress-specific
moderating and mediating effects. Personality and Individual Differences,
36(7), 1583-1596.
Shmotkin, D. (2005). Happiness in the face of adversity: Reformulating the dynamic
and modular bases of subjective well-being. Review of General Psychology,
9(4), 291-325.
Simmons, B. L., & Nelson, D. L. (2001). Eustress at work: The relationship between
hope and health in hospital nurses. Health Care Management Review, 26(4),
7-18.
Simpson, R. (2005). Men in non-traditional occupations: Career entry, career
orientation and experience of role strain. Gender, Work and Organization,
12(4), 363-380.
436
Skinner, E. A., Edge, K., Altman, J., & Sherwood, H. (2003). Searching for the
structure of coping: A review and critique of category systems for classifying
ways of coping. Psychological Bulletin, 129(2), 216-269.
Skinner, E. A., & Zimmer-Gembeck, M. J. (2007). The development of coping.
Annual Review of Psychology, 58, 119-144.
Solberg, E. G., Diener, E., & Robinson, M. D. (2004). Why are materialists less
satisfied? In T. Kasser & A. D. Kanner (Eds.), Psychology and The Consumer
Culture, The Struggle for the Good Life in a Materialistic World. (pp. 29-48).
Washington, D.C.: American Psychological Society.
Solomon, M. (2000). The fruits of their labors: A longitudinal exploration of parent
personality and adjustment in their adult children. Journal of Personality,
68(2), 281-308.
Sonnentag, S. (2003). Recovery, work engagement, and proactive behavior: A new
look at the interface between non-work and work. Journal of Applied
Psychology, 89(3), 518-528.
Sonnentag, S., & Bayer, U.-V. (2006). Switching off mentally: Predictors and
consequences of psychological detachment from work during off-job time
Journal of Occupational Health Psychology, 10(4), 393-414.
Sonnentag, S., & Zijlstra, F. R. H. (2006). Job characteristics and off-job activities as
predictors for the need for recovery, well-being and fatigue. Journal of
Applied Psychology, 91(2), 330-350.
Starrels, M. E. (1992). The evolution of family policy research. Journal of Family
Issues, 13(3), 259-278.
Steinberg, L., Darling, N. E., Fletcher, A. C., Brown, B. B., & Dornbusch, S. M.
(1995). Authoritative parenting and adolescent adjustment: An ecological
journey. In P. Moen, G. H. Elder & K. Luscher (Eds.), Examining Lives in
Context, Perspectives on the Ecology of Human Development. (pp. 423-466).
Washington, D.C.: American Psychological Association.
Steinmetz, H., Frese, M., & Schmidt, P. (2008). A longitudinal panel study on
antecedents and outcomes of work-home interference. Journal of Vocational
Behavior, 73, 231-241.
Stevens, D. P., Minnotte, K. L., Mannon, S. E., & Kiger, G. (2007). Examining the
'neglected side of work-family interface'. Journal of Family Issues, 28(2),
242-262.
437
Sumi, K. (1997). Optimism, social support, stress, and physical and psychological
well-being in Japanese women. Psychological Reports, 81, 299-306.
Tabachnick, B. G., & Fidell, L. S. (2001). Using multivariate statistics (4th ed.).
Needham Heights, MA: Allyn and Bacon.
Tamblyn, D. (2003). Laugh and learn: 95 ways to use humor for more effective
teaching and training. New York: AMACOM.
Tang, C. S.-K., Au, W.-T., Schwarzer, R., & Schmitz, G. (2001). Mental health
outcomes of job stress among Chinese teachers: Role of stress resource
factors and burnout. Journal of Organizational Behavior, 22(8), 887-901.
Taubman-Ben-Ari, O., & Weintroub, A. (2008). Meaning in life and personal growth
among pediatric physicians and nurses. Death Studies, 32, 621-645.
Taylor, S. E., Kemeny, M. E., Reed, G. M., Bower, J. E., & Gruenewald, T. L.
(2000). Psychological resources, positive illusions, and health. American
Psychologist, 55(1), 99-109.
ter Doest, L., & de Jonge, J. (2006). Testing causal models of job characteristics and
employee well-being: A replication study using cross-lagged structural
equation modelling. Journal of Occupational and Organizational
Psychology, 79, 499-507.
Theorell, T. (2003). To be able to exert control over one's situation: A necessary
condition for coping with stressors. In J. C. Quick & L. E. Tetrick (Eds.),
Handbook of Occupational Health Psychology (pp. 201-219). Washington,
DC: American Psychological Association.
Theorell, T., Tsutsumi, A., Hallquist, J., Reuterwall, C., Hogstedt, C., Fredlund, P., et
al. (1998). Decision latitude, job strain, and myocardial infarction: A study of
working men in Stockholm. American Journal of Public Health, 88(3), 382-
388.
Thoits, P. A. (1994). Stressors and problem-solving: The individual as psychological
activist. Journal of Health and Social Behavior, 35(2), 143-160.
Thompson, B. (2000). Ten commandments of structural equation modeling. In L. G.
Grimm & P. R. Yarnold (Eds.), Reading and understanding more
multivariate statistics (pp. 261-283). Washington, DC: American
Psychological Association.
Thompson, C. A., Beauvais, L. L., & Lyness, K. S. (1999). When work benefits are
not enough: The influence of work-family culture on benefit utilization,

438
organizational attachment, and work-family conflict. Journal of Vocational
Behavior, 54, 392-415.
Thompson, C. A., Jahn, E. W., Kopelan, R. E., & Prottas, D. J. (2004). Perceived
organizational family support: A longitudinal and multilevel analysis. Journal
of Managerial Issues, 16(4), 545-565.
Thompson, T., & le Fevre, C. (1999). Implications of manipulating anticipatory
attributions on the strategy use of defensive pessimists and strategic
optimists. Personality & Individual Differences, 26(5), 887-904.
Thornton, M., & Bagust, J. (2007). The gender trap: Flexible work practices in
corporate legal practice. Osgoode Hall Law Journal, 45(4), 773-811.
Thorson, J. A., Powell, F. C., Sarmany-Schuller, I., & Hampes, W. P. (1997).
Psychological health and sense of humor. Journal of Clinical Psychology,
53(6), 605-619.
Tombari, N., & Spinks, N. (1999). The work/family interface at Royal Bank
Financial Group: Successful solutions - a retrospective look at lessons learnt.
Women in Management Review, 14(5), 186-193.
Turner, N., Barling, J., & Zacharatos, A. (2002). Positive psychology at work. In C.
R. Snyder & S. J. Lopez (Eds.), Handbook of positive psychology (pp. 715-
728). Oxford: Oxford University Press.
Tzelgov, J., & Henik, A. (1991). Suppression situations in psychological research:
Definitions, implications and applications. Psychological Bulletin, 109(3),
524-536.
Vaillant, G. (2000). Adaptive mental mechanisms. American Psychologist, 55(1), 89-
98.
Vaillant, G. (2002). Ageing well. Melbourne, Australia: Scribe Publications.
Van Der Doef, M., & Maes, S. (1999). The Job Demand-Control (-Support) Model
and psychological well-being: A review of 20 years of empirical research.
Work and Stress, 13(2), 87-114.
van Hooff, M. L. M., Geurts, S., Taris, T. W., Kompier, M. A. J., Dikkers, J.,
Houtman, I. L. D., et al. (2005). Disentangling the causal relationships
between work-home interface and employee health. Scandinavian Journal of
Work and Environmental Health, 31(1), 15-29.
van Ypern, N. W., & Hagedoorn, M. (2003). Do high job demands increase intrinsic
motivation or fatigue or both? The role of job control and job social support.

439
Academy of Management Journal, 46(3), 339-348.
Vinje, H. F., & Mittelmark, M. B. (2007). Job engagement's paradoxical role in nurse
burnout. Nursing and Health Sciences, 9, 107-111.
Volker, B., & Flap, H. (2001). Weak ties as a liability: The case of East Germany.
Rationality and Society, 13(4), 397-428.
Voydanoff, P. (2002). Linkages between the work-family interface and work, family,
and individual outcomes. Journal of Family Issues, 23(1), 138-164.
Voydanoff, P. (2004a). The effects of work and community resources and demands
on family integration. Journal of Family and Economic Issues, 25(1), 7-23.
Voydanoff, P. (2004b). The effects of work demands and resources on work-to-
family conflict and facilitation. Journal of Marriage & the Family, 66(2),
398-412.
Voydanoff, P. (2004c). Implications of work and community demands and resources
for work-to-family conflict and facilitation. Journal of Occupational Health
Psychology, 9(4), 275-285.
Voydanoff, P. (2005a). The differential salience of family and community demands
and resources for family-to-work conflict and facilitation. Journal of Family
and Economic Issues, 26(3), 395-417.
Voydanoff, P. (2005b). Toward a conceptualization of perceived work-family fit and
balance: A demands and resources approach. Journal of Marriage & the
Family, 67, 822-836.
Voydanoff, P., & Donnelly, B. W. (1999). Multiple roles and psychological distress:
The intersection of worker, spouse, and parent roles with the role of the adult
child. Journal of Marriage & the Family, 61(3), 725-738.
Wainwright, D., & Calnan, M. (2002). Work stress: The making of a modern
epidemic. Buckingham, UK: Open University Press.
Wallace, J. E., & Young, M. C. (2008). Parenthood and productivity: A study of
demands, resources and family-friendly firms. Journal of Vocational
Behavior, 72(1), 110-122.
Wallerstein, J. S., & Blakeslee, S. (1995). The good marriage: How and why love
lasts. London: Bantam Press.
Wang, P. S., & Kessler, R. C. (2006). Global burden of mood disorders. In D. J.
Stein, D. J. Kupfer & A. F. Schatzberg (Eds.), Textbook of mood disorders
(pp. 55-67). Washington DC: American Psychiatric Publishing Inc.

440
Wayne, J. H., Musisca, N., & Fleeson, W. (2004). Considering the role of personality
in the work-family experience: Relationships of the big five to work-family
conflict and facilitation. Journal of Vocational Behavior, 64, 108-130.
Weisfeld, G. E. (1993). The adaptive value of humor and laughter. Ethology and
Sociobiology, 14, 141-169.
Wenglert, L., & Rosen, A.-S. (2000). Measuring optimism-pessimism from beliefs
about future events. Personality and Individual Differences, 28(4), 717-728.
White, M., Hill, S., McGovern, P., Mills, C., & Smeaton, D. (2003). 'High
performance' management practices, working hours and work-life balance.
British Journal of Industrial Relations, 41(2), 175-195.
Wilhelm, K., Mitchell, P. B., Niven, A., Finch, A., Wedgewood, L., Scimone, A., et
al. (2006). Life events, first depression onset, and the serotonin transporter
gene. British Journal of Psychiatry, 188, 210-215.
Wilkinson, I. M., & Blackburn, I.-M. (1981). Cognitive style in depressed and
recovered depressed patients. British Journal of Clinical Psychology, 20,
283-292.
Williams, A., Franche, R.-L., Ibrahim, S., Mustard, C. A., & Layton, F. R. (2006).
Examining the relationship between work-family spillover and sleep quality.
Journal of Occupational Health Psychology, 11(1), 27-36.
Witt, L. A., & Carlson, D. S. (2006). The work-family interface and job
performance: Moderating effects of conscientiousness and perceived
organizational support. Journal of Occupational Health Psychology, 11(4),
343-357.
World Health Organization. (2001). The World Health Report: Mental health: New
understanding, new hope. Geneva: World Health Organization.
World Health Organization. (2007). World health statistics 2007. Retrieved 20 May
2008, from www.who.int/whosis/whostat2007.pdf
Wrosch, C., Scheier, M. F., Carver, C. S., & Schulz, R. (2003). The importance of
goal disengagement in adaptive self-regulation: When giving up is beneficial.
Self and Identity, 2(1), 1-20.
Wrosch, C., Scheier, M. F., Miller, G. E., Schulz, R., & Carver, C. S. (2003).
Adaptive self-regulation of unattainable goals: Goal disengagement, goal
reengagement and subjective well-being. Personality and Social Psychology
Bulletin, 29(12), 1494-1508.

441
Xanthopoulou, D., Bakker, A. B., Demerouti, E., & Schaufeli, W. B. (2007). The
role of personal resources in the Job Demand-Resources Model. International
Journal of Stress Management, 14(2), 121-141.
Yates, T. M., & Masten, A. S. (2004). Fostering the future: Resilience theory and the
practice of positive psychology. In P. A. Linley & S. Joseph (Eds.), Positive
psychology in practice (pp. 521-539). Hoboken, N.J.: John Wiley & Sons.
Zapf, D., Dormann, C., & Frese, M. (1996). Longitudinal studies in organizational
stress research: A review of the literature with reference to methodological
issues. Journal of Occupational Health Psychology, 1(2), 145-169.
Zhan, M., & Pandey, S. (2004). Postsecondary education and economic well-being of
single mothers and single fathers. Journal of Marriage & the Family, 66(3),
661-673.

442
Appendices
Appendix A: Call for volunteers from the university alumni
Dear member of the alumni,
PRIZES TO BE WON!!
WELL-BEING AND WORK-BALANCE STUDY
Volunteers are required for email survey
Happy at home and happy at work? If you are – or if you aren‟t – Prue Millear, a
PhD student in QUT‟s School of Psychology and Counselling wants to hear from
you. She is exploring the relationships between the individual, their work and
personal responsibilities, and their well-being and work-life balance.
To fully understand how the relationships develop over time, you will be asked to
complete the surveys at three time points; now (June, 2007), in 3 months time
(September, 2007), and 6 months after that (February, 2008). By completing all three
surveys, you will be in a draw to win a great prize, an „Accor Hotels Gift Cards‟,
valued at $250. The gift voucher can be redeemed at one of Accor‟s Hotels, such as
Novotel, Sofitel, Grand Mecure, All Seasons or Ibis Hotels across Australia. The
winners will be notified at the end of the project by email.
If you choose to participate, it is requested that you participate in the study once only
at each time point. The survey should take approximately 25 to 30 minutes to
complete. You can exit the survey and return at a later time to the same point, but
you must use the same computer to do so. Completion and submission of the
questionnaire will be taken as your consent to participate in the „Well-being and the
Work-Life Interface‟ Study.
http://www.surveymonkey.com/s.asp?u=111873790210
Ethical considerations for this research
Please be assured that your answers will remain completely confidential and
anonymous. Because the study is longitudinal, email addresses of volunteers are
retained for the length of the project, BUT will be kept separate from any data
collected, so there is no link between answers and any particular person.
Participation is voluntary and you are free to withdraw from the study at any time
without comment or penalty. There are some risks associated with this project with
some questions that could be considered sensitive. QUT provides for limited free
counselling for research participants of QUT research projects, who may experience
some distress as a result of their participation in the research. Should you wish to
access this service, please contact the Clinic Receptionist of the QUT Psychology
Clinic on 07 3864 4578. Please indicate that you are a research participant.
Should you have any questions or comments regarding the ethical nature of this
research, please do not hesitate to contact Prue Millear. Alternatively, you can
contact Queensland University of Technology‟s Research Ethics Officer on 3864
2340.
Thank you once again for your interest and your time in completing this survey.
Please direct any questions regarding the research to
Mrs Prue Millear
PhD Student,
School of Psychology and Counselling,
Faculty of Health, Q.U.T., Carseldine, 4034,
Email: [email protected]

443
Appendix B: Call for volunteers from the public hospital
Dear member of staff,
WELL-BEING AND WORK-BALANCE STUDY
Volunteers are required for email survey!!
PRIZES TO BE WON! Prue Millear is researching well-being and work-life balance of Australian working adults
for her PhD in the School of Psychology and Counselling at QUT. The aim of the study is to
explore the relationships between the individual, their work and personal responsibilities,
and their well-being and work-life balance. To fully understand the relationships involved,
this is a longitudinal study and you will be asked to complete the surveys at three time
points; now (November, 2006), in 3 months time (February, 2007), and 6 months after that
(August, 2007). Every person who completes all three surveys will be in a draw to win
one of 4 Accor Hotel Gift Vouchers, valued at $250 each. The gift vouchers can be
redeemed at one of Accor‟s Hotels, such as Novotel, Sofitel, Grand Mecure, All Seasons or
Ibis Hotels across Australia. The winners will be notified at the end of the project by email.
All responses are confidential at all times and data will be collated into group data before
being used in the analysis and reports. Individuals will not be identified at any stage.
If you choose to participate, it is requested that you participate in the study once only at
each time point. The survey should take approximately 25 to 30 minutes to complete. Please
note that once you leave the survey, your answers are considered finished and cannot be
edited. Completion and submission of the questionnaire will be taken as your consent to
participate in the „Well-being and the Work-Life Interface‟ Study.
Click on this link to go to the survey:
http://www.surveymonkey.com/s.asp?u=439312440696
Ethical considerations for this research
Please be assured that your answers will remain completely confidential and anonymous.
Data is collated for analysis and only group data is reported. Because the study is
longitudinal, email addresses of volunteers are retained ONLY for the length of the project,
BUT will be kept separate from any data collected, so there is NO link between answers and
any particular person. Participation is voluntary and you are free to withdraw from the study
at any time without comment or penalty.
There are some risks associated with this project with some questions that could be
considered sensitive. QUT provides limited free counselling for research participants of
QUT projects, who may experience some distress as a result of their participation in the
research. Should you wish to access this service, please contact the Clinic Receptionist of the
QUT Psychology Clinic on 07 3864 4578. Please indicate that you are a research participant.
Should you have any questions or comments regarding the ethical nature of this research,
please do not hesitate to contact Prue Millear. Alternatively, you can contact Queensland
University of Technology‟s Research Ethics Officer on 3864 2340 or the RBWH HREC on
3636 5490 or 3636 6132.
Thank you once again for your interest and your time in completing this survey.
Please direct any questions regarding the research to
Mrs Prue Millear
PhD Student,
School of Psychology and Counselling,
Faculty of Health, Q.U.T., Carseldine, 4034
Email: [email protected]

444
Appendix C. Time 2 Call to action
The email to both groups was identical, apart from the URL link to the survey.
Hi everyone!
Thank you for taking part and completing the first Well-being and Work-Life
Balance survey in September. We greatly appreciate your assistance and time. Your
participation in this survey will be of great value in developing our understanding of
work-life integration.
Could you please take the time to complete the survey for the second time? It should
only take about 25-30 minutes. In approximately 3-4 months we will ask you to
complete the survey for us for the final time. Each of the surveys is exactly the same
to allow comparisons of the questions across time.
Remember that by completing all three surveys, you will be in a draw to win one of 4
„Accor Hotels Gift Cards‟, valued at $250 each. The gift vouchers can be redeemed
at one of Accor‟s Hotels, such as Novotel, Sofitel, Grand Mecure, All Seasons or Ibis
Hotels across Australia. The winners will be notified at the end of the project by
email.
Please follow this link to go to the Time 2 survey
http://www.surveymonkey.com/s.asp?u=388242752463 (university alumni group)
OR
http://www.surveymonkey.com/s.asp?u=976363177082 (hospital group)
If you haven‟t completed the survey, you can exit the survey and return to it at a later
time, using the same computer.
Thanks again for your interest and involvement in this research!
Regards,
Prue Millear

445
Appendix D: Time 3 Call to action
The email to both groups was identical, apart from the URL link to the survey
Hi everyone,
Thank you for taking part and completing the first and second „Well-being and
Work-Life Balance‟ surveys. We greatly appreciate your time and input, as
preliminary analysis of the data looks really interesting! Your continued participation
in this survey will greatly add to developing our understanding of work-life
integration. All the information remains strictly confidential and no one can be
identified from any of the results. Your email addresses will not go to any other party
and will be deleted at the end of the research.
This will be the third and final survey that I will ask you to complete for the „Well-
being and Work-Life Balance‟ research project. It should only take about 25-30
minutes and each of the surveys is exactly the same to allow comparisons of the
questions across time.
Please follow this link to the survey:
http://www.surveymonkey.com/s.asp?u=995053602965 (university alumni group)
OR
http://www.surveymonkey.com/s.asp?u=148833602983 (hospital group)
Remember to give your email address at the completion of the survey, so that you
can be in a draw to win one of 4 „Accor Hotels Gift Cards‟, valued at $250 each. The
gift vouchers can be redeemed at one of Accor‟s Hotels, such as Novotel, Sofitel,
Grand Mecure, All Seasons or Ibis Hotels across Australia. The winners will be
notified at the end of the project by email. Enjoy!
If you haven‟t completed the survey, you can exit the survey and return to it at a later
time, using the same computer.
Thanks again,
Prue Millear

446
Appendix E: Second and third reminder calls to action
The second call to action took similar forms at each time
At Time 2:
Dear member of staff,
Thank you to everyone who has already completed the survey! Your help is
greatly appreciated. If you haven‟t had a chance yet, you can still be involved.
Follow this link to go to the survey: ….
At Time 3
Hi everyone,
This is another call to take part in the third and final survey for the „Well-being and
Work-Life Balance‟ research project. It should only take about 25-30 minutes and
each of the surveys is exactly the same to allow comparisons of the questions across
time.
Thanks to everyone who has already completed the survey for the third time!
If you haven‟t had a chance yet, please follow this link to go to the Time 3 of the
Well-being and Work-Life Balance survey:
The third and final call to action took similar forms each time
At Time 2
Hi everyone!
Thanks to everyone who has already completed the survey for the second time. Your
help is greatly appreciated and everyone‟s participation is important to understanding
the relationships between ourselves, our work and our well-being.
This is your final chance to do the Time 2 survey! Please follow this link
At Time 3
Hi everyone,
Nearly everyone has completed the third survey and many thanks to those of you
who have! If you haven‟t already done so, please take this final opportunity to follow
this link to the Time 3 of the Well-being and Work-Life Balance survey:

447
Appendix F: Measures used in Study 1 and 2
* Indicates that an item was reverse scored
F.1Measures of P, the Person: Measures of the generative disposition
Dispositional optimism: Life Orientation Test –Revised (LOT-R); Scheier, Carver
& Bridges (1994)
Please indicate how much you agree or disagree with each statement (1, strongly
disagree to 5, strongly agree)
1. In uncertain times, I usually expect the best.
2. If something can go wrong for me, it will *
3. I‟m always optimistic about my future
4. I hardly ever expect things to go my way *
5. I rarely count on good things happening to me *
6. Overall, I expect more good things to happen to me than bad.
Coping Self-Efficacy; Chesney, Chambers, Taylor, Johnson, & Folkman (2003)
When things aren't going well for you, or when you're having problems, how
confident or certain are you that you can do the following (1, I cannot do this at all,
4, I am moderately certain I can do this, to 7, I am certain I can do this)
1. Keep from getting down in the dumps
2. Talk positively to yourself
3. Sort out what can be changed, and what can not be changed
4. Get emotional support from friends and family
5. Find solutions to your most difficult problems
6. Break an upsetting problem down into smaller parts
7. Leave options open when things get stressful
8. Make a plan of action and follow it when confronted with a problem
9. Develop new hobbies or recreations
10 Take your mind off unpleasant thoughts
11. Look for something good in a negative situation
12. Keep from feeling sad
13. See things from the other person's point of view during a heated argument
14. Try other solutions to your problems if your first solutions don‟t work
15. Stop yourself from being upset by unpleasant thoughts
16. Make new friends
17. Get friends to help you with the things you need
18. Do something positive for yourself when you are feeling discouraged
19. Make unpleasant thoughts go away
20. Think about one part of the problem at a time
21. Visualize a pleasant activity or place
22. Keep yourself from feeling lonely
23. Pray or meditate
24. Get emotional support from community organizations or resources
25. Stand your ground and fight for what you want
26. Resist the impulse to act hastily when under pressure
Time Management Scale, Perceived Control of Time subscale, Macan (1994)
Please indicate how much you agree or disagree with each statement (1, strongly
disagree to 5, strongly agree)
1 I feel in control of my time
2 I find it difficult to keep to a schedule because others take me away from my work*
3 I underestimate the time it would take to accomplish tasks *

448
4 I must spend a lot of time on unimportant tasks *
5 I find myself procrastinating on tasks that I don‟t like but have to be done *
Life Role Salience Scales, Amatea et al. (1986), the Reward and Commitment
subscales for Occupational, Parental, and Marital Roles
Please indicate how much you agree or disagree with each statement (1, strongly
disagree to 5, strongly agree)
Occupational Role Reward Value
1 Having work / a career that is interesting and exciting to me is my most important
life goal
2 I expect my job/career to give me more real satisfaction than anything else I do
3 Building a name and reputation for myself through work/career is not one of my
life goals *
4 it is important to me to have a job/career in which I can achieve something of
importance
5 It is important to me to feel successful in my work/career
Occupational Role Commitment
1 I want to work, but I do not want a demanding career *
2 I expect to make as many sacrifices as are necessary in order to advance in my
work/career
3 I value being involved in a career and expect to devote time and effort needed to
develop it
4 I expect to devote significant amount of time to building my career and developing
the skills necessary to advance my career
5 I expect to devote whatever time and energy it takes to move up in my job/career
field
Instructions: The next questions ask about parenting and marriages. Please answer
the questions as they apply to you. If you don’t have children or are not married or
in a relationship at the moment, please tick N/A. Note, children were defined as the
parent‟s „natural, adopted, step, or foster son/s or daughter/s‟.
Parental Role Reward Value
1 Although parenthood requires many sacrifices, the love and enjoyment of children
of one‟s own are worth it all
2 If I chose not to have children, I would regret it
3 It is important to me to feel that I am or will be an effective parent
4 The while idea of having children and raising them is not attractive to me *
5 My life would be empty if I never had children
Parental Role Commitment
1 It is important to me to have some time for myself and my own development,
rather than have children and be responsible for their care *
2 I expect to devote a significant amount of my time and energy to the rearing of
children of my own
3 I expect to be very involved in the day-to-day details of rearing children of my own
4 Becoming involved in the day-to-day details of rearing children involve costs in
other areas of my life which I am unwilling to make *
5 I do not expect to be very involved in childrearing *
Marital Role Reward Value
1 My life would be empty if I never married
2 Having a successful marriage is the most important thing in life to me
3 I expect marriage to give me more real personal satisfaction than anything else in
my life

449
4 Being married to a person I love is more important then anything else
5 I expect the major satisfactions in my life to come from my marriage relationship
Marital Role Commitment
1 I expect to commit whatever time is necessary to make my marriage partner feel
loved, supported and cared for
2 Devoting a significant amount of my time to being with and doing things with a
marriage partner in not something that I expect to do *
3 I expect to put a lot if time into building and maintaining a martial relationship
4 Really involving myself in a marriage relationship involves costs in other areas of
my life that I am unwilling to accept *
5 I expect to work hard to build a good marriage relationship even if it means
limiting my opportunities to pursue other personal goals
Egalitarian Gender Role Attitudes, (Moen 2003)
Please indicate how much you agree or disagree with each statement (1, strongly
disagree to 5, strongly agree)
1 It is usually better for everyone if the man is the main provider and the woman
takes care of the family *
2 It is more important for a wife to help her husband‟s career than have one herself *
3 A preschool child is likely to suffer if his or her mother works *
4 A working mother can have just as good relationship with her children as mother
who does not work
F.2Measures of P, the person: Measures of demand characteristics
Social Skill Scale; Ferris, Witt, & Hochwarter (2001)
Please indicate how much you agree or disagree with each statement (1, strongly
disagree to 5, strongly agree)
1 I find it easy to put myself in the position of others
2 I am keenly aware of how I am perceived by others
3 In social situations, it is always clear to me exactly what to say and do
4 I am particularly good at sensing the motivations and hidden agendas of others
5 I am good at making myself visible with influential people in my organization
6 I am good at reading other people‟s body language
7 I am able to adjust my behaviour and become the type of person dictated by the
situation
Coping Humor Scale; Martin & Lefcourt (1983)
Please indicate how much you agree or disagree with each statement (1, strongly
disagree to 5, strongly agree)
1 I often lose my sense of humour when I am having problems *
2 I have found that my problems have been greatly reduced when I try to find
something funny in them
3 I usually look for something comical to say when I am in tense situations
4 I must admit my life would probably be a lot easier if I had more of a sense of
humour
5 I have often felt that if I am in a situation where I have to either laugh or cry, it‟s
better to laugh
6 I can usually find something to laugh or joke about even in trying situations
7 It has been my experience that humour is often an effective way of coping with
problems
F.3 Measure of C, the Context: Measures of workplace conditions
Job Autonomy; Voydanoff (2004)
Please indicate how much you agree or disagree with each statement (1, strongly

450
disagree to 5, strongly agree)
1 How often do you have a choice in deciding how you do your tasks at work?
2 How often do you have a choice in deciding what tasks you do at work?
3 How often do you have a say in decisions about your work?
4 How often do you have a say in planning your work environment – i.e. how your
workplace is arranged or how things are organized?
Skill Discretion; Schwarz, Pieper & Karasek, (1988)
Please indicate how much you agree or disagree with each statement (1, strongly
disagree to 5, strongly agree)
1 In your job, do you keep learning new things?
2 Does your work require a high level of skill?
3 Does your work require creativity?
4 Is your work repetitious? *
5 Can you develop new skills with your work?
6 Does your job have variety?
Job Social Support; Van Ypern & Hagedoorn (2003)
Please indicate how much you agree or disagree with each statement (1, strongly
disagree to 5, strongly agree)
1 Can you rely upon your immediate supervisor when things get tough at work?
2 If necessary, can you ask your immediate supervisor for help?
3 Can you rely on your co-workers when things get tough at work?
4 If necessary, can you ask your co-workers for help?
Work-Family Culture Scale, Managerial support subscale; Thompson, Beauvais,
& Lyness (1999)
Please indicate how much you agree or disagree with each statement (1, strongly
disagree to 5, strongly agree)
Please indicate how much you agree or disagree with each statement
1. In this organization, employees can easily balance their work and family lives
2. In the event of a conflict, managers understand when employees have to put their
families first
3. In this organization, it is generally ok to talk about one‟s family at work
4. Higher management in this organization encourages supervisors to be sensitive to
employees‟ family and personal needs
5. In general, managers in this organization are quite accommodating of family-
related needs
6. In this organization, it is very hard to leave during the workday to take care of
personal or family matters *
7. This organization encourages employees to set limits on where work stops and
home life begins
8. Middle managers and executives in this organization are sympathetic toward
employees‟ child care responsibilities
9. This organization is supportive of employees who want to switch to less
demanding jobs for family reasons
10. Middle managers and executives in this organization are sympathetic toward
employees with eldercare responsibilities
11. In this organization, employees are encouraged to strike a balance between their
work and family lives
Affective Commitment Scale; Allen & Meyer (1990)
Please indicate how much you agree or disagree with each statement (1, strongly
disagree to 5, strongly agree)

451
1 I would be very happy to spend the rest of my career with this organization
2 I enjoy discussing my organization with people outside it
3 I really feel as if this organization‟s problems are my own
4 I think that I could easily become attached to another organization as I am to this
one *
5 I do not feel like „part of the family‟ at this organization *
6 I do not feel „emotionally attached‟ to this organization *
F.4 Measures of C, the context: Measures of the work-life interface
Work-family Spillover; Grzywacz & Marks (2000)
Please indicate how much you agree or disagree with each statement (1, strongly
disagree to 5, strongly agree)
1 Your job reduces the effort you can give to activities at home
2 Stress at work makes you irritable at home
3 Your job makes you feel too tired to do the things that need attention at home
4 Job worries or problems distract you when you are at home
5 The things you do at work help you deal with personal and practical issues at home
6 The things you do at work make you a more interesting person at home
7 The skills you use on your job are useful for the things you have to do at home
8 Having a good day on your job makes you a better companion when you get home
9 Responsibilities at home reduce the effort you can devote to your job
10 Personal or family worries and problems distract you when you are at work
11 Activities and chores at home prevent you from getting the amount of sleep you
need to do your job well
12 Stress at home makes you irritable at work
13 Talking with someone at home helps you deal with problems at work
14 The love and respect you get at home makes you confident about yourself at work
15 Your home life helps you relax and feel ready for the day‟s work
16 Providing for what is needed at home makes you work harder at your job
Negative Work-Family Spillover: items 1, 2, 3, 4; Positive Work-Family Spillover:
items 5, 6, 7, 8; Negative Family-Work Spillover: items 9, 10, 11, 12; Positive
Family-Work Spillover: items 13, 14, 15, 16
F.5 Measures of D, the developmental outcomes
F.5.1 Well-Being
Satisfaction with Life Scale, Diener (SWLS), Emmons, Larsen & Griffin (1986)
Please indicate how much you agree or disagree with each statement (1, strongly
disagree to 5, strongly agree)
1. In most ways, my life is close to ideal
2. The conditions of my life are excellent.
3. I am satisfied with my life
4. So far I have got the important things I want in life
5. If I could live my life again, I would change almost nothing
Ryff’s Psychological Well-Being Scale, Ryff (1989) Please indicate how much you agree or disagree with each statement (1, strongly
disagree to 5, strongly agree)
1. I have confidence in my opinions, even if they are different form the way that
most people think
2. I tend to be influenced by people with strong opinions *
3 I judge myself by what I think is important, not by the values of what others think
is important.

452
4. I am good at managing the responsibilities of my daily life
5. The demands of everyday life often get me down *
6. In general, I am in charge of the situation in which I live
7. People would describe me as a giving person, willing to share my time with others
8. Maintaining close relationships has been difficult and frustrating for me *
9. I have not experienced many warm and trusting relationships with others. *
10. When I look at the story of my life, I am pleased with how things have turned out
so far
11. In many ways, I feel disappointed about my achievements in life *
12. I like most parts of my personality.
13. Some people wander aimlessly through life, but I am not one of them
14. I live life one day at a time and don‟t really think about the future *
15. I sometimes feel as if I‟ve done all there is to do in life *
16. For me, life has been a continual process of learning, changing, and growth
17. I think it is important to have new experiences that challenge how you think
about yourself and the world.
18. I gave up making personal improvements or changes in my life a long time ago *
F.5.2 Mental Illness
Depression, Anxiety, & Stress Scale (DASS-21); Lovibond, & Lovibond (1995)
Please read each statement and circle a number 0, 1, 2 or 3 which indicates how
much the statement applied to you over the past week. There are no right or wrong
answers. Do not spend too much time on any statement (0, Didn‟t apply to me at all;
2, Applied to me to some degree, or some of the time; 4, Applied to me to a
considerable degree, or a good part of time; 6, Applied to me very much, or most of
the time)
1 I found it hard to wind down
2 I was aware of dryness of my mouth
3 I couldn't seem to experience any positive feeling at all
4 I experienced breathing difficulty (eg, excessively rapid breathing, breathlessness
in the absence of physical exertion)
5 I found it difficult to work up the initiative to do things
6 I tended to over-react to situations
7 I experienced trembling (eg, in the hands)
8 I felt that I was using a lot of nervous energy
9 I was worried about situations in which I might panic and make a fool of myself
10 I felt that I had nothing to look forward to
11 I found myself getting agitated
12 I found it difficult to relax
13 I felt down-hearted and blue
14 I was intolerant of anything that kept me from getting on with what I was doing
15 I felt I was close to panic
16 I was unable to become enthusiastic about anything
17 I felt I wasn't worth much as a person
18 I felt that I was rather touchy
19 I was aware of the action of my heart in the absence of physical exertion (eg,
sense of heart rate increase, heart missing a beat)
20 I felt scared without any good reason
21 I felt that life was meaningless
(Depression: items 3, 5, 10, 13, 16, 17, 21; Anxiety: items 2, 4, 7, 9, 15, 19, 20;
Stress: items 1, 6, 8, 11, 12, 14, 18)

453
F.5.3 Burnout
Burnout, Maslach Burnout Inventory – General; Maslach, Jackson, & Leiter (1996)
Please indicate how much you agree or disagree with each statement (1, strongly
disagree to 5, strongly agree)
1 I feel emotionally drained from my work
2 I feel used up at the end of the workday
3 I feel tired when I get up in the morning and have to face another day on the job
4 Working all day is really a strain for me
5 I can effectively solve the problems that arise in my work
6 I feel burnt out by my work
7 I feel I am making an effective contribution to what this organization does
8 I have become less interested in my work since I started this job
9 I have become less enthusiastic about my work
10 In my opinion, I am good at my job
11 I feel exhilarated when I accomplish something at work
12 I have accomplished many worthwhile things in this job
13 I just want to do my job and not be bothered
14 I have become more and more cynical about whether my work contributes to
anything
15 I doubt the significance of my work
16 At my work, I feel confident that I am effective at getting things done
(Exhaustion: items 1, 2, 3, 4, 6; Cynicism: items 8, 9, 13, 14, 15; Professional
Efficacy: items 5, 7, 10, 11, 16)
F.5.4 Work engagement
Utrecht Work Engagement Scale; Schaufeli, Salanova, Gonzalez-Roma, & Bakker,
(2002)
Please indicate how much you agree or disagree with each statement (1, strongly
disagree to 5, strongly agree)
1 When I get up in the morning, I feel like going to work
2 At my work, I feel bursting with energy
3 At my work I always persevere, even when things do not go well
4 I can continue working for long periods at a time
5 At my job, I am very resilient, mentally
6 at my job, I feel strong and vigorous
7 To me, my job is challenging
8 My job inspires me
9 I am enthusiastic about my job
10 I am proud of the work that I do
11 I fond the work that I do full of meaning and hope
12 When I am working, I forget everything else around me
13 Time flies when I am working
14 I get carried away when I am working
15 It is difficult to detach myself from my job
16 I feel happy when I am working intensely
(Vigour: items 1, 2, 3, 4, 5, 6; Dedication: items 7, 8, 9, 10, 11; Absorption: items 12,
13, 14, 15, 16)

454
Appendix G: Simple slopes of the moderated regression analyses
Figure G.1. Simple slopes for the moderating influence of negative work-to-family spillover
(on left) and negative family-to-work spillover (on right) on the relationship between
dispositional optimism and depression. „Low‟ is -1SD and „High‟ is +1 SD from the mean.
Figure G.2. Simple slopes for the moderating influence of negative work-to-family spillover
on the relationship between coping self-efficacy and depression (on the left) and anxiety (on
the right). „Low‟ is -1SD and „High‟ is +1 SD from the mean.

455
Figure G.3. Simple slopes for the moderating influence of negative family-to-work spillover
on the relationship between dispositional optimism and anxiety. „Low‟ is -1SD and „High‟ is
+1 SD from the mean.
Figure G.4. Simple slopes for the moderating influence of negative family-to-work spillover
on the relationship between job autonomy and emotional exhaustion (on the left) and job
autonomy and cynicism (on the right). „Low‟ is -1SD and „High‟ is +1 SD from the mean.

456
Figure G.5. Simple slopes for the moderating influence of negative work-to-family spillover
on the relationship between affective commitment and professional efficacy. „Low‟ is -1SD
and „High‟ is +1 SD from the mean.
Figure G.6. Simple slopes for the moderating influence of negative work-to-family spillover
on the relationships between skill discretion and work absorption (on the right). „Low‟ is -
1SD and „High‟ is +1 SD from the mean
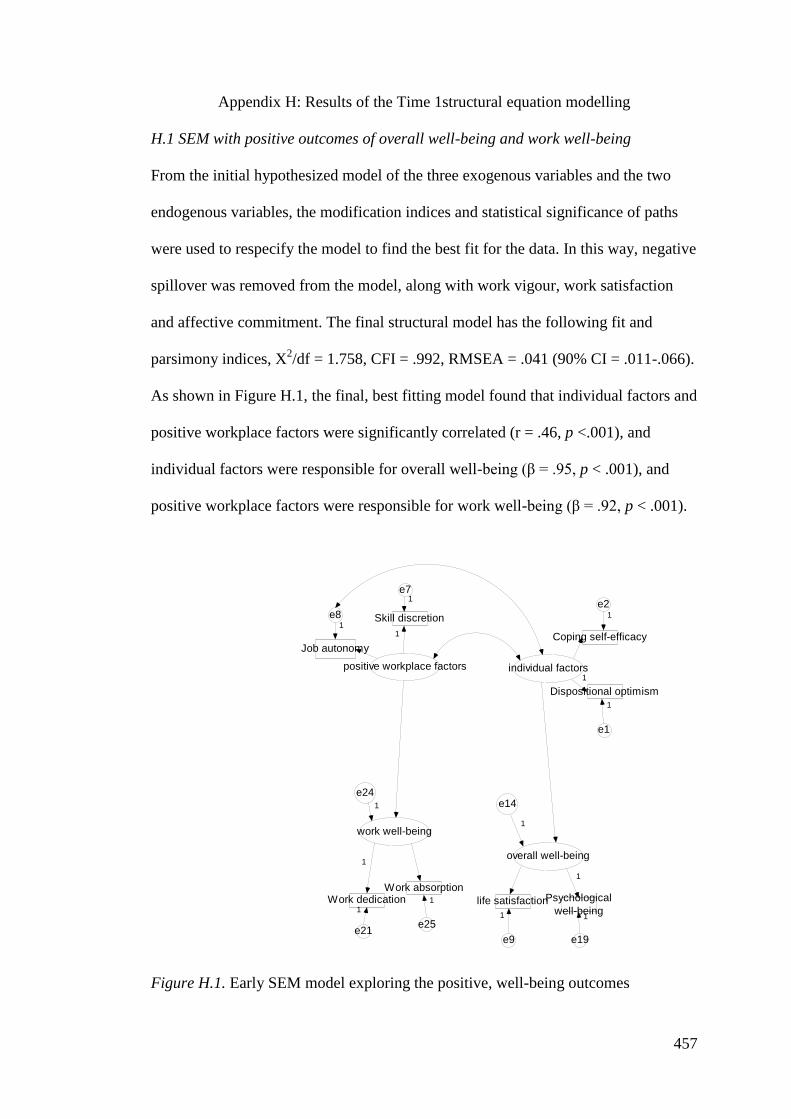
457
positive workplace factors individual factors
overall well-being
Dispositional optimism
e1
1
Coping self-efficacy
e2
Skill discretion
e7
life satisfaction
e9
e14
Psychological
well-being
e19
work well-being
Work dedication
e21
1
e24
Work absorption
e25
1
1 1
1
1
1
Job autonomy
e81
1
1
1
1
1
Appendix H: Results of the Time 1structural equation modelling
H.1 SEM with positive outcomes of overall well-being and work well-being
From the initial hypothesized model of the three exogenous variables and the two
endogenous variables, the modification indices and statistical significance of paths
were used to respecify the model to find the best fit for the data. In this way, negative
spillover was removed from the model, along with work vigour, work satisfaction
and affective commitment. The final structural model has the following fit and
parsimony indices, X2/df = 1.758, CFI = .992, RMSEA = .041 (90% CI = .011-.066).
As shown in Figure H.1, the final, best fitting model found that individual factors and
positive workplace factors were significantly correlated (r = .46, p <.001), and
individual factors were responsible for overall well-being (β = .95, p < .001), and
positive workplace factors were responsible for work well-being (β = .92, p < .001).
Figure H.1. Early SEM model exploring the positive, well-being outcomes

458
From the squared multiple correlations of the endogenous variables, 90.3% of the
variance of Overall Well-Being and 84.4% of the variance of Work Well-Being were
explained by the final model. The beta weights for the Time 1 positive outcomes
model are shown in Table H.1. The squared multiple correlations for the indicator
variables, as the square of the standardized regression weights (β) between each
latent and its indicator variables, represent the reliability of the indicator variables in
the model. Acceptable squared multiple correlations > .30 and equate to β > .548
(Holmes-Smith et al., 2006). In the model of positive outcomes, as all the beta
weights were significant and were greater than .61, except for job autonomy, β =
.51, the squared multiple correlations show that the indicators are suitable
representations of the latent variables. The correlation between the measurement
Table H.1
Standardized regression weights (β) and squared multiple correlations (SMC) in the
positive outcomes model
From latent factors to observed indicator variables
Latent Factor Observed indicator variable β SMC
Individual Factors dispositional optimism .691*** .447
Individual Factors coping self-efficacy .746*** .557
Positive Workplace Factors skill discretion .816*** .661
Positive Workplace Factors job autonomy .506*** .256
Overall Well-Being life satisfaction .748*** .559
Overall Well-Being psychological well-being .869*** .755
Work Well-Being work dedication .977*** .954
Work Well-Being work absorption .616*** .379
Standardized regression weights (β) between the latent variables
From To β
Individual Factors Overall Well-Being .950***
Positive Workplace Factors Work Well-Being .919***
* p < .05, ** p <.01, *** p < .001

459
error for Job Autonomy and Individual Factors shows that there is a relationship
between job autonomy and Individual Factors (r = .18, p < .001) that is over and
above the relationships that are explained through the latent variable, Positive
Workplace Factors. Whilst this relationship is not as strong as the direct paths
between the latent factors, the path suggests that having autonomy or control about
the tasks of one‟s job may add to one‟s general perceptions of personal effectiveness.
H.2 Early SEM of the negative outcomes of mental illness and burnout
To complement the positive outcomes of the first model, the second, early
SEM explored that negative outcomes of mental illness and burnout, although two
models were required to reasonably explain the negative outcomes. In a similar
manner to the positive outcomes model, the model of negative outcomes were
hypothesized to start with the same three exogenous latent variables (Individual
Factors, Positive Workplace Factors, and Negative Spillover) and with the two
endogenous latent variables, Mental Illness, as the indicator variables of depression,
anxiety and stress, and Burnout, as the indicator variables, exhaustion, cynicism, and
professional efficacy. The exogenous variables were drawn as correlated and with
each having a causal effect on the two endogenous variables, which were also
considered to be correlated to each other. Using the Modification Indices and the
statistical significance of the pathways, the model was respecified to increase the fit
of the model. The result of the first part of the SEM of negative outcomes, that did
not include stress and exhaustion, is shown in Figure H.2 which has acceptable fit,
X2/df = 2.309, CFI = .970, RMSEA = .053 (90% CI = .038 - .069).
Individual Factors had a significant influence on Mental Illness (β = -.48, p <
.001), Negative Spillover had a positive influence on both Mental Illness (β = .48, p
< .001) and Burnout (β = .32, p < .001), while Positive Workplace Factors had a

460
positive workplace factors
Skill discretion
e1
1
1 Job autonomy
e21
Affective commitment
e31
individual factors
Dispositional
Optimisme41
1
Coping
self-efficacye5
1
mental illness Anxiety e71 1
Depression e81
burnout
Professional
efficacy
e9
1
Cynicism
e10
1
negative spillover
Negative
Work-family
spillover
e12
1
1
Negative
Family-work
spillover
e131
e14
1
e15
1
1
Figure H.2. Early SEM for the negative outcomes of Mental Illness and Burnout,
Part A
Table H.2
Correlations in Part A of the negative outcomes Time 1 SEM
r p
Individual Factors ↔ Positive Workplace Factors .417 < .001
Individual Factors ↔ Negative Spillover -.496 < .001
Negative Spillover ↔ Positive Workplace Factors -.353 < .001
Negative Spillover ↔ professional efficacy .276 < .001
Depression ↔ cynicism .290 .002
Job autonomy ↔ coping self-efficacy .151 .016
Negative work-to-family spillover ↔ skill discretion .235 < .001
* p < .05, ** p <.01, *** p < .001

461
larger negative influence on Burnout (β = -.82, p < .001). There is a positive
correlation between Individual Factors and Positive Workplace Factors (r = .42, p <
.001) and negative correlations between Negative Spillover and Individual Factors (r
= -.50, p < .001) and Positive Workplace Factors (r = -.35, p < .001). In addition to
the pathways through the latent factors, job autonomy and coping self-efficacy are
positively correlated (r = .15, p = .016), as are cynicism and depression (r = .29, p
<.001). Interestingly, skill discretion and negative work-family spillover are also
positively correlated (r = .23, p < .001) and professional efficacy is positively
correlated with Negative Spillover (r = .28, p < .001). From the squared multiple
correlations of the endogenous variables, 95.6% of the variance of Burnout and
68.3% of the variance of Mental Illness are explained by the model. As noted in the
positive outcome model, the squared multiple correlations, as the square of the
standardized regression weights, also represent the reliability of the indicator
variables for the appropriate latent variables, and values greater than .30 are
acceptable (Holmes-Smith et al., 2006). All the beta weights for the first part of the
model of the negative outcomes, as shown in the Table H.3 are greater than .60 and
highly significant (p < .001), the squared multiple correlations for all indicator
variables are greater than .35 and therefore acceptable. The squared multiple
correlations were also substantial, with 95.6% of the variance of Burnout and 68.3%
of the variance of Mental Illness being explained by the model.
Considering the importance of stress and exhaustion in the work-life
literature, these outcomes were considered in a second model of negative outcomes.
Using the same initial conditions of three exogenous variables and constructing a
latent variable with stress and exhaustion as indicator variables, the same model
respecification process lead to a final fitted model, with stress and exhaustion

462
Table H.3
Standardized regression weights (β) and squared multiple correlations (SMC) for
indicator variables in Part A of the negative outcomes model
From latent factors to observed indicator variables
Latent Factor Observed indicator variable β SMC
Individual Factors dispositional optimism .694*** .481
Individual Factors coping self-efficacy .744*** .599
Positive Workplace Factors skill discretion .601*** .361
Positive Workplace Factors job autonomy .595*** .345
Positive Workplace Factors affective commitment .610*** .372
Negative Spillover negative work-to-family .694*** .481
Negative Spillover negative family-to-work .613*** .376
Burnout‡ cynicism -.834*** .696
Burnout‡ professional efficacy .639*** .408
†
Mental Illness depression .865*** .748
Mental Illness anxiety .642*** .412
Standardized regression weights (β) for latent variables
From To β
Individual Factors Mental Illness -.476***
Positive Workplace Factors Burnout‡ .816***
Negative Spillover Burnout‡ -.323***
Negative Spillover Mental Illness .479***
* p < .05, ** p <.01, *** p < .001
Note: †Calculated as .315 in AMOS;
‡ As an exception to other variables, low scores indicate high
levels of Burnout, high scores indicate absence of Burnout, such that increasing Negative Spillover
leads to decreasing scores for Burnout scale but greater symptoms of Burnout

463
Stress
e4
1Exhaustion
e5
1
individual factors
Coping self-efficacy
e6
negative spillover
Negative
work-family
spillover
e9
Dispositional
optimsm
e10
11
Negative
family-work
spillover
e11
1
1
1
1
as separate outcomes, as shown in Figure H.3 as „Negative outcomes, Part B‟. This
second model had acceptable fit indices, X2/df = 1.616, CFI = .997, RMSEA = .037
(90% CI = .000 - .089).
Negative Spillover lead to both exhaustion (β = .784, p < .001) and stress (β =
.552, p < .001) whilst Individual Factors reduced stress (β = -.224, p < .001) alone.
Again, Negative Spillover and Individual Factors were negatively correlated (r = -
.360, p < .001) as in the Part A model. In addition to the pathways through the latent
factors, dispositional optimism and exhaustion are negatively correlated (r = -.210, p
< .001) and negative work-to-family spillover is negatively correlated with
Individual Factors (r = -.148, p =.005), and positively correlated with stress (r = .107,
p = .043). From the squared multiple correlations, 44.4% of the variance of stress and
61.5% of the variance of exhaustion is explained by the model. As shown in the
Appendix, the standardized regression weights, and therefore the squared multiple
correlations, for the indicator variables of Negative Spillover and Individual Factors
Figure H.3. Early SEM for the negative outcomes for Mental Illness and Burnout,
Part B
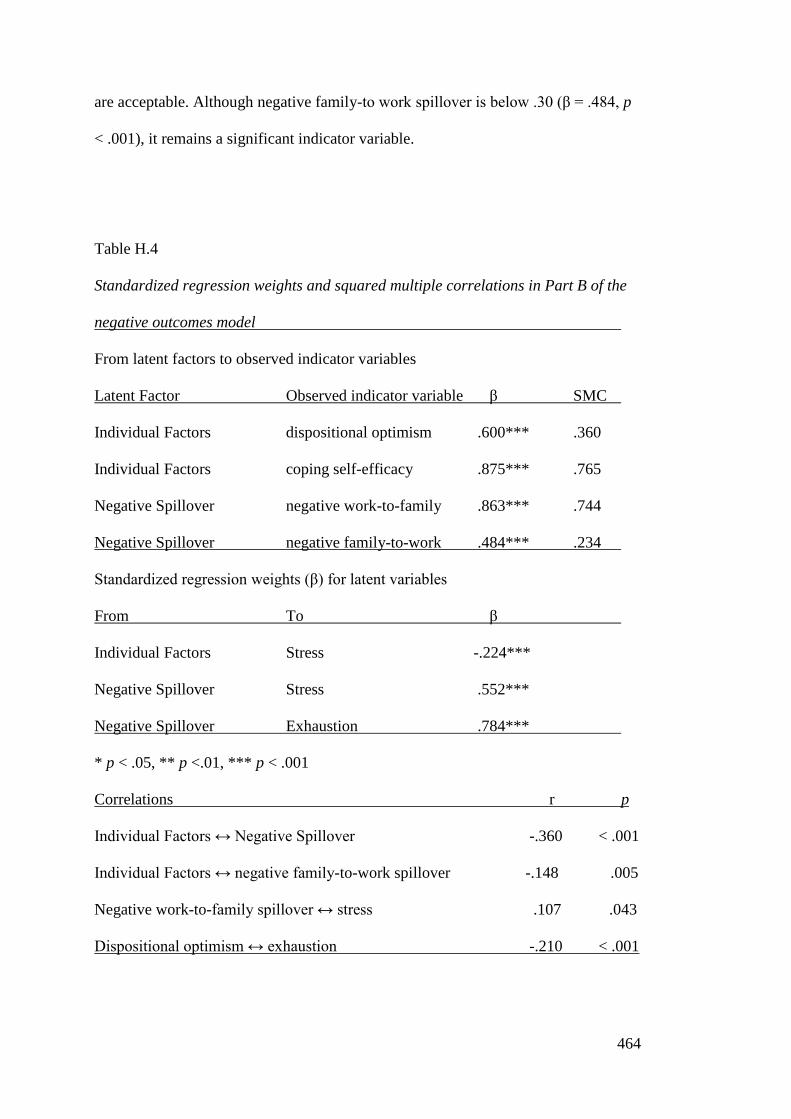
464
are acceptable. Although negative family-to work spillover is below .30 (β = .484, p
< .001), it remains a significant indicator variable.
Table H.4
Standardized regression weights and squared multiple correlations in Part B of the
negative outcomes model
From latent factors to observed indicator variables
Latent Factor Observed indicator variable β SMC
Individual Factors dispositional optimism .600*** .360
Individual Factors coping self-efficacy .875*** .765
Negative Spillover negative work-to-family .863*** .744
Negative Spillover negative family-to-work .484*** .234
Standardized regression weights (β) for latent variables
From To β
Individual Factors Stress -.224***
Negative Spillover Stress .552***
Negative Spillover Exhaustion .784***
* p < .05, ** p <.01, *** p < .001
Correlations r p
Individual Factors ↔ Negative Spillover -.360 < .001
Individual Factors ↔ negative family-to-work spillover -.148 .005
Negative work-to-family spillover ↔ stress .107 .043
Dispositional optimism ↔ exhaustion -.210 < .001

465
H.3 Time 1 SEM combining the positive and negative outcomes
With the early structural models establishing that the well-being and mental
health outcomes could be modelled in this data, the next step was to combine the
three models to find if these would form a tenable overall model that included all
outcomes. As the integration of the positive and negative outcomes came at the end
of the modeling process, it was able to take into account the exploration of work
engagement and burnout together, which is reported and discussed in detail in the
next section on CFAs. Interestingly, although Burnout, in particular, and Work
Engagement have been widely used separately in research, the results of the CFA,
Burnout and Work Engagement are better represented as one factor, which will be
called Work Engagement in this thesis. From the CFA, the new single-factor has
only four indicator variables of work dedication, work absorption, professional
efficacy, and cynicism. As with the separate models of positive and negative
outcomes, this integrated model has the three exogenous latent variables of
Individual Factors (as dispositional optimism and coping self-efficacy), Positive
Workplace Factors (as skill discretion, job autonomy, and affective commitment),
and Negative Spillover (as negative work-to-family spillover and negative family-to-
work spillover) which are correlated with other and with each having a causal
influence on the three endogenous latent variables of Mental Illness (as depression,
anxiety and stress), Work Engagement (as work dedication, work absorption,
professional efficacy and cynicism) and Overall Well-Being (as life satisfaction and
psychological well-being). The Modification Indices and statistical significance of
the pathways indicated that cynicism should be removed from the model. The final
model in shown in Figure H.4, and had acceptable fit, X2/df = 2.473, CFI = .965,
RMSEA = .057 (90% CI = .046 -.068). From the model it can be seen that Individual

466
positive workplace
factors
job autonomy
e21
skill discretion
e3
1
1
individual
factors
dispositional optimism
e4
1
1
coping self-efficacy
e51
negative
spillover
Neg Work-Family spillover
e61
Neg Family-Work spillover
e7
overall
well-being
life satisfaction
e8
1
1
psychological well-being
e9
work engagement
work dedication
e11
work absorption
e12
professional efficacy
anxiety depression
stress
e15
e17
e18
e19e20
e211
mental illness
1
e22
1
1
1
1
1
1
1
1
1
1 1
1
Factors lead to greater Overall Well-Being (β = .939, p < .001) and mitigated Mental
Illness (β = -.440, p = .001), Positive Workplace Factors lead to greater Work
Engagement (β = .617, p < .001), yet also added to Mental Illness (β = .176, p=
.017), and Negative Spillover lead to Mental Illness (β = .564, p < .001) and reduced
Work Engagement (β = -.172, p = .001). From the squared multiple correlations,
88.1% of the variance of Overall Well-being, 50.1% of Work Engagement and
65.6% of Mental Illness is explained by the model. As with the models with the
positive and negative outcomes separately, Individual Factors and Positive
Workplace Factors are positively correlated (r = . 547, p < .001) and Negative
Spillover is negatively correlated to both Individual Factors (r = -.555, p < .001) and
Positive Workplace Factors (r = -.416, p < .001). In
Figure H.4. Combination of early SEMs to integrate positive and negative outcomes

467
addition to these relationships, negative work-to-family spillover is directly and
positively correlated with stress (r = .374, p < .001), stress and anxiety are directly
correlated (r = .339, p < .001), skill discretion and Work Engagement are positively
correlated (r = .547, p < .001), as are professional efficacy and Individual Factors
Table H.5
Standardized regression weights (β) and squared multiple correlations (SMC) in the
combined outcomes model
From latent factors to observed indicator variables
Latent Factor Observed indicator variable β SMC
Individual Factors dispositional optimism .687*** .471
Individual Factors coping self-efficacy .759*** .576
Positive Workplace Factors skill discretion .660*** .435
Positive Workplace Factors job autonomy .595*** .345
Negative Spillover negative work-to-family .610*** .372
Negative Spillover negative family-to-work .613*** .376
Overall Well-Being life satisfaction .746*** .557
Overall Well-Being psychological well-being .867*** .752
Work engagement work dedication .985*** .969
Work engagement work absorption .611*** .373
Work engagement professional efficacy .525*** .275
Mental Illness depression .909*** .826
Mental Illness anxiety .616*** .380
Mental Illness stress .731*** .535 * p < .05, ** p <.01, *** p < .001

468
(r = .189, p < .001). The standardized regression weights for all the indicator
variables are highly significant (p < .001) and greater than .60, with only professional
efficacy being less, at β = .53, which indicates that the squared multiple correlations
for the indicator variables form a reliable basis for the model (Holmes-Smith et al.,
2006).
Table H.6
Standardized regression weights (β) for latent variables
From To β p
Individual Factors Overall Well-Being .939 <.001
Individual Factors Mental Illness -.443 < .001
Positive Workplace Factors Work engagement .623 < .001
Positive Workplace Factors Mental Illness .180 .017
Negative Spillover Work engagement -.166 .001
Negative Spillover Mental Illness .566 < .001
* p < .05, ** p <.01, *** p < .001
Correlations for the positive and negative models r p
Individual Factors ↔ Positive Workplace Factors .547 < .001
Individual Factors ↔ Negative Spillover -.555 < .001
Positive Workplace Factors ↔ Negative Spillover -.416 < .001
Individual Factors ↔ professional efficacy .189 < .001
Work engagement ↔ skill discretion .547 < .001
Stress ↔ negative work-to-family spillover .374 < .001
Stress ↔ anxiety .339 < .001

469
individual
factors
Dispositional optimsm e111
Coping self-efficacy e21
positive
workplace factors
Skill discretion e311
Job autonomy e41
work
well-being
Work dedication e611
Work absorption e71
overall
well-being
Psychological well-being e81 1
Life satisfaction e91
Appendix I: Confirmatory Factor Analyses for the longitudinal models
I.1 CFA for the Well-Being model
Figure I.1. CFA for Well-Being model
Table I.1
Standardized regression weights (β) and squared multiple correlations (SMC) for the
Well-Being model CFA
Latent variable Observed variable β SMC
Individual Factors (IF) dispositional optimism .692*** .479
Individual Factors (IF) coping self-efficacy .746*** .557
Positive workplace factors (PWF) skill discretion .817*** .667
Positive workplace factors (PWF) job autonomy .557*** .311
Work Well-Being (WWB) work dedication .970*** .941
Work Well-Being (WWB) work absorption .627*** .393
Overall Well-Being (OWB) life satisfaction .866*** .544
Overall Well-Being (OWB) psychological well-being .737*** .750
* p < .05, ** p < .01, *** p < .001

470
Table I.2
Correlations between latent factors and between observed variables in the Well-
Being CFA Latent factors IFwb PWFwb WWBwb OWBwb
IFwb 1 .476*** .465*** .929***
PWFwb 1 .917*** .526***
WWBwb 1 .461***
OWBwb 1
Correlations between observed variables r p
Job autonomy ↔ Life satisfaction .177 .039
* p < .05, ** p < .01, *** p < .001

471
individual factorsDispositional optimism e11
1
Coping self-efficacy e21
positive
workplace factors
Skill discretion e311
Job autonomy e41
Affective commitment e51
negative
spillover
Neg work-family spillover e611
Neg family-work spillover e71
burnout
Exhaustion e811
Cynicism e91
Professional efficacy e101
mental illness
Stress e1111
Anxiety e121
Depression e131
I.2 CFA for the Mental Distress model
Figure I.2. CFA for Mental Distress model
Table I.3
Standardized regression weights (β) and squared multiple correlations (SMC) for the
Mental Distress model
Latent variable Observed variable β SMC
Individual Factors (IF) Dispositional optimism .725*** .526
Individual Factors (IF) coping self-efficacy .762*** .581
Positive Workplace Factors (PWF) skill discretion .614*** .377
Positive Workplace Factors (PWF) job autonomy .632*** .399
Positive Workplace Factors (PWF) affective commitment .674*** .454
Negative Spillover (NSP) negative work-family spillover .659*** .434
Negative Spillover (NSP) negative family-work spillover .671*** .451
Burnout exhaustion .742*** .550
Burnout cynicism .859*** .738
Burnout professional efficacy -.583*** .340
Mental Illness (MI) depression .900*** .810
Mental Illness (MI) anxiety .647*** .419
Mental Illness (MI) stress .767*** .588
* p < .05, ** p < .01, *** p < .001
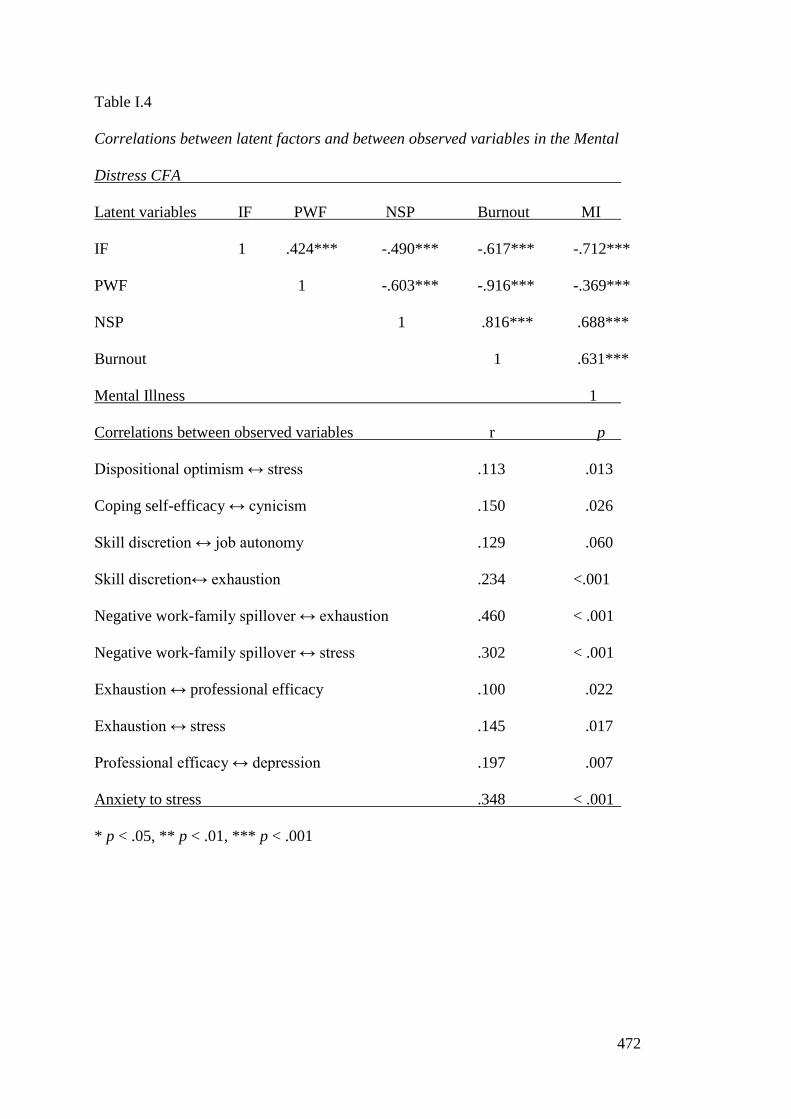
472
Table I.4
Correlations between latent factors and between observed variables in the Mental
Distress CFA
Latent variables IF PWF NSP Burnout MI
IF 1 .424*** -.490*** -.617*** -.712***
PWF 1 -.603*** -.916*** -.369***
NSP 1 .816*** .688***
Burnout 1 .631***
Mental Illness 1
Correlations between observed variables r p
Dispositional optimism ↔ stress .113 .013
Coping self-efficacy ↔ cynicism .150 .026
Skill discretion ↔ job autonomy .129 .060
Skill discretion↔ exhaustion .234 <.001
Negative work-family spillover ↔ exhaustion .460 < .001
Negative work-family spillover ↔ stress .302 < .001
Exhaustion ↔ professional efficacy .100 .022
Exhaustion ↔ stress .145 .017
Professional efficacy ↔ depression .197 .007
Anxiety to stress .348 < .001
* p < .05, ** p < .01, *** p < .001

473
Individual Factors
Positive
Workplace Factors
Negative
Spillover
Overall
Well-Being
Mental Illness
Dispositional optimism e111
Coping self-efficacy e21
Skill discretion e311
Job autonomy e41
Affective commmitment e51
Neg Work-Family spillovere611
Neg Family-Work spillovere71
Psychological well-being e81 1
Life satisfaction e91
Stress e1011
Anxiety e111
Depression e121
I.3 CFA for the Well-Being – Mental Health model
Started with CFA, developing on from Well-being and Mental Health Problems
models
Figure I.3. The CFA for the Well-Being Mental Health model
Table I.5
Correlations between latent factors and observed variables in the CFA
Latent factors IF PWF NSP OWB MI
IF 1 .463*** -.506*** .922*** -.694***
PWF 1 -.463*** .538*** -.306***
NSP 1 -.529*** .737***
OWB 1 -.602***
MI 1
Correlations between observed variables r p
Dispositional optimism ↔ stress .119* .015
Skill discretion ↔ negative work-family spillover .244 < .001
Skill discretion ↔ stress .190 < .001
Negative work-family spillover ↔ stress .302 < .001
Anxiety to stress .328 < .001
* p < .05, ** p < .01, *** p < .001

474
Table I.6
Standardized regression weights (β) and squared multiple correlations for the Well-
Being- Mental Health model
Latent variable Observed variable β SMC
Individual Factors (IF) Dispositional optimism .694*** .481
Individual Factors (IF) coping self-efficacy .768*** .590
Positive Workplace Factors (PWF) skill discretion .634*** .402
Positive Workplace Factors (PWF) job autonomy .679*** .461
Positive Workplace Factors (PWF) affective commitment .477*** .227
Negative Spillover (NSP) negative work-family spillover .630*** .397
Negative Spillover (NSP) negative family-work spillover .625*** .391
Overall Well-Being (OWB) Psychological well-being .862*** .743
Overall Well-Being (OWB) life satisfaction .753*** .567
Mental Illness (MI) depression .889*** .790
Mental Illness (MI) anxiety .628*** .394
Mental Illness (MI) stress .748*** .559
* p < .05, ** p < .01, *** p < .001

475
Individual factors
Positive Workplace
Factors
Negative Spillover
Work Engagment
Burnout
Dispostional optimism e11 1
Coping self-efficacy e21
Job autonomy e311
Skill dsicretion e41
Affective commitment e51
Neg Work-Family spillovere611
Neg Family-Work spillovere71
Work vigour e811
Work dedication e91
Work absorption e101
Exhaustion e1111
Cynicism e121
Professional Efficacy e131
I.4 CFA for Burnout and Work Engagement, which becomes Work Engagement
Figure I.4. First, unsuccessful CFA for Burnout – Work Engagement
Fit indices for the first unsuccessful CFA, shown in Figure L.4, X2/df = 2.360, CFI =
.985, RMSEA = .054 (90% CI = .038 - .071).

476
Work Engagement
Work vigour e11
1
Work dedication e21
Work absorption e31
Exhaustion e41
Cynicism e51
Professional efficacy e61
Work Engagement
Work vigour e11
1
Work dedication e21
Work absorption e31
Cynicism e41
Professional efficacy e51
Examining Burnout and Work Engagement
First, a one-factor solution was proposed with all six observed variables,
shown in Figure I.5. With six components, the fit indices were X2 (5) = 17.2, X
2/df =
3.4340, CFI = .990, RMSEA = .073 (90%CI = .037-.112). However, exhaustion was
removed from the model, as the squared multiple correlation was only .13,
considerably less than the acceptable level of .30. The final model, with five
observed variables was well-fitting, X2/df = .933, CFI = 1.000, RMSEA = .000 (90%
CI = .000 - .077) and is shown in Figure I.6. Second, a two-factor solution was
proposed with the latent factors, Burnout and Work Engagement, measured by the
observed variables for each scale. With two factors, as shown in Figure L.7
Figure I.5. Burnout and Work Engagement as one-factor, all observed variables
Figure I.6. The final model for Burnout and Work Engagement, as a one-factor
solution, with five components

477
core burnoutExhaustion e11
1
Cynicism e21
engagement
Work vigour e31
1
Work dedication e41
Work absorption e51
Professional efficacy e61
Engagement
Burnout
Work vigour e111
Work dedication e21
Exhaustion e311
Cynicism e41
Work absorption e51
Professional efficacy e61
, fit was poor (X2/df = 17.656, CFI = .933, RMSEA = .190, 90% CI = .157- .226))
and could not be improved without making the solution inadmissible, such that the
correlations between burnout and work engagement became greater than 1 (r = -
1.003). Another two-factor solution, shown in Figure I.8, was proposed by Schaufeli
et al., 2002, with burnout as the core dimensions of exhaustion and cynicism, and
work engagement as the remaining four observed variable. However, the fit indices
indicated that this was not an admissible solution as the covariance matrix is not
positive definite.
Figure I.7. Work Engagement and Burnout as two factors based on the separate
scales
Figure I.8. „Core‟ of Burnout and rest of indicators as part of Work Engagement

478
Individual Factors
Positive Workplace
Factors
Negative Spillover
Work Engagement
Dispositional optimism e111
Coping self-efficacy e21
Skill discretion e31
1
Job autonomy e41
Neg Work-Family spillovere611
Neg Family-Work spillovere71
Work dedication e91
1
Work absorption e111
Professional efficacy e131
Affective commitment e51
Cynicism e141
Figure I.9. Final CFA for Work Engagement model, using one-factor Work
engagement
Table 1.7
Standardized regression weights (β) and squared multiple correlations (SMC) for
Work Engagement model
Latent variable Observed variable β SMC
Individual Factors (IF) dispositional optimism .710*** .505
Individual Factors (IF) coping self-efficacy .752*** .565
Positive Workplace Factors (PWF) skill discretion .684*** .468
Positive Workplace Factors (PWF) job autonomy .591*** .350
Positive Workplace Factors (PWF) affective commitment .557*** .310
Negative Spillover (NSP) negative work-family spillover .534*** .285
Negative Spillover (NSP) negative family-work spillover .730*** .533
Work engagement (WE) work dedication .889*** .790
Work engagement (WE) work absorption .642*** .412
Work engagement (WE) professional efficacy .588*** .346
Work engagement (WE) cynicism -.788*** .620
* p < .05, ** p < .01, *** p < .001
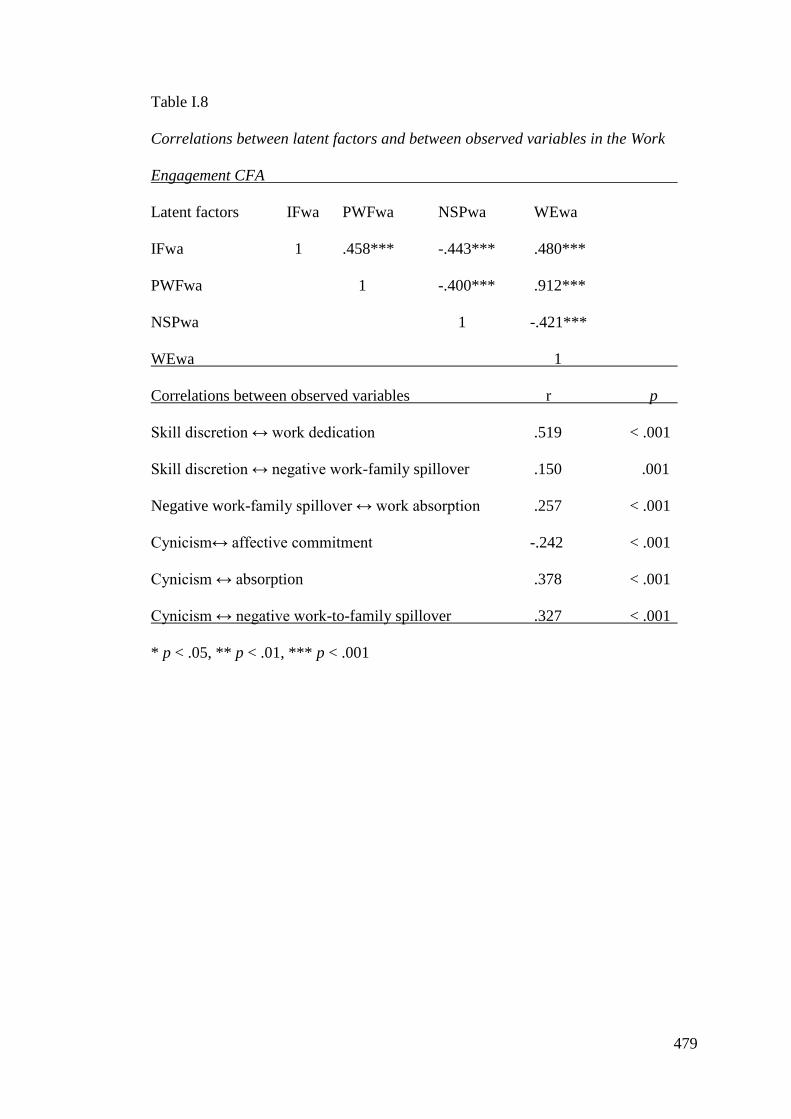
479
Table I.8
Correlations between latent factors and between observed variables in the Work
Engagement CFA
Latent factors IFwa PWFwa NSPwa WEwa
IFwa 1 .458*** -.443*** .480***
PWFwa 1 -.400*** .912***
NSPwa 1 -.421***
WEwa 1
Correlations between observed variables r p
Skill discretion ↔ work dedication .519 < .001
Skill discretion ↔ negative work-family spillover .150 .001
Negative work-family spillover ↔ work absorption .257 < .001
Cynicism↔ affective commitment -.242 < .001
Cynicism ↔ absorption .378 < .001
Cynicism ↔ negative work-to-family spillover .327 < .001
* p < .05, ** p < .01, *** p < .001

480
Individual Factors
Positive Workplace
Factors
Negative Spillover
Overall Well-Being
Mental Illness
Work Engagement
Dispositional optimism e111
Coping self-efficacy e21
Skill discretion e311
Job autonomy e41
Affective commitment e51
Neg Work-Family spillover e611
Neg Family-Work spillover e71
Psychological well-being e811
Life satisfaction e91
Depression e1011
Anxiety e111
Stress e121
Work dedication e131
1
Work absorption e141
Professional efficacy e151
Exhaustion e161
I.5 CFA for the Integrated model
Figure I.10. CFA for the Integrated model
X2/df = 2.784, CFI = .954, RMSEA = .062 (90%CI = .053-..072)

481
Table I.9
Standardized regression weights (β) and squared multiple correlations(SMC) for the
Integrated model
Latent variable Observed variable β MC
Individual Factors (IF) dispositional optimism .698*** .487
Individual Factors (IF) coping self-efficacy .765*** .585
Positive Workplace Factors (PWF) skill discretion .790*** .624
Positive Workplace Factors (PWF) job autonomy .513*** .263
Positive Workplace Factors (PWF) affective commitment .486*** .236
Negative Spillover (NSP) negative work-family spillover .754*** .568
Negative Spillover (NSP) negative family-work spillover .525*** .276
Negative Spillover (NSP) exhaustion .834*** .696
Overall Well-Being (OWB) psychological well-being .858*** .737
Overall Well-Being (OWB) life satisfaction .752*** .565
Mental Illness (MI) depression .880*** .774
Mental Illness (MI) anxiety .632*** .400
Mental Illness (MI) stress .758*** .574
Work Engagement (WE) work dedication .982*** .963
Work Engagement (WE) work absorption .607*** .368
Work Engagement (WE) professional efficacy .532*** .283
* p < .05, ** p < .01, *** p < .001

482
Table I.10
Correlations between the latent factors and between the observed variables in the
CFA for the Integrated model
Latent factors IF PWF NSP OWB MI WE
IF 1 .425*** -.471*** .922*** -.685*** .429***
PWF 1 -.300*** .495*** -.262*** .938***
NSP 1 -.506*** .663*** -.366***
OWB 1 -.608*** .421***
MI 1 -.307***
WE 1
Observed variables r p
Job autonomy ↔ professional efficacy .193 < .001
Affective commitment ↔ exhaustion -.321 < .001
Negative work-family spillover ↔ stress .338 < .001
Negative work-family spillover ↔ work absorption .154 .002
Psychological well-being ↔ professional efficacy .227 < .001
Anxiety ↔ stress .325 < .001
* p < .05, ** p < .01, *** p < .001

483
Appendix J: Results of the longitudinal models
Means, standard deviations and correlations between the composite variables
Table J.1
Means, SD, and range of the composite variables in the Well-Being longitudinal
model
N Min Max Mean SD
IFwb1 198 10.29 25.61 19.55 3.00
IFwb2 198 10.93 26.04 19.49 3.17
IFwb3 198 12.33 25.95 19.69 3.11
PWFwb1 198 8.75 25.43 18.71 3.54
PWFwb2 198 8.84 25.54 18.53 3.61
PWFwb3 198 8.82 25.47 18.44 3.61
OWBwb1 198 29.85 64.92 49.98 7.21
OWBwb2 198 27.88 65.81 49.82 7.60
OWBwb3 198 32.12 65.61 50.17 7.43
WWBwb1 198 6.21 26.03 18.97 4.40
WWBwb2 198 6.69 26.17 18.87 4.49
WWBwb3 198 6.24 26.15 18.67 4.44
Note. IF: Individual Factors, PWF: Positive Workplace Factors, OWB: overall Well-Being, WWB:
Work Well-Being; „wb‟ composite variables in the Well-Being model; 1, 2, 3 = times 1, 2, 3
respectively

484
Table J.2
Means, SD, and range of the composite variables in the Mental Distress longitudinal
model
N Min Max Mean SD
IFmi1 198 0.18 16.20 10.08 3.05
IFmi2 198 1.72 16.62 9.99 3.05
IFmi3 198 0.96 16.63 10.28 3.16
PWFmi1 198 -0.41 11.72 5.79 2.42
PWFmi2 198 -0.77 11.76 5.60 2.52
PWFmi3 198 0.12 11.59 5.62 2.58
NSPmi1 198 0.18 8.32 3.82 1.61
NSPmi2 198 0.48 8.26 3.77 1.52
NSPmi3 198 0.59 8.39 3.68 1.63
MIllness1 198 -5.63 24.24 2.51 5.49
MIllness2 198 -5.63 21.04 2.32 4.91
MIllness3 198 -5.90 20.97 2.07 5.61
Burnout1 198 -10.87 5.32 -3.69 3.37
Burnout2 198 -11.68 5.66 -3.52 3.37
Burnout3 198 -11.46 5.17 -3.65 3.56
Note. IF: Individual Factors, PWF: Positive Workplace Factors, NSP: Negative Spillover; „mi‟
composite variables in the Mental Distress model; 1, 2, 3 = times 1, 2, 3 respectively

485
Table J.3
Means, SD, and range of the composite variables in the Well-Being Mental Health
longitudinal model
N Min Max Mean SD
IFwbmh1 198 6.92 19.90 14.58 2.58
IFwbmh2 198 6.03 20.09 14.57 2.65
IFwbmh3 198 7.65 20.03 14.73 2.67
PWFwbmh1 198 8.75 20.35 13.91 2.43
PWFwbmh2 198 7.11 20.26 13.81 2.51
PWFwbmh3 198 7.15 20.31 13.88 2.58
NSpwbmh1 198 0.67 9.13 4.07 1.53
NSPwbmh2 198 1.06 7.99 3.97 1.42
NSPwbmh3 198 0.69 8.41 3.89 1.53
OWBwbmh1 198 26.73 61.64 46.19 7.18
OWBwbmh2 198 23.62 62.50 46.10 7.51
OWBwbmh3 198 28.72 62.09 46.47 7.41
MIwbmh1 198 -5.84 23.07 1.86 5.29
MIwbmh2 198 -5.58 18.34 1.62 4.74
MIwbmh3 198 -6.00 19.23 1.39 5.38
Note. IF: Individual Factors, PWF: Positive Workplace Factors, NSP: Negative Spillover, OWB:
overall Well-Being, MI: Mental Illness; „wbmh‟ composite variables in the Well-Being-Mental Health
model; 1, 2, 3 = times 1, 2, 3 respectively

486
Table J.4
Means, SD, and ranges of composite variables in the Work Engagement longitudinal
model
N Min Max Mean SD
IFwa1 198 5.17 18.76 13.18 2.85
IFwa2 198 5.04 19.66 13.12 2.96
IFwa3 198 5.69 19.75 13.43 2.98
PWFwa1 198 4.90 18.40 11.98 2.83
PWFwa2 198 4.31 18.67 11.89 2.91
PWFwa3 198 3.52 18.67 11.92 2.97
NSPwa1 198 -1.45 4.82 1.33 1.29
NSPwa2 198 -1.58 5.43 1.24 1.30
NSPwa3 198 -1.76 4.88 1.16 1.28
WEwa1 198 2.17 20.14 12.29 3.94
WEwa2 198 1.70 20.26 12.21 4.02
WEwa3 198 1.01 20.43 12.21 3.98
Note. IF: Individual Factors, PWF: Positive Workplace Factors, NSP: Negative Spillover, WE: Work
Engagement; „wa‟ composite variables in the Work Engagement model; 1, 2, 3 = times 1, 2, 3
respectively

487
Table J.5
Means, SD and ranges of the composite variables in the Integrated longitudinal
model
N Min Max Mean SD
IFcm1 198 7.09 22.57 16.45 3.06
IFcm2 198 7.10 22.72 16.43 3.14
IFcm3 198 8.68 22.73 16.62 3.13
PWFcm1 198 10.26 25.95 19.50 3.49
PWFcm2 198 10.49 26.16 19.38 3.58
PWFcm3 198 9.73 26.03 19.22 3.55
NSPcm1 198 1.33 12.20 6.25 2.10
NSPcm2 198 1.55 12.01 6.24 2.03
NSPcm3 198 1.41 12.28 6.08 2.08
OWBcm1 198 23.43 58.71 42.27 7.11
OWBcm2 198 20.05 58.27 42.17 7.39
OWBcm3 198 24.46 58.52 42.53 7.20
MIcm1 198 -4.86 23.88 3.02 5.28
MIcm2 198 -4.65 20.47 2.83 4.74
MIcm3 198 -5.15 20.30 2.60 5.35
WEcm1 198 5.82 25.92 18.82 4.50
WEcm2 198 6.10 25.96 18.72 4.60
WEcm3 198 5.99 25.97 18.51 4.56
Note. IF: Individual Factors, PWF: Positive Workplace Factors, NSP: Negative Spillover, OWB:
Overall Well-Being, MI: mental Illness, WE: Work Engagement; „cm‟ composite variables in the
Integrated model; 1, 2, 3 = times 1, 2, 3 respectively

488
Table J.6
Correlations between the composite variables used for the longitudinal Well-Being model
1 2 3 4 5 6 7 8 9 10 11 12
1 IFwb1 1 .895*** .864*** .582*** .494*** .479*** .982*** .879*** .854*** .515*** .421*** .409***
2 IFwb2 1 .869*** .569*** .584*** .537*** .833*** .987*** .880*** .494*** .499*** .466***
3 IFwb3 1 .517*** .493*** .556*** .857*** .888*** .986*** .448*** .410*** .481***
4 PWFwb1 1 .861*** .817*** .591*** .579*** .528*** .967*** .814*** .768***
5 PWFwb2 1 .817*** .495*** .587*** .496*** .828*** .968*** .779***
6 PWF wb3 1 .477*** .546*** .557*** .782*** .767*** .971***
7 OWbwb1 1 .887*** .867*** .495*** .403*** .387***
8 OWbwb2 1 .891*** .488*** .479*** .459***
9 OWBwb3 1 .445*** .400*** .460***
10 WWBwb1 1 .823*** .771***
11 WWBwb2 1 .767***
12 WWBwb3 1
* p < .05, ** p < .01, *** p < .001 Note. IF: Individual Factors, PWF: Positive Workplace Factors, OWB: overall Well-Being, WWB: Work Well-Being; „wb‟ composite variables in the Well-Being model; 1,
2, 3 = times 1, 2, 3 respectively

489
Table J.7
Correlations between the composite variables in the Mental Distress longitudinal model
1 2 3 4 5 6 7 8
1 IFmi1 1 .843*** .781*** .513*** .461*** .469*** -.634*** -.496***
2 IFmi2 1 .852*** .483*** .549*** .495*** -.535*** -.610***
3 IFmi3 1 .418*** .455*** .528*** -.558*** -.583***
4 PWFmi1 1 .816*** .739*** -.663*** -.552***
5 PWFmi2 1 .764*** -.531*** -.631***
6 PWFmi3 1 -.579*** -.608***
7 NegSp1 1 .735***
8 NegSp2 1
(Continued) 9 10 11 12 13 14 15
1 IFmi1 -.481*** -.829*** -.594*** -.538*** -.711*** -.594*** -.577***
2 IFmi2 -.521*** -.649*** -.787*** -.598*** -.626*** -.718*** -.617***
3 IFmi3 -.667*** -.643*** -.704*** -.828*** -.580*** -.620*** -.719***
4 PWFmi1 -.482*** -.451*** -.438*** -.336*** -.937*** -.788*** -.686***
5 PWFmi2 -.474*** -.383*** -.469*** -.341*** -.765*** -.947*** -.705***
6 PWFmi3 -.695*** -.412*** -.465*** -.470*** -.732*** -.770*** -.944***
7 NSPmi1 .695*** .816*** .597*** .569*** .857*** .660*** .678***
8 NSPmi2 .760*** .563*** .801*** .625*** .669*** .821*** .722***
9 NSPmi3 1 .538*** .606*** .819*** .607*** .623*** .869***
10 MIllness1 1 .614*** .566*** .717*** .537*** .542***
11 MIllness2 1 .673*** .580*** .704*** .610***
12 MIllness3 1 .493*** .518*** .715***
13 Burnout1 1 .814*** .750***
14 Burnout2 1 .786***
15 Burnout3 1
* p < .05, ** p < .01, *** p < .001 Note. IF: Individual Factors, PWF: Positive Workplace Factors, NSP: Negative Spillover; „wb‟ composite variables
in the Well-Being model; 1, 2, 3 = times 1, 2, 3 respectively

490
Table J.8
Correlations between the composite variables in the Well-Being- Mental Health longitudinal
Model
2 3 4 5 6 7 8
1 IFwbmh1 .865*** .827*** .605*** .542*** .523*** -.572*** -.406***
2 IFwbmh2 1 .879*** .600*** .649*** .582*** -.473*** -.521***
3 IFwbmh3 1 .544*** .555*** .606*** -.512*** -.514***
4 PWFwbmh1 1 .853*** .810*** -.550*** -.438***
5 PWFwbmh2 1 .827*** -.462*** -.507***
6 PWFwbmh3 1 -.483*** -.474***
7 NSpwbmh1 1 .703***
8 NSPwbmh2 1
9 10 11 12 13 14 15
1 -.411*** .978*** .860*** .844*** -.789*** -.599*** -.527***
2 -.445*** .868*** .982*** .886*** -.615*** -.769*** -.579***
3 -.598*** .828*** .860*** .979*** -.633*** -.703*** -.785***
4 -.454*** .667*** .640*** .592*** -.419*** -.416*** -.367***
5 -.471*** .590*** .691*** .593*** -.376*** -.466*** -.392***
6 -.594*** .567*** .612*** .650*** -.389*** -.448*** -.458***
7 .667*** -.537*** -.471*** -.508*** .824*** .561*** .562***
8 .742*** -.393*** -.484*** -.497*** .529*** .810*** .628***
9 NSPwbmh3 1 -.411*** -.434*** -.563*** .511*** .582*** .842***
10 OWBwbmh1 1 .884*** .864*** -.694*** -.569*** -.503***
11 OWBwbmh2 1 .889*** -.585*** -.682*** -.535***
12 OWBwbmh3 1 -.614*** -.667*** -.689***
13 MIwbmh1 1 .608*** .570***
14 MIwbmh2 1 .678***
15 MIwbmh3 1
* p < .05, p < .01, *** p < .001 Note. IF: Individual Factors, PWF: Positive Workplace Factors, NSP: Negative Spillover, OWB: Overall Well-
Being, MI: Mental Illness; „wbmh‟ composite variables in the Well-Being-Mental Health model; 1, 2, 3 = Times 1,
2, 3 respectively

491
Table J.9
Correlations between the composite variables in the Work Engagement longitudinal model
1 2 3 4 5 6 7 8 9 10 11 12
1 IFwa1 1 .873*** .819*** .564*** .512*** .508*** -.582*** -.477*** -.474*** .556*** .503*** .502***
2 IFwa2 1 .875*** .521*** .578*** .523*** -.530*** -.567*** -.535*** .504*** .561*** .515***
3 IFwa3 1 .467** .498** .569*** -.543*** -.552*** -.629*** .442*** .467*** .560***
4 PWFwa1 1 .856*** .778*** -.484*** -.366*** -.357*** .967*** .830*** .747***
5 PWFwa2 1 .823*** -.427*** -.423*** -.380*** .816*** .972*** .793***
6 PWFwa3 1 -.463*** -.437*** -.487*** .740*** .782*** .973***
7 NSPwa1 1 .760*** .716*** -.459*** -.418*** -.453***
8 NSPwa2 1 .788*** -.354*** -.427*** -.445***
9 NSPwa3 1 -.321*** -.352*** -.466***
10 WEwa1 1 .827*** .740***
11 WEwa2 1 .782***
12 WEwa3 1
* p < .05, ** p < .01, *** p < .001 Note. IF: Individual Factors, PWF: Positive Workplace Factors, NSP: Negative Spillover, WE: Work Engagement; „wa‟ composite variables in the Work Engagement model;
1, 2, 3 = times 1, 2, 3 respectively
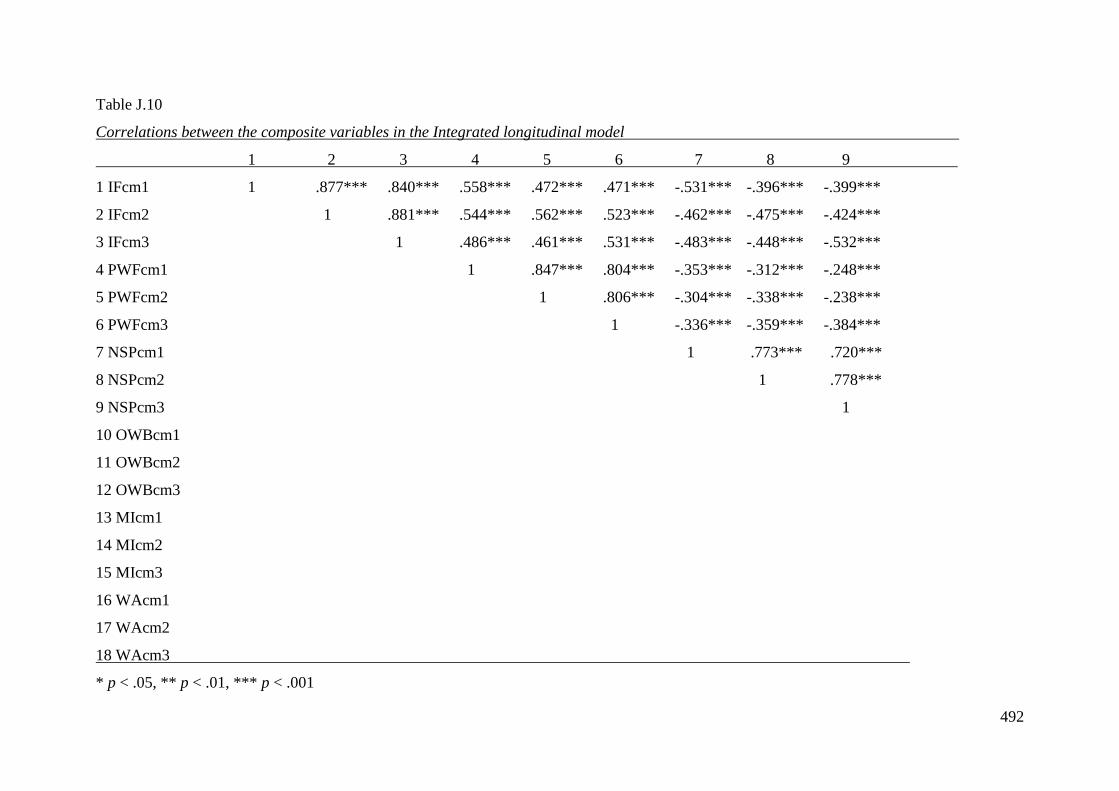
492
Table J.10
Correlations between the composite variables in the Integrated longitudinal model
1 2 3 4 5 6 7 8 9
1 IFcm1 1 .877*** .840*** .558*** .472*** .471*** -.531*** -.396*** -.399***
2 IFcm2 1 .881*** .544*** .562*** .523*** -.462*** -.475*** -.424***
3 IFcm3 1 .486*** .461*** .531*** -.483*** -.448*** -.532***
4 PWFcm1 1 .847*** .804*** -.353*** -.312*** -.248***
5 PWFcm2 1 .806*** -.304*** -.338*** -.238***
6 PWFcm3 1 -.336*** -.359*** -.384***
7 NSPcm1 1 .773*** .720***
8 NSPcm2 1 .778***
9 NSPcm3 1
10 OWBcm1
11 OWBcm2
12 OWBcm3
13 MIcm1
14 MIcm2
15 MIcm3
16 WAcm1
17 WAcm2
18 WAcm3
* p < .05, ** p < .01, *** p < .001

493
Table J.10 (continued)
10 11 12 13 14 15 16 17 18
1 IFcm1 .970*** .858*** .842*** -.778*** -.591*** -.530*** .509*** .408*** .409***
2 IFcm2 .869*** .978*** .881*** -.624*** -.744*** -.569*** .488*** .488*** .464***
3 IFcm3 .829*** .863*** .970*** -.644*** -.691*** -.768*** .438*** .394*** .477***
4 PWFcm1 .567*** .551*** .506*** -.388*** -.395*** -.317*** .974*** .806*** .757***
5 PWFcm2 .477*** .559*** .475*** -.330*** -.402*** -.291*** .820*** .975*** .766***
6 PWFcm3 .470*** .529*** .542*** -.368*** -.434*** -.389*** .782*** .768*** .977***
7 NSPcm1 -.538*** -.466*** -.493*** .740*** .565*** .536*** -.398*** -.332*** -.356***
8 NSPcm2 -.404*** -.481*** -.454*** .540*** .721*** .554*** -.346*** -.387*** -.402***
9 NSPcm3 -.397*** -.427*** -.518*** .536*** .572*** .732*** -.279*** -.264*** -.438***
10 OWBcm1 1 .883*** .864*** -.696*** -.567*** -.497*** .479*** .389*** .384***
11 OWBcm2 1 .890*** -.586*** -.679*** -.532*** .472*** .455*** .450***
12 OWBcm3 1 -.623*** -.668*** -.665*** .435*** .389*** .453***
13 MIcm1 1 .620*** .581*** -.417*** -.333*** -.365***
14 MIcm2 1 .677*** -.404*** -.413*** -.439***
15 MIcm3 1 -.332*** -.290*** -.414***
16 WAcm1 1 .815*** .766***
17 WAcm2 1 .760***
18 WAcm3 1
* p < .05, ** p < .01, *** p < .001 Note. IF: Individual Factors, PWF: Positive Workplace Factors, NSP: Negative Spillover, OWB: Overall Well-Being, MI: Mental Illness; WE: Work Engagement; „cm‟
composite variables in the Integrated model; 1, 2, 3 = times 1, 2, 3 respectively

494
Table J.11
Chi-squared, degrees of freedom and significance in all longitudinal models for each competing set of models
Stability, A Causality, B Reverse Causality, C Reciprocal, D Trimmed Reciprocal, E
Model Χ2 (df) p Χ
2 (df) p Χ
2 (df) p Χ
2 (df) p Χ
2 (df) p
Well-Being 95.3 (36) <.001 35.4 (28) .158 40.8 (28) .056 24.0 (20) .241 32.7 (29) .291
Mental Distress 96.9 (60) .002 60.6 (48) .105 74.3 (48) .009 43.4 (36) .186 47.5 (44) .334
Well-Being-Mental Health 131.2 (60) <.001 62.3 (48) .080 78.7 (48) .003 34.9 (36) .552 44.8 (50) .682
Work Engagement 67.6 (36) .001 36.6 (30) .189 47.8 (30) .021 33.3 (24) .097 36.5 (32) .267
Integrated 187.1 (90) <.001 96.9 (72) .027 121.0 (72) <.001 72.4 (54) .048 93.9 (74) .059
Note. X2 (df) Discrepancy function b/w sample & implied models with associated degrees of freedom; if p > .05, sample & implied models not different;
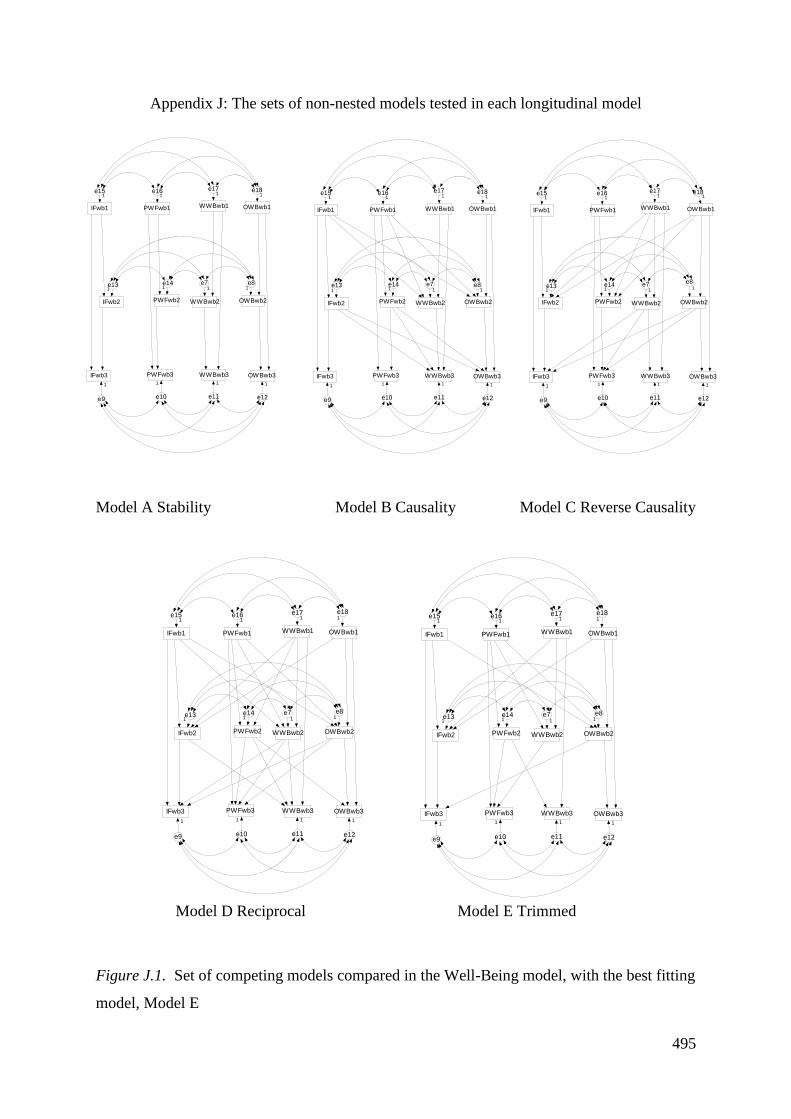
495
IFwb2 PWFwb2 WWBwb2 OWBwb2
IFwb3 PWFwb3 WWBwb3 OWBwb3
e71
e8
e9 e10 e11 e12
1 1 1 1
e131
e141
IFwb1 PWFwb1 WWBwb1 OWBwb1
e151
e161
e171
e18
1
1
IFwb2 PWFwb2 WWBwb2 OWBwb2
IFwb3 PWFwb3 WWBwb3 OWBwb3
e71
e8
e9 e10 e11 e12
1 1 1 1
e131
e141
IFwb1 PWFwb1 WWBwb1 OWBwb1
e151
e161
e171
e181
1
IFwb2 PWFwb2 WWBwb2 OWBwb2
IFwb3 PWFwb3 WWBwb3 OWBwb3
e71
e8
e9 e10 e11 e12
1 1 1 1
e131
e141
IFwb1 PWFwb1 WWBwb1 OWBwb1
e151
e161
e171
e181
1
IFwb2 PWFwb2 WWBwb2 OWBwb2
IFwb3 PWFwb3 WWBwb3 OWBwb3
e71
e8
e9 e10 e11 e12
1 1 1 1
e131
e14
IFwb1 PWFwb1 WWBwb1 OWBwb1
e151
e16 e171
e181
11
1
IFwb2 PWFwb2 WWBwb2 OWBwb2
IFwb3 PWFwb3 WWBwb3 OWBwb3
e71
e8
e9 e10 e11 e12
1 1 1 1
e131
e141
IFwb1 PWFwb1 WWBwb1 OWBwb1
e151
e161
e171
e18
1
1
Appendix J: The sets of non-nested models tested in each longitudinal model
Model A Stability Model B Causality Model C Reverse Causality
Model D Reciprocal Model E Trimmed
Figure J.1. Set of competing models compared in the Well-Being model, with the best fitting
model, Model E

496
IFmi1 PWFmi1 NegSp1 burnout1 MIllness1
IFmi2 PWFmi2 NegSp2 burnout2 MIllness2
IFmi3 PWFmi3 NegSp3 burnout3 MIllness3
e11
e21
e31
e41
e51
e61
e71
e81
e91
e101
e11 e12 e13 e14 e15
11 1 1 1
model 4 all reciprocal pathways mental illness and burnout,
Cmin/df = 1.205, RMSEA = 1.205, AIC = 211.367
IFmi1 PWFmi1 NegSp1 burnout1 MIllness1
IFmi2 PWFmi2 NegSp2 burnout2 MIllness2
IFmi3 PWFmi3 NegSp3 burnout3 MIllness3
e11
e21
e31
e41
e51
e61
e71
e81
e91
e101
e11 e12 e13 e14 e15
11 1 1 1
IFmi1 PWFmi1 NegSp1 burnout1 MIllness1
IFmi2 PWFmi2 NegSp2 burnout2 MIllness2
IFmi3 PWFmi3 NegSp3 burnout3 MIllness3
e11
e21
e31
e41
e51
e61
e71
e81
e91
e101
e11 e12 e13 e14 e15
11 1 1 1
IFmi1 PWFmi1 NegSp1 burnout1 MIllness1
IFmi2 PWFmi2 NegSp2 burnout2 MIllness2
IFmi3 PWFmi3 NegSp3 burnout3 MIllness3
e11
e21
e31
e41
e51
e61
e71
e81
e91
e101
e11 e12 e13 e14 e15
11 1 1 1
model 3 reverse causality mental illness and burnout
Cmin/df = 1.548, RMSEA = .052, AIC = 218.324
IFmi1 PWFmi1 NegSp1 burnout1 MIllness1
IFmi2 PWFmi2 NegSp2 burnout2 MIllness2
IFmi3 PWFmi3 NegSp3 burnout3 MIllness3
e11
e21
e31
e41
e51
e61
e71
e81
e91
e101
e11 e12 e13 e14 e15
11 1 1 1
Model A Stability Model B Causality Model C Reverse Causality
Model D Reciprocal Model E Trimmed
Figure J.2. Set of competing models that are compared in the Mental Distress model, with the
best fitting model, Model E

497
IFwbmh1 PWFwbmh1 NSpwbmh1 OWBwbmh1 MIwbmh1
IFwbmh2 PWFwbmh2 NSPwbmh2 OWBwbmh2 MIwbmh2
IFwbmh3 PWFwbmh3 NSPwbmh3 OWBwbmh3 MIwbmh3
e11
e21
e31
e41
e51
e61
e71
e81
e91
e101
e11 e12 e13 e14 e15
11111
IFwbmh1 PWFwbmh1 NSpwbmh1 OWBwbmh1 MIwbmh1
IFwbmh2 PWFwbmh2 NSPwbmh2 OWBwbmh2 MIwbmh2
IFwbmh3 PWFwbmh3 NSPwbmh3 OWBwbmh3 MIwbmh3
e11
e21
e31
e41
e51
e61
e71
e81
e91
e101
e11 e12 e13 e14 e15
11111
IFwbmh1 PWFwbmh1 NSpwbmh1 OWBwbmh1 MIwbmh1
IFwbmh2 PWFwbmh2 NSPwbmh2 OWBwbmh2 MIwbmh2
IFwbmh3 PWFwbmh3 NSPwbmh3 OWBwbmh3 MIwbmh3
e11
e21
e31
e41
e51
e61
e71
e81
e91
e101
e11 e12 e13 e14 e15
11111
IFwbmh1 PWFwbmh1 NSpwbmh1 OWBwbmh1 MIwbmh1
IFwbmh2 PWFwbmh2 NSPwbmh2 OWBwbmh2 MIwbmh2
IFwbmh3 PWFwbmh3 NSPwbmh3 OWBwbmh3 MIwbmh3
e11
e21
e31
e41
e51
e61
e71
e81
e9 e101
e11 e12 e13 e14 e15
11111
1
IFwbmh1 PWFwbmh1 NSpwbmh1 OWBwbmh1 MIwbmh1
IFwbmh2PWFwbmh2 NSPwbmh2 OWBwbmh2 MIwbmh2
IFwbmh3 PWFwbmh3 NSPwbmh3 OWBwbmh3 MIwbmh3
e11
e21
e31
e41
e51
e61
e71
e81
e91
e101
e11 e12 e13 e14 e15
11111
Model A Stability Model B Causality Model C Reverse Causality
Model D Reciprocal Model E Trimmed
Figure J.3. Competing set of models for the Well-Being – Mental Health model, with the best
fitting model, Model E

498
IFwa1 PWFwa1 NSPwa1WEwa1
IFwa2 PWFwa2 NSPwa2 WEwa2
IFwa3 PWFwa3 NSPwa3 WEwa3
e11
e21
e31 e4
1
e51
e61
e71
e8
e9e10 e11 e12
11 1
1
1
IFwa1 PWFwa1 NSPwa1WEwa1
IFwa2 PWFwa2 NSPwa2 WEwa2
IFwa3 PWFwa3 NSPwa3 WEwa3
e11
e21
e31 e4
1
e51
e61
e71
e81
e9e10 e11 e12
11 1
1
IFwa1 PWFwa1 NSPwa1WEwa1
IFwa2 PWFwa2 NSPwa2 WEwa2
IFwa3 PWFwa3 NSPwa3 WEwa3
e11
e21
e31 e4
1
e51
e61
e71
e8
e9e10 e11 e12
11 1
1
1
IFwa1 PWFwa1 NSPwa1WEwa1
IFwa2 PWFwa2 NSPwa2 WEwa2
IFwa3 PWFwa3 NSPwa3 WEwa3
e11
e21
e31 e4
1
e51
e61
e71
e8
e9e10 e11 e12
11 1
1
1
IFwa1 PWFwa1 NSPwa1WEwa1
IFwa2 PWFwa2 NSPwa2 WEwa2
IFwa3 PWFwa3 NSPwa3 WEwa3
e11
e21
e31 e4
1
e51
e61
e71
e8
e9e10 e11 e12
11 1
1
1
Model A Stability Model B Causality Model C Reverse Causality
Model D Reciprocal Model E Trimmed
Figure J.4. Models compared by the Work Engagement model, with Model E, the best fitting
model

499
IFcm1 PWFcm1 NSPcm1 OWBcm1 MIcm1 WEcm1
IFcm2 PWFcm2 NSPcm2 OWBcm2 MIcm2 WEcm2
IFcm3 PWFcm3 NSPcm3 OWBcm3 MIcm3 WEcm3
e11
e21
e31
e41
e51
e61
e71
e81
e91
e101
e111
e121
e13 e14 e15 e16 e17 e18
1 1 1 1 1 1
IFcm1 PWFcm1 NSPcm1 OWBcm1 MIcm1 WEcm1
IFcm2 PWFcm2 NSPcm2 OWBcm2 MIcm2 WEcm2
IFcm3 PWFcm3 NSPcm3 OWBcm3 MIcm3 WEcm3
e11
e21
e31
e41
e51
e61
e71
e81
e91
e101
e111
e121
e13 e14 e15 e16 e17 e18
1 1 1 1 1 1
IFcm1 PWFcm1 NSPcm1 OWBcm1 MIcm1 WEcm1
IFcm2 PWFcm2 NSPcm2 OWBcm2 MIcm2 WEcm2
IFcm3 PWFcm3 NSPcm3 OWBcm3 MIcm3 WEcm3
e11
e21
e31
e41
e51
e61
e71
e81
e91
e101
e111
e121
e13 e14 e15 e16 e17 e18
1 1 1 1 1 1
IFcm1 PWFcm1 NSPcm1 OWBcm1 MIcm1 WEcm1
IFcm2 PWFcm2 NSPcm2 OWBcm2 MIcm2 WEcm2
IFcm3 PWFcm3 NSPcm3 OWBcm3 MIcm3 WEcm3
e11
e21
e31
e41
e51
e61
e71
e81
e91
e101
e111
e121
e13 e14 e15 e16 e17 e18
1 1 1 1 1 1
IFcm1 PWFcm1 NSPcm1 OWBcm1 MIcm1 WAcm1
IFcm2 PWFcm2 NSPcm2 OWBcm2 MIcm2 WAcm2
IFcm3 PWFcm3 NSPcm3 OWBcm3 MIcm3 WAcm3
e11
e21
e31
e41
e51
e61
e71
e81
e91
e101
e111
e121
e13 e14 e15 e16 e17 e18
1 1 1 1 1 1
Model A Stability Model B Causality Model C Reverse Causality
Model D Reciprocal Model E Trimmed
Figure J.5. The set of models compared by the Integrated model, with model E, the best
fitting

500
Appendix J: Synchronous correlations in each model
Table J.12
Synchronous correlations of the variables in the Well-Being model
Time 1
IFwb1 PWFwb1 OWBwb1 WWBwb1
IFwb1 1 .582*** .982*** .515***
PWFwb1 1 .591*** .967***
OWB1 1 .495***
WWB1 1
Time 2
IFwb2 PWFwb2 OWBwb2 WWBwb2
IFwb2 1 .453*** .964*** .369***
PWFwb2 1 .426*** .943***
OWBwb2 1 .296***
WWBwb2 1
Time 3
IFwb3 PWFwb3 OWBwb3 WWBwb3
IFwb3 1 .402*** .961*** .327***
PWFwb3 1 .388*** .953***
OWBwb3 1 .283***
WWBwb3 1
* p < .05, ** p < .01, *** p < .001 Note. IF: Individual Factors, PWF: Positive Workplace Factors, OWB: overall Well-Being, WWB: Work Well-
Being; „wb‟ composite variables in the Well-Being model; 1, 2, 3 = times 1, 2, 3 respectively

501
Table J.13
Synchronous correlations between variables at each time period of the Mental Distress model
Time 1
IFmi1 PWFmi1 NSPmi1 BURNmi1 MImi1
IFmi1 1 .513*** -.634*** -.711*** -.829***
PWFmi1 1 -.663*** -.937*** -.451***
NSPmi1 1 .857*** .816***
BURNmi1 1 .717***
MImi1 1
Time 2
IFmi2 PWFmi2 NSPmi2 BURNmi2 MImi2
IFmi2 1 .399*** -.551*** -.624*** -.738***
PWFmi2 1 -.491*** -.914*** -.229***
NSPmi2 1 .770*** .715***
BURNmi2 1 .572***
MImi2 1
Time 3
IFmi3 PWFmi3 NSPmi3 BURNmi3 MImi3
IFmi3 1 .317*** -.532*** -.571*** -.783***
PWFmi3 1 -.567*** -.922*** -.271***
NSPmi3 1 .809*** .727***
BURNmi3 1 .591***
MImi3 1
* p < .05, ** p < .01, *** p < .001 Note. IF: Individual Factors, PWF: Positive Workplace Factors, NSP: negative Spillover, BURN: burnout, MI:
Mental Illness; „mi‟ composite variables in the Mental Distress model; 1, 2, 3 = times 1, 2, 3 respectively
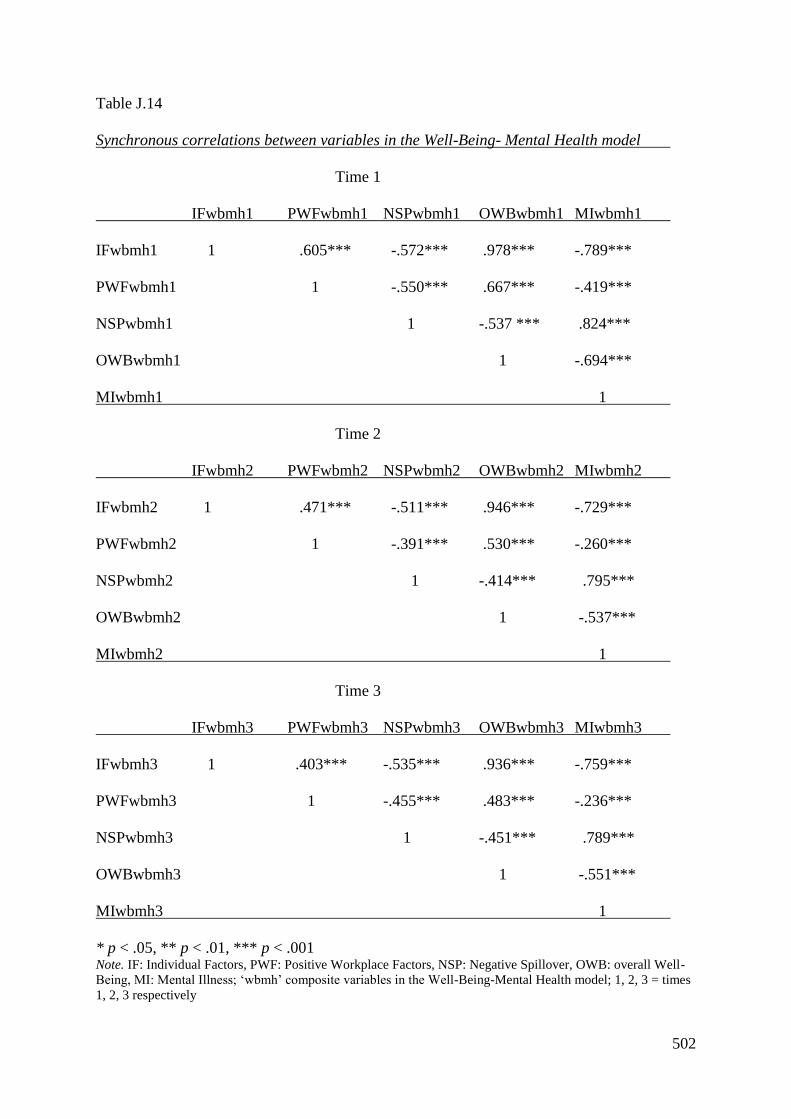
502
Table J.14
Synchronous correlations between variables in the Well-Being- Mental Health model
Time 1
IFwbmh1 PWFwbmh1 NSPwbmh1 OWBwbmh1 MIwbmh1
IFwbmh1 1 .605*** -.572*** .978*** -.789***
PWFwbmh1 1 -.550*** .667*** -.419***
NSPwbmh1 1 -.537 *** .824***
OWBwbmh1 1 -.694***
MIwbmh1 1
Time 2
IFwbmh2 PWFwbmh2 NSPwbmh2 OWBwbmh2 MIwbmh2
IFwbmh2 1 .471*** -.511*** .946*** -.729***
PWFwbmh2 1 -.391*** .530*** -.260***
NSPwbmh2 1 -.414*** .795***
OWBwbmh2 1 -.537***
MIwbmh2 1
Time 3
IFwbmh3 PWFwbmh3 NSPwbmh3 OWBwbmh3 MIwbmh3
IFwbmh3 1 .403*** -.535*** .936*** -.759***
PWFwbmh3 1 -.455*** .483*** -.236***
NSPwbmh3 1 -.451*** .789***
OWBwbmh3 1 -.551***
MIwbmh3 1
* p < .05, ** p < .01, *** p < .001 Note. IF: Individual Factors, PWF: Positive Workplace Factors, NSP: Negative Spillover, OWB: overall Well-
Being, MI: Mental Illness; „wbmh‟ composite variables in the Well-Being-Mental Health model; 1, 2, 3 = times
1, 2, 3 respectively

503
Table J.15
Synchronous correlations between variables at each time period of the Work Engagement
model
Time 1
IFwa1 PWFwa1 NSPwa1 WEwa1
IFwa1 1 .564*** -.582*** .556***
PWFwa1 1 -.484*** .967***
NSPwa1 1 -.459 ***
WEwa1 1
Time 2
IFwa2 PWFwa2 NSPwa2 WEwa2
IFwa2 1 .425*** -.429*** .383***
PWFwa2 1 -.302*** .939***
NSPwa2 1 -.305***
WEwa2 1
Time 1
IFwa3 PWFwa3 NSPwa3 WEwa3
IFwa3 1 .420*** -.419*** .415***
PWFwa3 1 -.294*** .949***
NSPwa3 1 -.254***
WEwa3 1
p < .05, ** p < .01, *** p < .001
Note. IF: Individual Factors, PWF: Positive Workplace Factors, NSP: Negative Spillover, WE: Work
Engagement; „wa‟ composite variables in the Work Engagement model; 1, 2, 3 = times 1, 2, 3 respectively

504
Table J.16
Synchronous correlations between variables in the Integrated model
Time 1
IFcm1 PWFcm1 NSPcm1 OWBcm1 MIcm1 WEcm1
IFcm1 1 .558*** -.513*** .970*** -.778*** .509***
PWFcm1 1 -.353*** .567*** -.388*** .974***
NSPcm1 1 -.538*** .740*** -.398***
OWBcm1 1 -.696*** .479***
MIcm1 1 -.417***
WEcm1 1
Time 2
IFcm2 PWFcm2 NSPcm2 OWBcm2 MIcm2 WEcm2
IFcm2 1 .410*** -.425*** .938*** -.678*** .349***
PWFcm2 1 -.208** .382*** -.166* .964***
NSPcm2 1 -.428*** .627*** -.270***
OWBcm2 1 -.529*** .257***
MIcm2 1 -.203**
WEcm2 1
Time 3
IFcm3 PWFcm3 NSPcm3 OWBcm3 MIcm3 WEcm3
IFcm3 1 .354*** -.457*** .902*** -.723*** .327***
PWFcm3 1 -.375*** .363*** -.187** .969***
NSPcm3 1 -.426*** .620*** -.425***
OWBcm3 1 -.480*** .259***
MIcm3 1 -.230**
WEcm3 1
† p < .10, * p < .05, ** p < .01, *** p < .001
Note. IF: Individual Factors, PWF: Positive Workplace Factors, NSP: Negative Spillover, OWB: Overall Well-
Being, MI: mental Illness. WE: Work Engagement; „cm‟ composite variables in the Integrated model; 1, 2, 3 =
times 1, 2, 3 respectively

505
IFwb1 IFwb2 IFwb2 IFwb3
Standardized regression weights of the auto-lagged and cross-lagged paths for the models
Table J.17
Standardized regression weights for auto-lagged and cross-lagged paths in the Well-Being model
„Input‟ variables a „Outcome‟ variables
a
IFwb2 IFwb3 PWFwb2 PWFwb3 OWBwb2 OWBwb3 WWBwb2 WWBwb3
IFwb1 .685*** .304*** .143
IFwb2 .444***
PWFwb1 .860*** .395*** .077** .219***
PWFwb2 .808*** .484***
OWBwb1 .184 .699*** .340***
OWBwb2 .181*** .589***
WWBwb1 .054* .611*** .366***
WWBwb2 -.340***
† p < .10, * p < .05, ** p < .01, *** p < .001
Note. Auto-lagged paths on the leading diagonal; Causality paths in upper triangular matrix; Reverse Causality paths in lower triangular matrix
Note: a „Input‟ and „Outcome‟ variables refer to variables at the beginning and the end of the causal arrow, respectively, as shown by the explanatory diagram
„Input‟ β = .685*** „Outcome‟ „Input‟ β = .444*** „Outcome‟
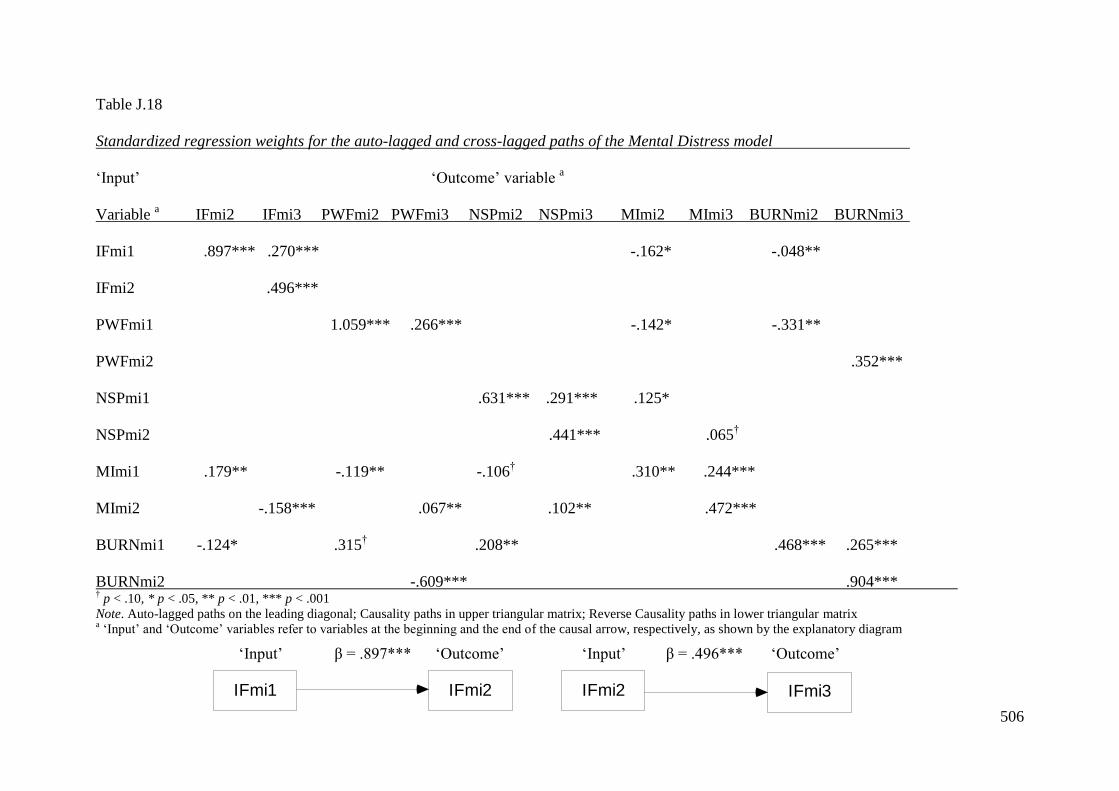
506
IFmi1 IFmi2 IFmi2 IFmi3
Table J.18
Standardized regression weights for the auto-lagged and cross-lagged paths of the Mental Distress model
„Input‟ „Outcome‟ variable a
Variable a IFmi2 IFmi3 PWFmi2 PWFmi3 NSPmi2 NSPmi3 MImi2 MImi3 BURNmi2 BURNmi3
IFmi1 .897*** .270*** -.162* -.048**
IFmi2 .496***
PWFmi1 1.059*** .266*** -.142* -.331**
PWFmi2 .352***
NSPmi1 .631*** .291*** .125*
NSPmi2 .441*** .065†
MImi1 .179** -.119** -.106† .310** .244***
MImi2 -.158*** .067** .102** .472***
BURNmi1 -.124* .315† .208** .468*** .265***
BURNmi2 -.609*** .904*** † p < .10, * p < .05, ** p < .01, *** p < .001
Note. Auto-lagged paths on the leading diagonal; Causality paths in upper triangular matrix; Reverse Causality paths in lower triangular matrix a „Input‟ and „Outcome‟ variables refer to variables at the beginning and the end of the causal arrow, respectively, as shown by the explanatory diagram
„Input‟ β = .897*** „Outcome‟ „Input‟ β = .496*** „Outcome‟
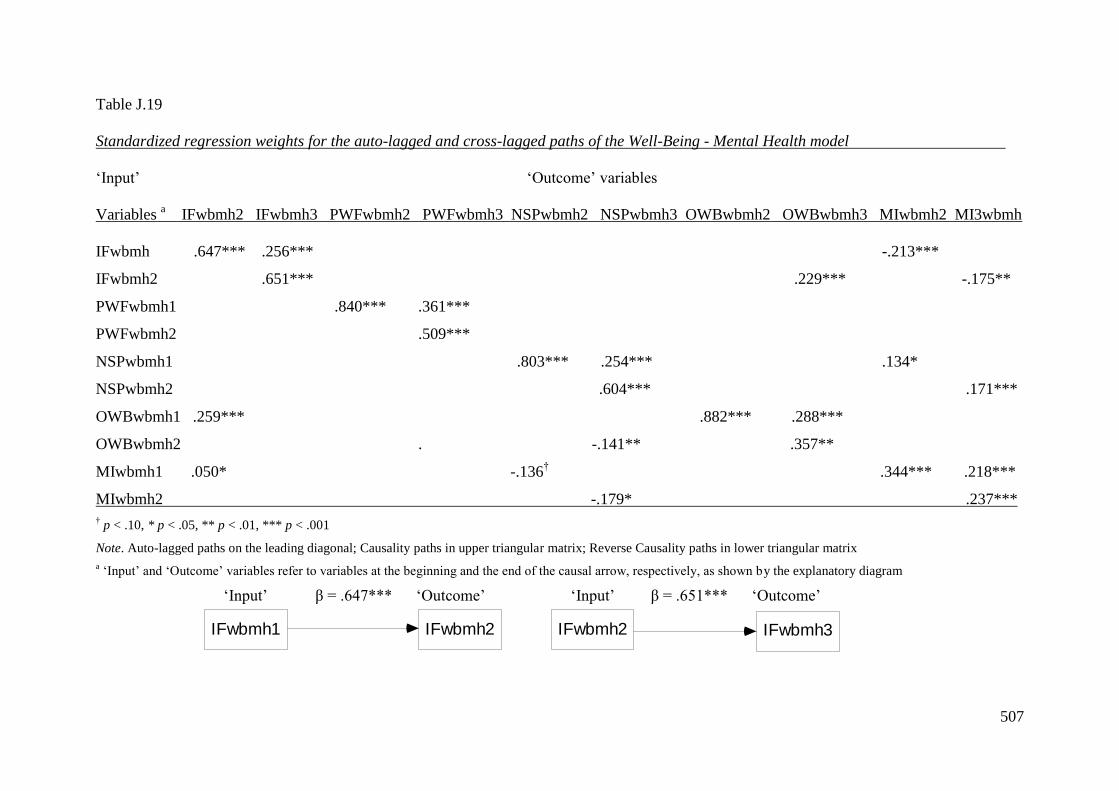
507
IFwbmh1 IFwbmh2 IFwbmh2 IFwbmh3
Table J.19
Standardized regression weights for the auto-lagged and cross-lagged paths of the Well-Being - Mental Health model
„Input‟ „Outcome‟ variables
Variables a IFwbmh2 IFwbmh3 PWFwbmh2 PWFwbmh3 NSPwbmh2 NSPwbmh3 OWBwbmh2 OWBwbmh3 MIwbmh2 MI3wbmh
IFwbmh .647*** .256*** -.213***
IFwbmh2 .651*** .229*** -.175**
PWFwbmh1 .840*** .361***
PWFwbmh2 .509***
NSPwbmh1 .803*** .254*** .134*
NSPwbmh2 .604*** .171***
OWBwbmh1 .259*** .882*** .288***
OWBwbmh2 . -.141** .357**
MIwbmh1 .050* -.136† .344*** .218***
MIwbmh2 -.179* .237***
† p < .10, * p < .05, ** p < .01, *** p < .001
Note. Auto-lagged paths on the leading diagonal; Causality paths in upper triangular matrix; Reverse Causality paths in lower triangular matrix
a „Input‟ and „Outcome‟ variables refer to variables at the beginning and the end of the causal arrow, respectively, as shown by the explanatory diagram
„Input‟ β = .647*** „Outcome‟ „Input‟ β = .651*** „Outcome‟

508
IFwa1 IFwa2 IFwa2 IFwa3
Table J.20
Standardized regression weights for the auto-lagged and cross-lagged paths of the Work Engagement model
„Input‟ „Outcome‟ variables a
Variable a IFwa2 IFwa3 PWFwa2 PWFwa3 NSPwa2 NSPwa3 WEwa2 WEwa3
IFwa1 .867*** .240***
IFwa2 .653***
PWFwa1 .997*** .291*** .422**
PWFwa2 .679*** .334*
NSPwa1 .749*** .271***
NSPwa2 .561***
WEwa1 -.150 .415** .270***
WEwa2 -.114 .226
† p < .10, * p < .05, ** p < .01, *** p < .001
Note. Auto-lagged paths on the leading diagonal; Causality paths in upper triangular matrix; Reverse Causality paths in lower triangular matrix
a „Input‟ and „Outcome‟ variables refer to variables at the beginning and the end of the causal arrow, respectively, as shown by the explanatory diagram
„Input‟ β = .867*** „Outcome‟ „Input‟ β = .653*** „Outcome‟

509
IFcm1 IFcm2 IFcm2 IFcm3
Table J.21
Standardized regression weights for the auto-lagged and cross-lagged paths for the Integrated model
„Input‟ „Outcome‟ variables a
Variables a IFcm2 IFcm3 PWFcm2 PWFcm3 NSPcm2 NSPcm3 OWBcm2 OWBcm3 MIcm2 MIcm3 WEcm2 WEcm3
IFcm1 .633*** .269*** -.221**
IF2cm .616*** .176*** -.139*
PWFcm1 .845*** .329*** .084** -.054 .166***
PWFcm2 .736*** .348*
NSPcm1 .762*** .304*** .185*** -.022*
NSPcm2 .540*** .094* -.015†
OWBcm1 .253*** .828*** .317***
OWBcm2 -.115* .434***
MIcm1 .048*** .311*** .208***
MIcm2 -.113† .354***
WEcm1 .065* .651*** .315***
WEcm2 -.119 .184
† p < .10, * p < .05, ** p < .01, *** p < .001
Note. Auto-lagged paths on the leading diagonal; Causality paths in upper triangular matrix; Reverse Causality paths in lower triangular matrix
a „Input‟ and „Outcome‟ variables refer to variables at the beginning and the end of the causal arrow, respectively, as shown by the explanatory diagram
„Input‟ β = .633*** „Outcome‟ „Input‟ β = .616*** „Outcome‟

510
Appendix K: Terms and glossary for Study 2, Longitudinal modelling
Figure K.1
The set of non-nested longitudinal models that were compared in Study 2
Table K.1
An explanation of the non-nested models used in the longitudinal models
Model name Pathways in model
Stability (A) Synchronous correlations between errors of variables at the
same time and auto-lagged paths between same variables
over time
Causality (B) Stability + cross-lagged paths from „predictors‟ to „outcomes‟
over time
Reverse Causality (C) Stability + cross-lagged paths from „outcomes‟ to „predictors‟
over time
Reciprocal (D) Stability + Causality + Reverse causality models
Trimmed (E) Reciprocal model with trivial paths, β < .10 and p < .20
removed to show true non-zero pathways
Designation of time in the models
Time 1 „tm1‟ or „1‟
Time 2 „tm2‟ or „2‟
Time 3 „tm3‟ or „3‟
Notes on the SEM figures:
Double-headed arrows indicate correlations between the two variables
Single headed arrows indicate the direction of causal influence, from „cause‟
to „effect‟
„e‟ indicates the measurement error for the variable

511
Table K.2
The assessment of good fit and parsimony of the CFAs and the longitudinal models
Fit indices Range of good fit and parsimony
X2/df 1.00 – 3.00
CFA 0.95 – 1.00
RMSEA (point estimate) Perfect fit = .00; Close fit ≤ .05;
Reasonable fit between .05 and .08;
Mediocre fit between .08 and .10;
Poor fit ≥ .10
RMSEA (95% CI) Close fit if lower bound estimate < .05;
Reasonable fit if upper bound estimate < .08
Poor fit if upper bound estimate > .10
AIC Lowest estimate is most parsimonious model
ECVI Lowest estimate is model most likely to be replicated
in similar samples
Table K.3
Variables in Study 2, Longitudinal modelling
Factor label Latent Variable Indicator variables
IF Individual Factors Dispositional optimism
Coping self-efficacy
PWF Positive Workplace Factors Job autonomy
Skill discretion
Affective commitment
NSP Negative spillover Negative work-to-family spillover
Negative family-to-work spillover
OWB Overall well-being Life satisfaction
Psychological well-being
MI Mental Illness Depression
Anxiety
Stress
WWB Work Well-Being Work dedication
Work absorption
BURN Burnout Emotional exhaustion
Cynicism
Professional efficacy
WE Work Engagement Work dedication
Work absorption
Professional efficacy
Table K.4
Names of the models and the latent variables used in the CFAs
Model Label of latent factors in model Model Postscript
Well-Being IF, PWF, OWB, WWB wb
Mental Distress IF, PWF, NSP, MI, BURN mi
Well-Being-Mental Health IF, PWF, NSP, OWB, MI wbmh
Work Engagement IF, PWF, NSP, WE wa
Integrated IF, PWF, NSP, OWB, MI, WE cm