adapting to a challenging oil price environment in aberdeen
TRANSCRIPT
Adapting to a Challenging Oil Price Environment
in Aberdeen
Professor Alex Kemp
University of Aberdeen

0
100
200
300
400
500
600
700
800
1965 1970 1975 1980 1985 1990 1995 2000 2005
Millio
n B
arr
els
Oil E
qu
ivale
nt
Average Discovery Size on UKCS, 1965 - 2009

Average Discovery Size on UKCS, 1965 - 2005,
with Major Post-1974 Discoveries
0
100
200
300
400
500
600
700
800
900
1965 1970 1975 1980 1985 1990 1995 2000 2005
Millio
n B
arr
els
Oil E
qu
ivale
nt
Average Discovery Size
Major Post-1974 Discoveries
Source: DECC
0
10
20
30
40
50
60
70
80
90
1999 2000 2001 2002 2003 2004 2005 2006 2007 2008 2009 2010 2011 2012 2013 2014 2015
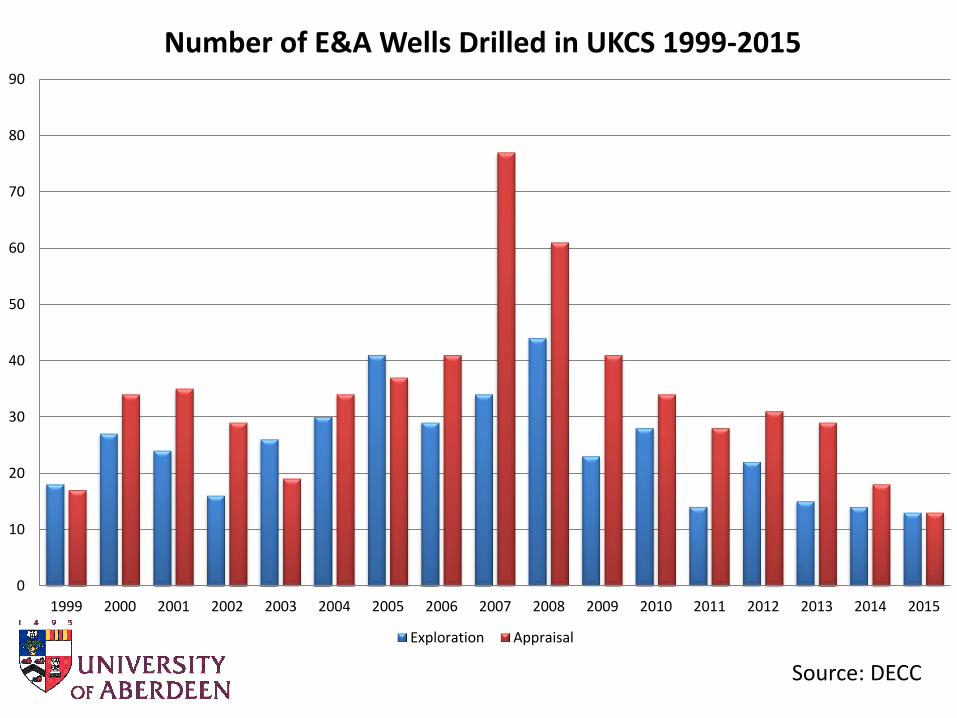
Number of E&A Wells Drilled in UKCS 1999-2015
Exploration Appraisal
Source: DECC
0
50
100
150
200
250
300
350
1999 2000 2001 2002 2003 2004 2005 2006 2007 2008 2009 2010 2011 2012 2013 2014 2015
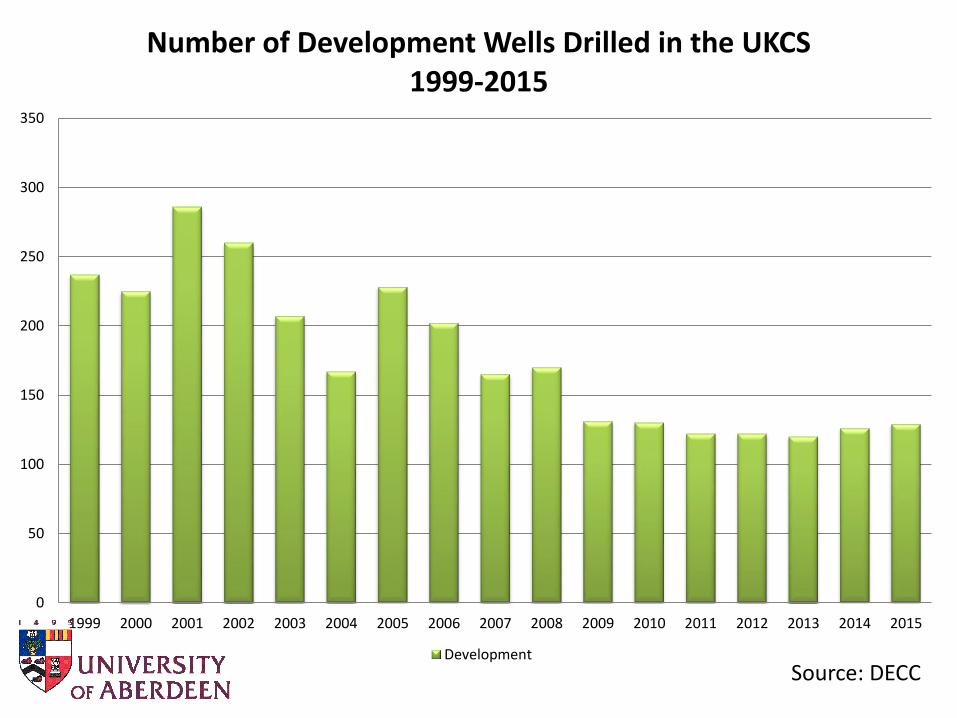
Number of Development Wells Drilled in the UKCS1999-2015
Development
0
500
1000
1500
2000
2500
3000
1970 1973 1976 1979 1982 1985 1988 1991 1994 1997 2000 2003 2006 2009 2012
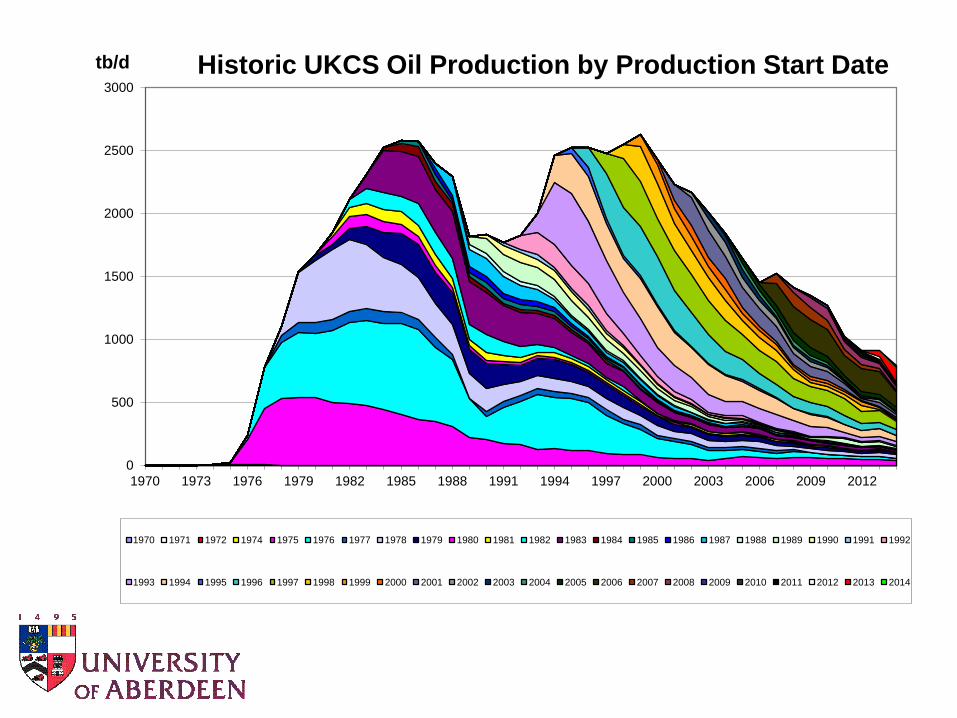
tb/d Historic UKCS Oil Production by Production Start Date
1970 1971 1972 1974 1975 1976 1977 1978 1979 1980 1981 1982 1983 1984 1985 1986 1987 1988 1989 1990 1991 1992
1993 1994 1995 1996 1997 1998 1999 2000 2001 2002 2003 2004 2005 2006 2007 2008 2009 2010 2011 2012 2013 2014
0
2000
4000
6000
8000
10000
12000
1970 1973 1976 1979 1982 1985 1988 1991 1994 1997 2000 2003 2006 2009 2012
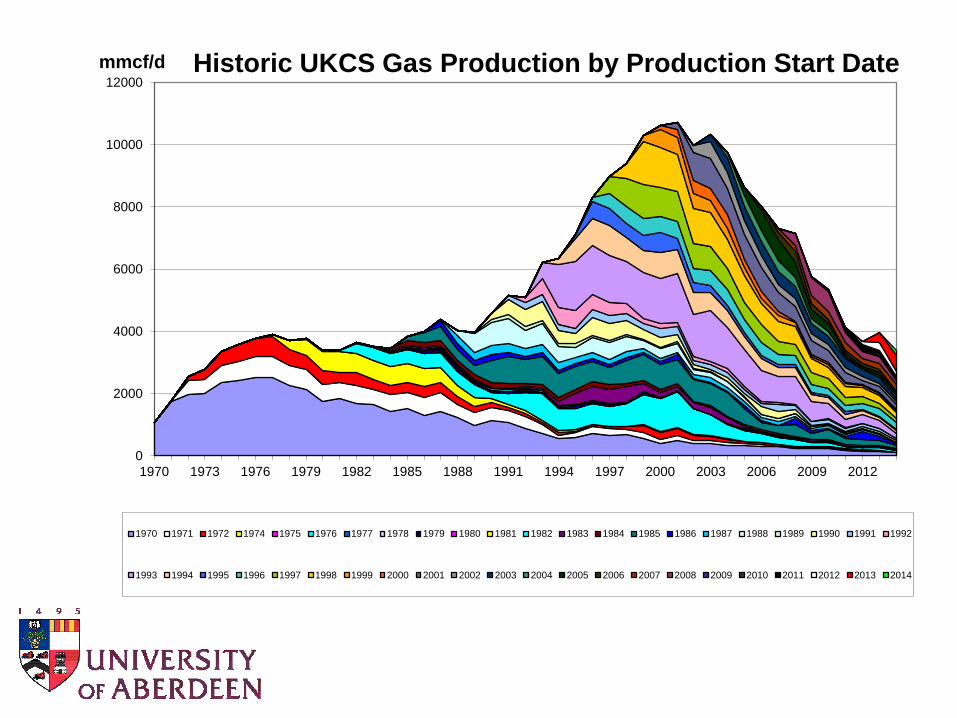
mmcf/d Historic UKCS Gas Production by Production Start Date
1970 1971 1972 1974 1975 1976 1977 1978 1979 1980 1981 1982 1983 1984 1985 1986 1987 1988 1989 1990 1991 1992
1993 1994 1995 1996 1997 1998 1999 2000 2001 2002 2003 2004 2005 2006 2007 2008 2009 2010 2011 2012 2013 2014
0
500
1000
1500
2000
2500
3000
3500
4000
4500
1970 1973 1976 1979 1982 1985 1988 1991 1994 1997 2000 2003 2006 2009 2012
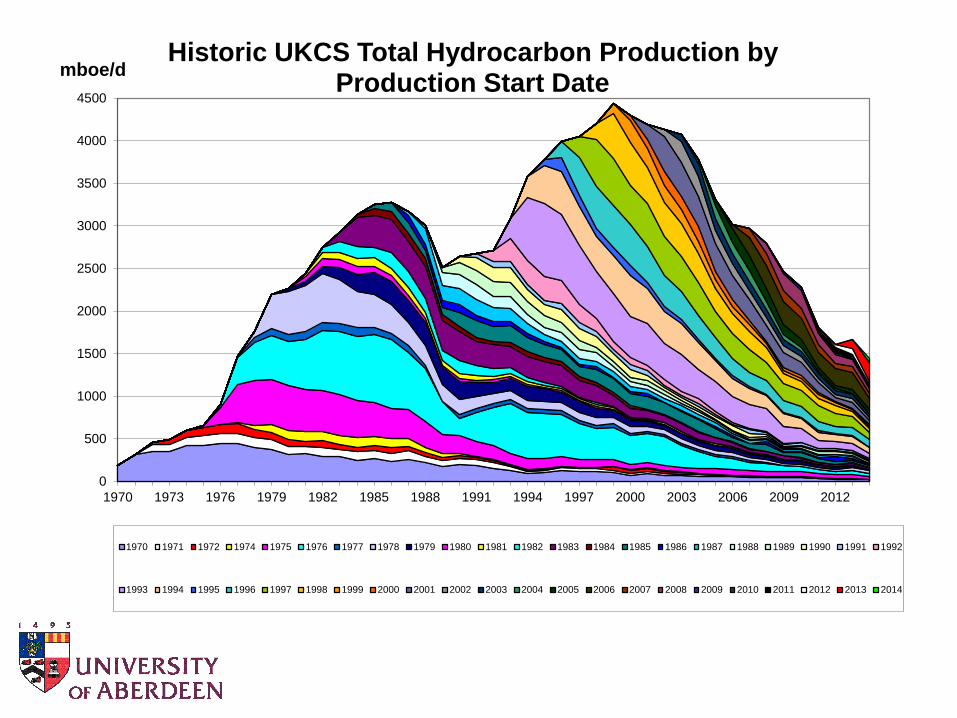
mboe/dHistoric UKCS Total Hydrocarbon Production by
Production Start Date
1970 1971 1972 1974 1975 1976 1977 1978 1979 1980 1981 1982 1983 1984 1985 1986 1987 1988 1989 1990 1991 1992
1993 1994 1995 1996 1997 1998 1999 2000 2001 2002 2003 2004 2005 2006 2007 2008 2009 2010 2011 2012 2013 2014
Source: DECC
Source: DECC

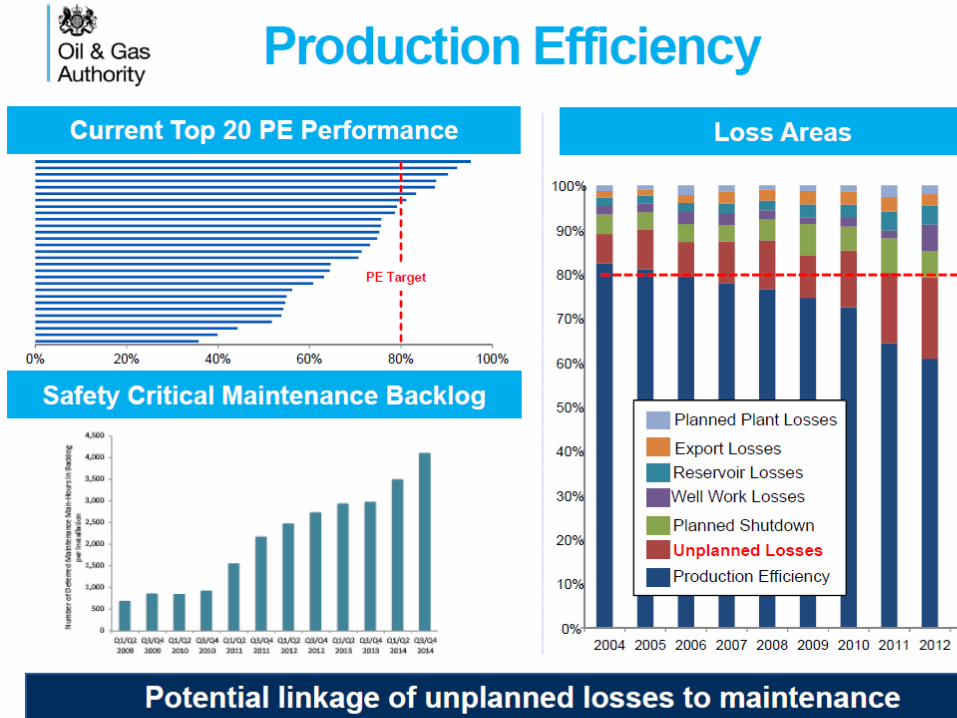
Production Efficiency
- Stability but little gain PE at UKCS level up v. slightly
on 2013
[“green shoots?”]
Production steady.
Some prior production
returned.
Crude price crash
0.00
0.50
1.00
1.50
2.00
2.50
3.00
3.50
4.00
0%
10%
20%
30%
40%
50%
60%
70%
80%
90%
2004 2005 2006 2007 2008 2009 2010 2011 2012 2013 2014
Pro
du
ctio
n M
illio
n b
oe
/d
Pro
du
ctio
n E
ffic
ien
cy
Production Efficiency Production
11Source: OGA
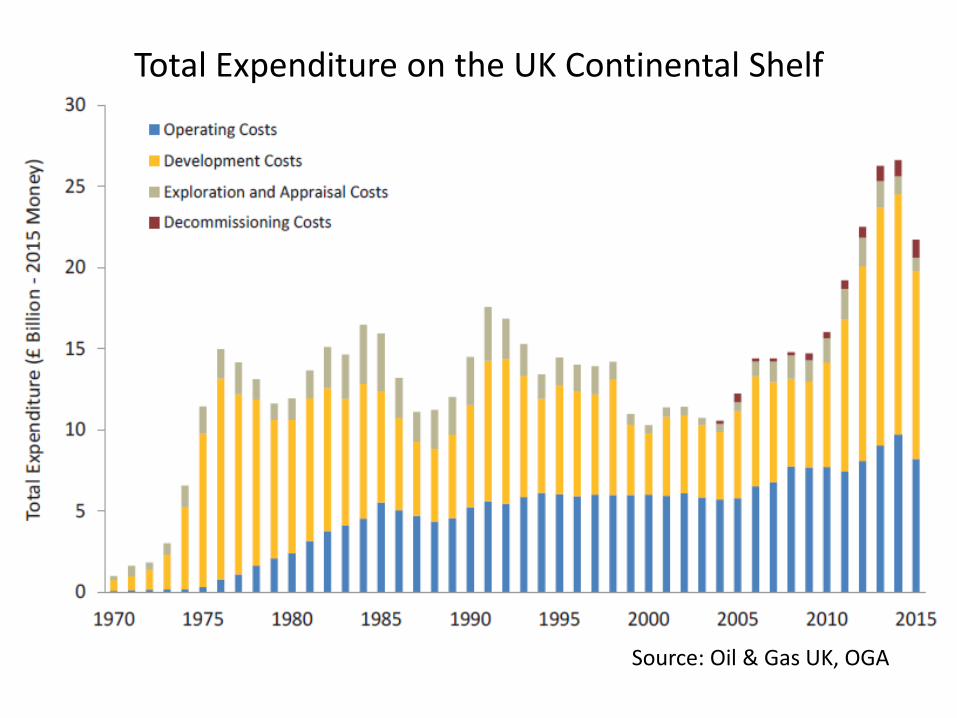
Total Expenditure on the UK Continental Shelf
Source: Oil & Gas UK, OGA
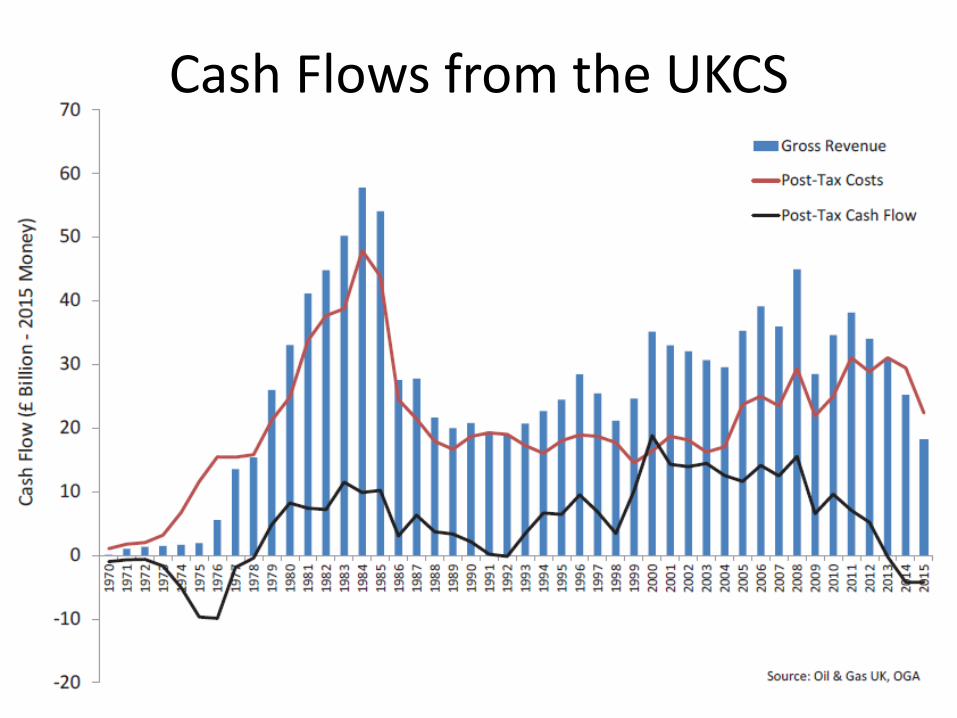
Cash Flows from the UKCS

Source: DECC
0
2
4
6
8
10
12
14
1996 1997 1998 1999 2000 2001 2002 2003 2004 2005 2006 2007 2008 2009 2010 2011 2012 2013 2014
Significant Discoveries
Significant Discoveries
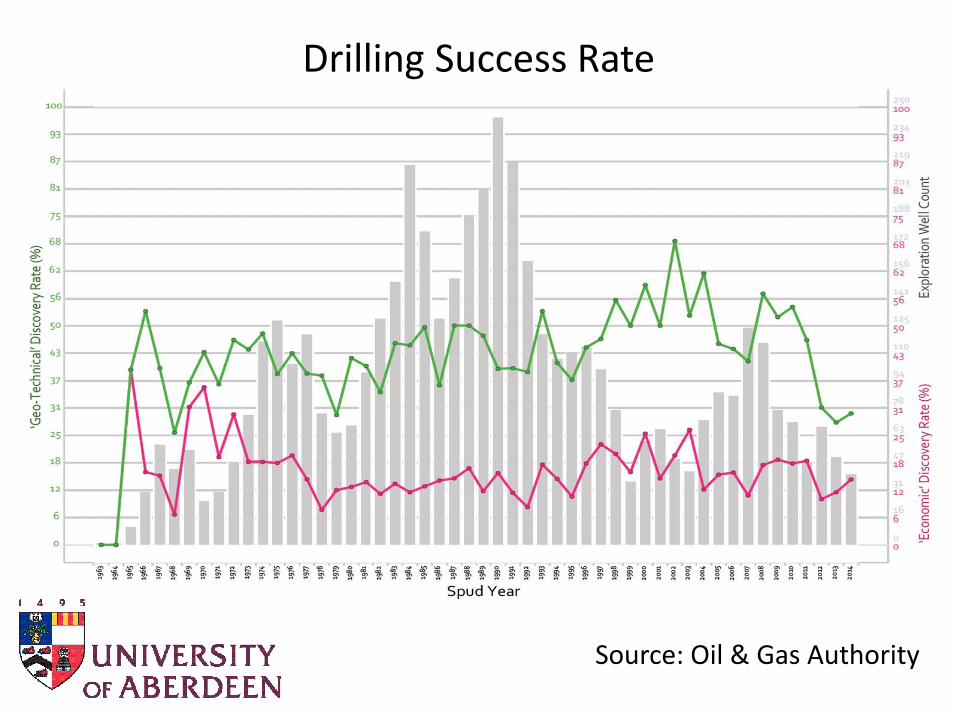
Drilling Success Rate
Source: Oil & Gas Authority


Budget 2015
• Basin-wide investment allowance to replace the existing offshore field allowances. Rate at 62.5% of investment expenditure from 1st
April 2015 onwards.
• Reduction in rate of SC to 20% from 1st
January 2015.
• Reduction in rate of PRT from 50% to 35% from 1st January 2016.
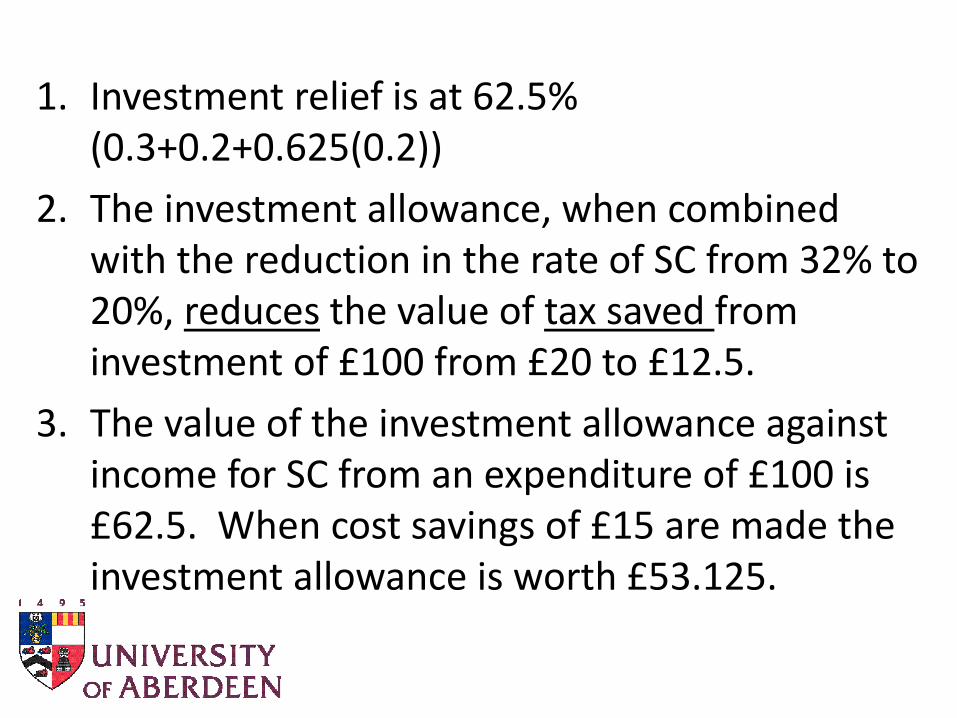
1. Investment relief is at 62.5% (0.3+0.2+0.625(0.2))
2. The investment allowance, when combined with the reduction in the rate of SC from 32% to 20%, reduces the value of tax saved from investment of £100 from £20 to £12.5.
3. The value of the investment allowance against income for SC from an expenditure of £100 is £62.5. When cost savings of £15 are made the investment allowance is worth £53.125.

$70, 45 pence Hurdle NPV/I > 0.32014 Tax System
Before Cost Reductions
0
5000
10000
15000
20000
25000
2014 2016 2018 2020 2022 2024 2026 2028 2030 2032 2034 2036 2038 2040 2042 2044 2046 2048 2050
Real 2014 £m
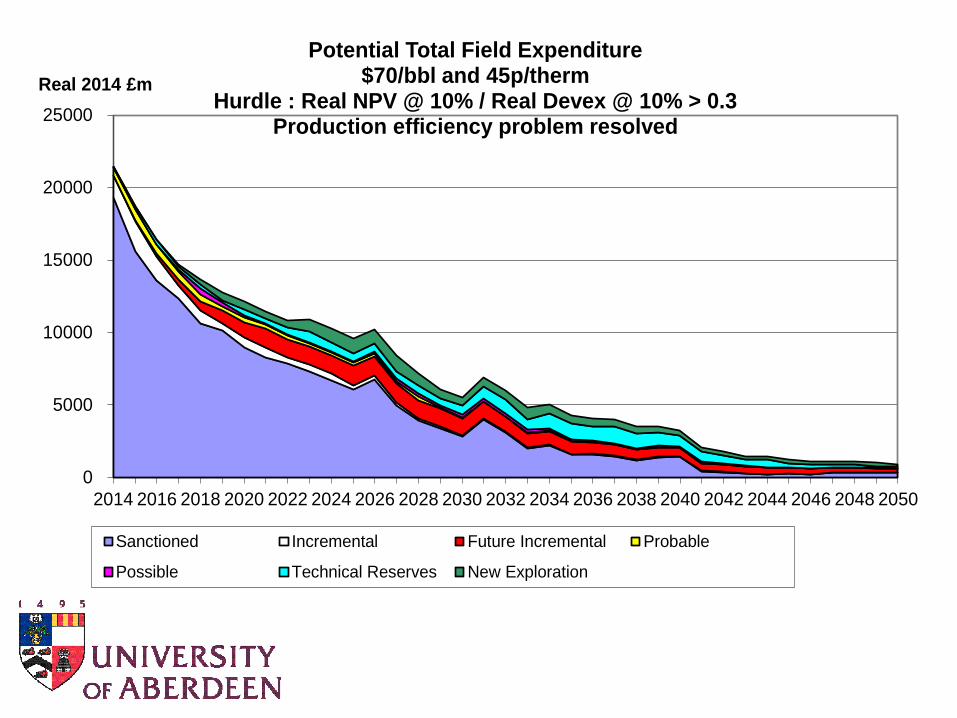
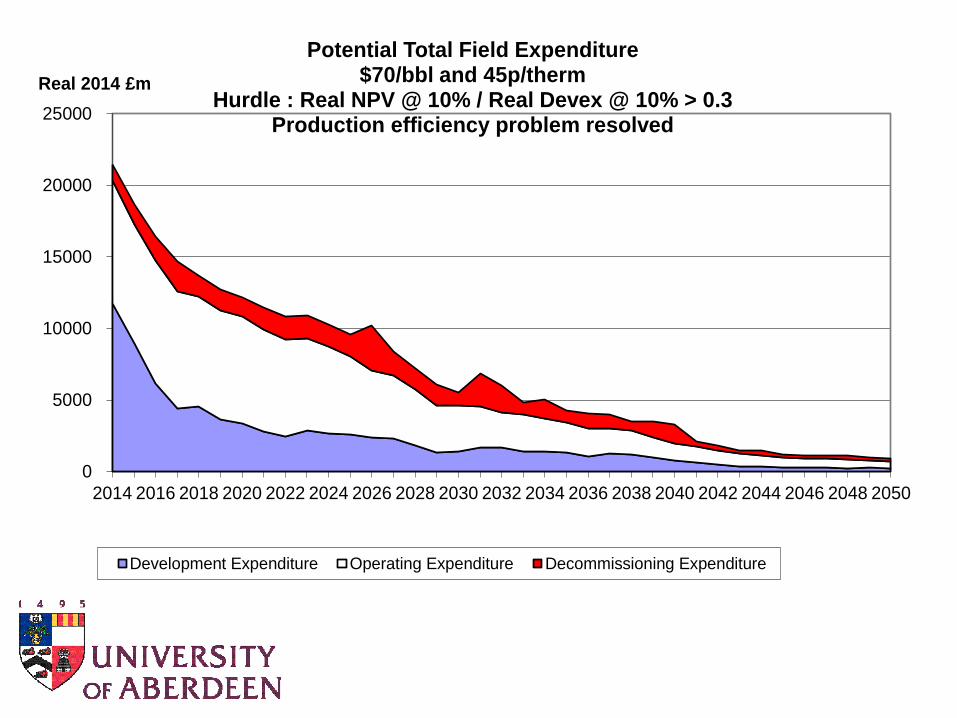
Potential Total Field Expenditure$70/bbl and 45p/therm
Hurdle : Real NPV @ 10% / Real Devex @ 10% > 0.3Production efficiency problem resolved
Sanctioned Incremental Future Incremental Probable
Possible Technical Reserves New Exploration
0
5000
10000
15000
20000
25000
2014 2016 2018 2020 2022 2024 2026 2028 2030 2032 2034 2036 2038 2040 2042 2044 2046 2048 2050
Real 2014 £m
Potential Total Field Expenditure$70/bbl and 45p/therm
Hurdle : Real NPV @ 10% / Real Devex @ 10% > 0.3Production efficiency problem resolved
Development Expenditure Operating Expenditure Decommissioning Expenditure


Cumulative Expenditures (£bn.2014)
Development 81.4
Operating 135.0
Decommissioning 41.8
TOTAL 258.2
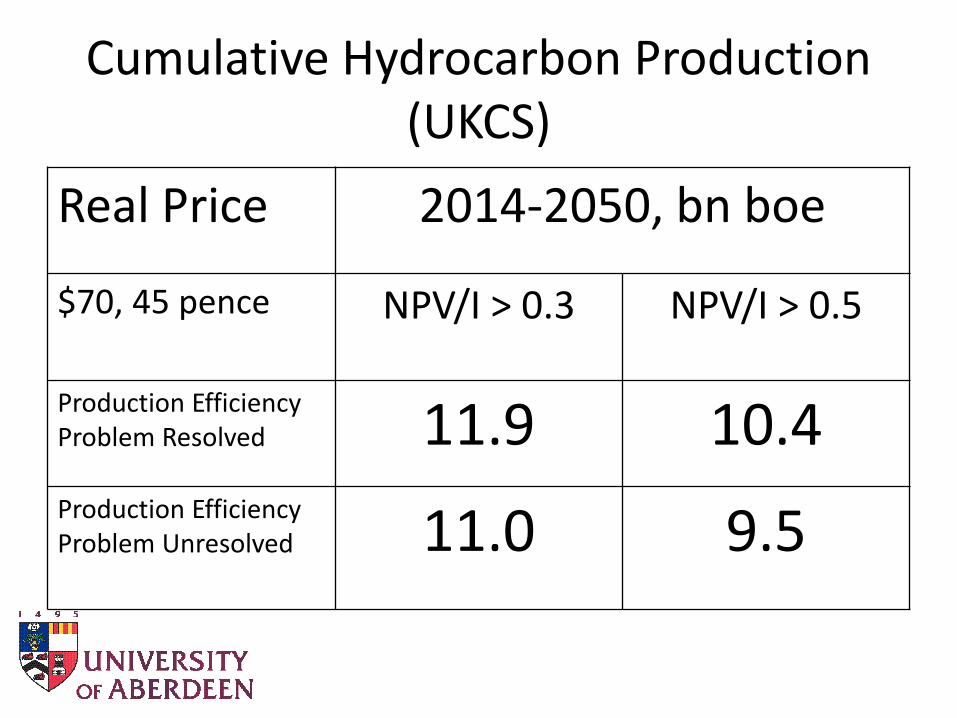
Cumulative Hydrocarbon Production (UKCS)
Real Price 2014-2050, bn boe
$70, 45 pence NPV/I > 0.3 NPV/I > 0.5
Production EfficiencyProblem Resolved 11.9 10.4Production EfficiencyProblem Unresolved 11.0 9.5
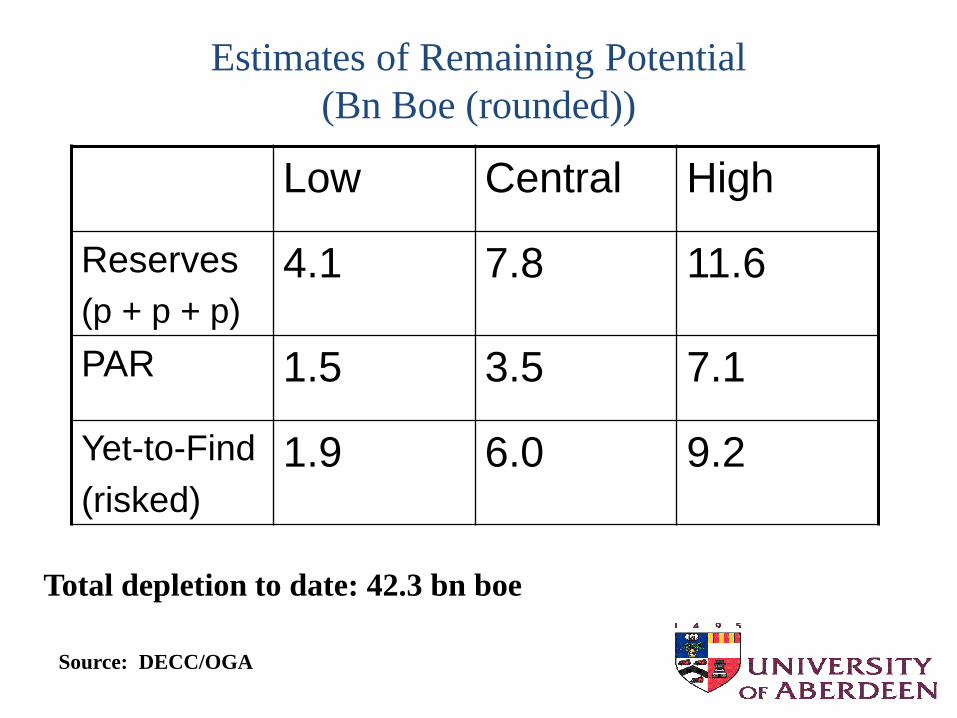
Estimates of Remaining Potential
(Bn Boe (rounded))
Total depletion to date: 42.3 bn boe
Source: DECC/OGA
Low Central High
Reserves
(p + p + p)
4.1 7.8 11.6
PAR 1.5 3.5 7.1
Yet-to-Find
(risked)
1.9 6.0 9.2

Source: Wood Mackenzie

Source: Oil & Gas UK
Daily Rig Rates Based on Reported Contract Awards for Mobile Drilling Units

Source: Wood Mackenzie
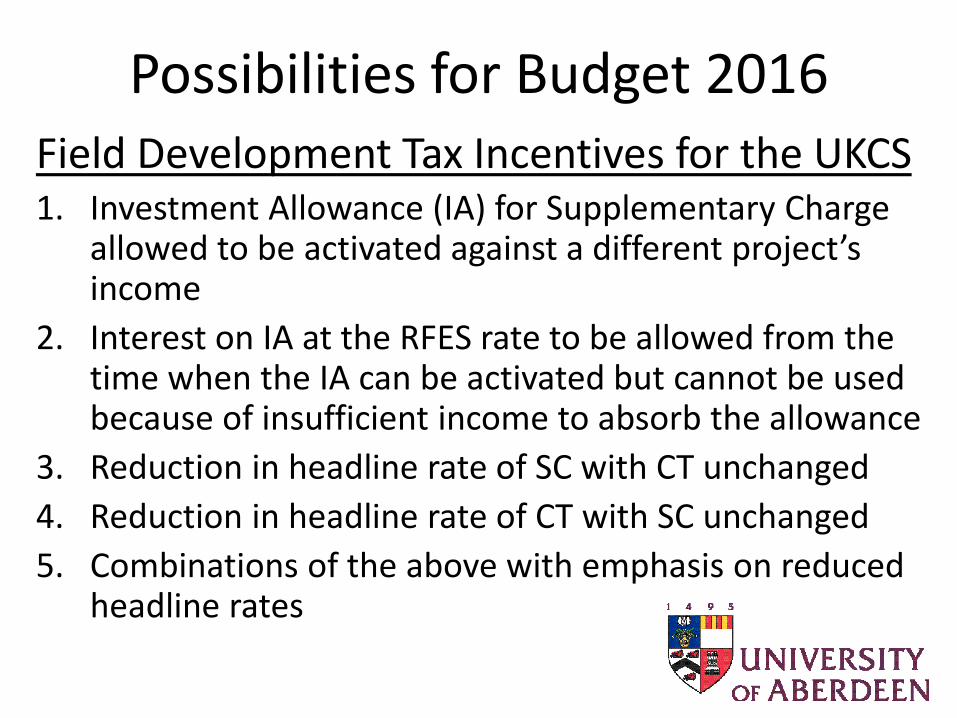
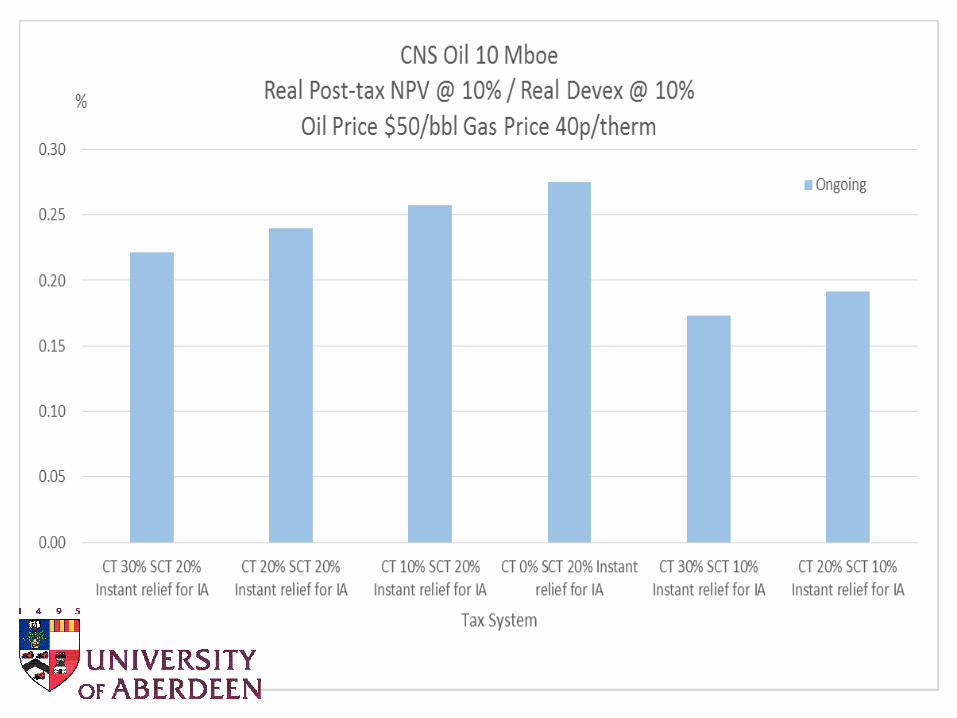
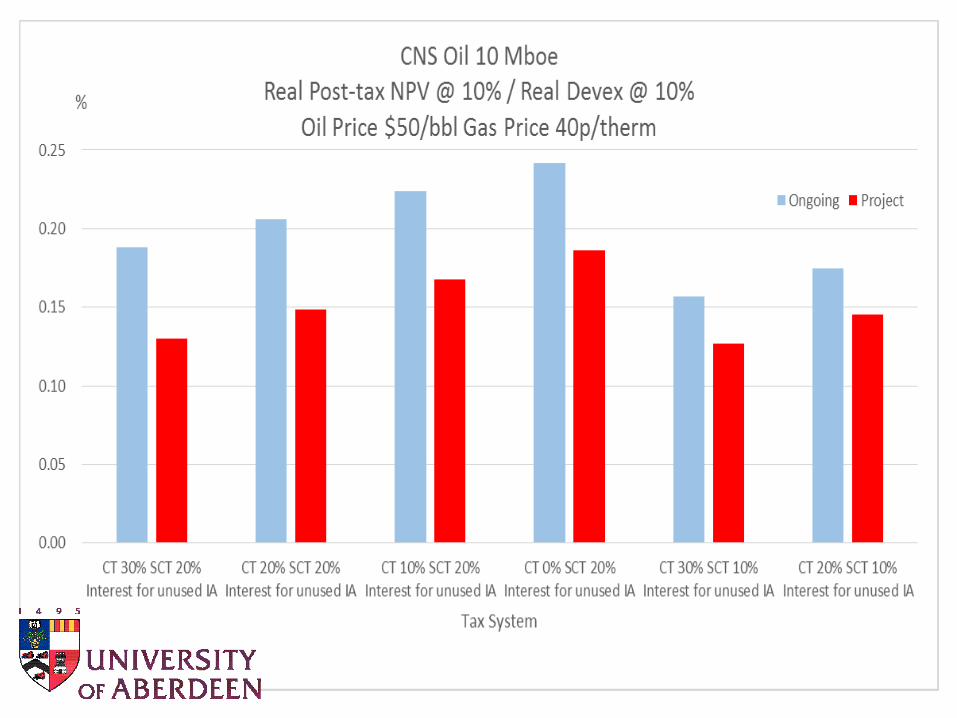
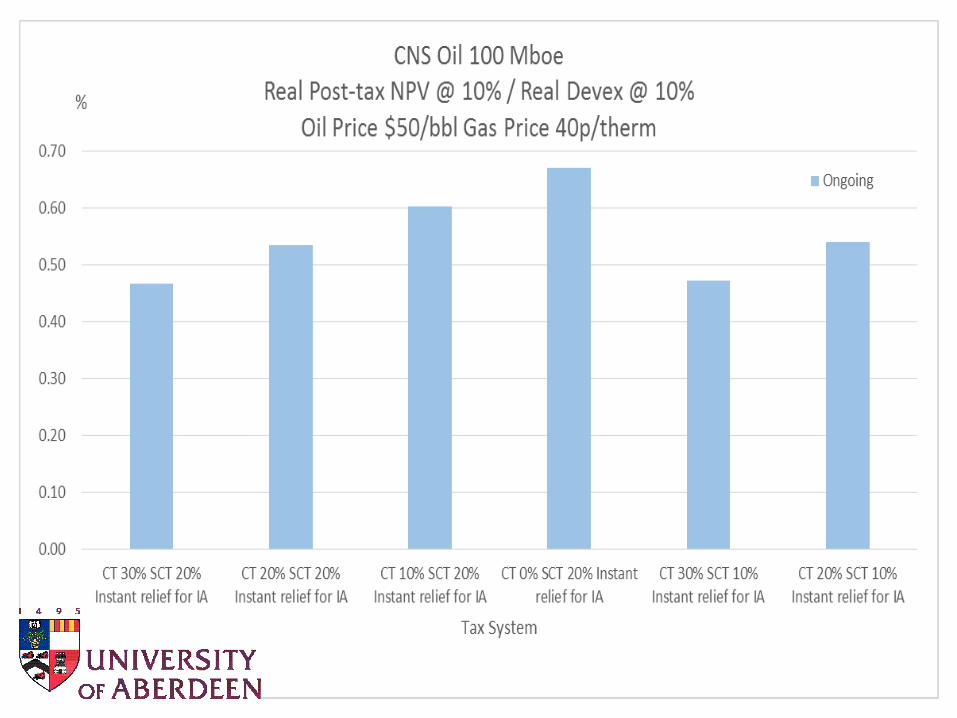
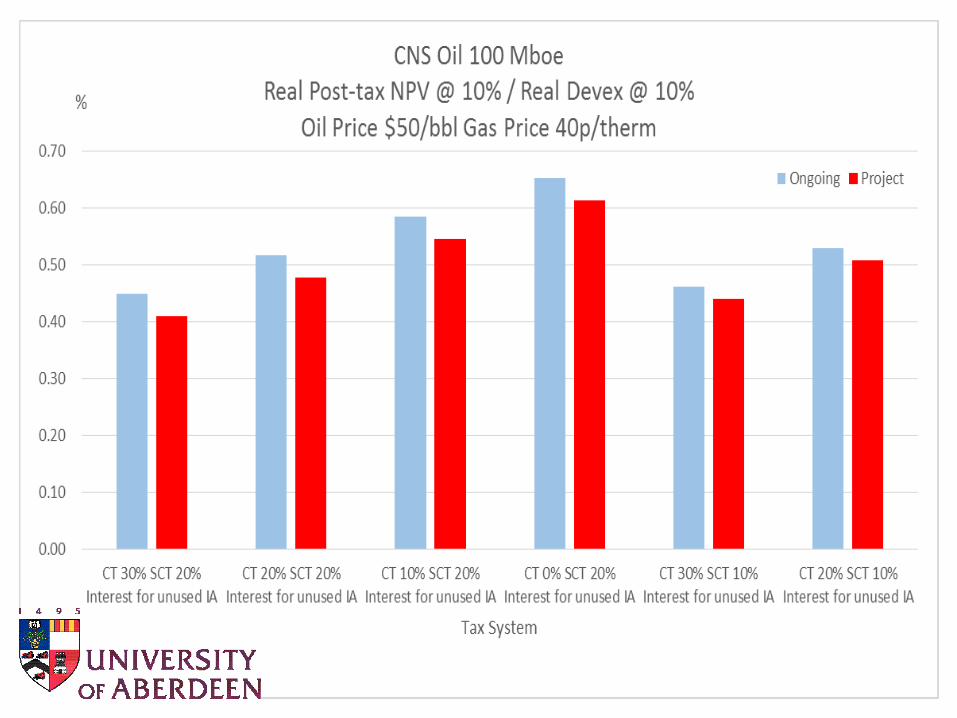
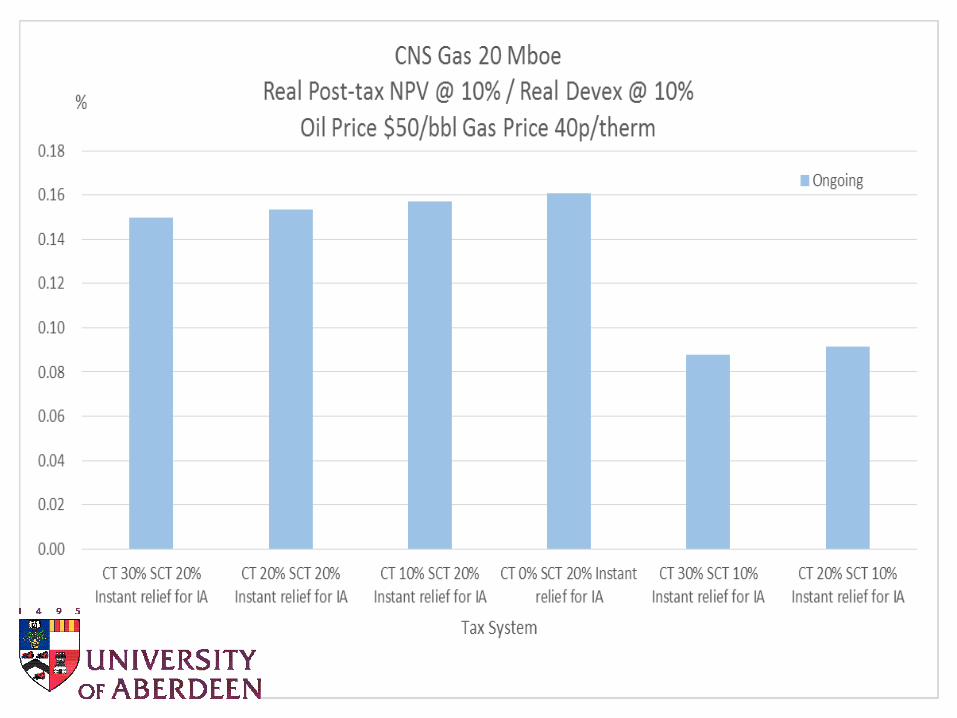
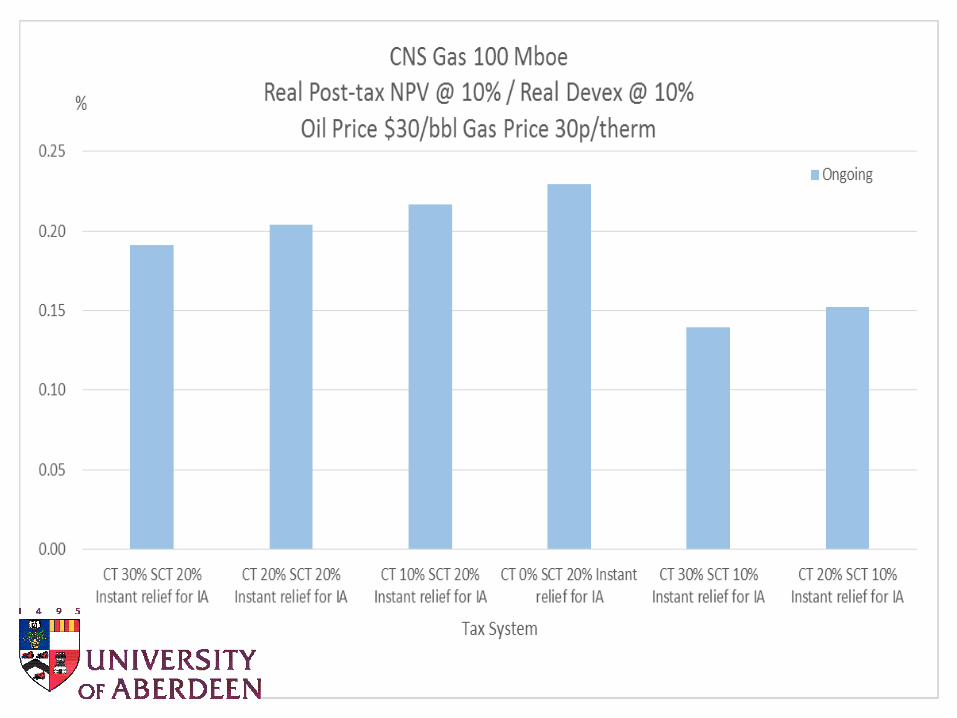
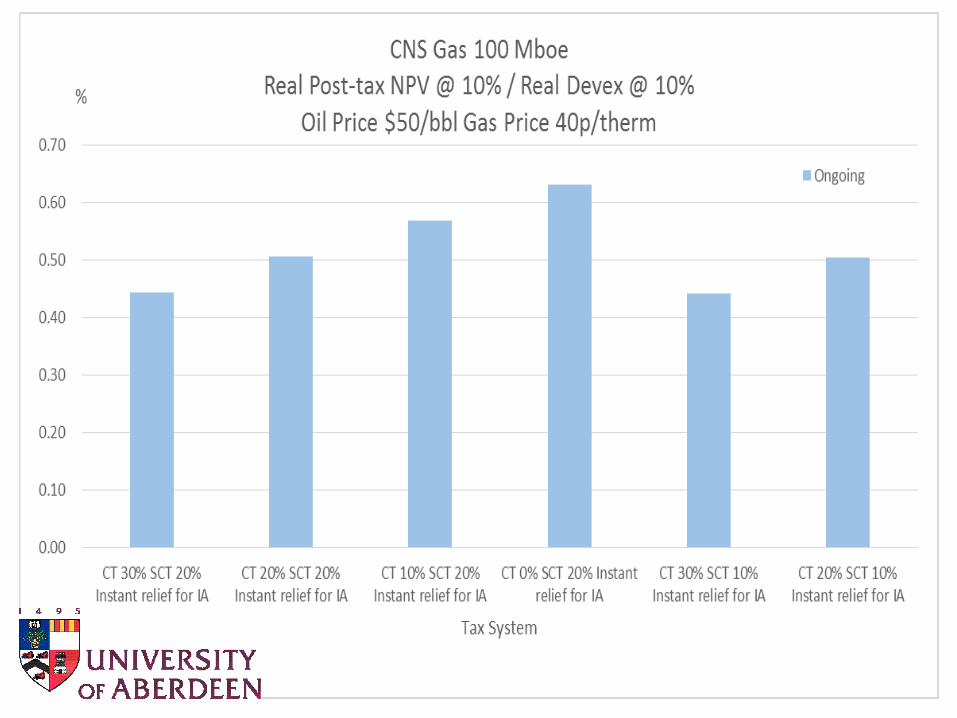
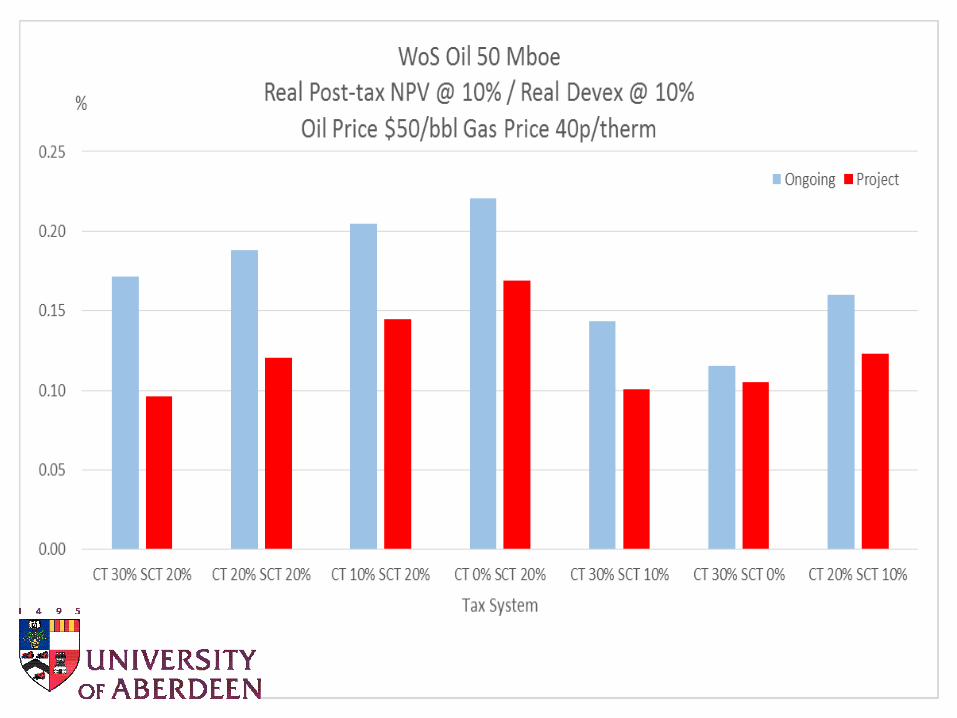
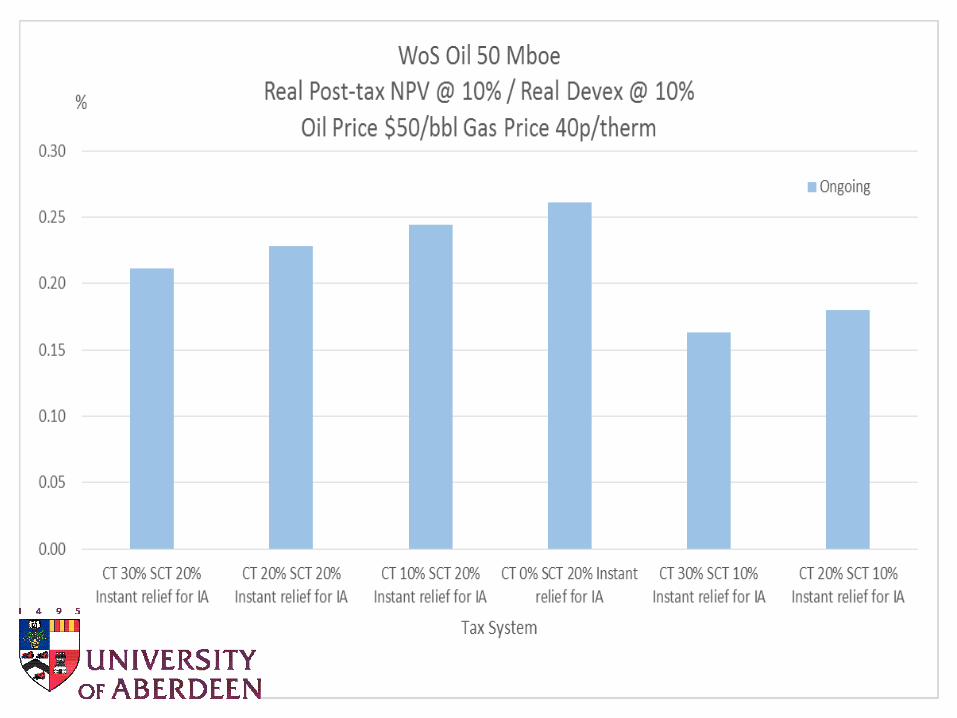
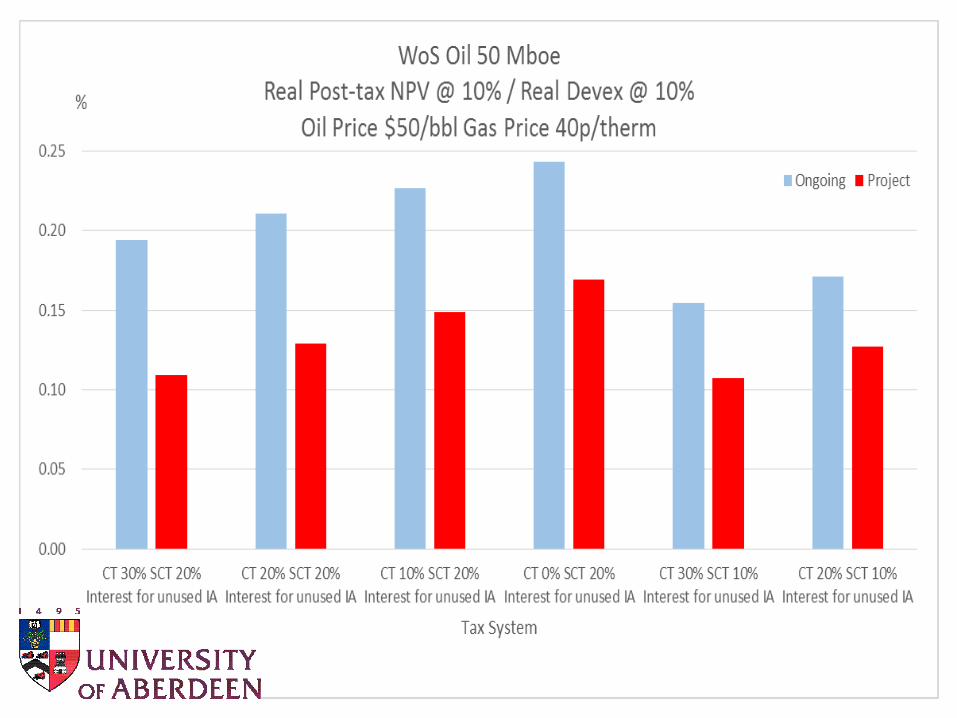
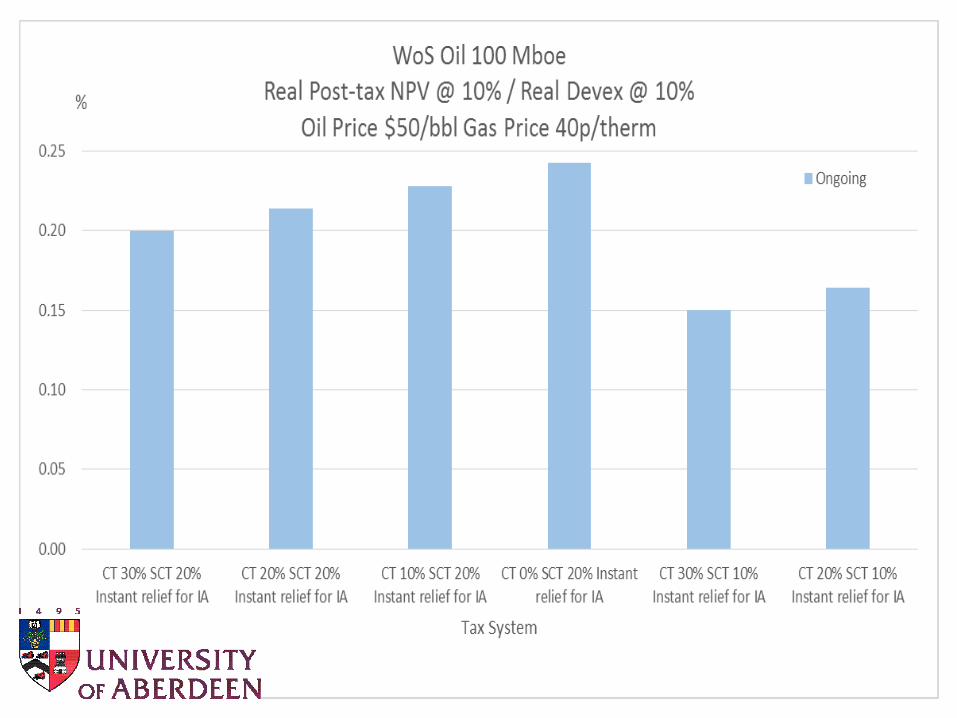
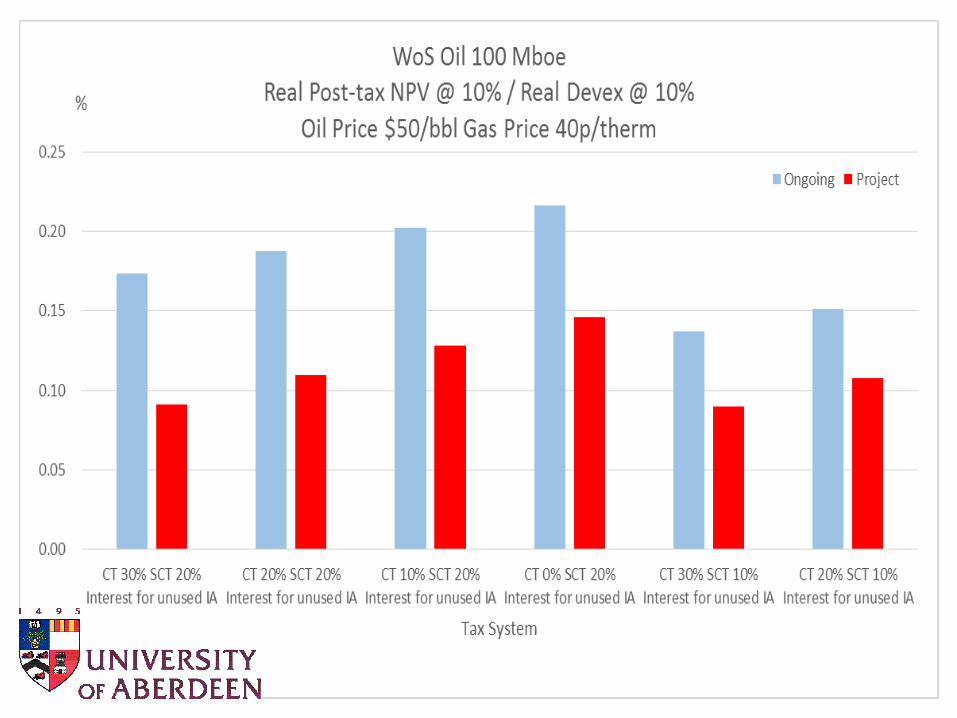
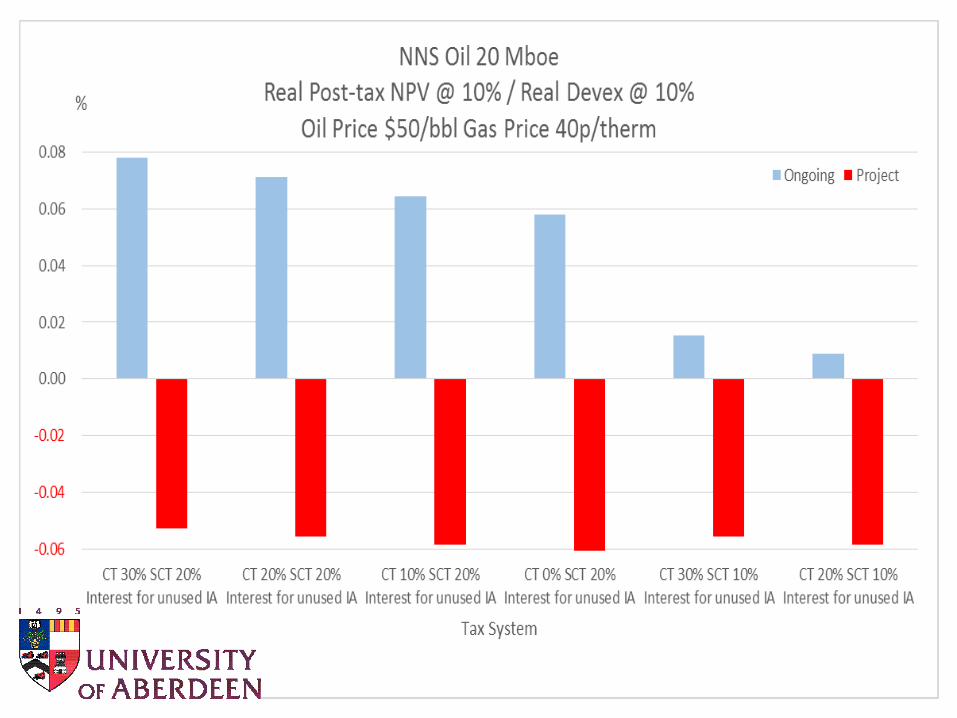
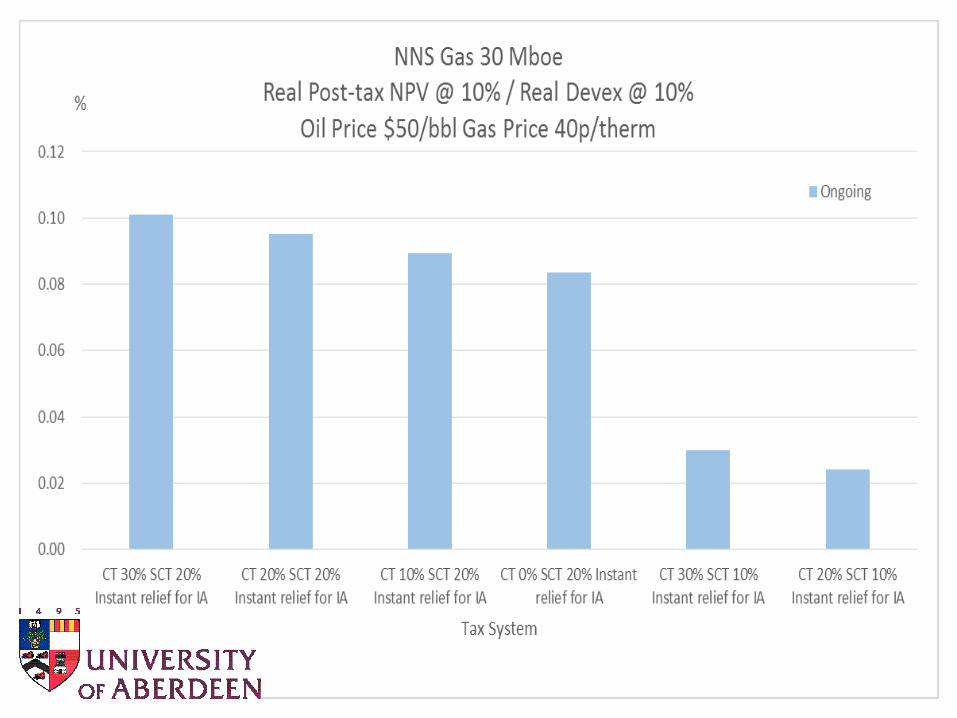
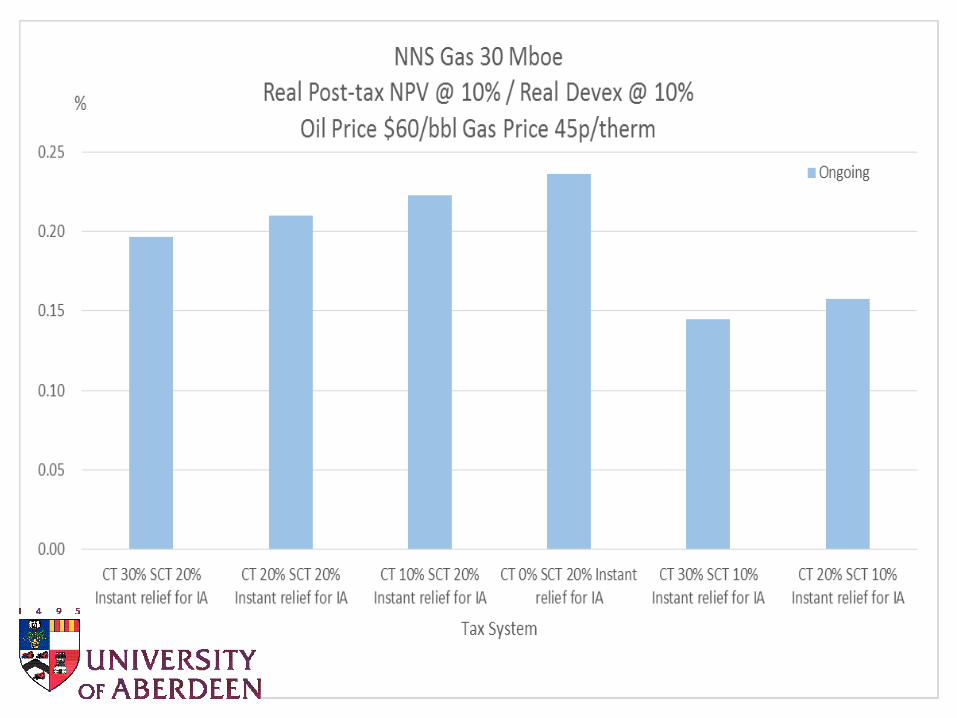
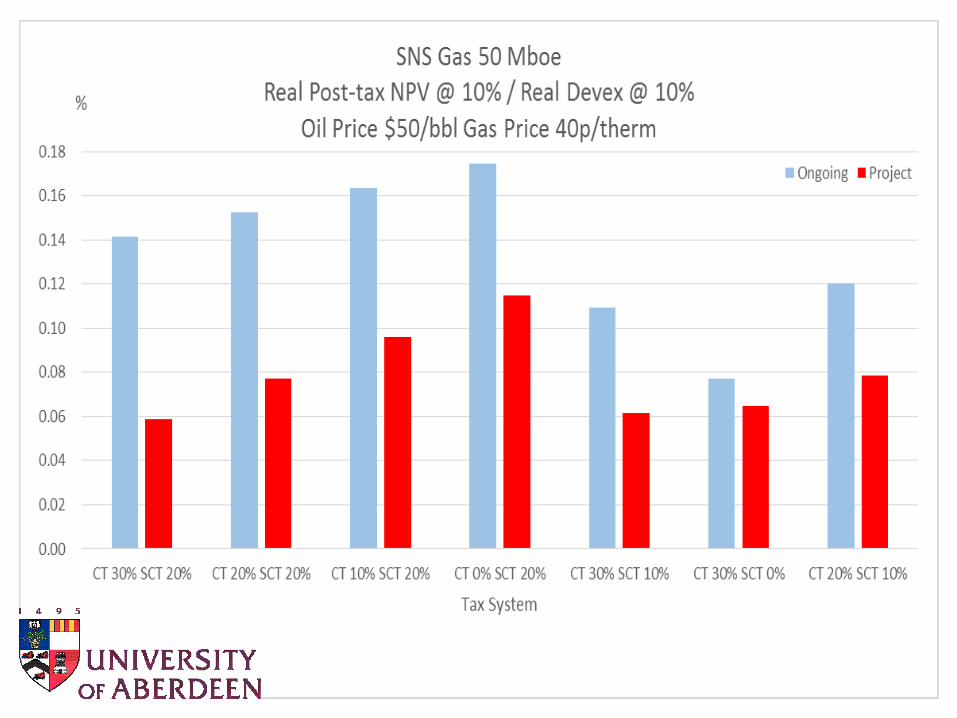
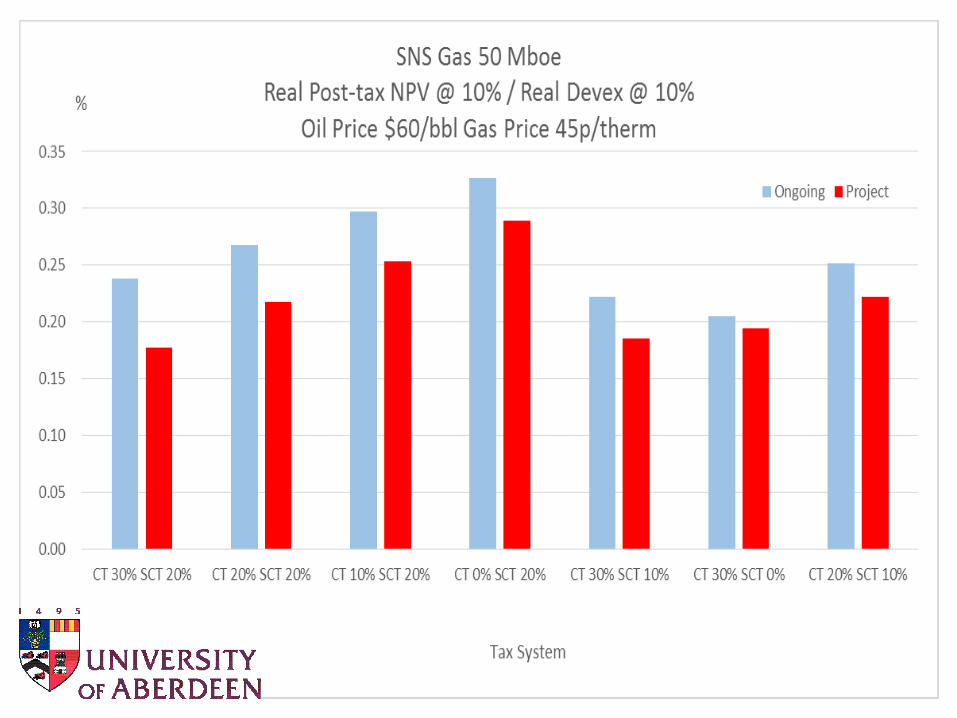
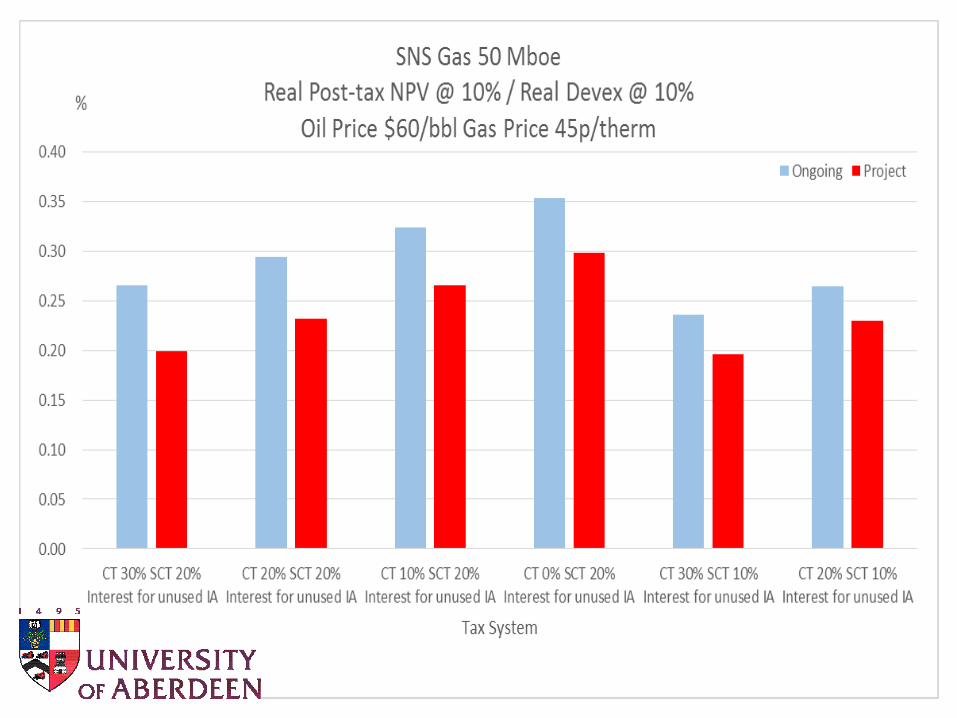
Possibilities for Budget 2016Field Development Tax Incentives for the UKCS1. Investment Allowance (IA) for Supplementary Charge
allowed to be activated against a different project’s income
2. Interest on IA at the RFES rate to be allowed from the time when the IA can be activated but cannot be used because of insufficient income to absorb the allowance
3. Reduction in headline rate of SC with CT unchanged
4. Reduction in headline rate of CT with SC unchanged
5. Combinations of the above with emphasis on reduced headline rates

-0.8
-0.6
-0.4
-0.2
0
0.2
0.4
10 Oil CNS 20 Oil CNS 30 Oil CNS 50 Oil CNS 100 OilCNS
20 GasCNS
100 GasCNS
50 OilWoS
100 OilWoS
100 GasWoS
10 Oil NNS20 Oil NNS50 Oil NNS 100 OilNNS
30 GasNNS
10 GasSNS
20 GasSNS
50 GasSNS
%
Real Pre-tax NPV @ 10% / Real Devex @ 10%Oil Price $30/bbl Gas Price 30p/therm
Real Pre-tax @ 10%/ Real Devex @ 10%

-0.6
-0.4
-0.2
0
0.2
0.4
0.6
0.8
1
1.2
1.4
1.6
1.8
10 Oil CNS20 Oil CNS30 Oil CNS50 Oil CNS 100 OilCNS
20 GasCNS
100 GasCNS
50 OilWoS
100 OilWoS
100 GasWoS
10 OilNNS
20 OilNNS
50 OilNNS
100 OilNNS
30 GasNNS
10 GasSNS
20 GasSNS
50 GasSNS
%
Real Pre-tax NPV @ 10% / Real Devex @ 10%Oil Price $50/bbl Gas Price 40p/therm
Real Pre-tax @ 10%/ Real Devex @ 10%

-0.5
0
0.5
1
1.5
2
2.5
10 Oil CNS20 Oil CNS30 Oil CNS50 Oil CNS 100 OilCNS
20 GasCNS
100 GasCNS
50 OilWoS
100 OilWoS
100 GasWoS
10 OilNNS
20 OilNNS
50 OilNNS
100 OilNNS
30 GasNNS
10 GasSNS
20 GasSNS
50 GasSNS
%
Real Pre-tax NPV @ 10% / Real Devex @ 10%Oil Price $60/bbl Gas Price 45p/therm
Real Pre-tax @ 10%/ Real Devex @ 10%


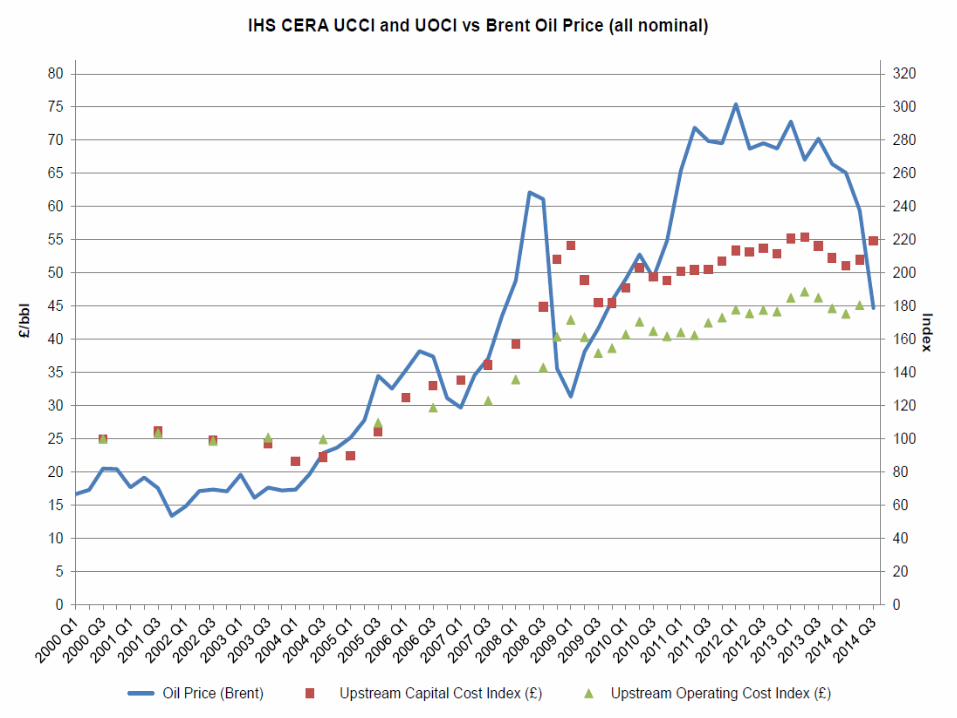
Conclusions1. Boom in period 2009-2014 concealed from the supply
chain emergence of problems in UKCS associated with maturity of the province. Serious cost inflation in that period added significantly to costs per boe. Collapse of oil price greatly exacerbated financial difficulties.
2. Remaining physical potential remains substantial.
3. At $30 or $35 price new field investments are generally uneconomic before tax.
4. At $50-$60 prices a combination of substantial cost reductions plus worthwhile tax reliefs can incentivise significant numbers of new field developments.