adaptation to sensory input tunes visual cortex to...
TRANSCRIPT

LETTERSPUBLISHED ONLINE: 22 JUNE 2015 | DOI: 10.1038/NPHYS3370
Adaptation to sensory input tunes visual cortexto criticalityWoodrow L. Shew1*, Wesley P. Clawson1, Je� Pobst2, Yahya Karimipanah2, Nathaniel C. Wright2
and Ralf Wessel2
A long-standing hypothesis at the interface of physics andneuroscience is that neural networks self-organize to thecritical point of a phase transition, thereby optimizing aspectsof sensory information processing1–3. This idea is partiallysupported by strong evidence for critical dynamics observedin the cerebral cortex4–10, but the impact of sensory input onthese dynamics is largely unknown. Thus, the foundationsof this hypothesis—the self-organization process and howit manifests during strong sensory input—remain unstudiedexperimentally. Here we show in visual cortex and in acomputational model that strong sensory input initially elicitscortical network dynamics that are not critical, but adaptivechanges in the network rapidly tune the system to criticality.This conclusion is based on observations of multifacetedscaling laws predicted to occur at criticality4,11. Our findingsestablish sensory adaptation as a self-organizing mechanismthat maintains criticality in visual cortex during sensoryinformation processing.
Sensory nervous systems adapt, dynamically tuning interactionsamong large networks of neurons, to cope with a changingenvironment12,13. The principles governing such adaptation at themacroscopic level of neuronal network dynamics are not wellunderstood. Computational models and theory suggest that suchadaptation can maintain critical network dynamics14–16, but theseprevious studies did not consider the strongly driven regime thatis expected during intense sensory input. Indeed, sufficiently stronginput may increase the overall excitability of a network by bringingneurons closer to their firing thresholds and potentially tippingthe network into a high firing rate regime that is inconsistentwith critical dynamics (Supplementary Information 1). Thus, thequestion remains: does strong sensory input drive cortical networkdynamics away from criticality or can adaptation counteract thistendency and maintain the critical regime?
Here we addressed this question in turtle visual cortex and ina companion computational model. In our experiments, we ob-tained long-duration recordings of population neural activity (localfield potential, LFP) using a microelectrode array inserted into thegeniculo-recipient dorsal cortex (visual cortex) of the turtle eye-attached whole-brain ex vivo preparation17 (Fig. 1a and Supple-mentary Information 2). We measured multi-scale spatiotemporalpatterns of neural activity while visually stimulating the retina. Sim-ilarly, in our model we studied changes in neural network activityin response to changes in external input. Experimentally, and in themodel, we assessedwhether themeasured dynamics were near or farfrom criticality. For this, we examined statistics and spatiotemporalscaling laws of ‘neuronal avalanches’, which are bouts of elevatedpopulation activity with correlations in space and time5 (Fig. 1b).
In brief, a neuronal avalanche is defined as a group of LFP peaks,occurring on any electrode, irrespective of location, and separatedby inter-peak intervals less than a specified time (Methods). Forexperiments in which spikes (that is, multiunit activity) were alsomeasurable, we confirmed that the rate of LFP peaks increases withthe rate of spikes (Supplementary Information 3). Thus, a period oftime with many LFP peaks—for example, a neuronal avalanche—reflects an increase in population spike rate in the cortex.
At the onset of stimulation, we observed that LFP amplitude,LFP peak rate, and avalanches were typically large scale—not con-sistent with critical dynamics—during a transient period (Fig. 1c–eand Supplementary Information 4). More specifically, avalanchesizes S and durations D were often bimodally distributed dur-ing the transient (Fig. 1f,g and Supplementary Information 5).Following this large-scale transient response, LFP amplitude de-creased and avalanches becamemore diverse in spatiotemporal scale(Fig. 1e), resulting in power-law distributions, P(S)∼ S−τ (Fig. 1f)and P(D)∼D−α (Fig. 1g) over a wide range of sizes and durations.This fact is supported by rigorousmaximum likelihood fittingmeth-ods10,18 and strict statistical criteria for fit quality (q>0.1, Methods).
These conclusions held for nine turtles and four types of visualstimuli (n=13 data sets; complex movies, static grey screen, diffuseflashes, moving dots) with power-law quality values q=0.31±0.13(mean ± s.d.). Importantly, the different visual stimuli had verydifferent spatiotemporal structure, yet all resulted in power-lawavalanche distributions. This indicates that the power laws were dueto inherent neuronal network dynamics rather than externally im-posed statistics of the stimulus. Notably, randomizing the recordedLFP peak times abolished the power-law distributions of avalanchesize and duration, thus demonstrating the importance of correla-tions, (Fig. 1f,g). Moreover, activity recorded outside visual cortexwas not power-law distributed (Supplementary Information 6).
What biophysical mechanisms could mediate self-organizationtowards scale-free population activity during visual processing?To address this question, we investigated a parsimonious modelnetwork of probabilistic integrate-and-fire neurons with all-to-allconnectivity6,19,20 (Fig. 2a). A subset of neurons (20%) wasinhibitory. Motivated by previous experiments21 and models14,we modelled adaptation as short-term synaptic depression withrecovery (Methods). However, our model differed from previouslystudied models, as detailed in Supplementary Information 7.We studied how the model dynamics and avalanche statisticschange as a result of increasing input rate. During a transientperiod after increasing the input rate, the population spike rateincreased and synapses depressed (Fig. 2b,c). During the transient,avalanches also increased markedly in size and duration (Fig. 2d),qualitatively similar to the experimental observations (Fig. 1e).
1Department of Physics, University of Arkansas, Fayetteville, Arkansas 72701, USA. 2Department of Physics, Washington University, St Louis,Missouri 63130, USA. *e-mail: [email protected]
NATURE PHYSICS | VOL 11 | AUGUST 2015 | www.nature.com/naturephysics 659
© 2015 Macmillan Publishers Limited. All rights reserved© 2015 Macmillan Publishers Limited. All rights reserved

LETTERS NATURE PHYSICS DOI: 10.1038/NPHYS3370
a
c
d
e
bM
irror
Movie
Lens
RetinaCorte
xMEA
1 s
0
500
Ava
lanc
he s
ize
LFP
peak
ra
te (H
z)
100 ms100 µV3 SD
−3 SD
Elec
trod
e
1
28
Avalanche duration (ms) = 17 42 67 75 163Avalanche size = 4 8 16 32 64
0
160
f g
10−5
10−1
Prob
abili
ty d
ensi
ty
100
10−2
2 × 10⁻²
101
Prob
abili
ty d
ensi
ty
Avalanche duration (s)Avalanche size 5003
Figure 1 | Visually driven network dynamics are power-law distributed after non-power-law transient. a, Ex vivo whole brain with eyes attached. Visualstimuli are projected onto the intact retina while activity is recorded with a 96-channel microelectrode array (MEA) inserted into the unfolded visualcortex. b, Avalanches are defined as spatiotemporal clusters of large amplitude LFP peaks (black dots). Five example avalanches are shown, with one dotper LFP peak. Avalanche size= number of LFP peaks; duration= time between the first and last peaks. SD, standard deviation. c, Natural movie visualstimulus (subset of 1 frame per 200 ms shown). d, At the start of the movie (green dashed line), there is a transient increase in stimulus-triggered averageLFP peak rate. The average is over 315 movie presentations. The grey region delineates quartiles. e, Stimulus-triggered avalanche size time series revealsthe tendency for very large avalanches during the transient response (red). Later, during the visually driven steady state, less extreme avalanches occur(blue). Each point represents one avalanche. The line following each point indicates avalanche duration. Responses to 315 repeats of movie stimulation areoverlaid. f,g, Probability density functions for sizes and durations of avalanches during the transient response (red line) and during the visually drivensteady state (light and dark blue dots). Large avalanches (arrow) occur during the transient response, yielding bimodal distributions of avalanche sizes anddurations. Avalanches during the visually driven steady state are power-law distributed over the range indicated with dark blue dots. Grey shadingindicates the range (0.05–0.95) of expected probabilities for a perfect power law with the same number of samples as the experiment. Jittering the timesof LFP peaks destroys the power law (dashed line) by abolishing large-sized avalanches. Panels d–g are from one experiment with one turtle.
Avalanche size and duration distributions during the transientperiod exhibited a distinct bimodal character consisting of smalland large avalanches (Fig. 2e,f), qualitatively similar to what wefound experimentally (Fig. 1f,g) and inconsistent with a power law.Following the transient jump in population activity, the network
dynamically reached a new steady state of population activity andaverage synaptic strength (Fig. 2b,c). In this driven steady state,during continued high external input rate, the simulated neuronalavalanche size and duration distributions were power laws (q>0.1)(Fig. 2e,f and Supplementary Information 7). We note that the
660 NATURE PHYSICS | VOL 11 | AUGUST 2015 | www.nature.com/naturephysics
© 2015 Macmillan Publishers Limited. All rights reserved© 2015 Macmillan Publishers Limited. All rights reserved
NATURE PHYSICS DOI: 10.1038/NPHYS3370 LETTERSa
b
c
d
e f
Prob
abili
ty d
ensi
ty
Prob
abili
ty d
ensi
ty
Avalanche size Avalanche (timesteps)1,000 902
10−510−4
2
2 × 10⁻¹ 3 × 10⁻¹
0
2,000
200 timesteps
150
2/N
8/N
CTXspikes per
timestep
Avalanchesize
CTXsynaptic
weight
Inputsynapticweight
1.1/N
0.9/N
0
100 Inputspikes pertimestep0
CTX
Synapticdepression
Input
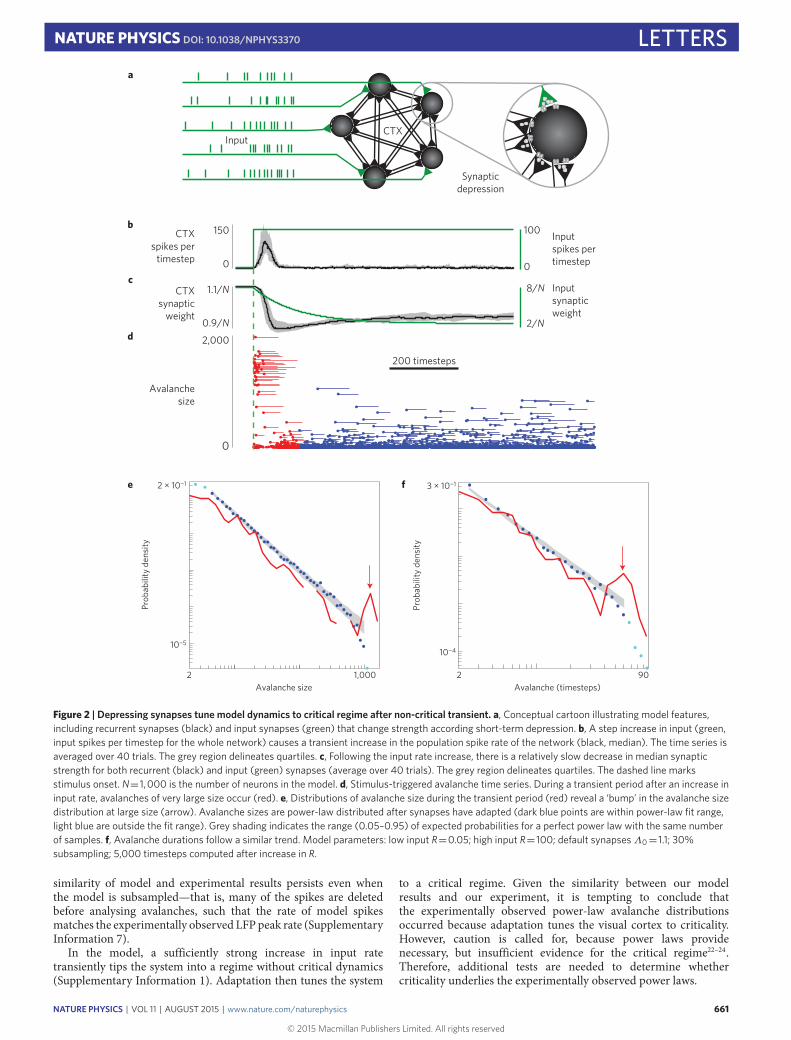
Figure 2 | Depressing synapses tune model dynamics to critical regime after non-critical transient. a, Conceptual cartoon illustrating model features,including recurrent synapses (black) and input synapses (green) that change strength according short-term depression. b, A step increase in input (green,input spikes per timestep for the whole network) causes a transient increase in the population spike rate of the network (black, median). The time series isaveraged over 40 trials. The grey region delineates quartiles. c, Following the input rate increase, there is a relatively slow decrease in median synapticstrength for both recurrent (black) and input (green) synapses (average over 40 trials). The grey region delineates quartiles. The dashed line marksstimulus onset. N= 1,000 is the number of neurons in the model. d, Stimulus-triggered avalanche time series. During a transient period after an increase ininput rate, avalanches of very large size occur (red). e, Distributions of avalanche size during the transient period (red) reveal a ‘bump’ in the avalanche sizedistribution at large size (arrow). Avalanche sizes are power-law distributed after synapses have adapted (dark blue points are within power-law fit range,light blue are outside the fit range). Grey shading indicates the range (0.05–0.95) of expected probabilities for a perfect power law with the same numberof samples. f, Avalanche durations follow a similar trend. Model parameters: low input R=0.05; high input R= 100; default synapsesΛ0= 1.1; 30%subsampling; 5,000 timesteps computed after increase in R.
similarity of model and experimental results persists even whenthe model is subsampled—that is, many of the spikes are deletedbefore analysing avalanches, such that the rate of model spikesmatches the experimentally observed LFP peak rate (SupplementaryInformation 7).
In the model, a sufficiently strong increase in input ratetransiently tips the system into a regime without critical dynamics(Supplementary Information 1). Adaptation then tunes the system
to a critical regime. Given the similarity between our modelresults and our experiment, it is tempting to conclude thatthe experimentally observed power-law avalanche distributionsoccurred because adaptation tunes the visual cortex to criticality.However, caution is called for, because power laws providenecessary, but insufficient evidence for the critical regime22–24.Therefore, additional tests are needed to determine whethercriticality underlies the experimentally observed power laws.
NATURE PHYSICS | VOL 11 | AUGUST 2015 | www.nature.com/naturephysics 661
© 2015 Macmillan Publishers Limited. All rights reserved© 2015 Macmillan Publishers Limited. All rights reserved

LETTERS NATURE PHYSICS DOI: 10.1038/NPHYS3370
a d
c
e
f
1.21.1
1.21.1
1.3 1.8
1.81.3
Experiment Model
b
2.81.81.6
2.6
α
τ
Perfectprediction
Perfectprediction
Fit β Fit β
Pred
icte
d β
Pred
icte
d β
2.2
1.5 2.51.2
1003010
1.101.001.05
Sub%
Input R0.02 0.10 0.10
α
τ
0Λ
200
2
Ava
lanc
he s
ize
Slope β
0.01 0.9Avalanche duration (s)
2 200
FitPrediction
1,000
2
Ava
lanc
he s
ize
Avalanche duration (steps)
Figure 3 | Steady state visually driven avalanches follow predictions for critical regime. a, Each point indicates the size and duration of one avalanche(from one experiment, one turtle, as in Fig. 1). Avalanches from the visually driven steady state are shown. The linear relationship on logarithmic axesreveals a power-law relationship between avalanche size and duration, as predicted by criticality theory: S∼Dβ . The slope of the best-fit line (red) matcheswith the predicted β=(α− 1)/(τ− 1) (yellow). b, In di�erent experiments, di�erent values were found for duration exponents α and size exponents τ .c, Di�erent best-fit β were found for di�erent turtles. Predicted β matched the best-fit β in the visually driven steady state. The line indicates an identicalmatch. d–f, Computational model exhibits the same relationship among power-law exponents as found experimentally. Di�erent size and durationexponents (e) were obtained by varying the input rate R, the degree of subsampling, and default synapse strengthsΛ0 (see inset legend).
Two such tests arise from a particular relationship betweenthe size and duration of avalanches, which is predicted to occurat criticality4,11 and confirmed by our model (Fig. 3d–f andSupplementary Information 1 and 7). First, the average avalanchesize increases with duration according to a specific function S∼Dβ .Second, the exponent β is predicted to depend on the exponents τand α as β=(α−1)/(τ−1).
Our experiments confirmed both these predictions (Fig. 3a–c).In addition, we confirmed a third prediction based on empiricallyestimated branching parameters25 in Supplementary Information 8.First, we showed that avalanche size scales with duration according
to a power law (Fig. 3a). Second, we determined the ‘best-fit β ’from the size versus duration data for each experiment (Fig. 3a).Next we computed the ‘predicted β ’ using the observed exponents τand α. For different turtles and different visual stimuli, we obtaineda range of exponents; 1.7< τ < 2.6 and 1.8< α < 2.8 (Fig. 3b).Importantly, the observed values of τ and α provided a goodprediction, β=(α−1)/(τ−1), of the best-fit β for all experiments(Fig. 3c and Supplementary Information 5).
The experimentally observed range of the values for theexponents τ and α (Fig. 3b) raises an important question as to theorigin of this variability. In the model, we demonstrated that τ and
662 NATURE PHYSICS | VOL 11 | AUGUST 2015 | www.nature.com/naturephysics
© 2015 Macmillan Publishers Limited. All rights reserved© 2015 Macmillan Publishers Limited. All rights reserved

NATURE PHYSICS DOI: 10.1038/NPHYS3370 LETTERSα depended on three factors (Fig. 3e): the subsample fraction, theexternal input rate, and the default synaptic strength (parameterizedby the largest eigenvalueΛ0 of the default synaptic weight matrix26,see Supplementary Information 7). Subsampling—that is, creatingavalanche distributions based on spikes from a subset of all modelneurons—tended to increase τ and α, consistent with previousstudies25,27. The effects of input rate and default synapse strengthsdepended on the level of subsampling. Importantly, the variouscombinations of τ and α observed in the model preserve thesize versus duration scaling relationship (Fig. 3f), similar to whatwe found experimentally (Fig. 3c). We note that the near-linearrelationship between τ and α (Fig. 3b,e) has not, to our knowledge,been predicted theoretically.
The close match between our experimental observations andour model results suggests that adaptation plays a crucial role intuning cortical circuits towards the critical regime during vision.Why should adaptation in sensory cortex tune the network tooperate near a critical regime? Previous computational studies andcortex slice experiments suggest that the critical regime optimizesseveral aspects of information processing (reviewed in ref. 3),including dynamic range20,26,28 and information transmission5,6.Our observation that transient response to stimulus onset isnot critical suggests that sensory cortex dynamically adapts togain the functional benefits of critical dynamics during strongsensory input.
The critical regime has long been hypothesized to be a target ofhomeostatic processes in neural networks. This could be achievedby some ‘top-down’ mechanism (for example, neuromodulatorssuch as dopamine29) that tunes the network or as the result oflocal self-organization14,16,30,31. In either case, one concern with thishypothesis has been that, theoretically, the critical regime occupiesan infinitesimal volume in state space (the boundary between twodifferent regimes), which may be too small a target to hit for a realbiological tuning process contending with noise and imperfections.Recent theoretical findings mitigate this concern, showing thatin networks with complex structure, the critical regime expands,occupying a substantial region (Griffiths phase) in state space32.Thus, our experiments, together with previous theory, establish thecritical regime as a viable target for adaptive self-tuning duringcortical sensory information processing.
MethodsMethods and any associated references are available in the onlineversion of the paper.
Received 20 August 2014; accepted 19 May 2015;published online 22 June 2015
References1. Plenz, D., Niebur, E. & Schuster, H. G. Criticality in Neural Systems
(Wiley, 2014).2. Beggs, J. M. The criticality hypothesis: How local cortical networks might
optimize information processing. Phil. Trans. R. Soc. A 366, 329–343 (2008).3. Shew, W. L. & Plenz, D. The functional benefits of criticality in the cortex.
Neuroscientist 19, 88–100 (2013).4. Friedman, N. et al. Universal critical dynamics in high resolution neuronal
avalanche data. Phys. Rev. Lett. 108, 1–5 (2012).5. Beggs, J. M. & Plenz, D. Neuronal avalanches in neocortical circuits. J. Neurosci.
23, 11167–11177 (2003).6. Shew, W. L., Yang, H., Yu, S., Roy, R. & Plenz, D. Information capacity and
transmission are maximized in balanced cortical networks with neuronalavalanches. J. Neurosci. 31, 55–63 (2011).
7. Petermann, T. et al. Spontaneous cortical activity in awake monkeyscomposed of neuronal avalanches. Proc. Natl Acad. Sci. USA 106,15921–15926 (2009).
8. Haimovici, A., Tagliazucchi, E., Balenzuela, P. & Chialvo, D. R. Brainorganization into resting state networks emerges at criticality on a model of thehuman connectome. Phys. Rev. Lett. 110, 178101 (2013).
9. Priesemann, V., Valderrama, M., Wibral, M. & Le Van Quyen, M. Neuronalavalanches differ from wakefulness to deep sleep – evidence from intracranialdepth recordings in humans. PLoS Comput. Biol. 9, e1002985 (2013).
10. Klaus, A., Yu, S. & Plenz, D. Statistical analyses support power law distributionsfound in neuronal avalanches. PLoS ONE 6, e19779 (2011).
11. Sethna, J. P., Dahmen, K. A. & Myers, C. R. Crackling noise. Nature 410,242–250 (2001).
12. Kohn, A. Visual adaptation: Physiology, mechanisms, and functional benefits.J. Neurophysiol. 97, 3155–3164 (2007).
13. Bialek, W. Biophysics: Searching for Principles (Princeton Univ. Press, 2012).14. Levina, A., Herrmann, J. M. & Geisel, T. Dynamical synapses causing
self-organized criticality in neural networks. Nature Phys. 3, 857–860 (2007).15. Levina, A., Herrmann, J. & Geisel, T. Phase transitions towards criticality in a
neural system with adaptive interactions. Phys. Rev. Lett. 102, 118110 (2009).16. Meisel, C. & Gross, T. Adaptive self-organization in a realistic neural network
model. Phys. Rev. E 80, 1–6 (2009).17. Saha, D., Morton, D., Ariel, M. &Wessel, R. Response properties of visual
neurons in the turtle nucleus isthmi. J. Comp. Physiol. A 197, 153–165 (2011).18. Clauset, A., Shalizi, C. R. & Newman, M. E. J. Power-law distributions in
empirical data. SIAM Rev. 51, 661–703 (2009).19. Haldeman, C. & Beggs, J. M. Critical branching captures activity in living
neural networks and maximizes the number of metastable states. Phys. Rev.Lett. 94, 058101 (2005).
20. Kinouchi, O. & Copelli, M. Optimal dynamical range of excitable networks atcriticality. Nature Phys. 2, 348–351 (2006).
21. Chung, S., Li, X. & Nelson, S. B. Short-term depression at thalamocorticalsynapses contributes to rapid adaptation of cortical sensory responses in vivo.Neuron 34, 437–446 (2002).
22. Sornette, D. Critical Phenomena in Natural Sciences: Chaos, Fractals,Selforganization and Disorder: Concepts and Tools (Springer, 2006).
23. Stumpf, M. P. H. & Porter, M. A. Mathematics. Critical truths about powerlaws. Science 335, 665–666 (2012).
24. Beggs, J. M. & Timme, N. Being critical of criticality in the brain. Front. Physiol.3, 163 (2012).
25. Priesemann, V. et al. Spike avalanches in vivo suggest a driven, slightlysubcritical brain state. Front. Syst. Neurosci. 8, 108 (2014).
26. Larremore, D. B., Shew, W. L. & Restrepo, J. G. Predicting criticality anddynamic range in complex networks: Effects of topology. Phys. Rev. Lett. 106,1–4 (2011).
27. Ribeiro, T. L., Ribeiro, S., Belchior, H., Caixeta, F. & Copelli, M. Undersampledcritical branching processes on small-world and random networks fail toreproduce the statistics of spike avalanches. PLoS ONE 9, e94992 (2014).
28. Shew, W. L., Yang, H., Petermann, T., Roy, R. & Plenz, D. Neuronal avalanchesimply maximum dynamic range in cortical networks at criticality. J. Neurosci.29, 15595–15600 (2009).
29. Gireesh, E. & Plenz, D. Neuronal avalanches organize as nested theta- andbeta/gamma-oscillations during development of cortical layer 2/3. Proc. NatlAcad. Sci. USA 105, 7576–7581 (2008).
30. Bak, P., Tang, C. & Wiesenfeld, K. Self-organized criticality: An explanation ofthe 1/f noise. Phys. Rev. Lett. 59, 381–384 (1987).
31. Bornholdt, S. & Röhl, T. Self-organized critical neural networks. Phys. Rev. E67, 1–5 (2003).
32. Moretti, P. & Muñoz, M. A. Griffiths phases and the stretching of criticality inbrain networks. Nature Commun. 4, 2521 (2013).
AcknowledgementsWe thank J. Clark for comments on previous versions of the manuscript. This researchwas supported by a Whitehall Foundation grant #20121221 (R.W.), a NSF CRCNS grant#1308174 (W.L.S.) and #1308159 (R.W.), and startup funds from the Department ofPhysics at the University of Arkansas (W.L.S.). We thank J. Gallant for sharingmotion-enhanced movie stimuli.
Author contributionsW.L.S. and R.W. conceived the study and designed the experiments. J.P. designed thevisual stimuli. W.L.S., W.P.C., J.P., N.C.W. and R.W. performed the experiments. W.L.S.and W.P.C. analysed the data. W.L.S. and Y.K. performed the model simulations. W.L.S.and R.W. wrote the paper.
Additional informationSupplementary information is available in the online version of the paper. Reprints andpermissions information is available online at www.nature.com/reprints.Correspondence and requests for materials should be addressed to W.L.S.
Competing financial interestsThe authors declare no competing financial interests.
NATURE PHYSICS | VOL 11 | AUGUST 2015 | www.nature.com/naturephysics 663
© 2015 Macmillan Publishers Limited. All rights reserved© 2015 Macmillan Publishers Limited. All rights reserved
LETTERS NATURE PHYSICS DOI: 10.1038/NPHYS3370
MethodsEx vivo eye-attached whole-brain preparation. All procedures were approved bythe Institutional Animal Care and Use Committees of both Washington Universityand University of Arkansas, and conform to the guidelines of the NationalInstitutes of Health on the Care and Use of Laboratory Animals. Adult red-earedturtles (n=9, Trachemys scripta elegans, 150–200 g weight, 12–15 cm carapacelength) were studied. Following anaesthesia (Propofol 10mg kg−1) anddecapitation, we surgically removed the brain, optic nerves and eyes, from thecranium (Supplementary Information 9). One eye was hemisected and drained,thus exposing the retina for visual stimulation; the other eye was removed. Twocuts allowed the cortex to be unfolded, exposing the ventricular surface, thusfacilitating the subsequent insertion of the microelectrode array. The eye and thebrain were continuously perfused with artificial cerebrospinal fluid (in mM; 85NaCl, 2 KCl, 2 MgCl2, 45 Na HCO3, 20 D glucose and 3 CaCl2, bubbled with 95%O2 and 5% CO2), adjusted to pH 7.4 at room temperature. Recordings began 2–3 hafter induction of anaesthesia.
Microelectrode array measurements.We recorded wideband (0.7Hz–15 kHz)extracellular voltages relative to a silver chloride pellet electrode in the bath at30 kHz sample rate (Blackrock Microsystems, Cerebus). With post-processingfiltering (bandpass 5–100Hz) we extracted the local field potential (LFP). We usedtwo different electrode arrays. The first was a 96-channel microelectrode array(10×10 square grid, 400 µm inter-electrode spacing, 500 µm electrode length, nocorner electrodes, Blackrock Microsystems). Using a micromanipulator (Sutter,MP-285), we inserted this array to a depth of 250–500 µm, with the plane ofelectrodes parallel to the dorsal surface of the cortex. The second array wascomprised of a three-dimensional (3D) grid of electrodes (4×4×8 grid, 16 shanks,8 electrodes per shank, 300 µm inter shank spacing, 100 µm inter-electrode spacingon each shank, Neuronexus). This second array was inserted to a depth such thatelectrodes spanned the cortex from the ventricular to the dorsal surface. Weanalysed data from electrodes that were located within the visually responsiveregion of the cortex (Supplementary Information 2). This included between 13 and28 electrodes (19 on average) for 10×10 electrodes, and approximately 48electrodes for the 3D grid electrodes.
Visual stimuli. Visual stimuli (two types of greyscale movie, black dots moving ona white background, uniform black to grey transition) were created by a computerand delivered with either a miniature video projector (Aaxa Technologies, P4X PicoProjector) or an LCD monitor (Samsung 19′′, 1,440× 900 pixels, contrastratio= 20,000:1, response time= 2ms). The projector/monitor image was focusedonto the retina with additional lenses (Fig. 1a). The mean light intensity(irradiance) at the retina was 20mWm−2 for the monitor and 1Wm−2 for theprojector. In two experiments, we also used a brief flash from a light-emitting diode(LED, 60Wm−2 at retina) placed near the retina to stimulate with a 1 s flash.Further details about the stimuli, including timing, are in SupplementaryInformation 10.
Avalanche analysis. The first step of avalanche detection was to compute thestandard deviation of every LFP trace. Next we defined an ‘LFP peak’ as a period oftime during which an LFP trace fluctuates beyond 3 to 4 standard deviations,owing to either a positive or negative deflection (Fig. 1b). For each LFP peak, wedetermined the time of its extreme value and the identity of the channel on which itwas recorded. The channel information was used to exclude from analysis LFPpeaks which were not within visual cortex. An avalanche was defined as aspatiotemporal cluster of consecutive LFP peaks with inter-peak intervals notexceeding a temporal threshold1T (channel information does not play a role inavalanche definition).1T was chosen to be the average inter-peak interval (〈IPI〉,inverse of population LFP peak rate), resulting in1T=24±18ms (mean± s.d.).Avalanche duration was defined as the difference between the first and last LFPpeak time within the avalanche. The size of an avalanche was defined as thenumber of LFP peaks comprising the avalanche. Avalanches were analysedseparately depending on whether they occurred during the transient period orvisually driven steady state period. Robustness of model and experimental results
to changes in1T and definitions of time periods are described in SupplementaryInformation 11.
Power-law fitting and fit quality, q. Using maximum likelihood methods10,18, wefit a truncated power law (truncated at both the head and tail) to the avalanchedistributions during visually driven steady state (Supplementary Information 12).The fitting function for the avalanche size distribution wasf (S)=S−τ (
∑xMx=x0 x
−τ )−1, where the maximum size xM was assumed to be thelargest observed size. The minimum size x0 and the exponent τ were fittingparameters. As avalanche duration is a non-integer variable, the fitting function forthe duration distribution was g (D)=(1−α)(y1−α
M −y1−α0 )−1D−α , where the
maximum yM was taken as the largest observed duration, and y0 and α were fittingparameters. Exponents τ and α between 1 and 4 in increments of 0.01 were tried.Minimum values x0 and y0 were tried, increasing from 0, but only up to the pointwhen the fitted power law matches the data well enough to have aKolmogorov–Smirnov statistic KS<1/
√Nsamp, where Nsamp is the number of
avalanches comprising the data set (Supplementary Information 12). For fittingmodel data size and duration distributions, we used the fitting function f (S) above,because both size and duration are discrete variables for the model.
After finding the best-fit power law, the next step was to assess goodness-of-fitq (refs 10,18). We compared the experimental data against 1,000 surrogate data setsdrawn from the best-fit power-law distribution with the same number of samplesas the experimental data set. The deviation between the surrogate data sets and aperfect power law was quantified with the KS statistic. The quality q of thepower-law fit was defined as the fraction of these surrogate KS statistics which weregreater than the KS statistic for the experimental data. We use a very conservativecriterion, q>0.1, for judging the data to be power-law distributed. This isdemonstrated visually in Fig. 1f,g and Fig. 2e,f by plotting the experimentaldistribution over a grey band which delineates the 5th–95th percentiles of thesurrogate data sets.
Computational model. A total of N =1,000 all-to-all connected binary neuronsreceived input from outside the network. The ‘strength’ of the synapse from neuronj onto neuron i at time t is determined by the corresponding element of thesynaptic weight matrixWij(t). 20% of neurons are inhibitory—that is, withnegative entries in the weight matrix.�i(t) is the strength of the input synapseonto neuron i (all excitatory). The binary state si(t+1) of neuron i (s=0 inactive,s=1 spiking) is determined probabilistically based on the sum p(t+1) of its inputsp(t+1)=�i(t)σi(t)+
∑Nj=1Wij(t)sj(t). If 0<p<1, then the neuron fires with
probability p. If p≥1, then the neuron fires with probability 1. If p≤0, then theneuron does not fire. Time is discrete and state updates are synchronous. The inputσi(t) from the ith input synapse is binary (1 with probability r). The onset ofstimulation is modelled as a step increase from r=5×10⁻⁵ to either r=0.02 orr=0.1. In Figs 2 and 3, we report the population input rate of R=Nr . The updaterules for synaptic dynamics areWij(t+1)=Wij(t)+τr−1(W o
ij −Wij(t))−τd−1Wij(t)sj(t) and�i(t+1)=�i(t)+τr−1(�o
i −�i(t))−τd−1�i(t)σi(t). The defaultweight matrix was constructed such that its largest eigenvalueΛ0 has absolutevalue equal to either 1.0, 1.05, or 1.1 (Supplementary Information 7). A largesteigenvalue of 1.0 corresponds approximately to an average synaptic weight of 1/Nand is known to result in critical dynamics for models with static synapses26.Synapses depress with a time constant of τd=20 timesteps following a presynapticspike, then recover exponentially with a time constant of τr=400 timesteps.
Each avalanche is initiated by external input. On reaching a timestep with noactive cortical neurons, the avalanche is considered to be ended. We simulated 40trials of step increase in input. In each trial, we ran the model for 5,000 timestepsfollowing the onset of increased input. As in previous studies25,27,33, subsampling(Fig. 3) entailed analysing the spikes from a randomly chosen 30% or 10% of thenetwork. More extreme subsampling, which matches experimental LFP peak ratewith model spike rate, are explored in Supplementary Information 7.
References33. Priesemann, V., Munk, M. H. J. & Wibral, M. Subsampling effects in neuronal
avalanche distributions recorded in vivo. BMC Neurosci. 10, 40 (2009).
NATURE PHYSICS | www.nature.com/naturephysics
© 2015 Macmillan Publishers Limited. All rights reserved© 2015 Macmillan Publishers Limited. All rights reserved