ad. 481 - defense technical information center · 8@ienciati ibape saja thiat ameaaca aba~k4 have...
TRANSCRIPT

UNCLASSIFIED
AD. 2 96 481
ARMED SERVICES TECHNICAL INFORMATION AGENCYARLINGTON IIALL STATIONARLINGTON 12, VIRGINIA
UNCLASSIFIED

NOTICE: When government or other drawings, speci-fluatiuub ur utLer idua dre ubd fur Wiy puaýoe
other than in connection with a definitely relatedgovernment procurement operation, the U. S.Government thereby incurs no responsibility, nor anyobligation whatsoever; and the fact that the Govern-ment may have foimilated, furnished, or in any waysupplied the said drawings, specifications, or otherdata is not to be regarded by implication or other-wise as in any manner licensing the holder or anyother person or corporation, or conveying any rightsor permission to manufacture, use or sell anypatented invention that may in any way be relatedthereto.
1 lU T UoLICIS OPIous
\~~ ON MUSTINLG OR POV&&L5M
I~) ~ PUDUAL TALLOUT SHUITU 13001A1
David Kt Berlo
Deput:ent of CoummicationCollege of Comamicetton Arts
itchigan State nidvereit7
comm
a,,
CJ
Communication lesea ah ReportSeptember, 1962
Prepared fortOffice of Civil DefenseDopeprt••nt of DefenseCoutract #it 00-8O-62-19
This report has been ravlmd In the Officeof Civil Defence and approved fot publicatiou,

Acknojled~ements
The writer is indebted to many people who helped in the design,
execution, and analysis of this research study. Dr. Malcolm MacLean, Jr.
collaborated in trie design of the questionnaire, Mr. Dan Costley from
the Department of Communication and Mr. Jack Prather from the Cowmunicatioes
Research Center supervised the data processing and analysis.
Mrs. Shirley Sherman prepared the manuscript for publication.
Mr. Burns Roper of Elmo Roper and Associates was most cooperative
in suggesting improvements in the questionnaire, and supervised both
the data collection and the preparation of the data for machine analysis.
Elmo Roper and Associates are not responsible for the questionnaire or
the analysis; however, both were improved because of their helpful
suggestions and advice.
Finally, Mr. Ralph Garrett and others in the Office of Civil
Defense made the study possible by providing financial support for It,
and their c'.pcricnca arA prt'.G data o, pu~li autti.udso Luward uivLl
defense were of considerable help to us.
umary
Thi, tepg;t aunJyzee g,~a obtained from a national probability sample
of 1,000 adu,.414merican6, *Ih& questionhaire was prepared and the analysis
i-tiloemag %I 14ýeifjaa Af4.o Univetmity. The data were collected by Elmo
Ropi anudy AisemaiaCew lt •nun 1-962.
Tho stu4y obtatte4 indices of pullie attitudes toward the probability
of nuetear var, the qittity of fallout shelters, and the desirability of
various evtli defense •togtams of the Office of Civil Defense. We also
analyzed respouse differences that were related to various demographic
variables, and conpared throA groups which are maximally different in their
receptivity to shelter programs.
Public Attitudes
About I American in 4 believed that the United States would be involved
in a nuclear war within the next 20 years. About 1 in 2 rejected this idea
and the remaining 2.5% were undeeided, The public was split almost 50-50 on
the question of the utility of shelters. About half thought shelters would
help and the other halt thought they would not.
In spite o" this split, however, most Americans were in favor of the
four existing or proposed governmental shelter programs (i.e., marking-
provisioning, changing existing buildings, including shelter space in new
buildings, and providing financial help in constructing shelters). Any
given program was supported by at least 2 out of 3 respondents a.•d half of the
respondents favored all four, In addition most Americans were either
satisfied with the present or proposed programs (457.)--or believed the
government should do more (26%). Only 147 thought the government should be
doing less, and the remaining 15% were undecided.

RelatiQftsIatiamnons Atttiudeie
Ve fount so rolettebvol batvu an individual's opihiom as to the
WU.elIteoa oft v40 14 Utl bshel et 4iabolies is the uttlitY of shelters.
Tbese two vatUbales appet 1t Ib* iudependent. Both, however. are related
to aceptatce of * Oballer ytgaM; tb.e., those who believed war is likely
were *lItgtIy more tavorjue toward eneieers* aU• aLi whU ....- v-'
voi4t help were mucb more likeI7 to favor a shelter program.
Letilnsbht__s between Demograohic V•i•kblee cnd Attitudes
people ii the South, people on farms, females, Negroes, and people in
the ko'Wst eo4tio-aeoomic levels were most likely to feel that we will be
involved in a nuclear war within 20 years. Belief in the utility of shelters
was hUel most strongly by younger citizens and those in the highest socio-
OcoUOmit levels. People over 50 years old vere least convinced of the utility
of shelters,
The level of support for the existing or proposed programs is relatively
tonstaut throughout the country, mong occupation groups, and among citizens
IrVing in town3 of varying sizes. Females and younger citizens were most
supportive,
Vegtoes and those in the lower socio-economic levels were most likely
90 suggest the government should do more. Whites, those in the higher socto-
ecgntmia levels or in managerial positions, and older citizens were most
likely to suggest the sovernment. should do less than it is now doing.
eo

Table of Contents
Topic Page
Staenf 4 4ajectives 1
the Od..orisaIt 2
0 6
Suiey eopImpe 8
Rq&SIsmI8fs~@a~4g~
Rd~atteas1hLpi 54tweev VceMftpht
00
ArnityAvalabl Copy 4dI t~

The rublicts opinions on Existing or Potential Federal Fallout Shelter Programs
As part of the attitudinal, research program being conducted by the
Departvent of Communication for the Office of Civil Defense (Department of
T~le~st Wk9Q RWkxftq4 SMCD w&#PL. a natfteaJ, ei~rvey was completed in June
62 fts "09* ae. g0*4%'Vait intended eo assess pubMe attitudes on three issues:
*skar "qara vsfbae &we haut qGo WeCnt* years.
IWEIM ft to WMblb a1 444que V9,49# 4110 ViteQO.5 ti
44 o * latest wlo'bs'
go IM fSIuM a# "IM'1W 41 Pdatsal fe0iut eAelter prograine
0 9 htesS couli be Leaus".4 by t" yE4gas C~eflbmeU
o S.d(e 1 I O~esg 1%sla ejbueff.W ~*$a~s V4@V tnetesmted WD the too
tUUMN108 ows tow"0 va ft ae M1ionb5P teIfie~te 4a) opI~e~e 9$
6410 f40 ta" M8& 4N) vauiotil demagiajIadatRg 4Wb St 4,gll Iaca# stag 41
* t4 Saittef qiork (ta, be pr~utfd ft 0 ftb~qquQ%1 tepwt) al tips YteBl1-
GRMis I1,q4h( With U*440 900091 010w%* these deft wiles *64 dawn £1013 a
SdtttSl "111s. l&ItdOr 00 data 12Wý MeS1I4g6Is $A QIj ge1.illed CI1811
Pd An i 1416d 90e Is £v1.rpz 11he iim~h 611 the tw4tenl gavetament III-
IMbUftIt PrVIXAM, rA l~attfp4 Sample Wilk 1belp iso 411tJhi.I 6&e -onj~aerice
tul ei~gh~S S 0412110z MM! 004C0 41ati% Ik e eostntg as a whoise It
418@ 92W1118 s3eLLf1 tirfe'~a~tis on Vat It algtIties IL jus~ kowaxA se~vezt'
"* Puts, of 5!he GIVII ddeSIS aheelir PKopMi
illbIZAS State 4;n;Lseftliy ifeet Mt U4taii fts ova, *aU~na4 JU14 Tteta-
* ~Ielft 024Mf TLS? t~QZ01 QbW" a recllx!e *UM351 Irample# tha Alm*4 90peg
0196IMi@5S t~antgottu yOU I~ta$U~t Ito rodcag ue 1101A "IC, Zopie
fgsaiMBRuL pgqati~ dos a~me, aftniSat" tbs piugt5C@nnTS, and pzeav~ard

2
the data for machine analysis'. Michigan State, after consultation with
peksonnel of ,the national Offica 12f Ci-vil Degensd,., was, responsible 'for. most'.
%pt the .4uesLfionnritO an4 all *i' 6~ alalysta. 4 1iM gestlea 4er't-
V.49tugleS by QC1) pars&0S.
1he u,1twit~nagSI OdIWA-4 e1gW #*§taUftY. qu~e.tass SgWtkr IS 6e W¶
greaA' #1 takrbttu Sentioae4 abgr# % f sin. £Iftudd CWM 4emogfaphCS NeWi
%*U* Perm~ttej to 116 Caeg~fl% *4Vtepsc!E with~ ffe-t Ita OWjpq~Ie
at ca .;* th cpm(tt7 etze QE mommmutity* Cu& ~t~on, -.94s 4ga.' VMS:V &a
sogio-e~hoI1 ieiS.
ft~ Rueettas V'as gs3 to L-4e% W tbsqaita~le. 7Tbc qua8to was:
"OW8 6M ye arQ ta~eeleste Le3 Is t peole feet about thoa
In 7egq- 4optton, what h-ce. Che Ctan4ea that a war will occurSA VhttU sOmil avu~try wilt attact Cti! tVxt~ed States VIClinuclear Oveapaut 4ufling tb 4Lx~te8 of tke gevcntiesý Do0 yoiW.UNS we WU3 be W&k Qr gV e voo'. be at~aclced?"
VtIL be attac~k"Vollt ba tae
So a~swer
ia&o&iMSie1te~s.Men&1e faiflt oftLtves.
Two qIS~tiafts ueee aged to ~amaaa puiblic confidencek in shelters as
Pr~tttk* *tfas1 XAMMOeta~t ftUoui~t n fixot queatton, constucted
for aur prfwi fleaTsb, VaxB'
"-"eO a qppose ther, Is a Mtelear Wari 'Think for a momen~t about1peoplo~ V1o IlVe fai: et~t$ina. colq to estape the bomb bjzast 4 Vth*Se VO-Ople lia'v fallautý Aeilter& O~Jat do y~u thint: theira~ax'cea ate Ar esqzp~D death Or Wer raatlot stecknessftQcz W.Xout rad.atiobn? Doi yett t!a!h'k they bave a very goo4
0 0 0
0 ,~ 0 ~ Best Available C( 0
0 0,

3
chance of avoiding radiation sickness, come chance, very littlechance,, or-no chance of avoiding jracdi-ion sickness or death?"
102 ~qo4 chanc eS some iibance
Vjaw ILCIV &haxictMe4. Sance
ItoanOWg
TO Stgsefift #.bt oAj 90a tewb 'IM Pr*1 of *'the UnieEfT hates
W~ It sceWtIR~ 4t faet~e SS NtIVA Dmerleano W Afrove ur jp
so a fteI ""I"~u $6 1" "4" W "Do Rplyin m Aaez1Otes ~td
e$b. ,wPseM131UW #9 OP. *W~bM Ot g1Me ueoMA questkn9 q bauSS of WC
64fern V~at tho Ose Ot 4c IetW "I'dgsU4WI 4M O'crtfLty *f I~lM
IMS66 4V CO boa t3T4, blaf Wlb ft ts @l1tt
C4 BsPi.!cA to 7.1ý aoti-4 r kositLr.,# *x"ý4j %84 of bor.A que~gAZp
fl~eW4j CO * Vatat C14 .*1 ; ot~t pGoArbZ biao Wgadao4, by CbU We O9
WxCG9# cf t*418 WeI"AorI* Zt 4w&Corn, Coflstituogt by CM# ISsqae~j =a.-
"It fteUIn~ts OtJ SGe4taXY of 13*elast arid so&d praienfet8@IenCIati Ibape sajA thiat AmeaAca aba~k4 have faIltcai slinktggIbtCaieSO 1thstut *elftrsa will. ruav a 8Ikn~,tcant aumlie oif &two$IA Case tflis country Is oattacTce4j lome. other Vt1,4?~t degctjwtBdbave difiguee! Sesqe .cteaets Jay O~at fro slwuuc$ pot bats 42ba~er fW& becaWt the~t~tr vo~t save4 @t~ntjjanC Moba41 Itves Lis ease,* Mrbaetr 4ttcký Low do you tool, aeut; this?ft you belfere 2baUath ~lerts willJ or iIrUT not gavec a gi w
ftbf -o iveI# if wo h~ave =n attae?"
RRI1 *IV*e 8 SGfttftqM eUsbo~ -of lIteSKUI Ttit S&0 4SW;nticaut awber of Ujvis
Ib auwee
I%* Woe=V4 vetnranti Is nW cepISC~ng a aurvey of wdto 3i14b8O.
Best Available Cop,,p 0

4subways. and Qth~er sPa~ee wfeh Ithe intent of marking these spaces =nd
st9CIF-ft9 Of wit frollsinii 4W be used in case of emergency*- In addition.,ft -k See$ fPzWo11 049 60i t~rernment 4initiate programs to: (a) encourage
gs 4M~~s 16 e~jiffnisuiiarfn to increase their protection factor, (b)
4Ms@gg IM 4IdggU of Abjgt Chelter space in the design of new
%gu&J Zcj # WisIj~une, f~ some kinds of tfon-prof it institut9~s40Sag thA& Igoduce &VArsi Ab~tft JgS is Weir. ow buildings.) g~
a~t~ O 'dWSRXVM% ea* afuhaW &fee& %u~e39g CS y~tn e
'IVay eý*tftl%u~fV totU9ovjd0% tM £adtft 654&ACZ aSetr cUiis# guA an ?bPfekftS f bffsemer4 STj~IDCQ0 arda5 an$*44LMeS at some ve~fayj4&W tqVmnC £ aJin en AaMLS fi~vor 4r (WOsed ý1* Ipot ar. vIadg& g Oesg f4~f4L tifti-O foe %jaang AI5& "19b%&UQa!4 9.0 ~ ua~~
10
eOwsed Wibait UM
Me Op ftl gI MaWIn stI&70t% Clou aj~ taffmeaa 6aga%4Uft S da9164 P*~ fe Sa* of SkU M ag f&
W DO S eQ4e~LA
00
Best AvailableCr 0
5
,The; quest.04 re~eganf3 'g &h,, Present survey-marking- stocking program
was createdy GcD personne?*. Th~s juest-on was:
'O~ floverrment is comp,ýtixig a survey of large buildings, subways,ana? thFe 1 ike.p Enough corrid~rsa innete rooiiis, basements and so onhave S~een fount? to p~otrct Gver 914hillion people against falloutradlationi i~hould or shou'T noiS these protected areas, whichfltea~l 6x~st,, be markeg and Zrov~sioned, &r use in an emerganc 94"
44&J bialtcer4 4n& pr~vit?)nelShould zior, ,1 6Vateil and j~raisloned
N* answrc
am Sn-g9I& j~Va ai4A ,Ap %4, qe4ftt 1jahmea 4ap, ~es r s a"-' VUts
"protect o-ft3 99 mit%1@i$ 7g#pj*~ ags, galq 19 ~ as pg *s Wen4
that sgme pea2 1e arit moft %1ie4 4A1 $ qp4,q PX~ w ~ e ~overnmento
has a~readi' put InCt oxfatjE* v4 tbt:g~ s0.ame, Ime 4 ~~et
this Program will d~efinitely V90P4,- $* A Ipointed out that it is in faft anv~@V ' igrar.ese (4
0viction 1hat the P50 milliorj feop~e;iall WI Ag mwpa @#O 4 r4 dlg
to take respD~G~j j? "t rJ, (df t 4gLtW§) (nd i~ta
lIi the qquest~nnatre:
4 final. qdatiotl, vas "* vdeý @; *# ej
Covermenta? tall~ug, shdeftAV4*a5 V,'Wag qý
'By sving exisj4ng tuf % &fi %J ftant!aj ptMftljg *ZcQ 'q.! 4&egg and &ftlrs 4g,(Rermen% +s Wit ftst~mulat*l a V4ee ejftý AS V~d 0~~4i~*fallout, foit everyone Nfi ftf V"-e- ates Vjtlft Xfve. J~eatfj'So you thfný thq, Governme~f siWuj (o mofs~ t*,rvt tr SeEin the evenfS of. ar. attaC%~ to (gatS Itri*i It is -lust about Kip)jighL* Itinc? Of program, gg 4@ %oi@ @4f&~~ ~netoo mucli fn tlifs areatM
'Thts Is abou& t.'?e -rrgght kin 4 gg*o
Best Available Copy00 0
0
0, 0
6
Respondents who said the government should do more were asked: "What
else do you think the Government should do?" Respondents who said the
gove~nment is doing too much were asked: "What do you think the Government
it 49~tv~a'%d it should not be doingV'6 The content of these open-end
answers was toded and groupet Intolheme areas.
A specification of the temographiO %tems wilyS be inc.,Iuded in the
description of the survej samn~es
ohe 4eamp le
11n aft Elmo ftief anij A~ssgdates a4beainec? 4000O Vg~vews wj~h a
ý_thfaloj Wc,qsi aeb~jjý mefr an~f #rIYtcf ngeti. 2-Y and tove-0 ef-tEi was
conducted in 121 sampSpng ¶Tokafons throughout *ie 4RuqCW~. I~h samp~tng
locations were seeWI tA~ rbIt pro*,.ureeý after fjstogtratifying
the counties %I the fjnjted States f o geograpliicaj area ant 6:1egreia gZ
urbanizationO IV§ &,ocatjB4s* );*Wks wejý% splec~e* at1 Mr ~g o t
to logAaa8n tbhWj op%@4tat axe avaftahlye& ft smagef-¶ %Well btocks
weas 84Mgg4 a4W#Vft an$ *tfer~ews assigne& 0,, eaA't lo~r,%Nr-ord~on
OhataEjerisUtCG o k~ rq~~ Qp* n~~~ ij¶w3 An*
prma;&I' agZr .2 pt At was Qw~iie *9 J e d 15,
,U 2* %QtIS (?atee irg"-@P
The represeq%& 'enfts c~ the *Vtai§ O @ *j~ Ofe Rmd%0
geaphie, va7;4es hd~ekeo@s *;gtt~ Ag Mj~,f 1g
% NeWi&iges @, @v@O "*Z"
r©
0 ~3est Available Copy

7
•Geographic Area of the Country
New England 6% East South Central 7%Middle Atrantic 19% West South Central 10%East Nor&h Central 207. Mountain 47.West North Centrai 9% Pacific 11%98bth AtlantLc 14%
Size of C&=munitv,
%ve; I.00&00 107. 2,500 to 25,000 19%250,000 go l,0o0,oOQ 372% Towns under 2,500 5%100,000 to 250,000 7% Open Country 31%25,000 to 100,000 4%7#
Occupation-
Professional oi exe'Rulbe 5% Factory labor 10%Small store #t thop proprýMr 4% Non-factory labor 9%
cccl:,i -ir. fr y•',• f-iv\ 104 3 337.Farm propriegor 4% Other 10%White collar 4192ric,•a arn tales)12% No answer 1%Farm labor 2%
Sex Age Race
Male 507. VI-31r o WAN~ 2%Female 50% 35! 1
4# 37%
To answeb 1,1
Socio-economic levl,
Roper interv~prs are~sV~fO teassq @ neighbor-
hood, the size, age, and con44@0 o9 s hnA a4 V afI bserf
in reg to o s seesEgo On th &sd
of these assessments~ b hDr@4 4f asAgne@'~8ft W of fcr ma* sc)Oio-
0$*ft* 40 4W &gy and #as 8O~ ~j s~~ ~ ~~~
go SepW IMF; 64 4r% ~There fa mo direct
JaVI sag4 St A'S 4069 W4 SM %W8p jfi~ %oweve# roug'k!ly,, the
0
Best Available Copy

8
averae inecome of an "A" family is $15,000 or over; of a "B" family, $8,000--
$15,000; of a "C" family, $3,500--$8,000; and of a "D" family, less than
$1,500* %hp perceutage breakdown for this survey was as follows:
A 2%21%•8%
4&dgment 2%
Analysis of Results
The report of the survey findings is divided into three sectionat
(a) the straight tabulation of responses, (b) the relationships among the
throe major issues, and (c) the relationships between responses on those
issues and various demographic data.
The Survey Responses
Probability of attack. In answer to our qucaticii on the respondent's
opinion about the chances that a war will occur during the sixties or the
neventies in which some counti will attack the United States with nuclear
weapons, about % respondent in 4 said that we will be attacked, about
2 in 4 said that we would not be attacked, and a little less than 1 in 4
c:cid hc didn't know. i.c.. ho had no opiuion. ?Arree gOp waeres
Will be attacked 26%Won't be attacked 52%Don't know-no opinion 22%
Fallout shelters and the saving of lives. The first index of opinion
as to the effectiveness of shelters in case of attack was obtained from the
question:
"Let's suppose there is a nuclear war. Think for a moment aboutpeople who live far enough away to escape the bomb blast. Ifthese people have fallout shelters, what do you think their chancesare for escaping death or severe radiation sickness from falloutradiation? Do you think they have a very good chance of avoiding
0 radiation sickness, some chance, very little ckance, or no chanceof avoiding radiation sickness or death?"
0
9
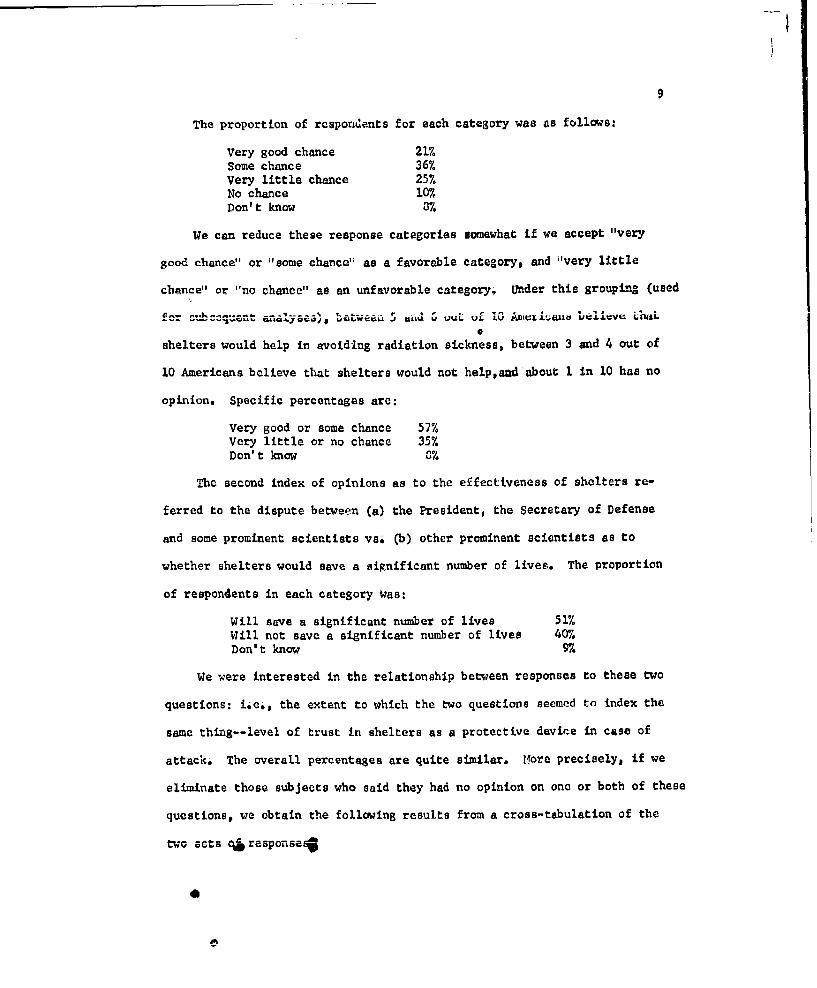
The proportion of respondents for each cateSory was as follows:
Very good chance 217%Some chance 36%Very little chance 25%No chance 107%Don't know 7%
We can reduce these response categories somewhat if we accept "very
good chance" or "some chance" as a favorable category, and "very little
chance" or "no chance" as an unfavorable category, Under this grouping (useda---ly----------w-.1-5..U ) ..-.. r .... .uu-lcii: LI-sL
shelters would help in avoiding radiation sickness, between 3 and 4 out of
10 Americans believe that shelters would not help,and about 1 in 10 has no
opinion. Specific percentages are:
Very good or some chance 57%Very little or no chance 35%Don't know U%
The second index of opinions as to the effectiveness of shelters re-
ferred to the dispute between (a) the President, the Secretary of Defense
and some prominent scientists vs. (b) other prominent scientists as to
whether shelters would save a significant number of lives* The proportion
of respondents in each category Iwas:
Will save a significant number of lives 51%Will not save a significant number of lives 407.Don't know 97.
We were interested in the relationship between responses to these two
questions: i,-e, the extent to which the two questions seemed to index the
same thing--level of trust in shelters as a protective device in case of
attack. The overall percentages are quite similar, More precisely, if we
eliminate those subjects who said they had no opinion on one or both of these
questions, we obtain the following results from a cross-tabulation of the
two sets 4responses
0

10
Wuestion 2
Question 1 Will save lives Won't save lives Total
Very good-some 747. (774) 267. (272) 100% (1046)chance
Very little-no 297% (193) 717. (483) 1007. (676)chance
it is quite clear that most people (better than 7 out of 10) answered
both of these questions in the same way; however, it is equally clear that
about 3 people in 10 did not see these two items as asking the same question.
In light of the inherent fuzziness surrounding such concepts as (a) how many
people would live far enough away to escape the bomb blast, (b) the meaning
for various individuals of "a significant number of lives,", etc', these
differences are not surprising. It would appear that the use of the status
of the President or of the Secretary of Defense had no significant effect on
responses to the second question; however, further analyses in this report
will be restricted to the first index of opinion.
Existing or Potential Federal Shelter Programs. The questionnaire
assessed the level of public acceptance or rejection of four specific
governmental shelter programst (a) the marking and stocking of existing
space, (b) the alteration of existing buildings to provide more space,
(c) the inclusion of shelter space in the construction ef new large buildings,
and (d) partial financial support by the Goverraneent as a help to schools,
colleges and hospitals which want to adapt their buildings to provide more
qace, Responses to these four questions were:
14 Marking and provisionins existing space
.Should be marked and provisioned 867
SoBtd not be marked and provisioned 7%.
77.B .0
00
9e

2. Changing of existing buildings
.In favor of changing existing buildings 64%
Opposed to changing existing buildings 227
Don't know 147.
3. Inclusion of shelter space in new, larger buildings
In favor 68%
Opposed 207.
Don't know 12%
4. Government financial support to schools, collegesand hospitals to aid in adapting buildings
In favor 77%
Opposed b'7.
Don't know 6%
The data indicate clearly that each of these four programs is supported
by the majority of Americans. The marking-provisioning program received
overwhelming support (867. in favor). The proposal to change existing
buildings received the least support; however, even here, nearly 2 out of0
3 respondents favored this program.
In addition to the individual percentages, wie can group respondents
in terms of how they answered all four of these questions; i.e., how many
people supported all four programs, how many three, etc. Thise tabulations
are presented below for the 1961 respondents who expressed an opinion on all 0
four programs.
Number-of Programs Supported Percentage Supporting
.41 Fau# Irograms 49.
0 r tde Four Programs 22%
*c ,g Including, Supporting sbg, C4hangin 4g Supporting
& go Changing, Inglud~g W37%
SoaI" 9 &n*diflng S9tgor ng Best Available Copy
) 0

12
1_N.eK . a u rPercentage SupportingTwo of the four Programs
13%
Marking, Supporting 6%Marking, Including 3%Marking, Changing 2%Including, Supporting 2%
One of the Four Programs 97.
Marking 7%Supporting
27.None or the Four Programs
7%
100%.Nearly half (49%) of all of the respondents responded favorably to
all four of the governmental programs; only 77. responded negatively to all-The final substantive question related to the Federal Government's
shelter program asked:
"By surveying existing buildings and by finacial assistance toschools, collegee and hospitals, the Government is trying tostimulate a National effort to provide protection against fall-out for everyone in the United States within five years. Do youthink the Government should do more to provide protection in theevent of an attack, do you think this is just about the rightkind of program, or do you think the Governmen is doing toomuch in this area?"
The proportion of responses in each category was:
This is about the right kind of program 45%Think the Government should do more 26%"Think the Government is doing too much 14%
Don't know 15%Again$ the data are a clear indication that better than 2 out of 3
Americans either are satisfied with the present Government program (as theyunderst~d it) or think the Government should be doing moree About I personin 7 thinks the Government is doing too much.
00

13
In an attempt to pinpoint the specific suggestions of those people who
favor an intensified program as well as the specific criticisms of those who
are opposed to the present program, we asked one additional open-end question
of the people who either felt the Goernment should be doing more or felt it
should be doing less. The 267. of the sample who felt the Government should
be doing more were asked: what else do you think the Government should do?
The dominant group of responses (37% of these respondents answered this way)
suggested that the Government should build and/or provide fallout shelters.
The second most frPniprt rionee 1) called foi£:u increased intormation
and education program as to what citizens should do in case of attack. The
complete set of responses is reproduced below (note: group totals add to
more than 100%, and subtotals may add to more than group totals, because some
respondents gave more than one answer).
"What else do you think the Government should do?"
Asked of respondents who thought the Governmentshould do more to provide protection in theevent of an attack--26% of total sample
Total ashedthis question
Number of respondents 511 10M,# %
1. BUILD, PROVDE FALLOUT SHELTERS 1920) 37Build fallout shelters, provide moreshelters to protect evoryone;build shelters here (no furtherinformation). (106) 21
Build, provide centrally locatedshelters in populated areas. ( 39) 0
Build$ provide shelters for areasoutside of cities--in smaller,rural places. ( 20) 4
Build, provide fallout shelters inschools, protect the children. ( 19) 4
Build shelters that offer realprotection--good, safe shelters. ( 6) 1
Build and provision the sheltersadequately. 4 1 0
0

14
2. INSTRUCT, EDUCATE THE PUBLIC IN CIVILDEFENSE: GIVE PUBLIC MORE INFOI4A-TION ON WHAT TO DO IN CASZ OF ATTACKTO PROTECT THEMSELVES. 8) 1_
3% SHCULD Do ALL THEY CA-N TO PROTECT US(uo further information). (44) 9
4i SMED UP THEIR PLANS FOR PROTECTION;DON'T JUST TALK ABOUT IT--DO IT. W4
5. FINANCIALLY HELP OTHERS TO BUILD SHELTERS a1) ZSubsidize, help finance private in-
dividuals to build their own
Subsidize, help finance localcommunities to build, provideshelters, (13) 3
Lessen the costs of shelters so in-dividuals can afford themi ( 4) 1
6i ENCOURAGE, EDUCATE OTHERS TO BUILD SHELTERS (_a 3Encourage, educate private indi-
viduals to build shelters. (10) 2Encourage, educate local communL-
ties, groups to build, provideshelters. (6) 1
7. BUILD UP DEFENSES; KEEP UP ARMS RACE (17) 3
0i WORK FOR PEACE; PREVENT WAR (14) 3
9i DO MORE RESEARCH ON RADIATION, FALLOUTSHELTERS--TO DEVELOP SAFE ONES IFPOSSIBLE. (12) 2
10. STOP TESTING NUCLEAR WEAPONS 6-1) 1
11i STOP BUILDING, ENCOURAGING FALLOUTSHELTERS--THEY ARE USELESS (DOSO ETHING ELSE INSTEAD. BUILD UPAR1,.S, WORK FOR PEACE, ETC.) L J3 1
12i M1ENITZONED OTHER GOVERNMENT PR.OGRAMS--UNEMPLOYMNT,. (7) 1
13. ALL OTHER (L4) 3
14. DON'T IMOW (L13) 22
15# NO ANSWER 5~) I.
0
0

15
The 147. of the sample who felt the Government is doing too much were
asked: What do you think the Government is doing that it should not be doing?
For this group, the dominant group of responses (41% of these respondents
answered this way) suggested that the Government is spending end/or wasting
too much money. The second most frequent group of responses (23%) implied
that the Federal Government is taking responsibility that should be left to
private initiative and the individual states. The complete set of responses
in imlpoduced below (note; again, totals will add to more than 100%).
"What do you think the Government is doing that it should notbe doing?"
Asked of respondents who thought the Government should do lessto provide protection in the event of an attack--li.? of totalsample
Total askedthis Question
Number of respondents 279 100%
1- SPENDING, WASTIfG TOO MUCH MONEY 11 51Spending too much money (no further
information). (18) 6Wasting money, spending money un-
wisely (no further information). (15)Money spent on shelters, civilian 0
protection is useless, wasted;could be used for better purposes. (59) 21
Spending too much money on shelters,civilian protection--should limittheir program. (20) 7
Spending too much money on shelters,civilian protection--others couldprovide it more cheaply. (3) 1
2. TAKING AWAY PUIVATE9 STATE RESPONSIBILITIES (63) 23Taking away individual, private
responsibility. (45) 16Taking away, state, local responsi-
bility. (14) 5Too much Government in everything
(no further information). (7) 3
e
0
0
16
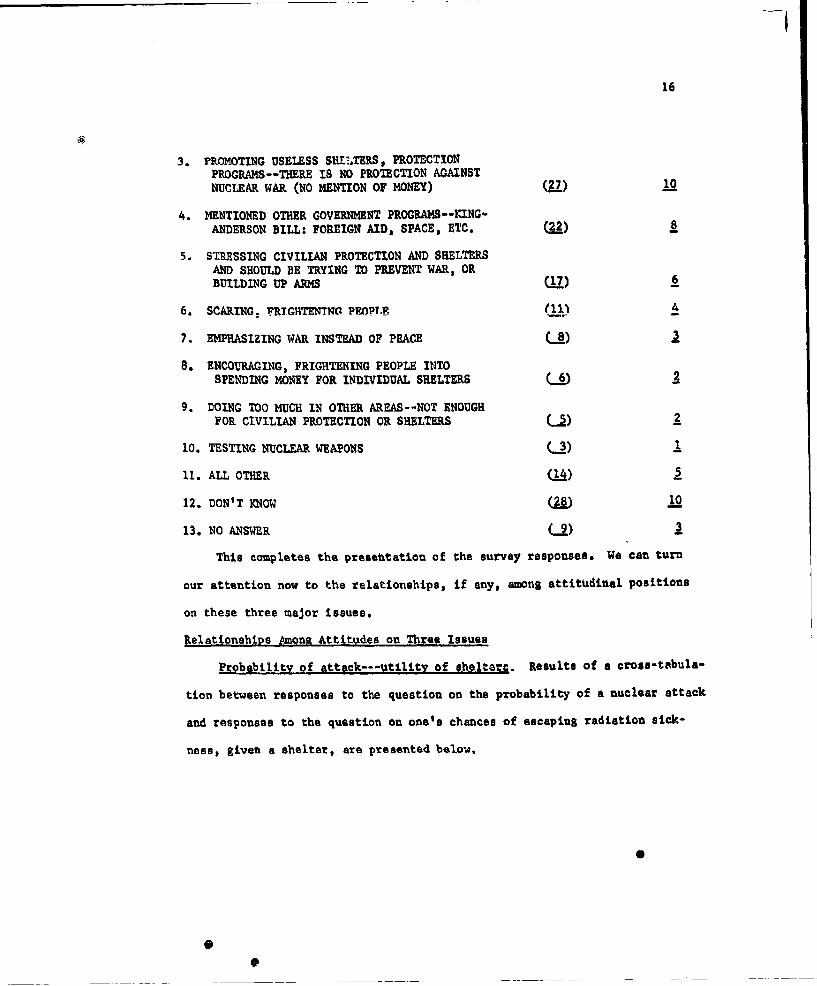
3. PROMOTING USELESS S1ELTERS, PROTECTIONPROGRAMS--THERE IS NO PROTECTION AGAINSTNUCLEAR WAR (NO MENTION OF MONEY) (27) 10
4. MENTIONED OTHER GOVERNMENT PROGRAMS--KINGoANDERSON BILL: FOREIGN AID, SPACE, ETC. (Q2) 8
5. STRESSING CIVILIAN PROTECTION AND SHELTERSAND SHOULD BE TRYING TO PREVENT WAR, ORBUILDING UP ARMS (7) 6
6. SCARING, WFRTGRTMTNT. PEOPT.V e1i) 4
7. EMPHASIZING WAR INSTEAD OF PEACE (A) 3
8. ENCOURAGING, FRIGHTENING PEOPLE INTOSPENDING MONEY FOR INDIVIDUAL SHELTERS (_) 2
9. DOING TOO MUCH IN OTHER AREAS--NOT ENOUGHFOR CIVILIAN PROTECTION OR SHELTERS U) 2
10. TESTING NUCLEAR WEAPONS (.3) 1
11. ALL OTHER W( )
12. DON'T KNOW Q2 10
13. NO ANSWER (_2) 3
This completes the presetntation of the survey responses. We can turn
our attention now to the relationships, if any, among attittdinal positions
on these three major issues.
Relationships AMong Attitudes on Three Issues
Probability of attack---utility of sheltare. Results of a cross-tabula-
tion between responses to the question on the probability of a nuclear attack
and responses to the question on one's chances of escaping radiation sick-
ness, given a shelter, are presented below.
0
0e

17
Chances of ESceping Radiatign SicknessProbability ofAttach Very Good--Some Little-None Don't Know Total
Will be attacked 59%. 3177 4 100% (510.\ý
Won' t be attacked 59% 367. 5 100% (1044)
Don't Know 507, 337. 17 100% ( 42))
For those who have an opinion on the probability c;f attack, ther: is
no relationship between the nature of that opinion and an estimate of the
value of a shelter as protection against radioactive fallout; i.e., these
tNo attitudes appear independent.
Probability of attack--Federal Shelter Programs. Those who believe we
will be attacked were compared with those who believe we will not be attacked,
in terms of their support of each of the four shelter programs.
- -= _robability ot httack
te•'ent In Favor Of: Will Be Attacked W7on't Be Attacke•
Marking-Provisioning 887. 377.
Changing Existing Bldg 717. 647%
Including Space 740 687.
Financial Support M2% 767.
There is no relationship between the rcspordent's opinion as to
whether we will or will not be attacked and his favorability toward the0
marking and provisioning of existing spaces; however, people who believe
we will be attacked are somewhat more favorable to the other three proposedl
shelter programs.
This relationship can be made clear anotber way. If we categorize
respondents into five groups on tha basis of how many of the programs they
favor (ioe*, four, three, two, one, or none), we can determine the paroentage0

18
of those who believe we will (or won't) be attacked which falls in each
of these five groups.
Probability of Attack
No. of Programs Favored Will Be Attached Won't Be Attached
Four 577. 48%Three 217. 217.Two 10% 14%One 77. 10%None 5%. 7%
100% 100%
Again, there is a statistically significant linear relationship be-
tween these two sets of opinions, although not an extremely large relation-
ship. People who believe we will be attacked are somewhat more likely to
favor existing or proposed government shelter programsi however, it is in-
teresting to note that 487. of those who don't believe we will be attacked
still are in support of a rather large-scale government effort in providing
shelter space.
Fear of attack would not seem to be the crucial variable in predicting
whether people will favor or oppose a Sovernmental program in this area.
In support of this suggestion, the data indicate no differences between the
"attacked-yes" and the "attacked-no" groups with respect to their general
support of the government's program. Forty-seven percent of those who
b<eve we will be attacked think the government's program is "Just about
the right kind of program." Forty-eight percent of those who believe
we will not be attacked also think the program is just about right. Thoac
who believe we will be attacked are somewhat more likely to cal l for more
action from the government (30% vs. 25%) while those who believe we will
not be attacked are somewhat more likely to say the government is doing too
much (16% vs. 127.); however, the differeneesuin both cases are rather small.

19
Utility of Shelters--Federal Shelter Programs. The final analysis of
relationships among the attitudinal issues involved a comparison between
Sthose who believed shelters would provide protection against radiation
s ickuess and those who believed they wouldn't. These two groups were com-
pared with respect to their favorability toward the four governmental
shelter programs.
Chances of Escaping Radiation Sickness
Percent in Favor 01; very Good--Some Little-None
Marking-Provisioning 93% 79%
Changing Existing Bldg. 747. 547.
Including Space 7787. 57%
Financial Support 85% 69%
There is an understandably strong relationship between the respondent's
opinion as to the utility of shelters as a protection against radiation and
his support of the various governmenial programs. People who believe that
shelters would provide a good chance of escaping radiation sickness are
significantly more likely to favor ea'h of the fnir governmental programs.
What is surprising, and probably indicative of the confused state of public
opinion on the shelter issue, is the large percentage of people who are in
favor of the four governmental programs---even though they say they believe
that shelters would provide little or no protection in the event of an
attack. Some of the experimental research planned by Michigan State and
other contractors should help explain the basis for this relationship.
Again, the relationship between these two variables can be made clear
by categorizing respondert.s into the five "program support" groups. The
table below shows the percentage of people who believe shelters will (or
won't) help which fall in each of these five groups.

20
Chances of Egoaping Radiation Sickness
No. of Programs Favored Very Good--Some Little-None
Four 58% 40%Three 24% 19%Two 10%. 157.One 67 147.None 2% 12%
There is a statistically significant linear relationship between these
two sets of opinions, and a rather extreme one. As one would expect,
people who believe that shelters will help are significantly more likely
to favor all of the governmental programs while people who feel they won' t
help are more likely to be opposed to all of them. Again, what is sur-
prising is the large proportion (40%) of the people who believe shelters
won't work, but who nevertheless are in favor of all four of the governmental
programs,
Belief in the utility of shelters seems to be an important variable in
predicting whether people will favor or oppose A governmental shelter program,
although it by no means serves as a sufficient predictor.
People who believe that sheltevs will help are more likely to believc
that the proposed governmental program is just about right (53% said this
a contrasted with only 38% of those who said that shelters won't help).
Twenty-nine percent of the "shelters will help" group think the government
should do morel 22% of the "shelters won't help" group also think the
government should do more. Only 8% of the "shelters will help" group think
the government should do less while 247. of the "shelters won't help" group
expressed the opinion that the government should reduce its program.
Relationships between Demographic Variables and Attitudes
The data were analyzed further in order to isolate possible systematic
relationships between each of the seven demographic variables and (a) esti-
S
21
mates of the probability of nuclear attack, as well as attitudes toward
(b) the utility of shelters, (e) the four governmental programs, and (d)
the government's program in general. To simplify the analysis, respondents
who had no attitude on an issue (i.e., responded "don't knoV" or gave no
response) were eliminated from the analysis of that issue.
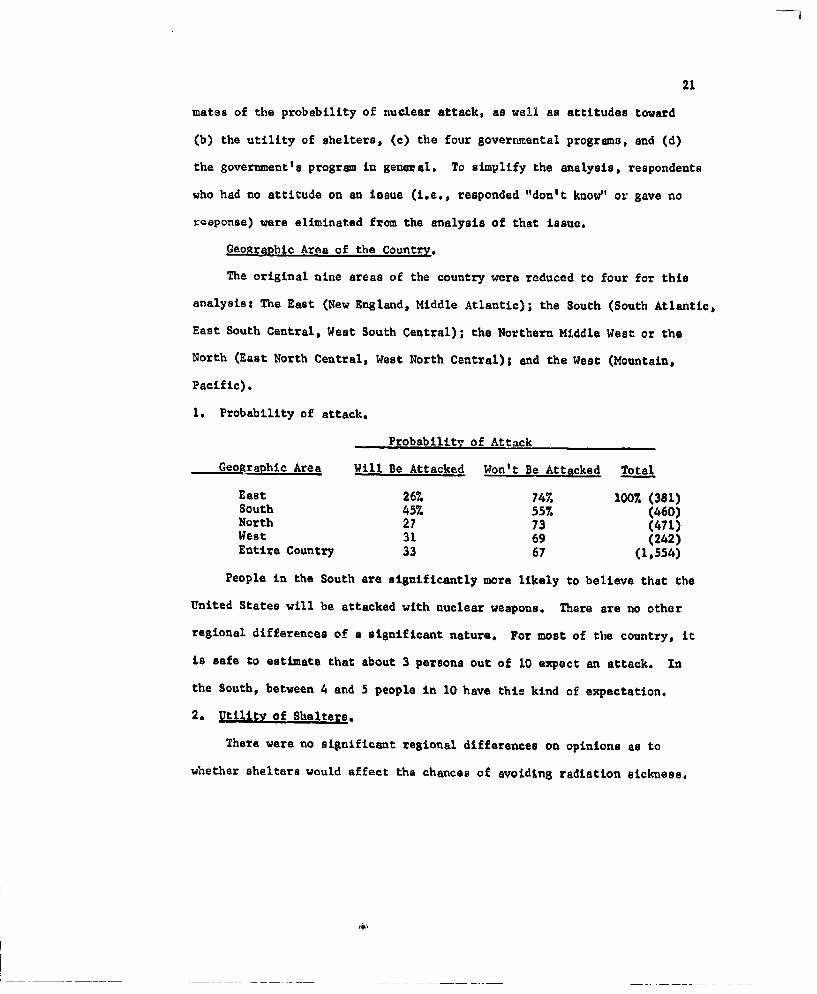
Geographic Area of the Country.
The original nine areas of the country were reduced to four for this
analysist The East (New England, Middle Atlantic); the South (South Atlantic,
East South Central, West South Central); the Northern Middle West or the
North (East North Central, West North Central); and the West (Mountain,
Pacific).
1. Probability of attack.
Probability of Attack
Geographic Area Will Be Attacked Won't Be Attacked Total
East 26% 74% 100% (381)South 457. 557 (460)North 27 73 (471)West 31 69 (242)Entire Country 33 67 (1,554)
People in the South are significantly more likely to believe that the
United States will be attacked with nuclear weapons. There are no other
regional differences of a significant nature. For most of the country, it
is safe to estimate that about 3 persons out of 10 expect an attack. In
the South, between 4 and 5 people in 10 have this kind of expectation.
2. Utility of Shelters.
There were no significant regional differences on opinions as to
whether shelters would affect the chances of avoiding radiation sickness.

22
3. Federal Shelter Programs.
There were no regional differences in level of favorability toward the
four governmental shelter programs.
4. Overall Governmental Shelter Program.
The four geographic regions do not differ with respect to either the
proportion of people who are satisfied with the present program or the
proportion of people who want a larger or smaller program.
Ri.•o tOf r•meMlit'V.
Respondents were grouped into one of four categories for this analysis:
cities of 250,000 or more; cities between 25,000 and 250,000; towns under
25,000; farms or open country.
1. Probability of Attack,
Probability of Attack
Size of Community Will Be Attacked Won't Be Attacked Total
250,000 + 30. 70% 100% (348)25,000--250,000 28% 72% (367)
Towns under 25,000 337. 67% (379)Farms-Open Country 39% 61. (460)
Entire Country 3317 67. (1,554)
People on farms are significantly more likely to enpect a nuclear
attack; however, the differences are not extremely large. There are no other
significant differences among population groups on this question.
2. Utility of Shelters.
Citizens of different sized communities did not differ on whether they
thought shelters would or would not help.
3. Pederal Shelter Programs.
There vare no significant differences among population groups.
'a

@t
23
4. Overall gvernmental Shelter Program.
There were no significant differences with respect to either level of
satisfaction with the present program or the proportion of people who be-
lieve we should have a larger or smaller program.
Occupation.
professional, executive, store proprietor; Laboring--personal services,
factory labor, non-factory labor; Earmin -- farm proprietor, farm labor;
White ol ommaker; and Miscellaneous--retired, student, unemployed, etc.
1. Probability of attack.
Prob bility of Attack
Occupation Will Be Attacked Won't Be Attacked Total
Managerial 247 76% 100 (156)Laboring 34% 667 (462)Farming 457. 557 ( 84)White Collar 207, 807. (222)Homemaker 367. 64 (477)Miscellaneous 38 627 (146)
Entire Country 337. 67% (1,547)
There were sizable differences among these six occupational groups.
Only about 1 white collar worker in 5, and only about 1 managerial person
in 4 believed that we would be attackedl however, nearly I person in 2
(457.) of those who own or work on farms expressed this feeling. The size
of the "farm" sample is small; nevertheless, it would seem safe to assume
that there is a significant difference between the beliefs of these two
occupational groups. S
C.

a 24
2. Utility of Shelters
Chances of Escapiui Radiation Sickness
Occupation Very Good--Some Little-none Total
Managerial 68% 32% 100% (176)Laboring 62% 38% (533)Parmuing 64, 36% (107)White Collar 68% 32% (237)Homemaker 59% 41% (609)miscellaneous 533% 47% (169)
Entire Country 627. 38% (1,831)
The significant difference among the groups on this question can be
attributed almost in its entirety to the relatively small number of peopleC
in the "miscellaneousl| group who believed that shelters would be of help.
Other than this, there were no significant differences among the occupation
groups on this question.
3. Federal Shelter Vrograms.
No# of Programs Pavored
Occupation 3 or-4 1 or 2 _to .
Managerial 60% 307. 107 100% (182)Laboring 757. 20% 57 (576)Farming 687. 277. 5% (113)White Collar 73% 21% 6% (243)Romemaker 747. 207. 6% (647)Miscellaneous 65% 23% 1in," (189)
Entire Country 71% 22% 7% (1,950)
People holding managerial positions were significantly leee likely
than members of other groups to be in support of msat or all (3 or 4) of
the proposed goverraent programs. There were no significant differences
among the other occupational groups.
4. Overall Goverrental Shelter Progrem.
The six occupational groups did not differ- significantly with respect
to the proportion of people uho feel the present goveTmental prosram is
Just about right (slightly more than half of those who had an opinion were
in this catesgory)g however, there. ver significant differences in the propor-

25
tion who suggested a larger rather than a smaller program.
- Attitudes Toward Overall Program
Occupation Do More Do Less About Right Total
Managerial 217. 317% 48% 1007 (168)Laboring 367. 13% 517. (523)Farming 357. 227. 437. ( 99)White Collar 287. 177. 55% (214)Homemaker 28% 127. 607. (530)Miscellaneous 28% 217% 51% (156)
Entire Country 307. 167% 547. (1,690)
The managerial group was significantly less likely to suggest that
the government "do more" and significantly more likely to suggest that it
should "do less." There were no other significant differences among the
occupational groups.
Sex
There were significant but relatively small differences between male
and female responses on 3 of the 4 key questions.
I. Probability of Attack.
,robabilit-. of Attac ,
Sex Will Be Attacked Won't Be. Attacked Total
Male 297. 717. 1007 (829)Female 377. 637. (725)
Entire Country 337. 677. (1i554)
Women were significantly more likely to feel that we would be
attacked with nuclear weapons within the next ten to twenty years; however,
the differences between male and female responses is not great.
2. Utilit, of Shelters.
There were no significant sex differences on opinion as to whether
shelters would affect the chtnces of avoiding radiation sickness.
26
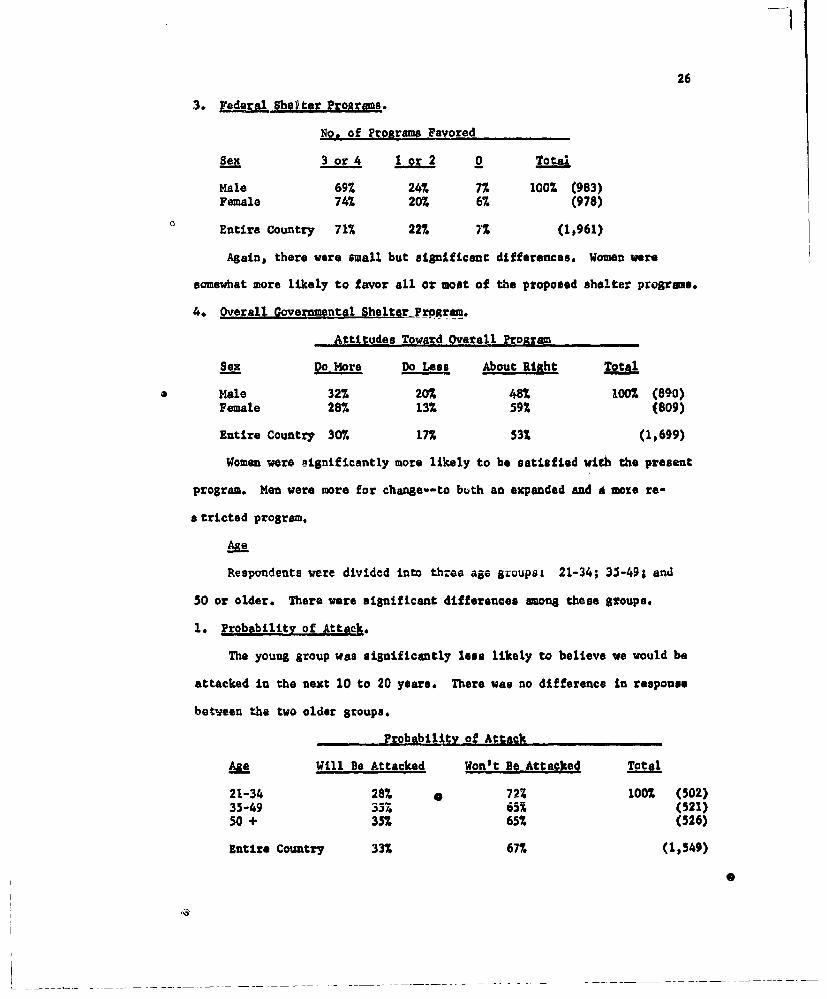
3. Federal Shelter Proramns.
No. of Proarams Favored
Sex 3 or_4 lor2 0 Total
Male 69% 24% 7% 100% (983)Female 74% 20% 6% (978)
Entire Country 71% 227, 7% (1,961)
Again, there were small but significanc differences. Women were
somewhat more likely to favor all or most of the proposed shelter programs.
4. Overall Goyetl ntel Shelter-r.pra .
Attitudes Toward Overall Paogrem
Sex DoMore Do Less About Right Total
Male 32% 20% 48% 100 (890)Female 28% 13% 59% (809)
Entire Country 30%, 17% 532 (1,699)
Women were aignificantly more likely to be satisfied with the present
program. Men were more for change--to both an expanded and A nmze to-
e tricted program.
Respondents were divided into throe age Szoupsz 21-34; 35-49; and
50 or older. There vere significant differences among these groups.
1. Probability of Atteck.
The young group was significantly less likely to believe we would be
attacked in the next 10 to 20 years. There wae no difference in respons
between the two older groups.
Probability of Attack
A ~e Will Be Attacked Won't Be Attacked Total
21-34 28. 0 72% 100% (502)35-49 352 65% (521)50 + 35% 65% (526)
Entire Country 33% 67% (1,549)
0
27
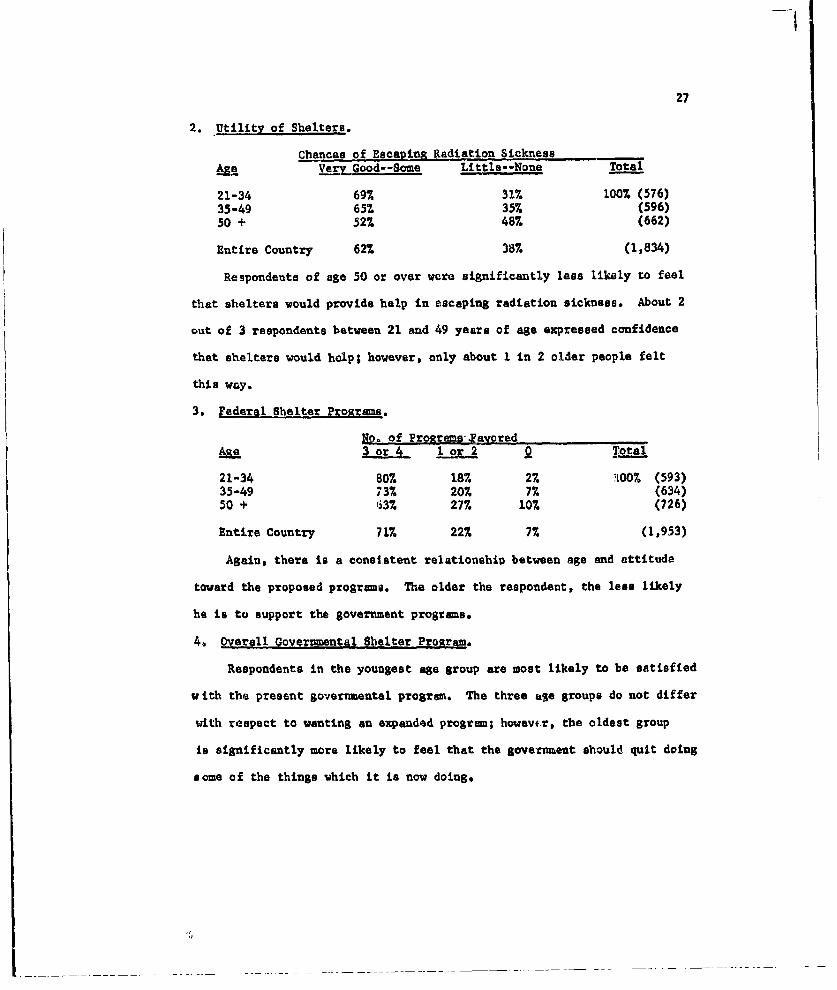
2. Utility of Shelters.
Chances of Escaping Radiation SicknessVery Good--Some Little--None Total
21-34 697. 317. 100% (576)35-49 65% 357% (596)50 + 52% 48% (662)
Entire Country 62% 387. (1,834)
Respondents of age 50 or over were significantly less likely to feel
that shelters would provide help in escaping radiation sickness. About 2
out of 3 respondents between 21 and 49 years of age expressed confidence
that shelters would help; however, only about 1 in 2 older people felt
this way.
3. Federal Shelter Programs.
No. of Progrnmse. Paored3or 4 1Lo 0 Total
21-34 807. 187. 27. 1L00% (593)35-49 737. 207. 7% (634)50 + (3M 27% 107. (726)
Entire Country 71% 22% 77. (1,953)
Again, there is a consistent relationship between age and attitude
toward the proposed programia. The older the respondent, the lees likely
he is to support the government programs.
4. Overall Governmental Shelter Program.
Respondents in the youngest age group are most likely to be satisfied
with the present governmental program. The three ae groups do not differ
with xespect to wanting an expanded program; howev4 r, the oldest group
is significantly more likely to feel that the goverment should quit doing
some of the things which it is now doing.
S. . . . . . .. . . . . . . . . . . . . . . . . . . . . . . . . . . . . . . . . . . . . .

28
Attitudes Tow6rd Overall Program
Age Do More Do Less About Right Total
21-34 31% 107 59% 1007. (538)35-49 33% 16% 517. (550)50 + 267. 23% 51% (603)
Entire Country 307. 167. 547. (1,691)
Race
Comparisons were made of the responses given by whites and Negroes
to each of the key attitudinal questions.
i. irobabi.ity ot A~tack.
Proabbility of Attack
Race Will Be Attacked Won't Be Attacked Total
White 307 70% 100% (1,386)Negro 56% 447 ( 151)
Entire Country 337. 677 (1,537)
There was a quite large and significant group difference in response
to this question. Of those respondents who had an opinion on this issue,
less than I in 3 whites said that we will be attacked; however, better
than 1 in 2 Negroes felt that way.
2. Utility of Shelters.
There were no differences between the two groups' opinions as to
whether shelters would affect the chances of avoiding radiation sickness.
3. Federal Shelter Progrmas.
No•. of Programs Favored
Race 3or4 - 1 or 2 Tota
White 707 247 67 1007 (1,736)Negro 827 147. 47. ( 201)
Entire Country 727. 22% 6% (1,937)

29
Negro respondents were significantly more likely to favor most or
all of the proposed governmental programs. Of the whiter, 70% said they
approved of 3 or 4 of the proposed programs; 82% of the Negro respondents
answered this way.
4. Overall Govermental Shelter Program.
The two groups did not differ in the proportion who feel the present
program is just about right; however, Negroes were significantly more
likely to call for an expanded program and whites were signifizantly
uiuze i1Keiy to suggest a reauccion cf Lne program.
Attitudes Toward Overall ProRram
Race Do More Do Less About Right Total
White 29% 17% 547. 1007 (1,521)Negro 40% 8% 527 ( 178)
Entire Country 30% 16% 54% (1,699)
Socio-Economic Level
The final analysis related attitudinal responses to the socio-economic
status of the respondent. It was found to be a highly relevant predictive
variable.
1. Probability of Attack.
Probability of Attack
Socio-Economic Level Will Be Attacked Won't Be Attacked Total
A (High) 207 807 1007 ( 41)B 28% 727 (335)C 31. 697 (889)D (Low) 477 53% (261)
Entire Country 33% 67% (1,526)
There is a consistent relationship between socio-sconomic status and
fear of attack---the lower the respondent's socio-ecoeomic status, the more
likely he is to feel that we will be attacked with nuclear weapons. At
the highest level, only 1 person in 5 expressee. this attitude. At the

30
lowest level, almost 1. in 2 felt this way.
2. Utility of Shelters.
With respect to respondent attitudes toward the value of shelters in
avoiding radiation sickness, the highest soclo-economic group is sig-
nificantly more likely to believe that shelters would help.
Chances of Escaeina Radiation Sickness
Socio-Economic Level Very Good--Some Little--None T7ota
A (High) 71% 29% 100% ( 49)
C 60% 407. (1,060)D (Low) 61% 397. ( 306)
Entire Country 62% 38% (1,810)
3. Federal Shelter Programs.
Again, there is a clear and consistent relationship between socio-
economic status and level of approval of the four proposed shelter pro-
grams; the lower the respondentls socio-economic level, the more likely
ho is to favor most or all of the government programs.
No. of Programs Favored
Soerio-Economic 7APvP.I 3 or 4 1 or 2 0 Tota~l
A (ligh) 647. 32% 4% 1007 ( 49)B 68% 257. 7% (415)C 70% 23% 7% (1,132)D (Low) 81% 14% 5% ( 332)
Entire Country 71% 227. 7% (1,928)
4. Overall Governmental Shelter Prosram.
Socio-economic level did not differentiate the proportion of respon-
dents who are satisfied with the present program; however, the higher
onets socio-economic status, the less likely one is to favor an expanded
shelter program and the more likely one is to favcr a restricted program.

31
Attitudes Toward Overali Program
Socio-Economic Level Do More Do Less About Right Total
A (High) 16% 28% 56% 100% ( 45)B 267, 237 51% ( 359)C 307. 15% 55% ( 972)D (Low) 37% 10. 53% ( 296)
Entire Country 30% 16. 54% (1,672)
Analysis of Three Special Groups
In addition to the analyses reported above, we were interested in a
final analysis of three specific groups of respondents. One of these groups
can be labelled as "linconstnatpnt-.6 nin. t%. ho ieh.. 41-A or -
ceptive to civil defense messages and the third can be labelled as minimally
receptive to civil defense messages.
In analyzing public attitudes toward shelters within the context of the
* questions of (a) the probability of war, (b) the value of shelters as a
protective device, and (c) the governmental programs proposed, we can assume
that people who believe that war is likely and that shelters will help would
tend to favor shelter programs. On the other hand, people who believe that
war is unlikely and that shelters won't help should, logically, oppose
shelter programs. Most of our respondents' responses were consistent with
this assumption; however, wv found one group of subjects which was incon-
sistent.* This group of 45 subjects (out of the total 2000) believed that:
InconsistentWar is unlikely, shelters wouldn't help, but I'm in favorof the proposed programs and think the government should domore in this area.
In other words, these subjects represent people who are in favor of shelters,
but not for "the right reasons."
Our maximally and minimally receptive groups also can be defined in
terms of their responses to these four questions. The maximally receptive
*Another group of inconsistent subjects would include those who believe thatwar is likely and shelters would help---but who oppose a shelter program.Only 10 subjects were in this groupl therefore, we didn't Include them in thisanalysis.

32
group, consisting of 34 subjects, believed that:
Maximally ReceptiveWar is likely, shelters would provide a "very good" chanceof avoiding radiation sickness, I'm in favor of all fourof the governmental programs and think the governmentshould be doing more.
The minimally receptive group, consisting of 17 subjects, believed that:
Minimally ReceptiveWar is unlikely, shelters would provide "no" chance ofavoiding radiation sickness, I'm opposed to all four ofthe governmental programs and thithk the government isdoing too much in this area.
DemonOanhc An*alva1a.
These three groups constitute a very small segment of the total sample;
consequently, analyses involving them can produce only speculative results,
possibly data which will be valuable in leading to other more detailed
research studies. The "inconsistent" group included only 2k% of the sample;
the maximally receptive group included only lh% of the sample; the minimally
receptive group included slightly less than 1% of the sample. Among other
a things, these low percentages indicate the lack of polarity of attitude
structure on the question of the building of shelters.
Recognizing the limitations imposed by the smallness of these sub-samples,
one can still observe some interesting characteristics of the three groups
when they are compared withtthe entire sample on each of the seven
demographic variables indexed.
1. Geographic Area.Three Special Groups
Incon- Maximal Minimal TotalGeonranhic.Area sistent receptive receptive S
East 33% 177. 18% 257.South 25% 567. 357 31%North 253 127. 29% 29%West 177. 157. 18% 157.
Sample Size 45 34 17 2,000
33
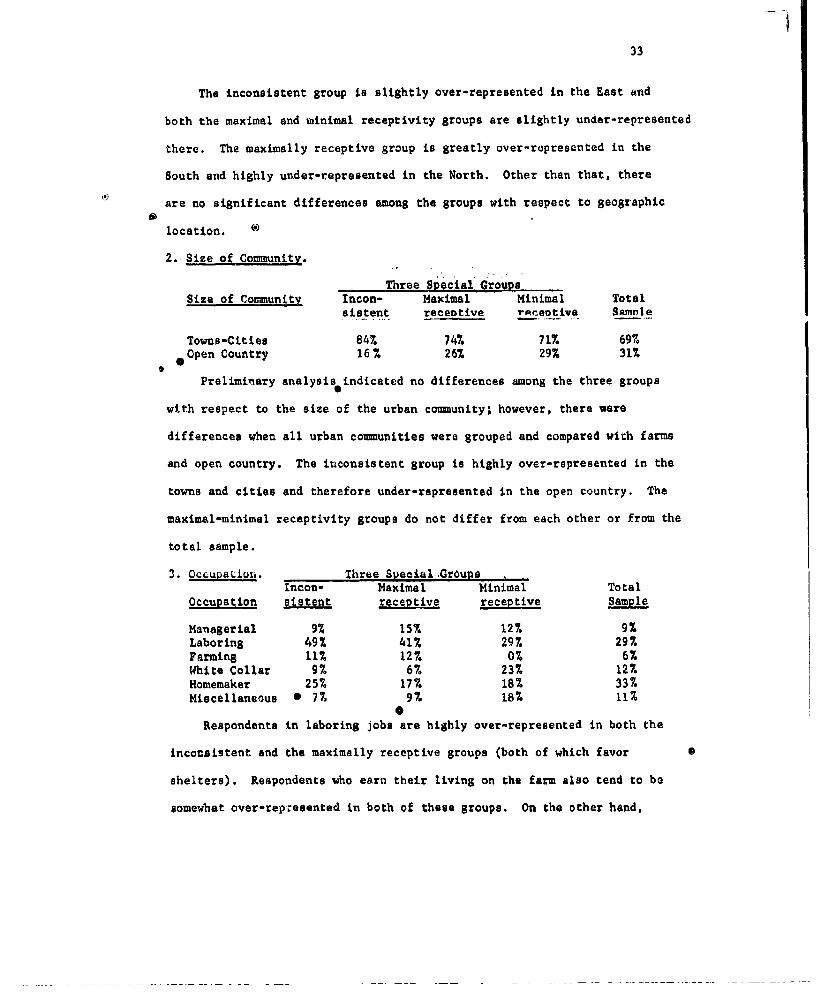
The inconsistent group is slightly over-represented in the East and
both the maximal and minimal receptivity groups are slightly under-represented
there. The maximally receptive group is greatly over-rapresented in the
South and highly under-represented in the North. Other than that, there
are no significant differences among the groups with respect to geographic
location. ®
2. Size of Community.
Three Special.ropgsSize of Community Incon- Maximal Minimal Total
sistent recentive riceotive SAMnie
Towns-Cities 84% 747. 71% 69%*Open Country 16% 26% 29% 31.
Preliminary analysis indicated no differences among the three groups
with respect to the size of the urban community; however, there were
differences when all urban communities were grouped and compared with farms
and open country. The inconsistent group is highly over-represented in the
towns and cities and therefore under-represented in the open country. The
maximal-minimal receptivity groups do not differ from each other or from the
total sample.
3. Occupation. Three Special-Groupsmneon- Maximal Minimal Total
Occupation sistent receptive receptive Sample
Managerial 9% 15% 12% 97Laboring 49% 41% 29%. 29%Farming 117 127 0% 6%White Collar 9% 6% 23% 12%Homemaker 257% 177. 18% 33.Miscellaneous I 77 9% 18. 11%
0Respondents in laboring jobs are highly over-represented in both the
inconsistent and the maximally receptive groups (both of which favor
shelters). Respondents who earn their living on the farm also tend to be
somewhat over-represented in both of these groups. On the other hand,

34
white collar workers tend to be over-represented in the minimally receptive
group. As indicated in earlier analyses. females in the home (homemakers)
are under-represented in both of the extreme groups (maximal and minimal
receptivity).
4. Sex.
Three Special GroupsIncon- Maximal Minyhal Total
Sex sistent receptive receptive Sample
Male 67% 74% 59% 50%Female 33% 267. 417 507,
Males are over-represented in all three of the special groups. In
other words, as indicated above, males are more likely than are females to
take one of the extreme positions; furthermore, males are also more likely
to be inconsistent in their position.
5. Age.Three Spacial Groups
Incon- Maximal Minimal Total"A e ten receptive receptive
21-34 337, 44% 12% 30735-49 407. 447. 6% 32%50 + 27% 12% 82% 38%
Thfts analysis provides striking evidence of the effects of age on0
public attitudes toward shelters. Age is not particularly related to member-
ship in the inconsistent group--although older people are somewhat under-
represented in this group and people between 35 and 49 years of age are
somewhat over-represented, Age is highly related to maximally and minimally
receptive attitudes. People over 50 are greatly under-represented in the
maximally receptive group and greatly over-represented in the minimally
receptive group. People under 50 are over-represented in the maximally
receptive group and under-represented in the minimally rect.ptive group.

35
6. Race.Three Special Grou~s
Incon- Maximal Minimal TotalRace sistent receptive receptive S
White 89 76 94 90Negro 11 24 6 10
The inconsistent and the minimally receptive groups do not differ from
each other or from the totAl sample with respect to the proportions of
whites and Negroes in the groups. Whites are under-represented in the
maximally receptive group and Negroes are Over-reptesented in thak group.
Three Special Groups~inon- Maximal Minimal Total
Soclo-Economic Level sistent receptive receptive Sample
A (High) 2 0 7 2B 11 18 7 22C 71 46 61 58D (Low) 16 36 26 18
The inconsistent group and the minimally receptive group are both
under-represented in the upper socio-economic levels, and the maximally
receptive group is slightly under-represented as well. All three groupo
are over-represented in the lower socio-economic levels.
Summary, Discussion, and Recommendations
Thig final section of the report is divided into three partsi a summary
of the major findings of the survey, a discussion of some of the implications
of those findings, and a presentation of some recommendations for further
research.
Summary of FindiMRs
Public Attitudes. As of June of 1962, about one adult American in 4
believed that there will be a nuclear war involving the United States within
36
the next 10 to 20 years. About 2 in 4 rejected the idea of such a war,
and the remaining I in 4 did not express an opinion.
The public is almost evenly divided on the question of the utility of
shelters in case of attack. Between 5 and 6 out of 10 Americans believe
that shelters would provide some chance or a very good chance of avoiding
radiation sickness for people who live far enough away from a target to
escape blast effects. When the question was asked within the context of
the belief of the President and the Secretary of Defense as to the value
of shelters, about 5 out of 10 said that shelters would save a significant
number of lives and the other 5 out of 10 either said that shelters wouldn't
save a significant number of lives or else didn't express any opinion.
Half of the American public is in favor of all four of the proposed
goveriu.azntal shelter programs (i.e., marking-provisioning, changing
existing buildings, including Ppacc in new buildings, and providing finanmial
help in constructing shelters). Any given program was supported by at
least 2 out of 3 respondents. The marking-provisioning program was most
popular---85% were in favor of it. 0
Most Americans are either satisfied with the proposed governmental
programs or believe the government should do more. Between 4 and 5 in 10B
believe the present program is just about right; between 2 and 3 in 10
believe the government should do more; between 1 and 2 in 10 believe the
government is doing too much; between 1 and 2 in 10 did not express an
opinion at all.
When asked what more the government should do, the most frequent
response was that the government should build or provide fallout shelters.
When asked what the government should quit doing, the most frequent response'
were: (1) quit spending-wasting so much money on shelters; and, (2) quit
taking away responsibilities which should be left to either the individual
or to state and local governments.
37
Relationships among Attitudes. The major variable of interest to
those responsible for developLng a shelter program is the public's acceptance
of shelters. We found that both public belief in the probability of war
and public belief in the utility of shelters were related to acceptance
of shelters; however, it was clear that the crucial vuriable was the
utility of shelters, not the probability of war. In other words, people
who believed there vill be a war are only slightly more likely to favor
the government's shelter programs while people who believe that shelters
will help are much more likely to favor such programs.
There was no observed relationship between an individual's opinion as
to the likelihood of war and his belief or disbelief in the utility of
shelters.
Relationshius between Demographic Variables and Attitudes. The belief
that the United States will suffer a nuclear attack was held most strongly
by people in the South, by people living on farms or in opan country, by
females, by Negroes, and by people in the lowest socio-economic level.
People whose occupation is either farm ownership or farm labor also were
strong in their belief in the chance of attack; however, subsequent analyses
revealed that this finding could be attributed to the high proportion of
Negroes in the farm-labor category.*
The only demographic variables related to a belief in the utility of
shelters were age and socio-economic level. Younger citizens were much
more likely to believe that shelters would help, as were citizens in the
highest socio-economic level. People over 50 years of age are significantly
less convinced of the value of shelters.0
*These later analyses indicated that the correlations involving the South,people living cn farms or in open country, and low socio-economic levelsremained--even when Negroes were removed from the sample.

38
General support of the proposed or existing governmental programs
does not differ from one section of the country to another, from large
cities to small towns cr farms, or among occupation groups. Strongest
support for these programs comes from females rather than males, and from
younger people rather thao older people.
Of those dissatisfied with the present program, some think the government
should be doing more and some think it should be doing less. Respondents in
managerial positions, respondents over 50 years of age, whiltes, and respondenta
in the h1k*-~ ~ ~i. ~. ieiy co suggest chat the
government should do less. Negroes and respondents in the lower socio-economic
levels were most likely to suggest that the government should do more.
Special Grojtp Analyses. A small group of citizens (about 2 to 3 per
cent), although of the opinion that there will not be a war and that shelters
wouldn't help if there was one, support the proposed governmental programs.
This group probably consists primarily of people who are in favor of
"government programs" for their own sake; e.g., people in this group are
over-represented among urban, laboring, younger, and lower-socio economic
males. Another very small group (less than 17 of the population), although
of the opinion that there will be a war and that shelters would help, are
opposed to the proposed governmental prograws. This group consists almost
entirely of upper socio-economic people.
People who are maximally receptive toward shelter programs (about 1 to
2 per cent) differ from the total sample in that they are more likely to be
found in the South, (and less likely to be found in the North), more likely
to earn their living in laboring or farm jobs, more likely to be male, much
more likely to be under 50 years of age, more likely to be Negroes, and
somewhat more likely to be in the lower socio-economic level of society.

39
People who are minimally receptive toward shelter programs (about 1%
of the population) ditfer from the total sample in that they are moxe likely
to be white-collar workers, much -fore likely to be over 50 years of age, and
also are more likely to be in the lower socio-economic levels.
Discussion of Implieations
The results of this study have at least four important implications
for tha determination and implementation of policy relevant to communication
of the g~vernment'a shelter program. These concern:
1. The prevailing attitude of the public.
Public attitude in June, 1962, can be summarized as favorable---but
not intense. Most people are in favor of the proposed governmental shelter
programs; however, very few people are extremely favorable or extremely
unfavorable. The fact that only about half the people believenthat shelters
would help in case of war, and the observed relationship between this belief
and approval of the proposed shelter programs, suggests that one of the
major communication objectives of the Of.lice of Civil Defense should be an
increase in public belief as to the utility of shelters.
2. Specific target audiences.
The maximum reception and approval of the proposed shelter programs
comes from the young, from Negroes, from females, and from members of the
lower socio-economic levels. The minimum reception and approval comes from
citizens over 50 years of age, and members of the higher socio-economic levelF
In the local community, older and higher socio-economic citizens share a
major role in any decision-process on shelters or other civil defense
measures. If the value of shelters is accepted as a given, frh rk
is needed with older and high socio-economic audiences to determine the
source of their negative attitudes toward shelters, and to attempt to
develop evidence and arguments which will be of value in changing these
negative attitudes.
40
3. The relationship between fear of war, belief in the utility ofshelters, and approval of a shelter program.
We found that beliof in the u'tility of shelters was an important;
predictor of approval of a shelter program. An expectation of nuclear war
also is correlated with approval; however, the relationship is small. The
relationship among these three variables probably can best be explained in
the context of the distinction between (a) attitudes toward adoption of a
practice and (b) actual Adoption of that practice. Further research on
this question is needed; hnwevr,_ 4it . .w-is -la'-c•b.- to argu•.- that • fav-
ability toward shelter programs (attitude toward adoptior priisarily is
determined by a belief in the utility of the shelter, not by a belief in the
probability of war. Actual adoption of the practice, the actual building
of a shelter, probably rests in large part on one's belief in the probability
of war, the iimminence of danger. In short, one could argue that pqople will
approve of shelters if they are convinced that they would help---but they
won't build them until they believe they'll need to use them.
If there is merit in this argument, it raises an Important implication
for cotnunication progranmming by the Office of Civil Defense. For ethical
as well an policy reasons, the government probably does not want to
exaggerate the probability of war; i.e., it does not want deliberately to
raise a "war scare" among the people. It can and probably should Continue
to suggest that shelters would help in such an emergency. Given these twoS
assumptions, it follows that the agency's communication program should:
(a) emphasige the utility of ahelterson a ,on!-binj asi, during times of
minimal international stress, and (b) have available on a stand-by basis
for use in times of more severe international stress a complete communication
program on the methods and techniques of constructing, preparing, and
living in shelters.

41
4. The importance of the credibility of the source attributed toshelter messages.
Two of the questions used in this study provide preliminary evidence
on the importance of source credibility as an affector of public attitudes.
We asked people what kind of chance they thought shelters would give them
to escape nuclear radiation. We olso asked them whether they thought
shelters would save a significant number of lives. The first question did
not suggest any communication source. The second question invoked the
President and the Secretary of Defense as sources; i.e., it stated that they
both believed that shelters would save lives.
Most people who were favorable on the general question (said "some
chance" or "very good chance") also were favorable on the second question
(said shelters would save lives) and vice versa; however, 272 people answered
the general question favorably but were unfavorable when the question was
phrased in terms of the President and Secretary, and 193 people answered
the general question unfavorably but were favorable when the question
invoked the President and Secretary (see page 10 of this report).
We compared these two groups of people on each of our demographic
varLables. The two groups did not differ with respect to geographic area,
* size of community, sex, age, or race. They did differ with respect to
occupation and socio-economic class. People who were favorable to the
general question but unfavorable when the question invoked the President
and Secretary of Defense were much more likely to be in managerial or white
collar occupations (33%, compared with 13% in the other group and 217. in
the entire sample) and also were much more likely to be in the higher socio-
economic levels (30%, compared with 14% in the other group and 24% in the
entire sample). Both of these variables (occupation and socio-economic class)

42
are correlated with political preference; furthermore, the observed difference(
are consistent with the party affiliation of the President and Secretary
of Defense. It seems clear that use of these sources did affect the
responses (positively for some and negatively for others), even though our
other research indicates no general relationship between political preference
and attitudes toward shelters.
From these data as well as other theory and research on source creei-
bility, it can be inferred that the choice of arcuLa ource to bk used
in civil defense messages is an important decision in comnunication planning.
Recommendations for Further Research
Results of this study indicate at least four areas in which continuing
research should be conducted. These are:
1. The study of public attitudes toward shelters, the public'sexpectations of nuclear war, and the public's attitudes endbeliefs toward other aspects of the cold war situation.
Given the responsibility for determining communication policy, it seems
apparent that the Office of Civil Defense could profit from a continuing
feedback and evaluation of the state of public opinion on key cold war,
nuclear war, and civil dcfanoe issueo. Such a study need not require
separate opinion polling operations. A small number of crucial questtons
can be included in other public opinion surveys. These questiors can
provide a continuing check, at little cost, of the state of public opinion.
It also would be valuable to record the chronology of events in the cold
war and to relate these events to changes in public attitude as well as to
other available indicators of public behavior (e.g., shelter construction,
geographic mobility, etc.).
2. The study of appeals and other message variables which areeffective with various American audiences; more specifically,this should include the study of message variables as theyaffect the unfavorable "target" audiences uncovered in thepresent study.

43
Variations in appeals, supporting evidence, channel selection, style,
and other meapge variables affect the impact of civil defense messages on
various segments of the public. Research incorporating these variations
should continue. Special attention should be given to methods of approaching
various key or target audiences; i.e.., groups which are now opposed to
civil defense and/or groups which are of special importance to the adoption
and implementation of civil defense programs.
3. The study of the credibility of various sources which can beused in the transmission of civil defense messages.
Source credibility is a crucial variable in any communication program.
Sorme of the questions relevant to it which need to be raised arei what
kinds of sources are most effective with what kinds of audiences, what
dimensions of source credibility are most salient for what kinds of message
situations, what effect does continued presentation of civil defense
messages have on the level of credibility attributed to a given source,
what are the public's expectations as to the "meaning" of various sources,
and so on.
4. The relationship between fear of war, belief in shelters, andactual adoption of or cooperation with an on-going shelterprogram.
Some possible relationships among these three variables were suggested
earlier in this report. The suggested relationships aire quite speculative;
however, if accurate, the implications for civil defense communication
are quite important. For this reason, further research is needed to probe
in depth the ways in which the public incorporateathese expectations and
beliefs in their patterns of behavior.