acute kidney injury: definitions, epidemiology & scoring ...2016-6-30 · acute kidney...
TRANSCRIPT
Acute Kidney Injury: Definitions,
Epidemiology & Scoring Systems
Paul Stevens
Kent Kidney Care Centre
Talk Outline
• Early descriptions
• Yesterday’s conceptual model and
yesterday’s definitions
• Today’s conceptual model
• Essential components of a definition
• Which one?
• Scoring systems


Early Descriptions
Greeks……… and Israelites

Father and Son

Chapter 55: Ischuria
Printed for Payne & Foss, Pall Mall, London
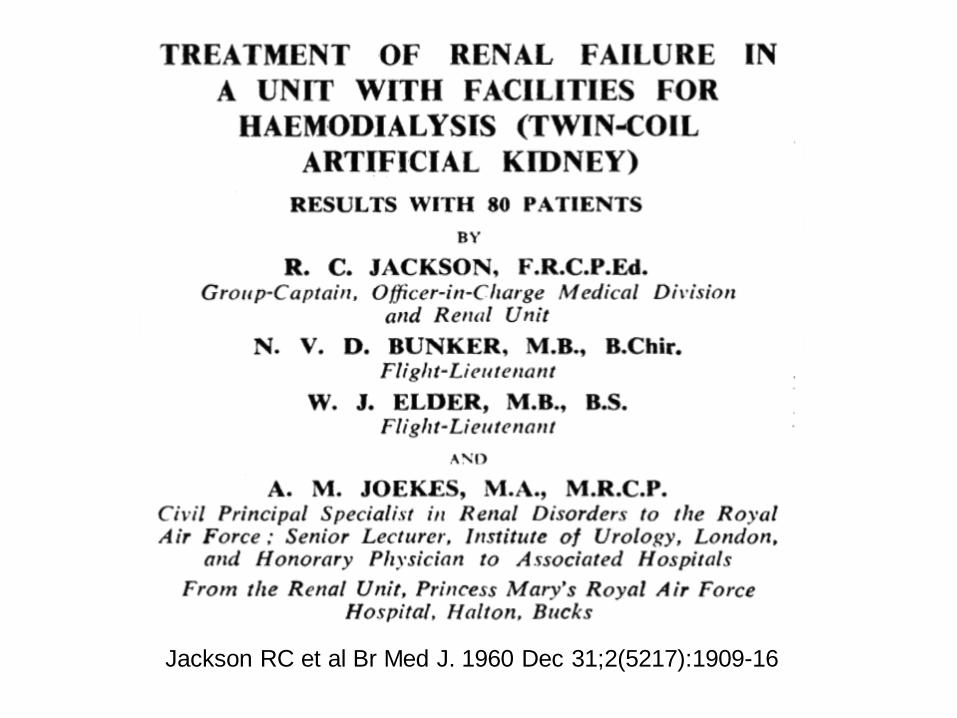
Jackson RC et al Br Med J. 1960 Dec 31;2(5217):1909-16
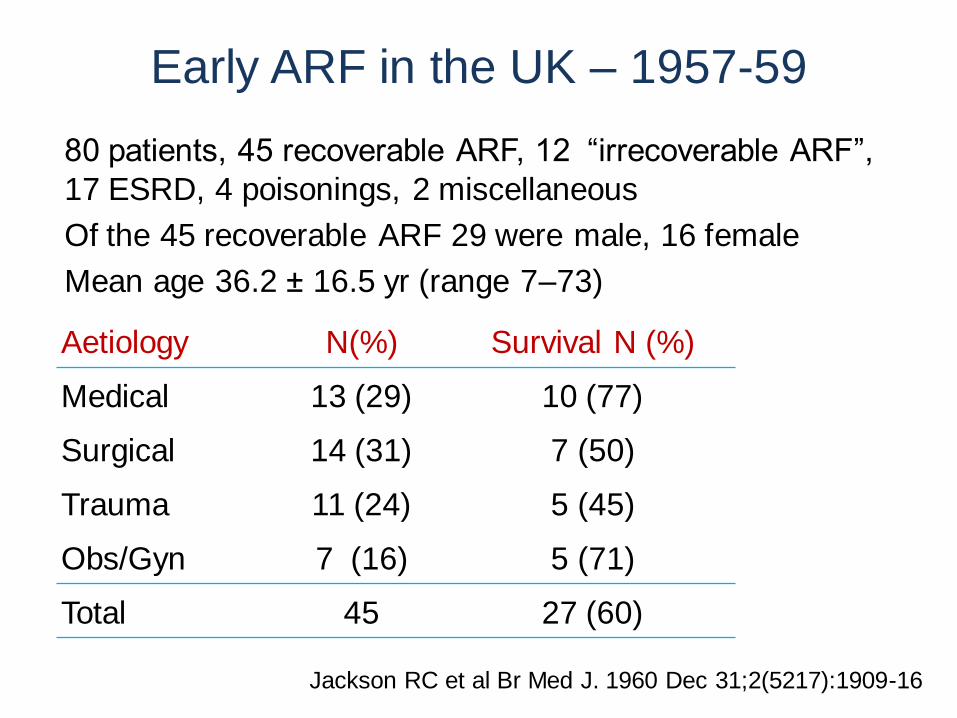
Early ARF in the UK – 1957-59
• 80 patients, 45 recoverable ARF, 12 “irrecoverable ARF”,
17 ESRD, 4 poisonings, 2 miscellaneous
• Of the 45 recoverable ARF 29 were male, 16 female
• Mean age 36.2 ± 16.5 yr (range 7–73)
Aetiology N(%) Survival N (%)
Medical 13 (29) 10 (77)
Surgical 14 (31) 7 (50)
Trauma 11 (24) 5 (45)
Obs/Gyn 7 (16) 5 (71)
Total 45 27 (60)
Jackson RC et al Br Med J. 1960 Dec 31;2(5217):1909-16
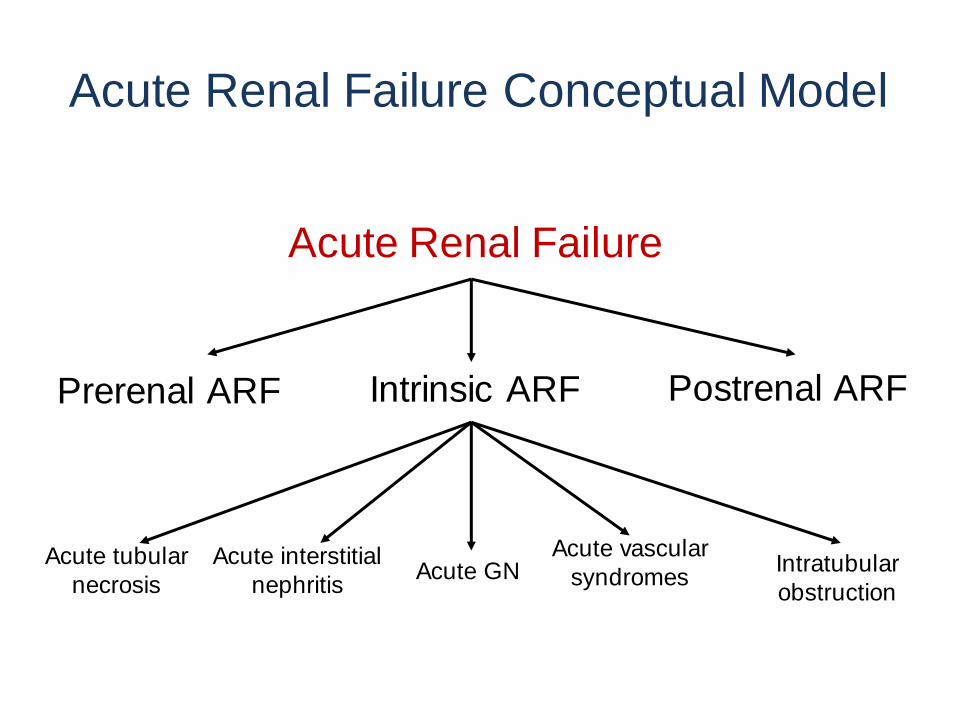
Acute Renal Failure
Postrenal ARF Intrinsic ARF Prerenal ARF
Acute interstitial
nephritis
Acute tubular
necrosis Acute GN
Acute vascular
syndromes Intratubular
obstruction
Acute Renal Failure Conceptual Model

Acute Renal Failure Definition(s)
• Acute Renal Failure
• ‘The abrupt transition from functioning kidneys to
kidney function which is unable to accomplish
biochemical homeostasis’
• Dialysis dependency
• Serum creatinine ≥500 µmol/L ± dialysis
• Serum creatinine ≥300 µmol/L (RA Standards
Subcommittee, 1994)
• Oliguric and non-oliguric
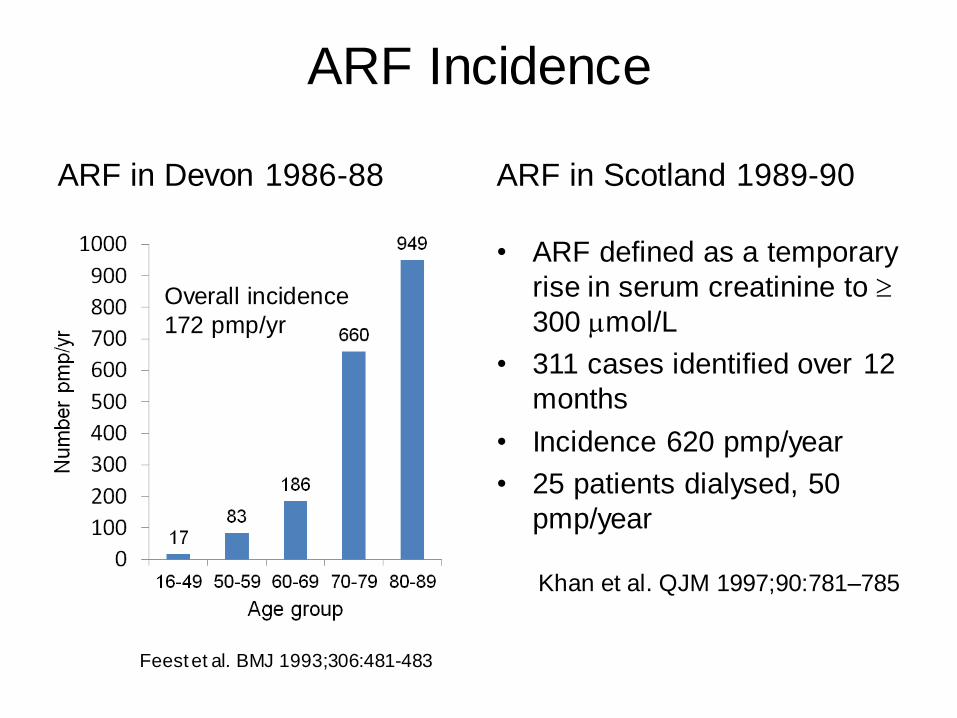
ARF Incidence
ARF in Devon 1986-88 ARF in Scotland 1989-90
• ARF defined as a temporary
rise in serum creatinine to
300 mol/L
• 311 cases identified over 12
months
• Incidence 620 pmp/year
• 25 patients dialysed, 50
pmp/year
Feest et al. BMJ 1993;306:481-483
Overall incidence
172 pmp/yr
Khan et al. QJM 1997;90:781–785
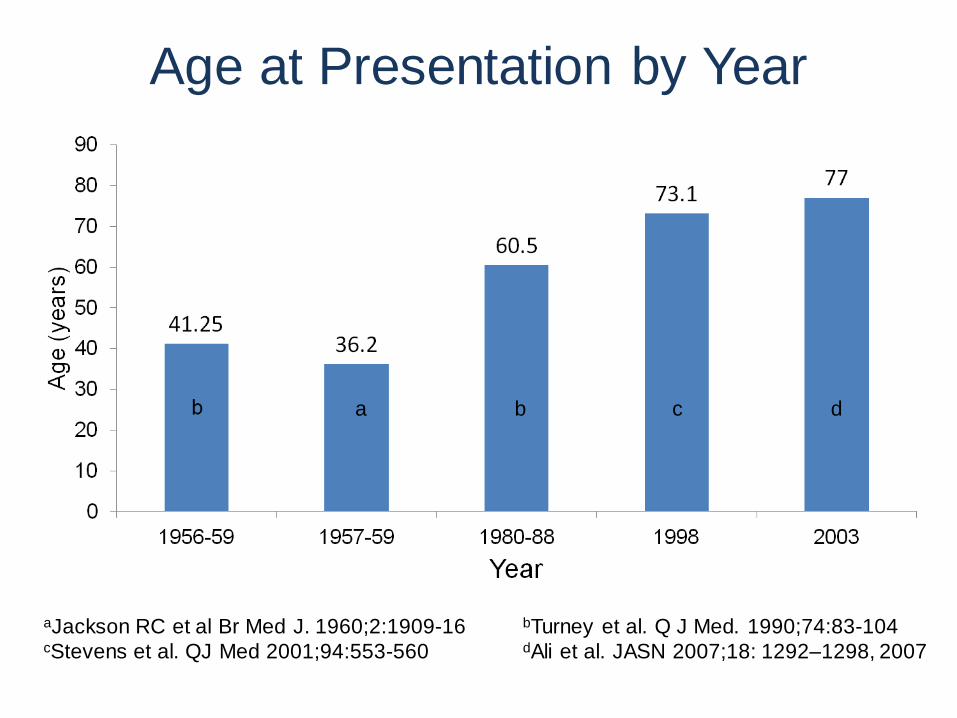
Age at Presentation by Year
aJackson RC et al Br Med J. 1960;2:1909-16 bTurney et al. Q J Med. 1990;74:83-104 cStevens et al. QJ Med 2001;94:553-560 dAli et al. JASN 2007;18: 1292–1298, 2007
b a c d

Aetiology of ARF: Leeds by Decade
1956-59 1960-69 1970-79 1980-88
Medical 31% 35% 40% 55%
Surgical 39% 36% 47% 41%
Trauma 3% 11% 6% 3%
Obstetric 26% 13% 3% 1%
Other 1% 5% 4% 1%
Turney et al. Q J Med. 1990 Jan;74(273):83-104
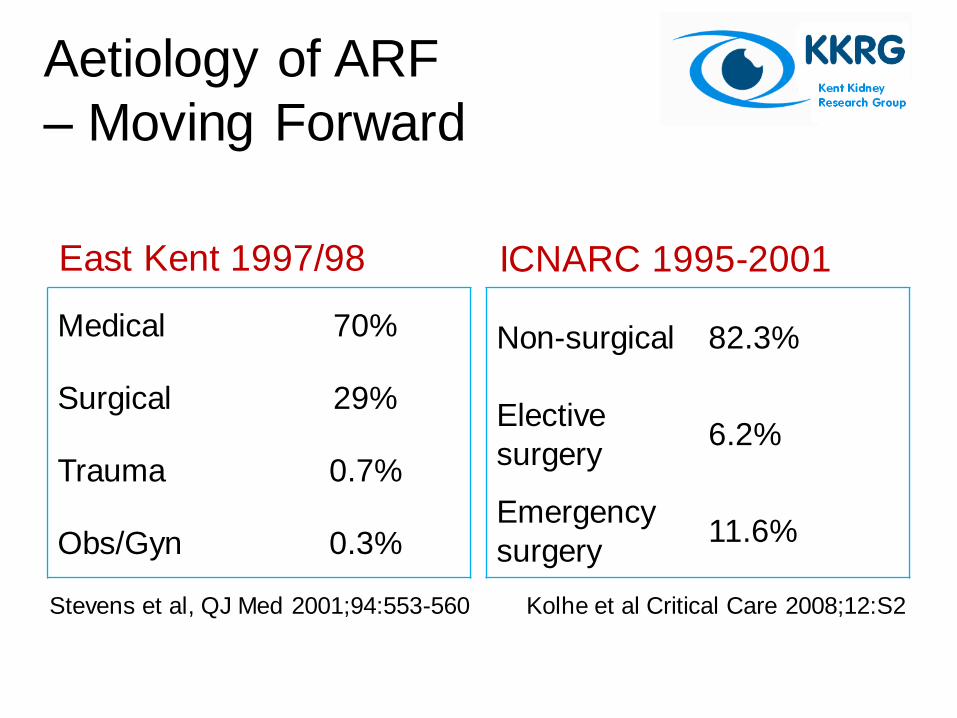
Aetiology of ARF
– Moving Forward
East Kent 1997/98
Medical 70%
Surgical 29%
Trauma 0.7%
Obs/Gyn 0.3%
ICNARC 1995-2001
Non-surgical 82.3%
Elective
surgery 6.2%
Emergency
surgery 11.6%
Kolhe et al Critical Care 2008;12:S2 Stevens et al, QJ Med 2001;94:553-560
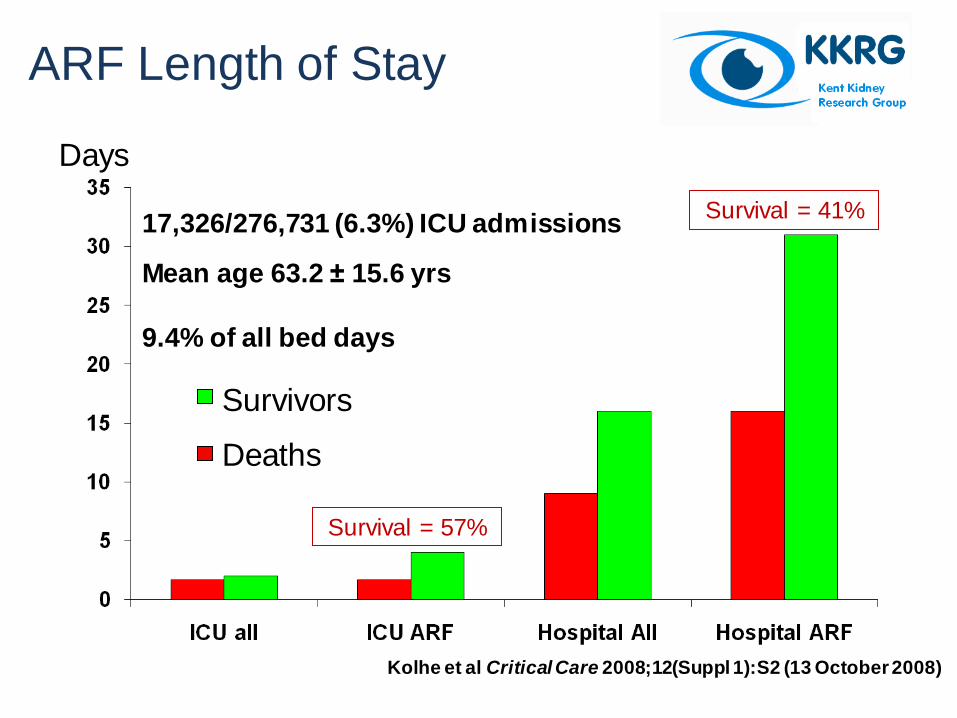
ARF Length of Stay
Days
9.4% of all bed days
Survivors
Deaths
17,326/276,731 (6.3%) ICU admissions
Mean age 63.2 ± 15.6 yrs
Kolhe et al Critical Care 2008;12(Suppl 1):S2 (13 October 2008)
Survival = 57%
Survival = 41%

“Political language is designed to make lies sound
truthful and murder respectable, and to give an
appearance of solidity to pure wind.”
(George Orwell)
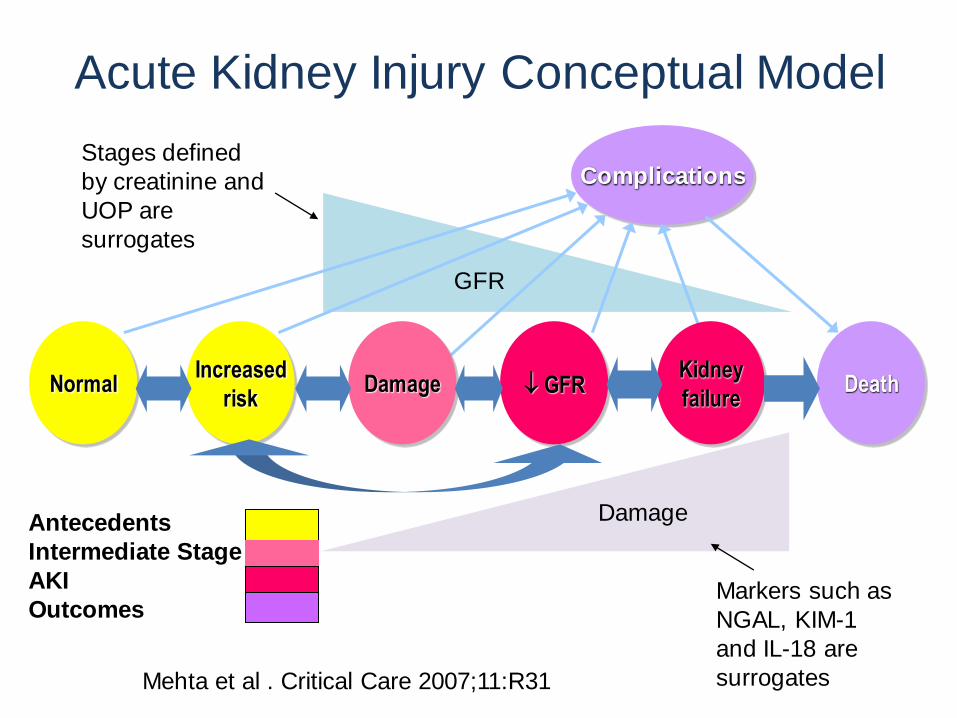
Acute Kidney Injury Conceptual Model
Death
Complications
Normal Increased
risk
Kidney
failure Damage GFR
Antecedents
Intermediate Stage
AKI
Outcomes Markers such as
NGAL, KIM-1
and IL-18 are
surrogates
Damage
GFR
Mehta et al . Critical Care 2007;11:R31
Stages defined
by creatinine and
UOP are
surrogates
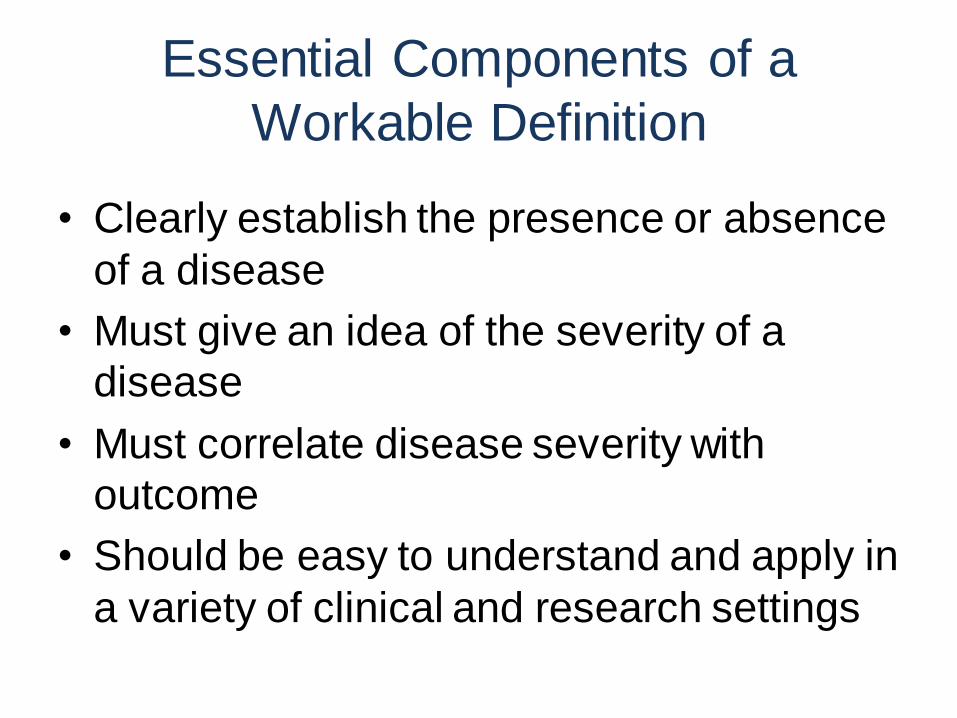
Essential Components of a
Workable Definition
• Clearly establish the presence or absence
of a disease
• Must give an idea of the severity of a
disease
• Must correlate disease severity with
outcome
• Should be easy to understand and apply in
a variety of clinical and research settings
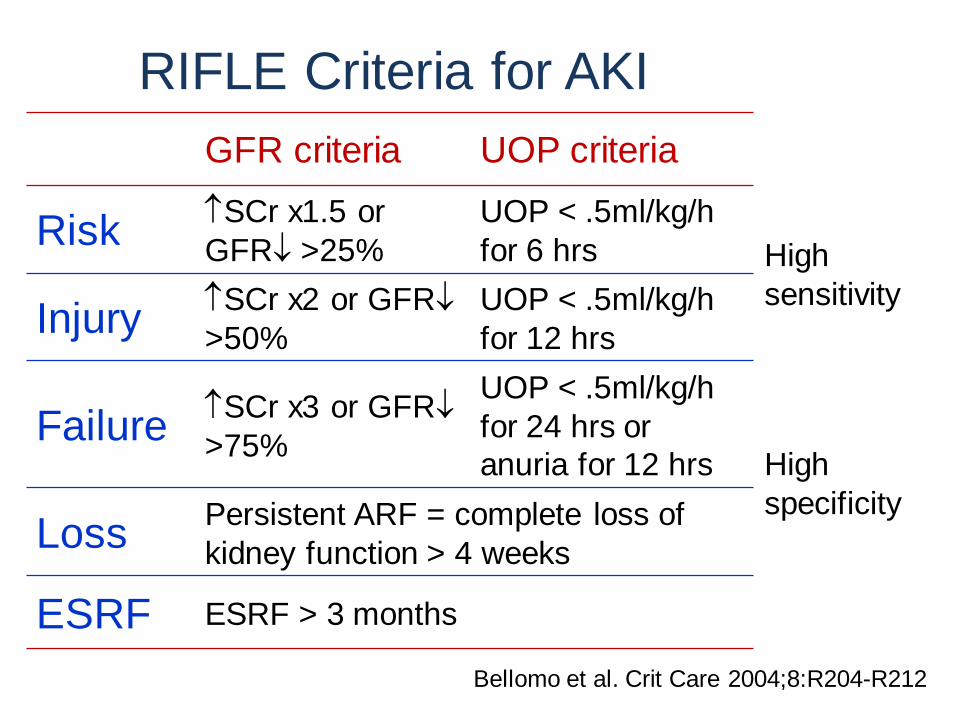
RIFLE Criteria for AKI
GFR criteria UOP criteria
Risk SCr x1.5 or
GFR >25%
UOP < .5ml/kg/h
for 6 hrs High
sensitivity Injury
SCr x2 or GFR
>50%
UOP < .5ml/kg/h
for 12 hrs
Failure SCr x3 or GFR
>75%
UOP < .5ml/kg/h
for 24 hrs or
anuria for 12 hrs High
specificity
Loss Persistent ARF = complete loss of
kidney function > 4 weeks
ESRF ESRF > 3 months
Bellomo et al. Crit Care 2004;8:R204-R212
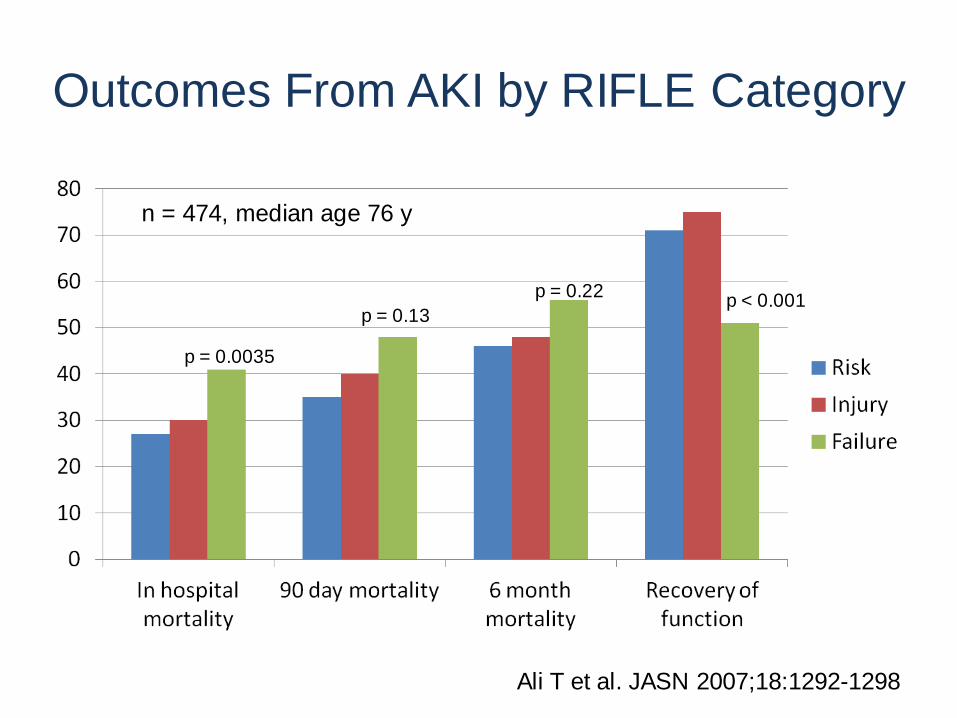
Outcomes From AKI by RIFLE Category
Ali T et al. JASN 2007;18:1292-1298
p = 0.0035
p = 0.13
p = 0.22 p < 0.001
n = 474, median age 76 y

RIFLE and Mortality: Systematic Review
• 24 studies, including over 71,000 patients
• ICU and non-ICU settings
• Stepwise increase in relative risk of death
by RIFLE category versus non-AKI
– Risk 2.40
– Injury 4.15
– Failure 6.37
Ricci et al. Kidney Int 2008;73:538-546
New Developments Have Limitations
• AKI initiation pre-dates SCr & GFR changes
• Urine output confounders
• Baseline SCr
• Small changes in SCr below RIFLE predict
outcomes
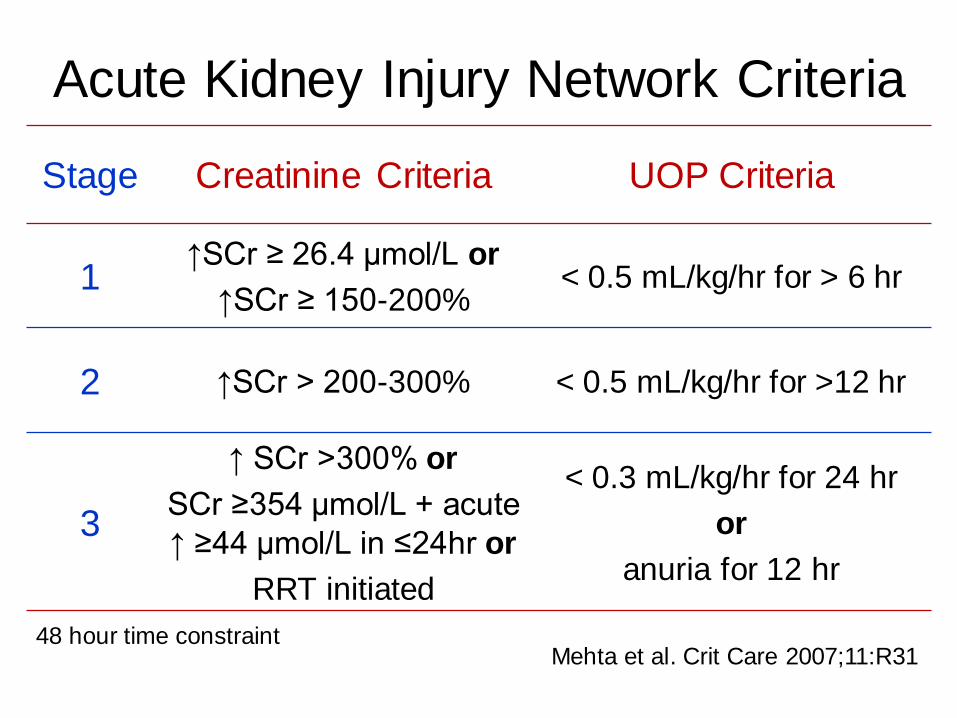
Acute Kidney Injury Network Criteria
Stage Creatinine Criteria UOP Criteria
1 ↑SCr ≥ 26.4 μmol/L or
↑SCr ≥ 150-200% < 0.5 mL/kg/hr for > 6 hr
2 ↑SCr > 200-300% < 0.5 mL/kg/hr for >12 hr
3
↑ SCr >300% or
SCr ≥354 μmol/L + acute
↑ ≥44 μmol/L in ≤24hr or
RRT initiated
< 0.3 mL/kg/hr for 24 hr
or
anuria for 12 hr
Mehta et al. Crit Care 2007;11:R31 48 hour time constraint
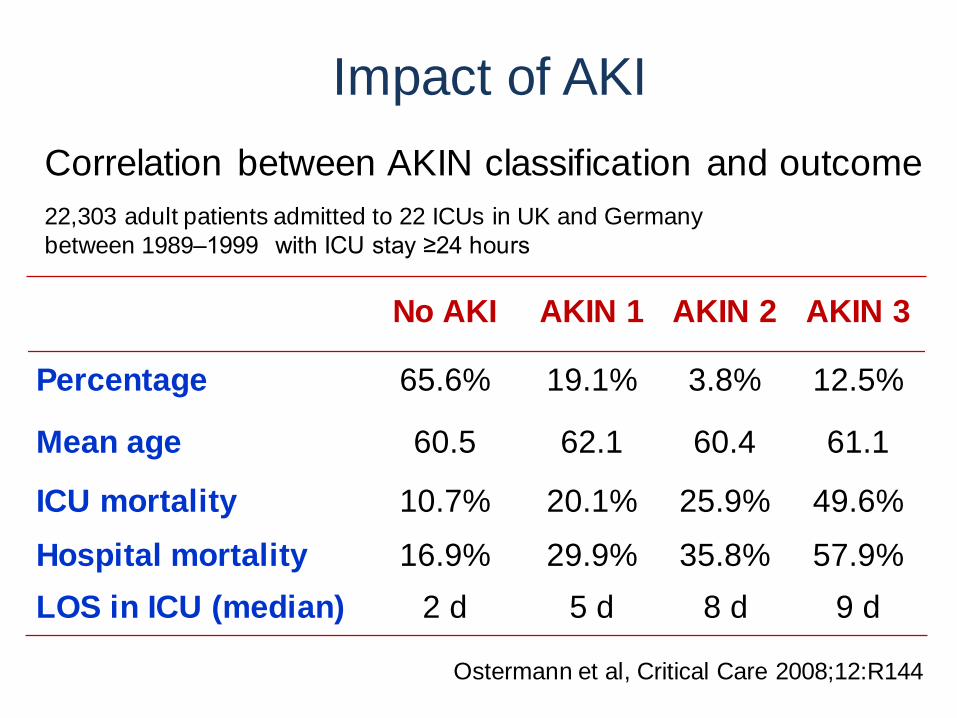
Correlation between AKIN classification and outcome 22,303 adult patients admitted to 22 ICUs in UK and Germany
between 1989–1999 with ICU stay ≥24 hours
Ostermann et al, Critical Care 2008;12:R144
Impact of AKI
No AKI AKIN 1 AKIN 2 AKIN 3
Percentage 65.6% 19.1% 3.8% 12.5%
Mean age 60.5 62.1 60.4 61.1
ICU mortality 10.7% 20.1% 25.9% 49.6%
Hospital mortality 16.9% 29.9% 35.8% 57.9%
LOS in ICU (median) 2 d 5 d 8 d 9 d
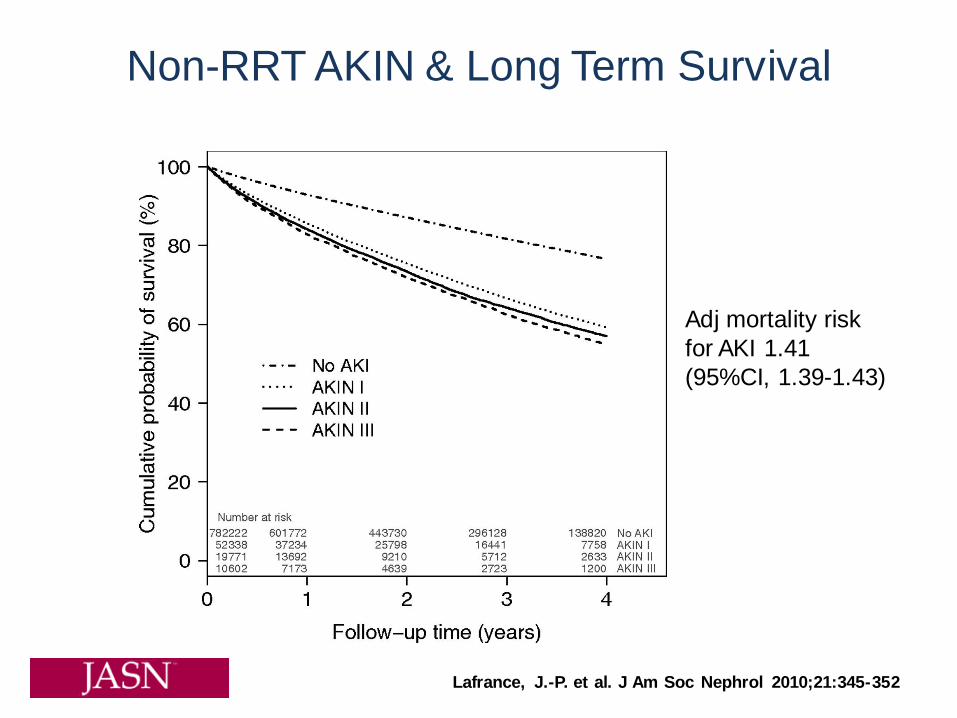
Lafrance, J.-P. et al. J Am Soc Nephrol 2010;21:345-352
Non-RRT AKIN & Long Term Survival
Adj mortality risk
for AKI 1.41
(95%CI, 1.39-1.43)
RIFLE or AKIN?
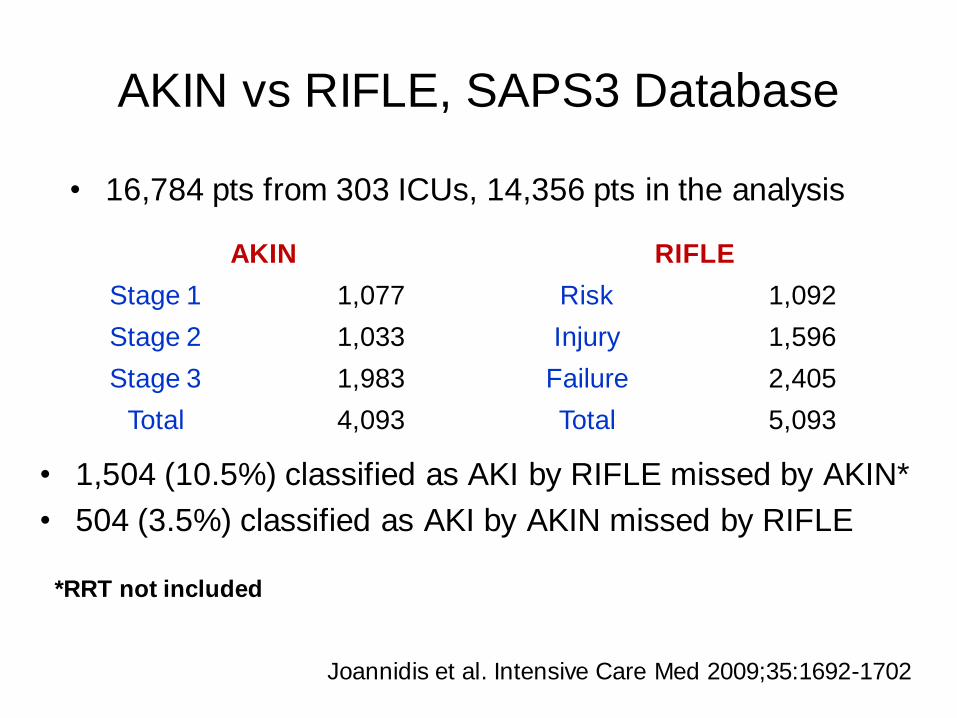
AKIN vs RIFLE, SAPS3 Database
AKIN RIFLE
Stage 1 1,077 Risk 1,092
Stage 2 1,033 Injury 1,596
Stage 3 1,983 Failure 2,405
Total 4,093 Total 5,093
• 16,784 pts from 303 ICUs, 14,356 pts in the analysis
• 1,504 (10.5%) classified as AKI by RIFLE missed by AKIN*
• 504 (3.5%) classified as AKI by AKIN missed by RIFLE
Joannidis et al. Intensive Care Med 2009;35:1692-1702
*RRT not included
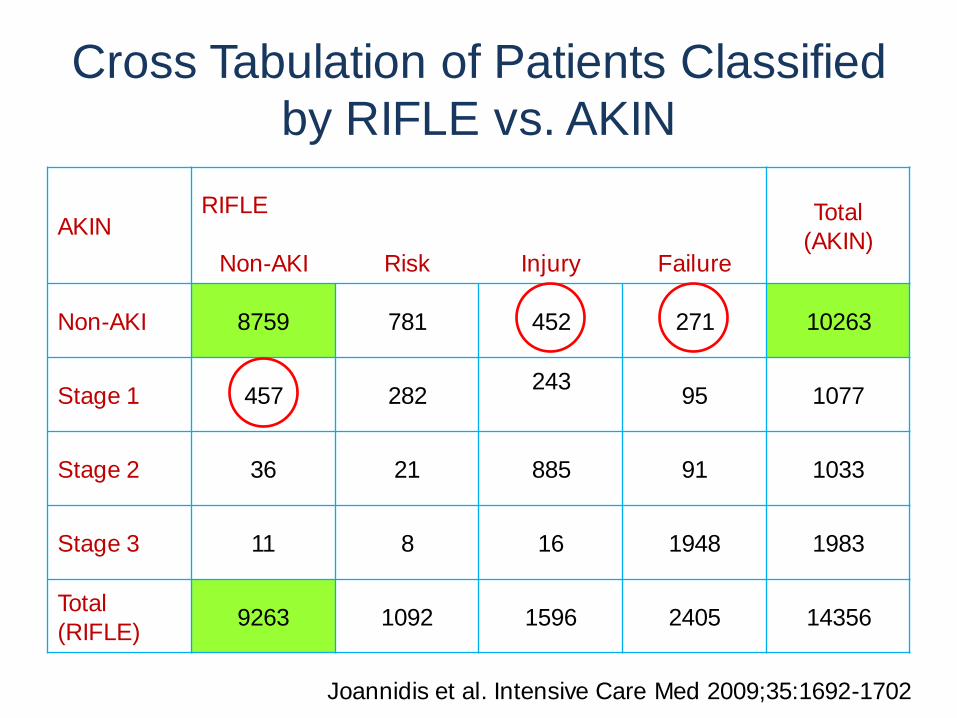
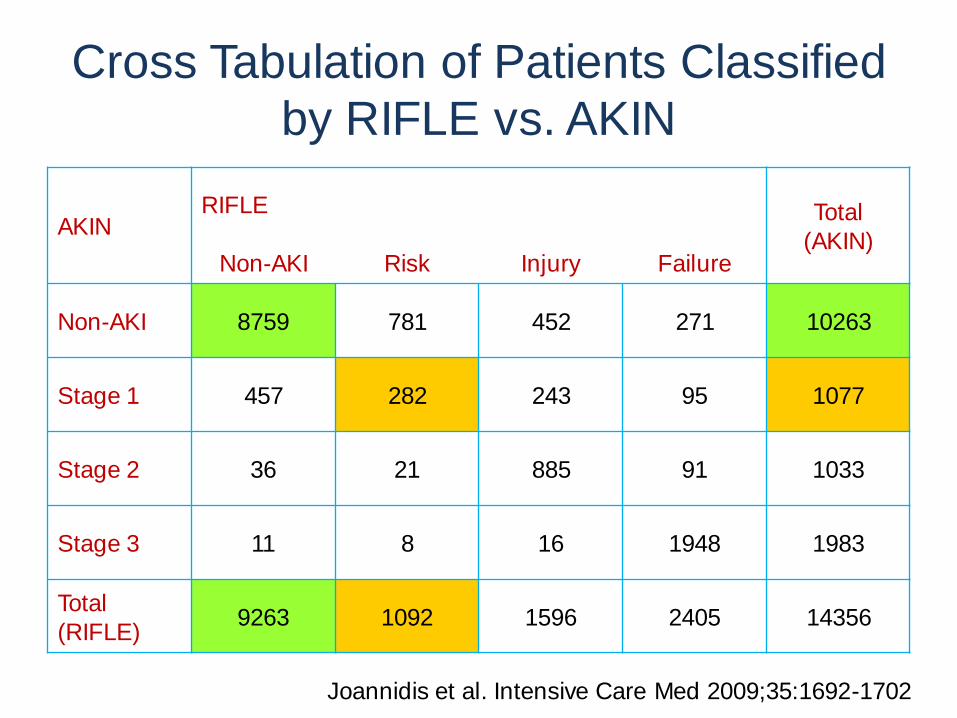
Cross Tabulation of Patients Classified
by RIFLE vs. AKIN
AKIN RIFLE Total
(AKIN) Non-AKI Risk Injury Failure
Non-AKI 8759 781 452 271 10263
Stage 1 457 282 243
95 1077
Stage 2 36 21 885 91 1033
Stage 3 11 8 16 1948 1983
Total
(RIFLE) 9263 1092 1596 2405 14356
Joannidis et al. Intensive Care Med 2009;35:1692-1702
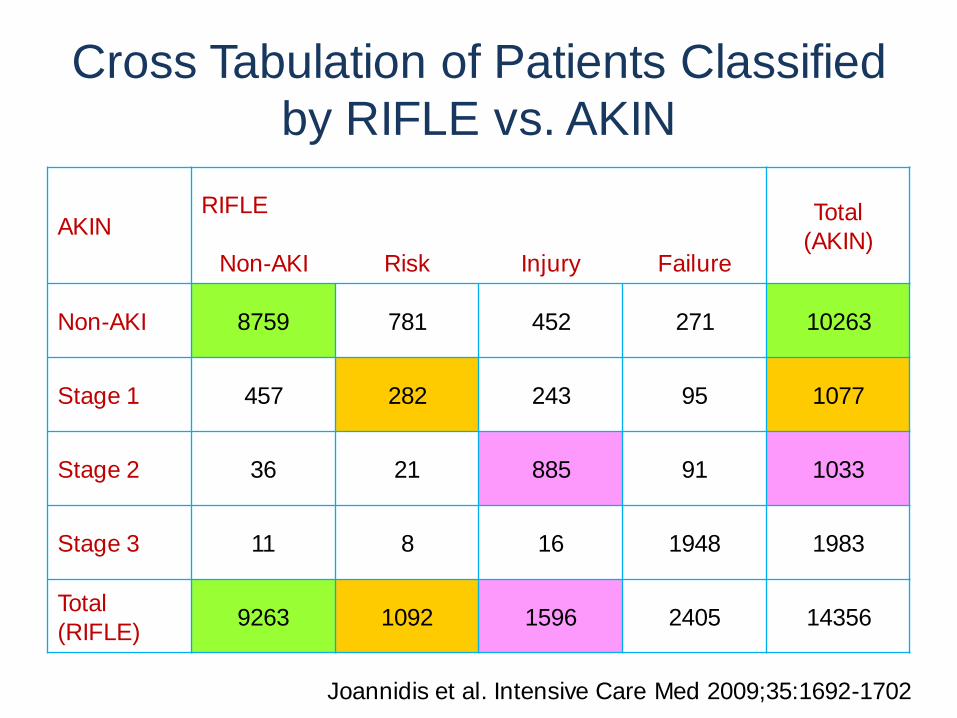
Cross Tabulation of Patients Classified
by RIFLE vs. AKIN
AKIN RIFLE Total
(AKIN) Non-AKI Risk Injury Failure
Non-AKI 8759 781 452 271 10263
Stage 1 457 282 243 95 1077
Stage 2 36 21 885 91 1033
Stage 3 11 8 16 1948 1983
Total
(RIFLE) 9263 1092 1596 2405 14356
Joannidis et al. Intensive Care Med 2009;35:1692-1702
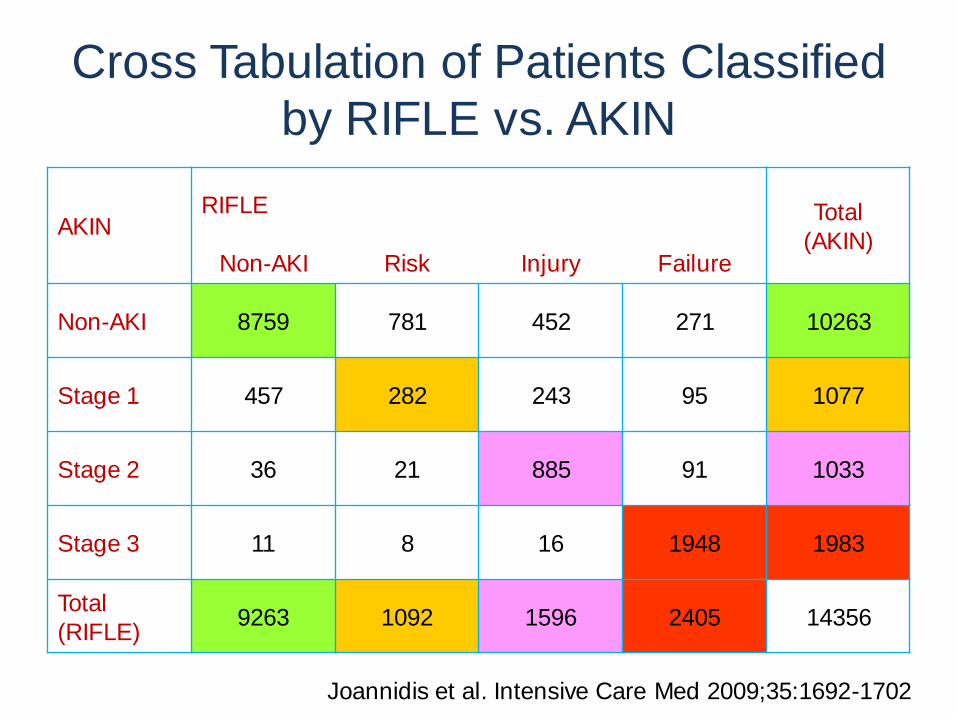
Cross Tabulation of Patients Classified
by RIFLE vs. AKIN
AKIN RIFLE Total
(AKIN) Non-AKI Risk Injury Failure
Non-AKI 8759 781 452 271 10263
Stage 1 457 282 243 95 1077
Stage 2 36 21 885 91 1033
Stage 3 11 8 16 1948 1983
Total
(RIFLE) 9263 1092 1596 2405 14356
Joannidis et al. Intensive Care Med 2009;35:1692-1702
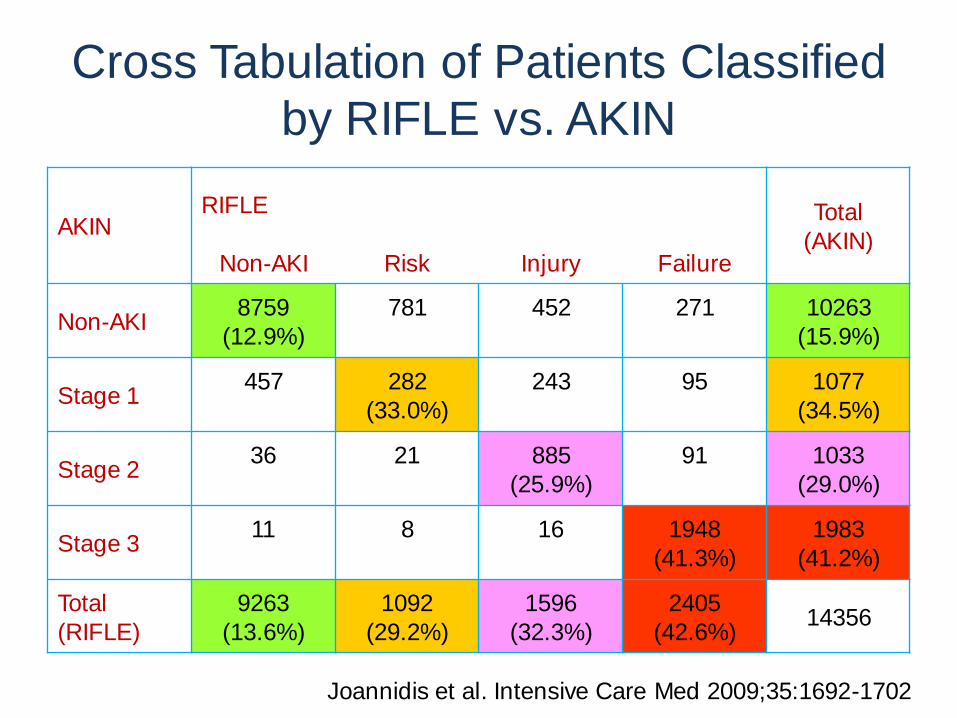
Cross Tabulation of Patients Classified
by RIFLE vs. AKIN
AKIN RIFLE Total
(AKIN) Non-AKI Risk Injury Failure
Non-AKI 8759
(12.9%)
781
452
271
10263
(15.9%)
Stage 1 457
282
(33.0%)
243
95
1077
(34.5%)
Stage 2 36
21
885
(25.9%)
91
1033
(29.0%)
Stage 3 11
8
16
1948
(41.3%)
1983
(41.2%)
Total
(RIFLE)
9263
(13.6%)
1092
(29.2%)
1596
(32.3%)
2405
(42.6%) 14356
Joannidis et al. Intensive Care Med 2009;35:1692-1702
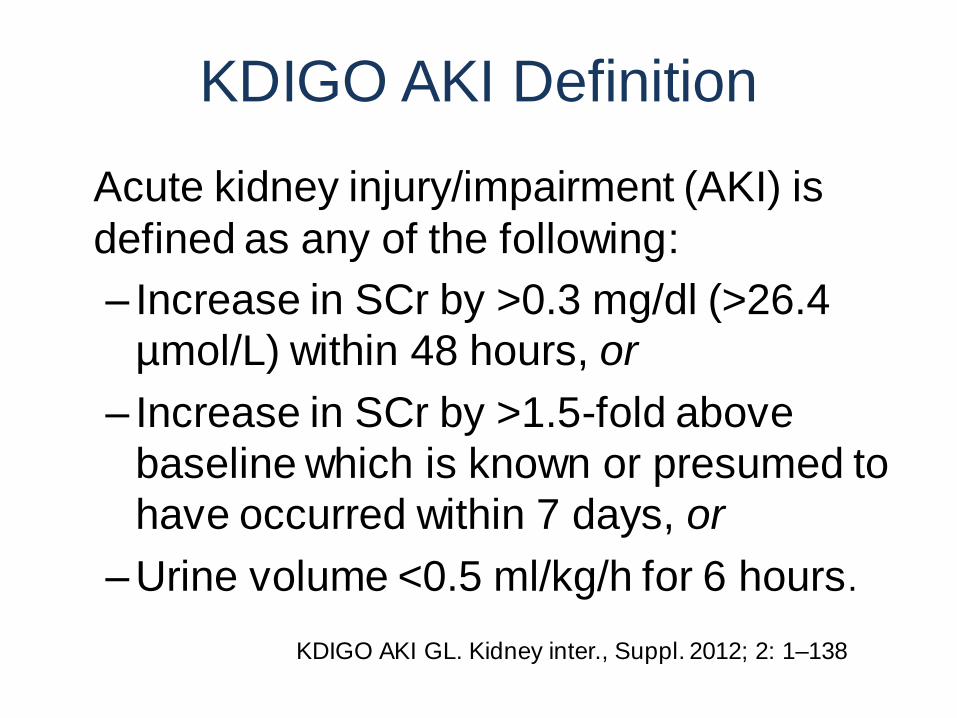
KDIGO AKI Definition
• Acute kidney injury/impairment (AKI) is
defined as any of the following:
– Increase in SCr by >0.3 mg/dl (>26.4
µmol/L) within 48 hours, or
– Increase in SCr by >1.5-fold above
baseline which is known or presumed to
have occurred within 7 days, or
– Urine volume <0.5 ml/kg/h for 6 hours.
KDIGO AKI GL. Kidney inter., Suppl. 2012; 2: 1–138
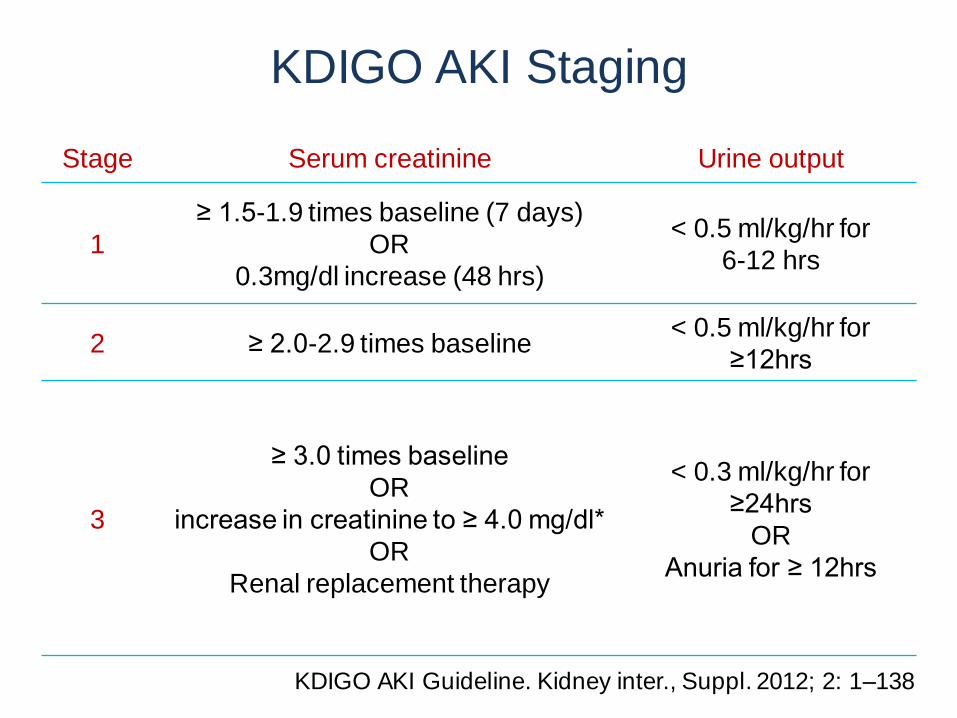
KDIGO AKI Staging
Stage Serum creatinine Urine output
1
≥ 1.5-1.9 times baseline (7 days)
OR
0.3mg/dl increase (48 hrs)
< 0.5 ml/kg/hr for
6-12 hrs
2 ≥ 2.0-2.9 times baseline < 0.5 ml/kg/hr for
≥12hrs
3
≥ 3.0 times baseline
OR
increase in creatinine to ≥ 4.0 mg/dl*
OR
Renal replacement therapy
< 0.3 ml/kg/hr for
≥24hrs
OR
Anuria for ≥ 12hrs
KDIGO AKI Guideline. Kidney inter., Suppl. 2012; 2: 1–138
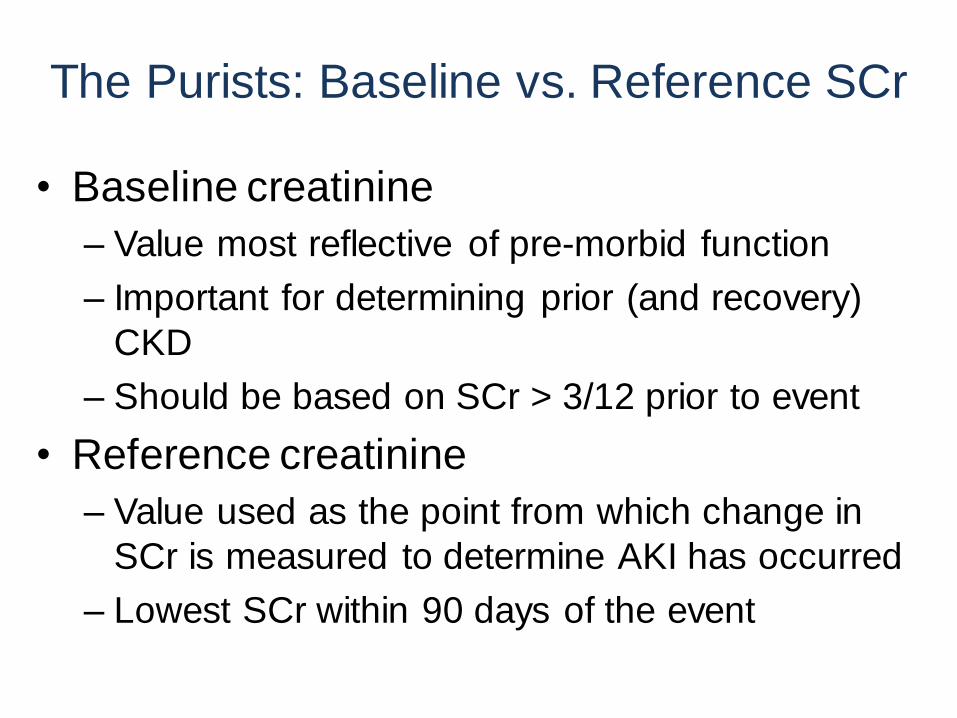
The Purists: Baseline vs. Reference SCr
• Baseline creatinine
– Value most reflective of pre-morbid function
– Important for determining prior (and recovery)
CKD
– Should be based on SCr > 3/12 prior to event
• Reference creatinine
– Value used as the point from which change in
SCr is measured to determine AKI has occurred
– Lowest SCr within 90 days of the event
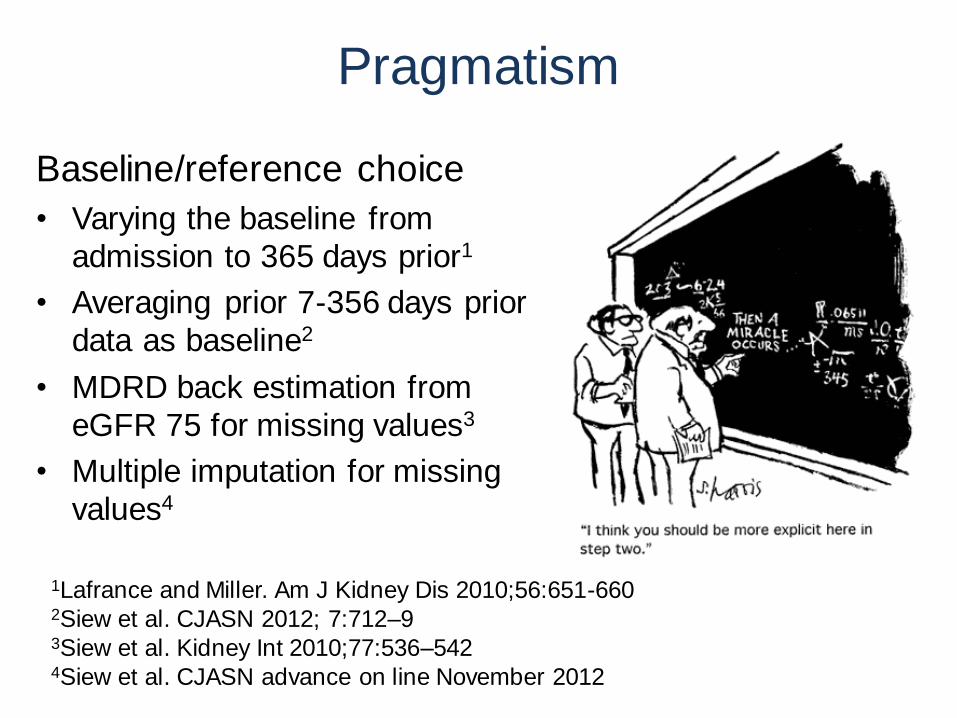
Pragmatism
Baseline/reference choice
• Varying the baseline from
admission to 365 days prior1
• Averaging prior 7-356 days prior
data as baseline2
• MDRD back estimation from
eGFR 75 for missing values3
• Multiple imputation for missing
values4
1Lafrance and Miller. Am J Kidney Dis 2010;56:651-660 2Siew et al. CJASN 2012; 7:712–9 3Siew et al. Kidney Int 2010;77:536–542 4Siew et al. CJASN advance on line November 2012

Urine Output Criteria
• May over-estimate severity
• Issues with diuretics
• UOP may be reduced early
in pre-renal azotaemia but
late in the course of
established AKI
• Issues with measurement
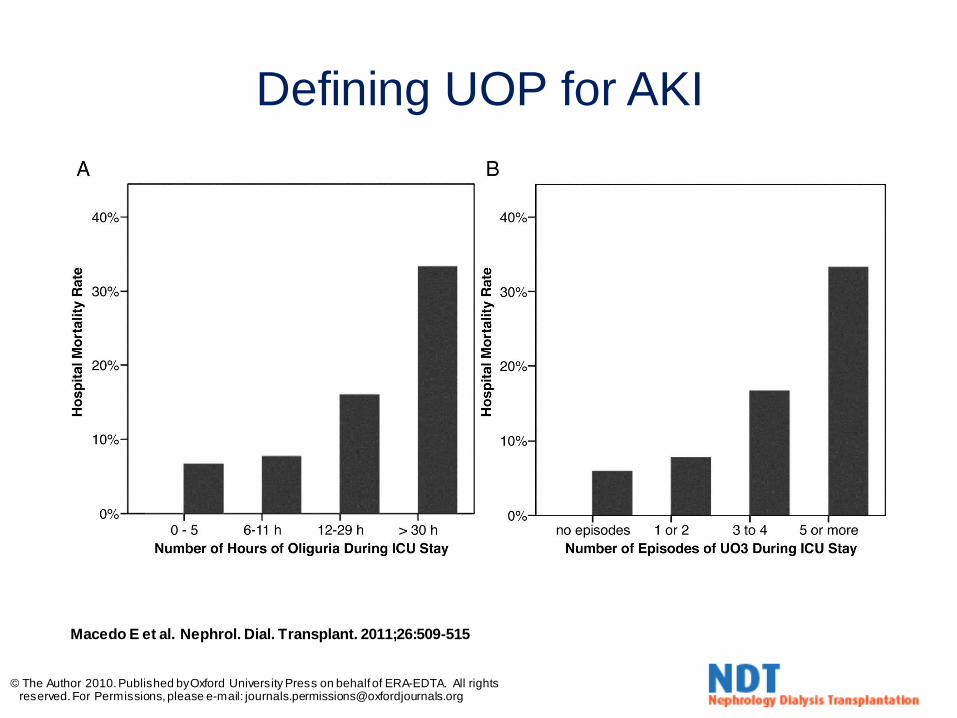
Macedo E et al. Nephrol. Dial. Transplant. 2011;26:509-515
© The Author 2010. Published by Oxford University Press on behalf of ERA-EDTA. All rights reserved. For Permissions, please e-mail: [email protected]
Defining UOP for AKI
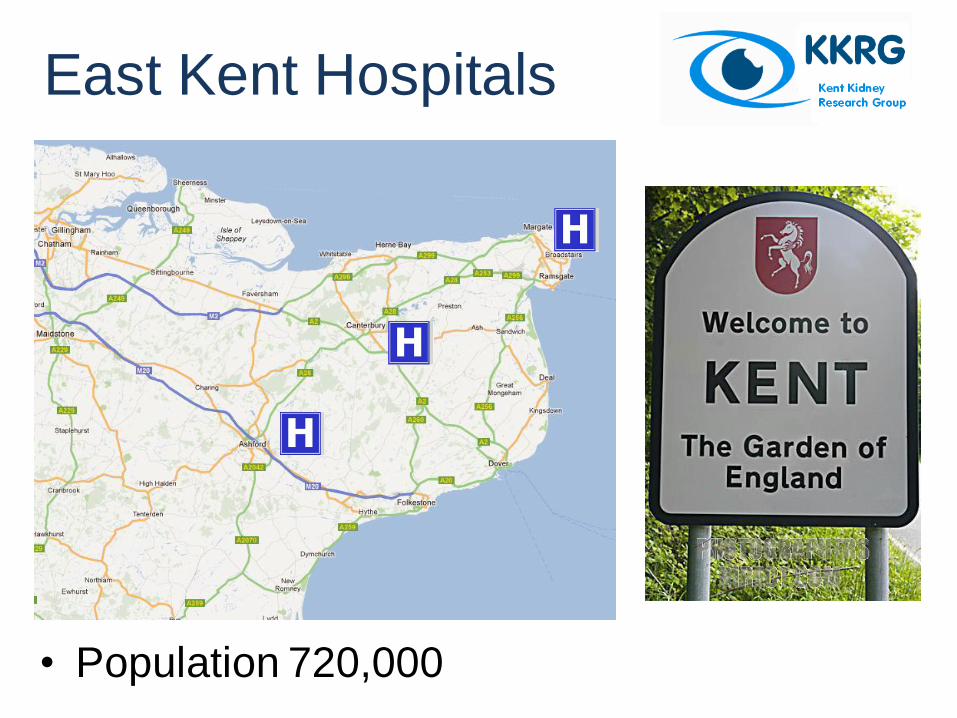
East Kent Hospitals
• Population 720,000
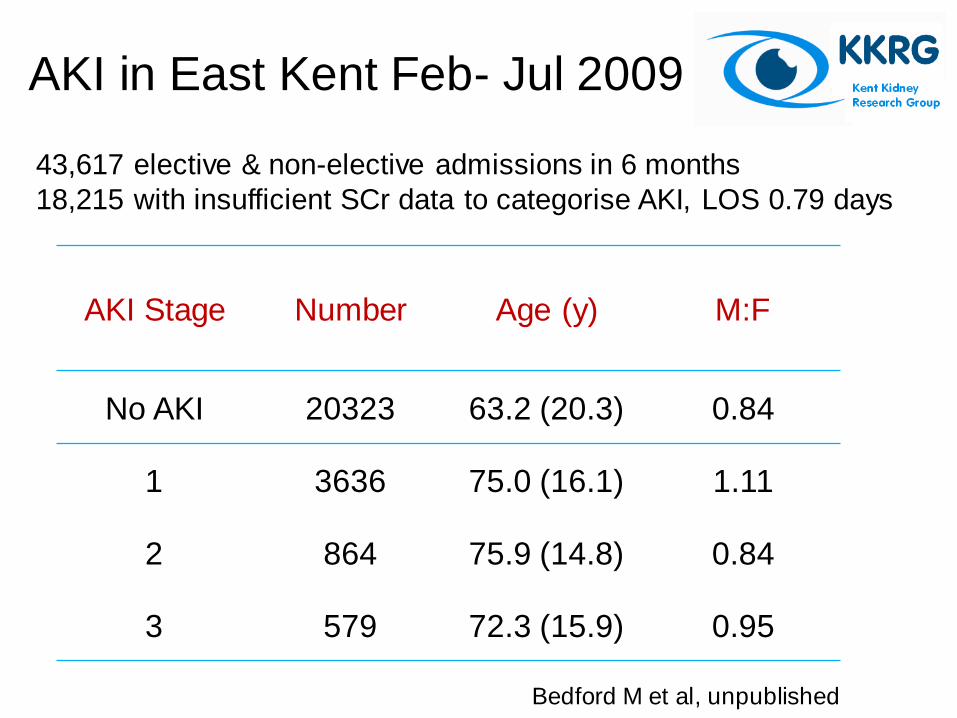
AKI Stage Number Age (y) M:F
No AKI 20323 63.2 (20.3) 0.84
1 3636 75.0 (16.1) 1.11
2 864 75.9 (14.8) 0.84
3 579 72.3 (15.9) 0.95
AKI in East Kent Feb- Jul 2009
43,617 elective & non-elective admissions in 6 months
18,215 with insufficient SCr data to categorise AKI, LOS 0.79 days
Bedford M et al, unpublished
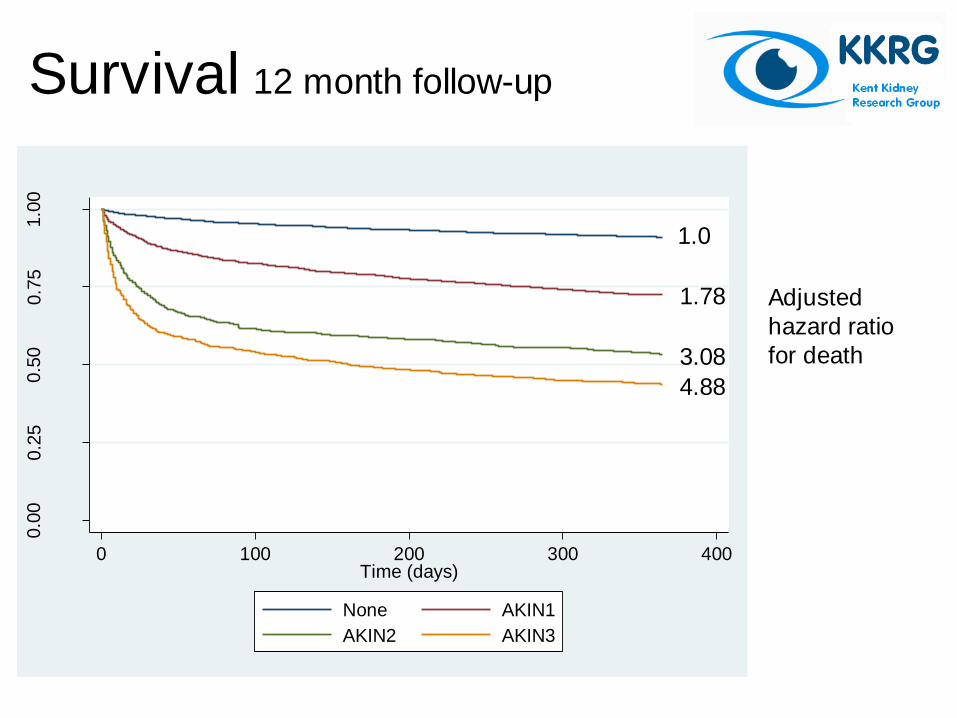
Survival 12 month follow-up
0.0
00.2
50.5
00.7
51.0
0
Pro
port
ion s
urv
ived
0 100 200 300 400Time (days)
None AKIN1
AKIN2 AKIN3
1.0
4.88
3.08
1.78 Adjusted
hazard ratio
for death
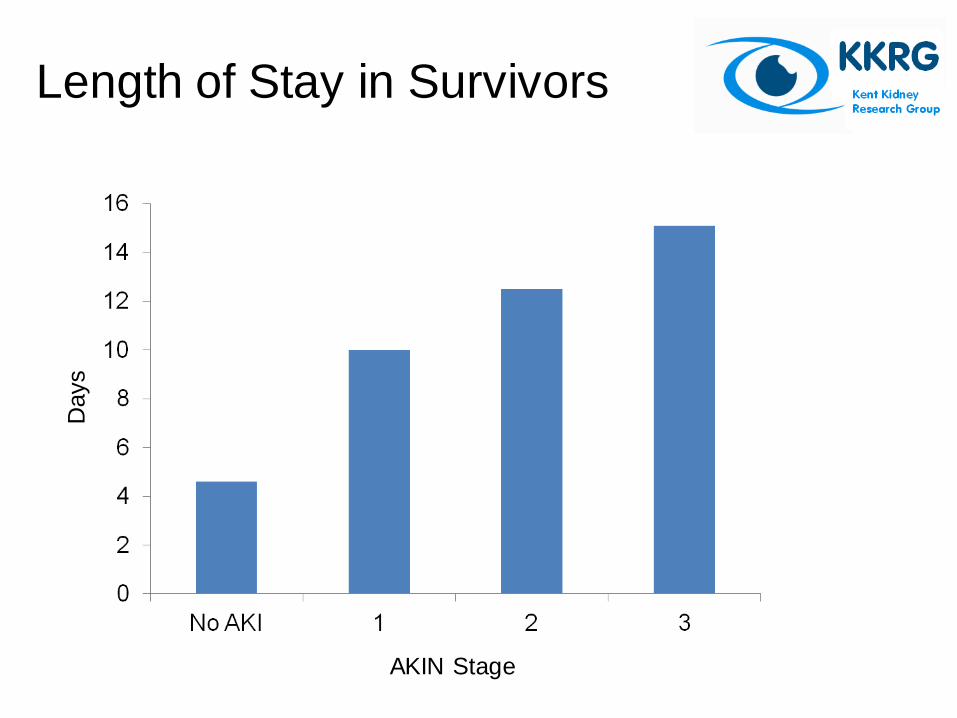
Length of Stay in Survivors
Days
AKIN Stage
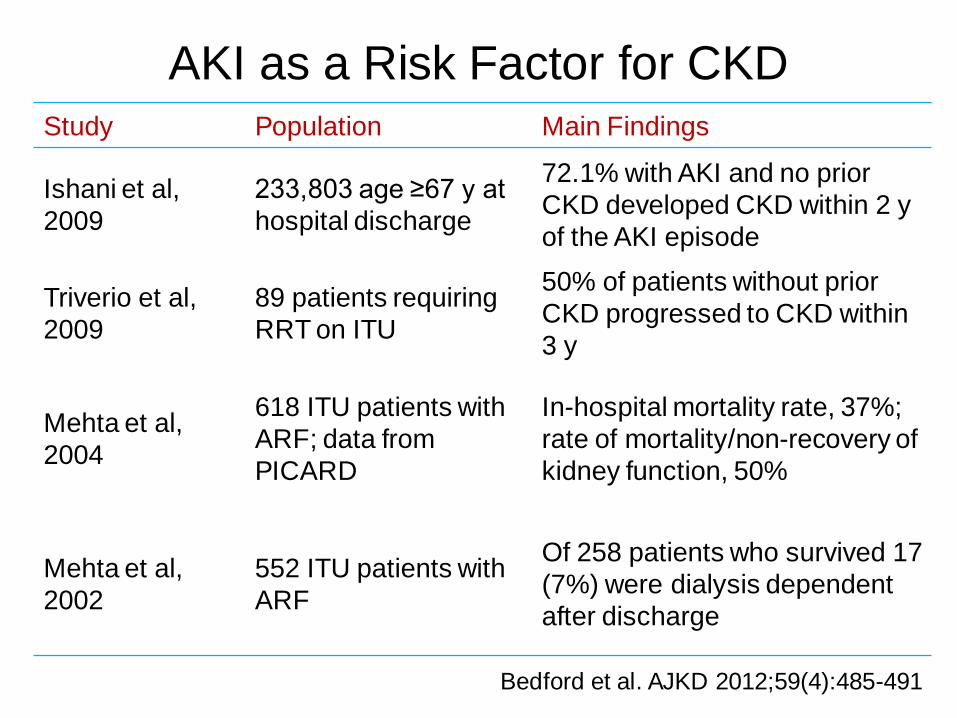
AKI as a Risk Factor for CKD Study Population Main Findings
Ishani et al,
2009
233,803 age ≥67 y at
hospital discharge
72.1% with AKI and no prior
CKD developed CKD within 2 y
of the AKI episode
Triverio et al,
2009
89 patients requiring
RRT on ITU
50% of patients without prior
CKD progressed to CKD within
3 y
Mehta et al,
2004
618 ITU patients with
ARF; data from
PICARD
In-hospital mortality rate, 37%;
rate of mortality/non-recovery of
kidney function, 50%
Mehta et al,
2002
552 ITU patients with
ARF
Of 258 patients who survived 17
(7%) were dialysis dependent
after discharge
Bedford et al. AJKD 2012;59(4):485-491
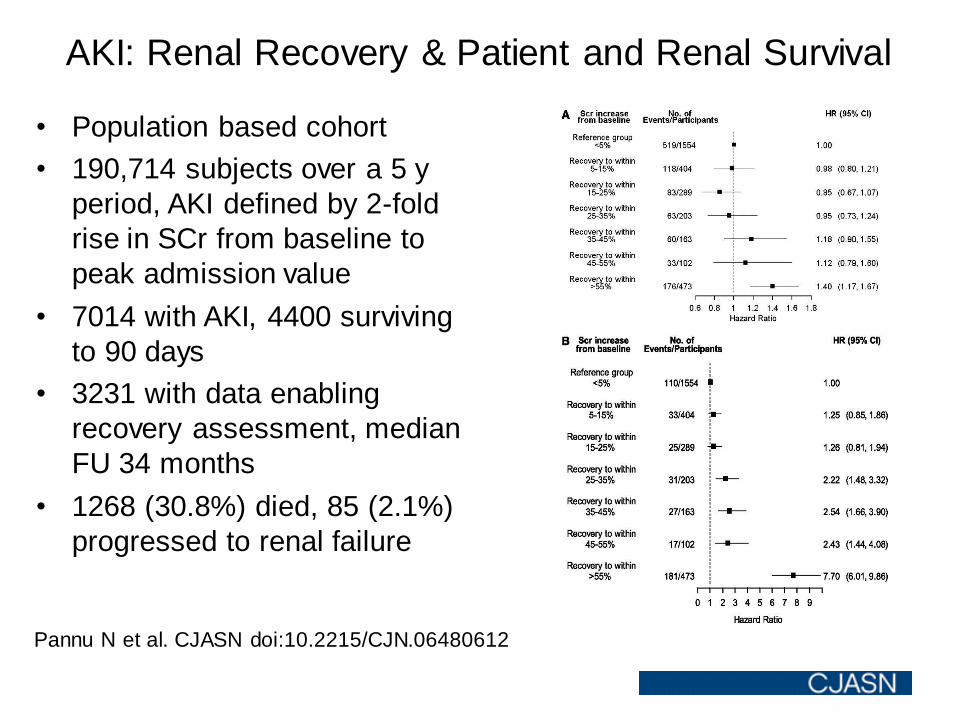
AKI: Renal Recovery & Patient and Renal Survival
Pannu N et al. CJASN doi:10.2215/CJN.06480612
• Population based cohort
• 190,714 subjects over a 5 y
period, AKI defined by 2-fold
rise in SCr from baseline to
peak admission value
• 7014 with AKI, 4400 surviving
to 90 days
• 3231 with data enabling
recovery assessment, median
FU 34 months
• 1268 (30.8%) died, 85 (2.1%)
progressed to renal failure

“Now that’s what I call an APACHE Score!”
Scoring Systems
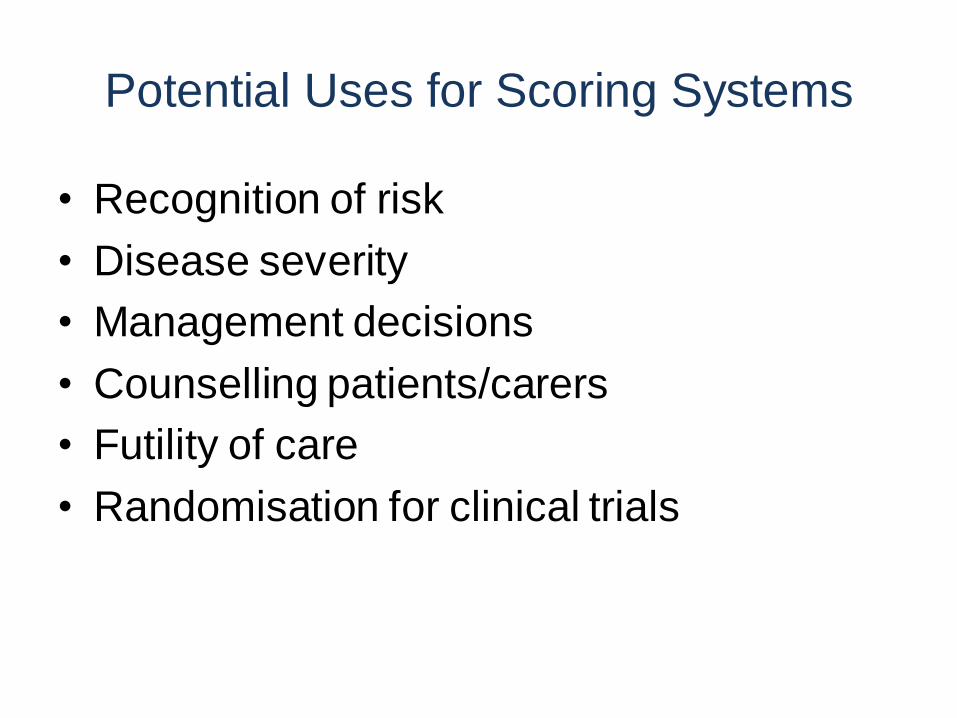
Potential Uses for Scoring Systems
• Recognition of risk
• Disease severity
• Management decisions
• Counselling patients/carers
• Futility of care
• Randomisation for clinical trials
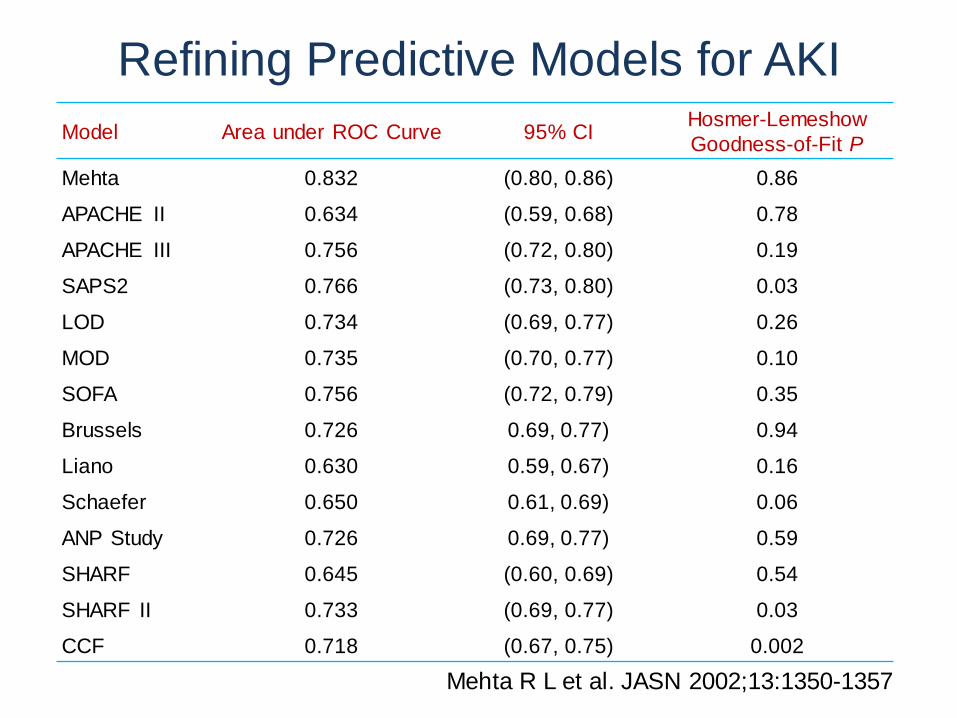
Model Area under ROC Curve 95% CI Hosmer-Lemeshow
Goodness-of-Fit P
Mehta 0.832 (0.80, 0.86) 0.86
APACHE II 0.634 (0.59, 0.68) 0.78
APACHE III 0.756 (0.72, 0.80) 0.19
SAPS2 0.766 (0.73, 0.80) 0.03
LOD 0.734 (0.69, 0.77) 0.26
MOD 0.735 (0.70, 0.77) 0.10
SOFA 0.756 (0.72, 0.79) 0.35
Brussels 0.726 0.69, 0.77) 0.94
Liano 0.630 0.59, 0.67) 0.16
Schaefer 0.650 0.61, 0.69) 0.06
ANP Study 0.726 0.69, 0.77) 0.59
SHARF 0.645 (0.60, 0.69) 0.54
SHARF II 0.733 (0.69, 0.77) 0.03
CCF 0.718 (0.67, 0.75) 0.002
Refining Predictive Models for AKI
Mehta R L et al. JASN 2002;13:1350-1357
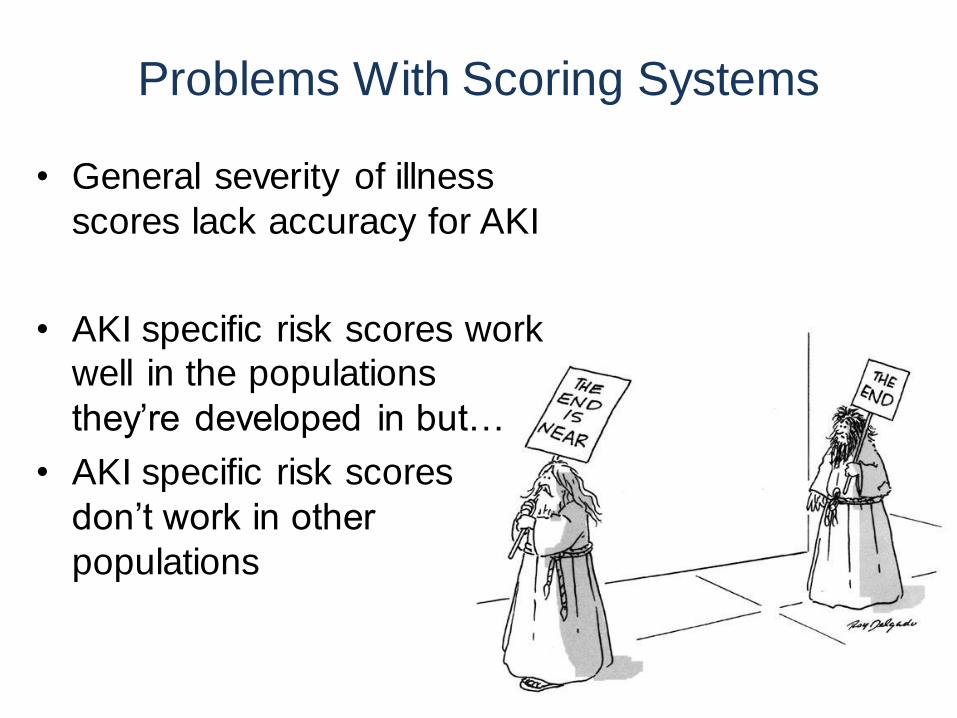
Problems With Scoring Systems
• General severity of illness
scores lack accuracy for AKI
• AKI specific risk scores work
well in the populations
they’re developed in but…
• AKI specific risk scores
don’t work in other
populations
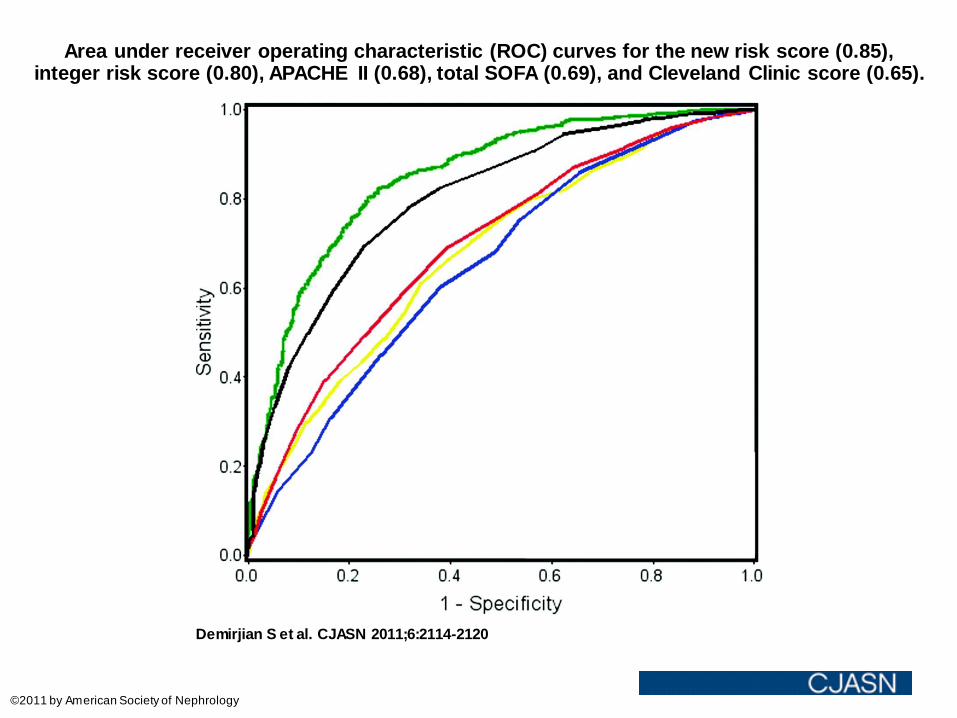
Area under receiver operating characteristic (ROC) curves for the new risk score (0.85), integer risk score (0.80), APACHE II (0.68), total SOFA (0.69), and Cleveland Clinic score (0.65).
Demirjian S et al. CJASN 2011;6:2114-2120
©2011 by American Society of Nephrology
“Sometimes I think why am I here? What’s the point?”
Conclusions
• AKI is very common
• With standardised definitions we
recognise that even minor
degrees of AKI confer adverse
outcomes
– ↑hospital LOS
– ↑hospital & long-term mortality
– subsequent new onset CKD
and progression of prior CKD
• Scoring systems would be good if
they really worked
• If we could predict could we
prevent? Ask Lui
“Marlies, I would have concentrated on the facts, but they weren’t in my favour!”

Acknowledgements
• Air Commodore David Rainford
• Dr Chris Farmer
• Jean Irving
• Helen Hobbs
• Toby Wheeler
• Dr Hannah Kilbride
• Dr Michael Bedford