acute illness effect symptoms - bmj
TRANSCRIPT

British Journal of Preventive and Social Medicine, 1977, 31, 101-108
Acute respiratory illness in the community:Effect of family composition, smoking, andchronic symptoms
ARNOLD S. MONTO AND HELEN ROSSFrom the Department of Epidemiology, School of Public Health, University of Michigan
SUMMARY Respiratory illness and infection was studied in the community of Tecumseh, Michigan,USA, during a six-year period. Acute illness was ascertained by making weekly telephone calls,and prevalent agents were identified by microbial isolation. Infection rates were determinedserologically using blood specimens collected routinely at six monthly intervals from those reportedto be ill. Illness rates were higher in the youngest children of families up to the age of three years
than for the oldest children of the same ages. Above the age of three, the pattern was reversed.Among the adults, rates of illness were shown to relate not only to the presence, but also to theage of children in the home. Throughout this comparison, women were more likely to be ill thanmen in the same groups. Smoking in itself was not related to increased acute respiratory illnesses,but persons with symptoms of chronic bronchitis were found to have higher illness rates indepen-dently of whether they smoked.
Acute respiratory infections are the most commonconditions affecting the American population(United States Public Health Service, 1973). Theyhave thus far defied efforts at control and moreknowledge of their incidence and aetiology isneeded. To define factors involved in the occurrenceof such illnesses in an ordinary community setting, alongitudinal study was carried out in Tecumseh,Michigan, USA (Monto et al., 1971; Monto andCavallaro, 1971). Certain results have been describedpreviously; among them were the observations thatinfant boys had the highest rates of acute illness,and that illness rates decreased as families gotricher but increased as they became bettereducated (Monto and Ullman, 1974). In the currentreport further data on illness and infection inTecumseh are presented. Of particular interest isthe relationship of illnesses to cigarette smokingand symptoms of chronic bronchitis, and theinfluence of family composition on disease fre-quency.
Methods
RECRUITMENT AND SURVEILLANCEThe study of the Tecumseh community has beendescribed in detail (Monto et al., 1971; Monto and
Ullman, 1974). The population of the study areawas 10000. Surveillance and viral isolation tookplace during a six-year period from 1966 to 1971.After all dwelling units had been identified,households were systematically recruited, andinformation on family income and educationallevel of head of household and spouse wasobtained directly from a representative of eachfamily; 73*9% of those approached agreed toparticipate in the programme. The period ofsurveillance was one year, after which the householdwas replaced by a newly recruited family. Recruit-ment was carried out gradually, so a completeturnover did not occur. The aim throughout was tomaintain a total of 1000 individuals on surveillance.Once within the programme, 86 3% of individualscontinued to participate for 46 weeks or longer.
After recruitment, any acute illness in a familywas reported. Weekly contacts were made bytelephone, or in the few instances where the familydid not have a telephone, by personal visit. Ineither case, the household respondent was asked ifthere had been any respiratory illness in the familyduring the previous week. Details of illnesses wereobtained so that those that were respiratory couldbe identified and classified as belonging to one offive syndromes. After the initial report, the
101
copyright. on M
arch 23, 2022 by guest. Protected by
http://jech.bmj.com
/B
r J Prev S
oc Med: first published as 10.1136/jech.31.2.101 on 1 June 1977. D
ownloaded from

Arnold S. Monto and Helen Ross
household was contacted regularly, and therespondent asked if the illness still persisted. If theillness had ended, the date it had finished was
obtained. Data were also collected throughout on
development of illness in other family members.
MICROBIOLOGICAL METHODSSpecimens for microbial isolation were collectedwithin two days of onset from those in whom illnesswas reported. In all cases, a cotton swab was used tocollect secretions from the oropharynx, and if nasaldischarge was present an additional nasal swab was
obtained. Material collected from one person was
pooled in a single vial of veal infusion broth andtaken to the laboratory on the same day.Specimens were inoculated into tubes of W1-38,primary rhesus monkey kidney and HL cells forisolation of the virus. Diphasic cultures were usedfor isolating the mycoplasma, and sheep blood agar
plates to identify the haemolytic streptococci.Isolates were identified by standard procedures(Monto and Cavallaro, 1971).Blood specimens were collected routinely from
each family at the time of recruitment, after sixmonths, and after one year (at the end of the studyperiod). As recruitment and replacement ofhouseholds was carried out continuously, thesesera were collected all the year round (Monto andLim, 1971). All specimens collected from a
randomly-selected subset of households were testedto identify infection through detection of fourfoldrises in antibody titre. Complement-fixation testswere run with respiratory syncytial (RS) virus andMycoplasma pneumoniae antigens. Haemagglutina-tion-inhibition (HI) tests were used for the type Aand the type B influenza strains prevalent in thecommunity at the time of serum collection, and forparainfluenza types 1, 2, and 3. It is known thatcross-reactions are common among the para-
influenzaviruses and, therefore, for the analysisof these results, it was conservatively assumed thatan increase in titre for more than one type repre-sented a single infection (Monto, 1973). To obtain anapproximate overall infection rate for individualsduring their year of surveillance, data for theparainfluenzaviruses and from the four otherserological tests were pooled by combining numera-
tors (numbers of rises in titre) and denominators(number of persons studied) from the individualtests.
CLASSIFICATION OF SYMPTOMS OF COUGHAND SPUTUM PRODUCTIONS AND OF
CIGARETTE SMOKINGDuring the last two years of the study adultparticipants were asked three times, at six-monthly
intervals, using a modification of the MedicalResearch Council's questionnaire, to describe anysymptoms of chronic cough and sputum they mighthave, and the number of cigarettes smoked daily.At the end of the surveillance year, the threereports obtained from each individual were sum-marised. The method used was to assign numericaldesignations to different levels of symptoms, or ofcigarette use in the individual reports, and then toadd the three to produce an index.The usual presence of cough and sputum produc-
tion for three months or more of the year has beenaccepted as the standard definition of chronicbronchitis and was so adopted in this study (Montoet al., 1975). Those reporting the symptoms butwith insufficient persistence were classed as suspectbronchitics. In each of the three reports, suspectbronchitis was given a value of 1, bronchitis avalue of 2, and no symptoms 0. After the figures inthree reports had been added together, those with atotal of 0 to 2 were placed in bronchitis class 1,those with 3 to 5 in bronchitis class 2, and thosewith 6 (bronchitis on all three occasions) in class 3.Similarly those who, in a single report, did notreport smoking cigarettes were given a value of 0,those who smoked less than a pack a day weregiven 1, those who smoked at least a pack butless than a pack and a half a day were designated2, and those who smoked more than that amountwere assigned 3. After summing all three reports,individuals with totals of 0 were placed in thenon-smoking category, those with 1 to 3 in the lightsmoking category, those with 4 to 6 in the moderatesmoking category, and those with 7 to 9 in the heavysmoking category.
Results
EFFECT OF FAMILY COMPOSITION ON
ILLNESS RATESAge and sex have been shown to play an importantrole in determining the number of acute respiratoryillnesses an individual may experience (Lidwell andSommerville, 1951; Dingle et al., 1964). Inpreviously reported analyses of data from theTecumseh community, as a child grew older he hadfewer acute respiratory illnesses during the year,ranging from a high of 6 1 in those younger thanone year to 2 4 in those between 15 and 19 yearsof age (Monto and Ullman, 1974). Young boys hadhigher rates of illness than girls until the age ofthree at which point the girls began to experiencemore frequent illnesses. Other variables of familycomposition have now been examined to determinetheir relationship to illness. Among children,position in the family was as important as sex in
102
copyright. on M
arch 23, 2022 by guest. Protected by
http://jech.bmj.com
/B
r J Prev S
oc Med: first published as 10.1136/jech.31.2.101 on 1 June 1977. D
ownloaded from
Acute respiratory illness in the community
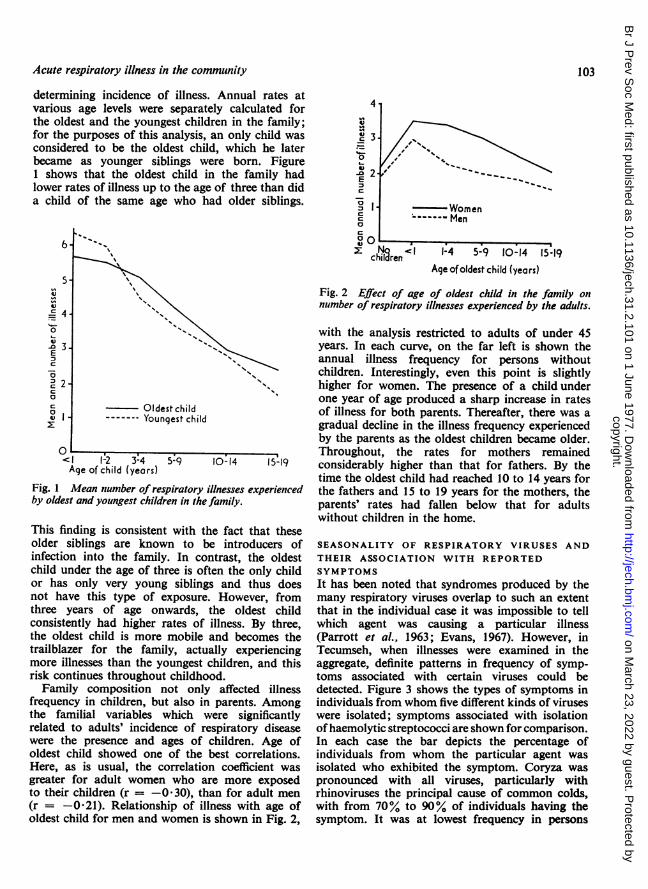
determining incidence of illness. Annual rates atvarious age levels were separately calculated forthe oldest and the youngest children in the family;for the purposes of this analysis, an only child wasconsidered to be the oldest child, which he laterbecame as younger siblings were born. Figure1 shows that the oldest child in the family hadlower rates of illness up to the age of three than dida child of the same age who had older siblings.
s-
:40
E
c~~~~~~0~~~~~~~~~~~~~~
-- "Oldest chid
0<' 1-2 3-4 5.9 10:14 5-19Age of child (years)
Fig. 1 Mean number of respiratory illnesses experiencedby oldest and youngest children in the family.
This finding is consistent with the fact that theseolder siblings are known to be introducers ofinfection into the family. In contrast, the oldestchild under the age of three is often the only childor has only very young siblings and thus doesnot have this type of exposure. However, fromthree years of age onwards, the oldest childconsistently had higher rates of illness. By three,the oldest child is more mobile and becomes thetrailblazer for the family, actually experiencingmore illnesses than the youngest children, and thisrisk continues throughout childhood.Family composition not only affected illness
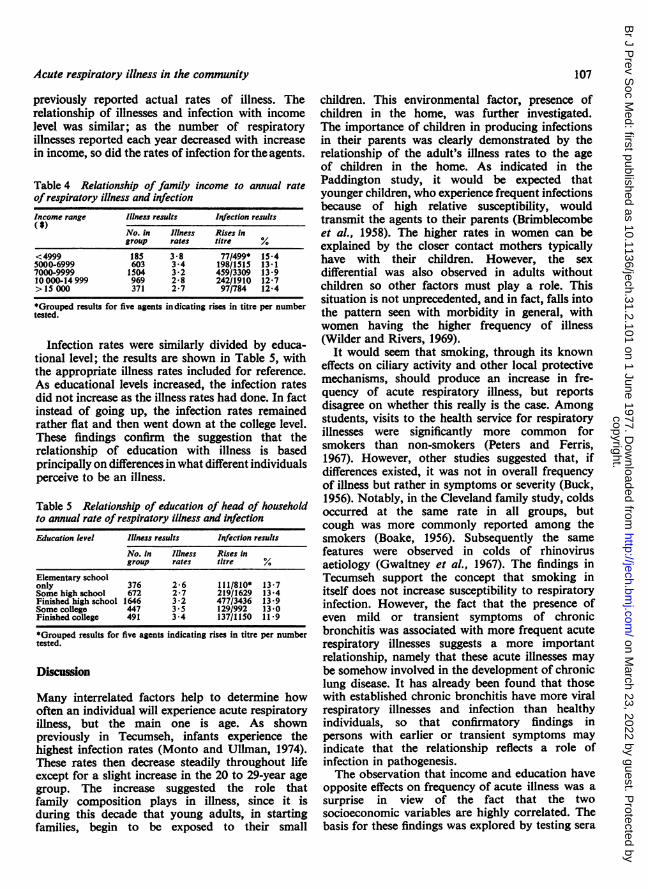
frequency in children, but also in parents. Amongthe familial variables which were significantlyrelated to adults' incidence of respiratory diseasewere the presence and ages of children. Age ofoldest child showed one of the best correlations.Here, as is usual, the correlation coefficient wasgreater for adult women who are more exposedto their children (r = -0 30), than for adult men(r = -0-21). Relationship of illness with age ofoldest child for men and women is shown in Fig. 2,
4
0
00
og YVomenC ---- Mlenc
c pren< 1-4 5-9 10-14 15-19Age of oldest child (years)
Fig. 2 Effect of age of oldest child in the family onnumber of respiratory illnesses experienced by the adults.
with the analysis restricted to adults of under 45years. In each curve, on the far left is shown theannual illness frequency for persons withoutchildren. Interestingly, even this point is slightlyhigher for women. The presence of a childunderone year of age produced a sharp increase in ratesof illness for both parents. Thereafter, there was agradual decline in the illness frequency experiencedby the parents as the oldest children became older.Throughout, the rates for mothers remainedconsiderably higher than that for fathers. By thetime the oldest child had reached 10 to 14 years forthe fathers and 15 to 19 years for the mothers, theparents' rates had fallen below that for adultswithout children in the home.
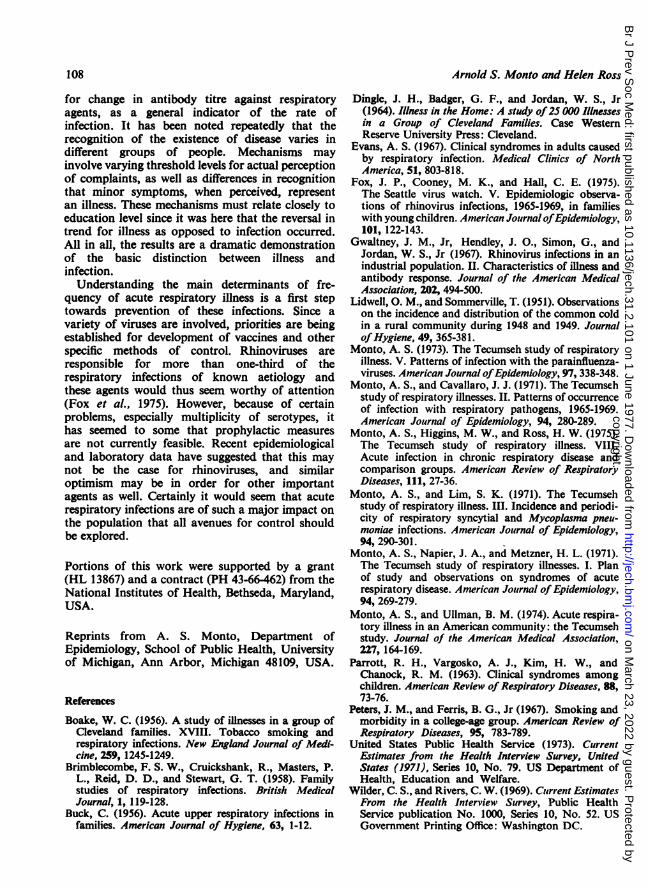
SEASONALITY OF RESPIRATORY VIRUSES ANDTHEIR ASSOCIATION WITH REPORTEDSYMPTOMSIt has been noted that syndromes produced by themany respiratory viruses overlap to such an extentthat in the individual case it was impossible to tellwhich agent was causing a particular illness(Parrott et al., 1963; Evans, 1967). However, inTecumseh, when illnesses were examined in theaggregate, definite patterns in frequency of symp-toms associated with certain viruses could bedetected. Figure 3 shows the types of symptoms inindividuals from whom five different kinds of viruseswere isolated; symptoms associated with isolationofhaemolytic streptococci are shown for comparison.In each case the bar depicts the percentage ofindividuals from whom the particular agent wasisolated who exhibited the symptom. Coryza waspronounced with all viruses, particularly withrhinoviruses the principal cause of common colds,with from 70% to 90% of individuals having thesymptom. It was at lowest frequency in persons
103
copyright. on M
arch 23, 2022 by guest. Protected by
http://jech.bmj.com
/B
r J Prev S
oc Med: first published as 10.1136/jech.31.2.101 on 1 June 1977. D
ownloaded from

Arnold S. Monto and Helen Ross
Ty A luenza
Fig. 3 Characteristics ofillnesses associated withisolation of viruses andhaemolytic streptcoocci:percentage of those infectedexperiencing five symptomsand activity restriction.
J Lower respiratory symptomsE Activity restriction
with streptococcal isolation, but it still appearedin more than half of cases. Here, as expected, sorethroat predominated. As certain parainfluenza-viruses cause croup in small children, it might bethought that they would be associated withhoarseness in the total population. In fact, it wasfound that type A influenza was the agent mostassociated with this symptom. While non-productivecough was common to all the viruses, the lowerrespiratory symptoms of productive cough, pain onrespiration, and/or wheezy breathing proved some-what better in discriminating between the agents.Restriction of daily activity was an importantadditional factor. It was very frequent with influenzaA, somewhat less common with type B influenza,haemolytic streptococci, and respiratory syncytial(RS) virus, and least common with rhinoviruses.Taken together, it can be seen that type A influenza-associated illnesses were of the greatest severity,with high incidence of various symptoms. Type Binfluenza was somewhat less severe. Illnessesassociated with haemolytic streptococci, para-influenza, and RS viruses were intermediate, withvarying characteristics. The mildest diseases ingeneral were those with isolation of the rhinoviruses.Thus, clear differences between pattems of illnessassociated with the different agents could be found
in spite of the considerable overlap.To help determine the cause of a particular illness
it is useful to study the seasonal changes in prevalenceof the viruses. Figure 4 gives a summary of thecalendar months of isolation of four types ofviruses during the six years of the study. Forpurposes of this figure, the type A and B influenzawere considered together because they had a similarpattern. The results are shown as a percentagedistribution of isolates in the various months. Asnoted in previous studies, rhinoviruses were by farthe most important agents in terms of number ofisolates, and they were recovered in all months ofthe year (Monto and Ullman, 1974), althoughmore than 20% of isolations were made inSeptember. This resulted from the burst of illnesses,mainly rhinovirus in aetiology, which followed thereturn of children to school; such an event wasseen in Tecumseh regularly in all but one year of thestudy. Interestingly, frequency of isolation decreasedsteadily until January and then increased to May.Other agents-such as the difficult to isolatecoronaviruses-are probably important in filling infor the rhinoviruses in midwinter as the aetiologicalagents of colds. The late autumn and early winterwere the main periods for the parainfluenzaviruses,with 72 ' 5% of isolations being made from
Headachec Cough
104
copyright. on M
arch 23, 2022 by guest. Protected by
http://jech.bmj.com
/B
r J Prev S
oc Med: first published as 10.1136/jech.31.2.101 on 1 June 1977. D
ownloaded from

Acute respiratory illness in the community
30. Rhinoviruses
10-II /> O) I I . . . .
Paroinfluenzaviruses
Fig. 4 Seasonality of respiratoryagents: proportion isolated ineach calendar month during sixyears of study.
J A S 6 N D M A M J
October to January. Only sporadic isolates weremade at other times; these were mainly type 3, withtypes 1 and 2 occurring almost exclusively duringthe peak months. Unlike these viruses, RS viruswas isolated for only a limited period duringeach year of the study. When these were addedtogether for the six-year study period, most werefound to have been recovered in midwinter. Incontrast, influenza, better known for its epidemicbehaviour, occurred somewhat later in winter orearly spring. Not shown in the figure is the patternof recovery of haemolytic streptococci. While thesebacteria were isolated in all months, more than57% were made from January to April, theexpected distribution in the northern UnitedStates. Thus, considering the marked seasonalfluctuation of some of the agents it is possible tonarrow down the great variety of viruses that mightbe causing an illness by the time it occurs.
EFFECT OF SMOKING ON ILLNESS RATESDuring the last two years of the study, adultparticipants were asked three times during theiryear on surveillance to state the quantity ofcigarettes smoked, if any, and to describe anychronic symptoms of cough and sputum productionthat they might have. Both amount smoked anddegree of cough and sputum were divided intoseveral graded categories based on the average ofthe three responses. The light smoking categoryindicated that the individual usually smoked duringthe course of the year, but less than one pack a day.Moderate smoking indicated that 20 to 29cigarettes a day was the usual level of smoking, andheavy smoking 30 or more cigarettes a day. For
cough and sputum production, category 0 includedindividuals without these symptoms or reportingtheir existence on only one occasion. To be placedin category 1, an individual reported symptomssufficient to be defined as suspect or probablychronic bronchitis on fewer than three occasions;category 2 was reserved for those diagnosedby symptoms as having chronic bronchitis on allthree determinations. Table 1 gives the mean ratesof all acute respiratory illnesses and of thoseillnesses with lower respiratory symptoms atdifferent levels of smoking. There was no clearrelationship of amount smoked with frequency ofacute illnesses in either men or women. In fact,among the men, rates of total illnesses actually fellas amount of smoking increased, but rebounded atthe heavy, or 30 cigarette a day, level. None of thesedifferences was statistically significant. A differentsituation was found when the acute illness rateswere instead divided by chronic bronchitis status,as shown in Table 2. Among the men, there was agreater incidence of acute illnesses as severity ofchronic symptoms increased. Among the women,those with chronic symptoms were also found toexperience somewhat more acute illnesses thanthose without, but the increase was not sequential.The differences between the mean acute illness ratesat cough and sputum status 0 and 1 were statisticallysignificant (P <0 05 for men, P <0 01 for women)for lower respiratory illnesses, but not for totalrespiratory illnesses.The association of acute illnesses with bronchitis
but not with cigarette usage is of interest, as it iswell known that cough and sputum production arestrongly related to smoking. To explore these
*cx0
- 30
- 5 I I I
,Infition7nwiritcot
I
105
v
IMIJcFILUVFit-uscs
copyright. on M
arch 23, 2022 by guest. Protected by
http://jech.bmj.com
/B
r J Prev S
oc Med: first published as 10.1136/jech.31.2.101 on 1 June 1977. D
ownloaded from

Table 1 Relationship of cigarette smoking to annual incidence of all acute respiratory illnesses and those with lowerrespiratory symptoms
Men Women
Smoking status No. Total illnesses Lower Illnesses No. Total illnesses Lower illnesses
Mean (SD) Mean (SD) Mean (SD) Mean (SD)
None 120 1-8 (1-7) 0-6 (0 8) 195 2-1 (1-8) 0-8 (1-0)Light 26 1-7 (1-4) 0-9 (1 1) 32 1-8 (1 6) 0-9 (1 1)Moderate 29 P1 (1-1) 0-4 (0-6) 32 2-1 (I S) 1P1 (1-2)Heavy 37 1 6 (1-4) 1-0 (P 1) 25 2 0 (1-6) 1P1 (1-2)
Table 2 Relationship ofchronic bronchitis to annual incidence ofall respiratory illnesses and those with lower respiratorysymptoms
Men Women
Cough and sputumt No. Total illnesses Lower illnesses No. Total illnesses Lower Illnesses
Mean (SD) Mean (SD) Mean (SD) Mean (SD)
0 166 1 6 (1I5) 0O5 (0 8) 231 2-0 (1-7) 0-8 (1 0)1 36 1.9 (1I5) 1.1 (12) 45 2-4 (19) 1*4 (13)2 10 2-3 (1I8) 1*4 (I*1) 8 2-2 (2 0) 1*2 (0 8)
relationships further, the acute illness rates werecalculated for cough and sputum categories whilecontrolling for cigarette smoking. As shown inTable 3, combination of groups was required forthis analysis because of numbers involved. Formen and women smokers and non-smokers,frequency of acute illnesses, both total and withlower respiratory symptoms was higher in individualswith history of chronic cough and sputumproduction than those without such a history.The differences were statistically significant inwomen for lower respiratory illnesses (P <0-05in smokers and non-smokers) and in men whosmoked (P <0-01 for lower illnesses, P <0-05for total illnesses); taken together, these patternssuggest that smoking does not directly lead tomore acute respiratory illnesses, but that thosewith symptoms of chronic bronchitis, which initself is associated with cigarette smoking, havehigher acute illness rates. Whether this indicatesthat respiratory infection has a separate role in thepathogenesis of chronic bronchitis cannot yet bedetermined.
EDUCATION AND INCOME-DIFFERENCES INILLNESS AND INFECTION RATESIt was previously shown in Tecumseh thatreported rates of respiratory illness decreased asfamilies got richer, but increased with educationallevel of head of household (Monto and Ullman,1974). The relationship with income was easilyexplained by crowding and other factors associatedwith both low income and increased transmissionof infection. However, the relationship witheducation appears to be more complex. It wasclaimed that those with higher levels of educationwould possibly perceive symptoms as representing arespiratory illness which others, who were lesseducated, would not. This would imply that theratio of symptomatic to asymptomatic infectionsvaried with educational level. To evaluate thisrelationship the actual rates of infection for fourdifferent groups of respiratory viruses and M.pneumoniae were determined serologically byidentification of rise in antibody titre. Thegrouped infection rates are shown in Table 4divided by family income together with the
Table 3 Annual incidence ofall acute respiratory illness and those with lower respiratory symptoms in cigarette smokersand non-snwkers ofdiffering levels of cough and sputum
Men Women
Smoking status Cough and sputum No. Total illnesses Lower illnesses No. Total illnesses Lower illnesses
Mean (SD) Mean (SD) Mean (SD) Mean (SD)Non-smokers 0 108 1-7 (1-6) 05 (0-8) 170 2-1 (1-7) 0-7 (0-9)
X and 2 12 2-1 (1-8) 0-9 (1 0) 25 2-7 (2-2) 1-4 (1-3)Smokers 0 58 1-2 (1 1) 0-5 (0 7) 61 1-9 (15) 0 9 (1 1)
I and2 34 1-9 (1-5) 1-3 (1-2) 28 2-2 (1.6) 1-4 (1.2)
106 Arnold S. Monto and Hekn Ross
copyright. on M
arch 23, 2022 by guest. Protected by
http://jech.bmj.com
/B
r J Prev S
oc Med: first published as 10.1136/jech.31.2.101 on 1 June 1977. D
ownloaded from
Acute respiratory illness in the community
previously reported actual rates of illness. Therelationship of illnesses and infection with incomelevel was similar; as the number of respiratoryillnesses reported each year decreased with increasein income, so did the rates of infection for the agents.
Table 4 Relationship of family income to annual rateofrespiratory illness and infection
Income range Illness results Iftection results(S)
No. in Illness Rtses ingroup rates titre %
<4999 185 3-8 77/499* 15-45000-6999 603 3-4 198/1515 13-17000-9999 1504 3-2 459/3309 13 910 000-14 999 969 2-8 242/1910 12-7>15 000 371 2-7 97/784 12-4
*Grouped results for five agents indicating rises in titre per numbertested.
Infection rates were similarly divided by educa-tional level; the results are shown in Table 5, withthe appropriate illness rates included for reference.As educational levels increased, the infection ratesdid not increase as the illness rates had done. In factinstead of going up, the infection rates remainedrather flat and then went down at the college level.These findings confirm the suggestion that therelationship of education with illness is basedprincipally on differences in what different individualsperceive to be an illness.
Table 5 Relationship of education of head of householdto annual rate of respiratory illness and infection
Education level Illness results Infection results
No. In Illness Rises ingroup rates titre %
Elementary schoolonly 376 2-6 111/810* 13-7Some high school 672 2-7 219/1629 13-4Finished high school 1646 3-2 477/3436 13-9Some college 447 3.5 129/992 13-0Finished college 491 3-4 137/1150 11 9
*Grouped results for five agents indicating rises in titre per numbertested.
Discussion
Many interrelated factors help to determine howoften an individual will experience acute respiratoryillness, but the main one is age. As shownpreviously in Tecumseh, infants experience thehighest infection rates (Monto and Ullman, 1974).These rates then decrease steadily throughout lifeexcept for a slight increase in the 20 to 29-year agegroup. The increase suggested the role thatfamily composition plays in illness, since it isduring this decade that young adults, in startingfamilies, begin to be exposed to their small
children. This environmental factor, presence ofchildren in the home, was further investigated.The importance of children in producing infectionsin their parents was clearly demonstrated by therelationship of the adult's illness rates to the ageof children in the home. As indicated in thePaddington study, it would be expected thatyounger children, who experience frequent infectionsbecause of high relative susceptibility, wouldtransmit the agents to their parents (Brimblecombeet al., 1958). The higher rates in women can beexplained by the closer contact mothers typicallyhave with their children. However, the sexdifferential was also observed in adults withoutchildren so other factors must play a role. Thissituation is not unprecedented, and in fact, falls intothe pattern seen with morbidity in general, withwomen having the higher frequency of illness(Wilder and Rivers, 1969).
It would seem that smoking, through its knowneffects on ciliary activity and other local protectivemechanisms, should produce an increase in fre-quency of acute respiratory illness, but reportsdisagree on whether this really is the case. Amongstudents, visits to the health service for respiratoryillnesses were significantly more common forsmokers than non-smokers (Peters and Ferris,1967). However, other studies suggested that, ifdifferences existed, it was not in overall frequencyof illness but rather in symptoms or severity (Buck,1956). Notably, in the Cleveland family study, coldsoccurred at the same rate in all groups, butcough was more commonly reported among thesmokers (Boake, 1956). Subsequently the samefeatures were observed in colds of rhinovirusaetiology (Gwaltney et al., 1967). The findings inTecumseh support the concept that smoking initself does not increase susceptibility to respiratoryinfection. However, the fact that the presence ofeven mild or transient symptoms of chronicbronchitis was associated with more frequent acuterespiratory illnesses suggests a more importantrelationship, namely that these acute illnesses maybe somehow involved in the development of chroniclung disease. It has already been found that thosewith established chronic bronchitis have more viralrespiratory illnesses and infection than healthyindividuals, so that confirmatory findings inpersons with earlier or transient symptoms mayindicate that the relationship reflects a role ofinfection in pathogenesis.The observation that income and education have
opposite effects on frequency of acute illness was asurprise in view of the fact that the twosocioeconomic variables are highly correlated. Thebasis for these findings was explored by testing sera
107
copyright. on M
arch 23, 2022 by guest. Protected by
http://jech.bmj.com
/B
r J Prev S
oc Med: first published as 10.1136/jech.31.2.101 on 1 June 1977. D
ownloaded from
Arnold S. Monto and Helen Ross
for change in antibody titre against respiratoryagents, as a general indicator of the rate ofinfection. It has been noted repeatedly that therecognition of the existence of disease varies indifferent groups of people. Mechanisms mayinvolve varying threshold levels for actual perceptionof complaints, as well as differences in recognitionthat minor symptoms, when perceived, representan illness. These mechanisms must relate closely toeducation level since it was here that the reversal intrend for illness as opposed to infection occurred.All in all, the results are a dramatic demonstrationof the basic distinction between illness andinfection.
Understanding the main determinants of fre-quency of acute respiratory illness is a first steptowards prevention of these infections. Since avariety of viruses are involved, priorities are beingestablished for development of vaccines and otherspecific methods of control. Rhinoviruses areresponsible for more than one-third of therespiratory infections of known aetiology andthese agents would thus seem worthy of attention(Fox et aL, 1975). However, because of certainproblems, especially multiplicity of serotypes, ithas seemed to some that prophylactic measuresare not currently feasible. Recent epidemiologicaland laboratory data have suggested that this maynot be the case for rhinoviruses, and similaroptimism may be in order for other importantagents as well. Certainly it would seem that acuterespiratory infections are of such a major impact onthe population that all avenues for control shouldbe explored.
Portions of this work were supported by a grant(HL 13867) and a contract (PH 43-66-462) from theNational Institutes of Health, Bethseda, Maryland,USA.
Reprints from A. S. Monto, Department ofEpidemiology, School of Public Health, Universityof Michigan, Ann Arbor, Michigan 48109, USA.
ReferencesBoake, W. C. (1956). A study of illnesses in a group of
Cleveland families. XVIII. Tobacco smoking andrespiratory infections. New England Journal of Medi-cine, 259, 1245-1249.
Brimblecombe, F. S. W., Cruickshank, R., Masters, P.L., Reid, D. D., and Stewart, G. T. (1958). Familystudies of respiratory infections. British MedicalJournal, 1, 119-128.
Buck, C. (1956). Acute upper respiratory infections infamilies. American Journal of Hygiene, 63, 1-12.
Dingle, J. H., Badger, G. F., and Jordan, W. S., Jr(1964). Illness in the Home: A study of25 000 Illnessesin a Group of Cleveland Families. Case WesternReserve University Press: Cleveland.
Evans, A. S. (1967). Clinical syndromes in adults causedby respiratory infection. Medical Clinics of NorthAmerica, 51, 803-818.
Fox, J. P., Cooney, M. K., and Hall, C. E. (1975).The Seattle virus watch. V. Epidemiologic observa-tions of rhinovirus infections, 1965-1969, in familieswith young children. American JournalofEpidemiology,101, 122-143.
Gwaltney, J. M., Jr, Hendley, J. O., Simon, G., andJordan, W. S., Jr (1967). Rhinovirus infections in anindustrial population. II. Characteristics of illness andantibody response. Journal of the American MedicalAssociation, 202, 494-500.
Lidwell, 0. M., and Sommerville, T. (1951). Observationson the incidence and distribution of the common coldin a rural community during 1948 and 1949. JournalofHygiene, 49, 365-381.
Monto, A. S. (1973). The Tecumseh study of respiratoryillness. V. Patterns of infection with the parainfluenza-viruses. American Journal ofEpidemiology, 97, 338-348.
Monto, A. S., and Cavallaro, J. J. (1971). The Tecumsehstudy of respiratory illnesses. II. Patterns of occurrenceof infection with respiratory pathogens, 1965-1969.American Journal of Epidemiology, 94, 280-289.
Monto, A. S., Higgins, M. W., and Ross, H. W. (1975).The Tecumseh study of respiratory illness. VIII.Acute infection in chronic respiratory disease andcomparison groups. American Review of RespiratoryDiseases, 111, 27-36.
Monto, A. S., and Lim, S. K. (1971). The Tecumsehstudy of respiratory illness. III. Incidence and periodi-city of respiratory syncytial and Mycoplasma pneu-moniae infections. American Journal of Epidemiology,94, 290-301.
Monto, A. S., Napier, J. A., and Metzner, H. L. (1971).The Tecumseh study of respiratory illnesses. I. Planof study and observations on syndromes of acuterespiratory disease. American Journal of Epidemiology,94, 269-279.
Monto, A. S., and Ullman, B. M. (1974). Acute respira-tory illness in an American community: the Tecumsehstudy. Journal of the American Medical Association,227, 164-169.
Parrott, R. H., Vargosko, A. J., Kim, H. W., andChanock, R. M. (1963). Clinical syndromes amongchildren. American Review of Respiratory Diseases, 88,73-76.
Peters, J. M., and Ferris, B. G., Jr (1967). Smoking andmorbidity in a college-age group. American Review ofRespiratory Diseases, 95, 783-789.
United States Public Health Service (1973). CurrentEstimates from the Health Interview Survey, UnitedStates (1971), Series 10, No. 79. US Department ofHealth, Education and Welfare.
Wilder, C. S., and Rivers, C. W. (1969). Current EstimatesFrom the Health Interview Survey, Public HealthService publication No. 1000, Series 10, No. 52. USGovernment Printing Office: Washington DC.
108
copyright. on M
arch 23, 2022 by guest. Protected by
http://jech.bmj.com
/B
r J Prev S
oc Med: first published as 10.1136/jech.31.2.101 on 1 June 1977. D
ownloaded from