acute and chronic toxicity of methamphetamine...
TRANSCRIPT

Acute and chronic toxicity of
methamphetamine exposure in cultured
neuronal cells
Elise Cook
BForensics (Hons) Forensic Biology and Toxicology
BSc Biomedical Science and Molecular Biology
This thesis is presented for the Honours degree in Biological Science at Murdoch
University, School of Biological Sciences
Western Australia
November 2013

Declaration
I declare that this thesis is my own account of my research and has not been previously
submitted for a degree at any tertiary educational institution.
Elise Cook
Thesis word count: 15,588

iii
Abstract
Methamphetamine is a highly addictive psychostimulant drug with serious health consequences
that include long-term neurotoxic effects. While the neurotoxic mechanisms are still not fully
understood, monoamine release, production of reactive oxygen species and excitotoxicity are
believed to be involved. There is currently no effective treatment to prevent these effects. Using
metabolomic analysis to explore the effect of methamphetamine on neuronal cells with dose and
time may help to elucidate the biochemical pathways affected, and provide an insight into
methamphetamine neurotoxicity.
A B50 neuroblastoma cell culture model was used in these experiments. Cell viability was assessed
by lactate dehydrogenase assay and Trypan blue exclusion testing after 48 hours exposure to 1 mM
methamphetamine. A dose curve was conducted exposing cells to a range of methamphetamine
doses (100 nM, 1 µM, 10 µM, 100 µM and 1 mM) over 48 hours. A time course examined the 6-,
24- and 48-hour time points after B50 exposure to 1 mM methamphetamine. A gas
chromatography-mass spectrometry metabolomic method was used to analyse the treated cells and
cell media of the dose curve and time course. The metabolites found to contribute most to the
variance between the samples were chosen for further study.
Methamphetamine caused observable damage to B50 cells and cell viability which was found to be
dose-dependent by Trypan blue testing, however, LDH results were inconclusive. The metabolites
found to change over dose and time during methamphetamine exposure included amino acids,
carbohydrates and fatty acids. The dose curve showed a build-up of carbohydrates, a decrease in
octadecenoate and alterations to many amino acids with increasing dose. The results from the time
course found an increase in L-glutamate and related metabolites, an increase in antioxidant amino
acids and a decrease in carbohydrates over time. The changes suggest glutamate release, reactive
oxygen species and disturbances to energy utilisation may be involved in the effect of
methamphetamine upon neuronal cells.
The study has confirmed that methamphetamine causes dose-dependent damage and death of
neurons. Methamphetamine exposure resulted in quantifiable biochemical changes over dose and

iv
time with the metabolite changes reflecting the known mechanisms of methamphetamine
neurotoxicity. The result of this study furthers our understanding of neurochemical processes in
response to methamphetamine and could potentially lead to the identification of therapeutic targets.

v
Table of Contents 1. Introduction ................................................................................................................................ 1
1.1 The methamphetamine problem ….…………………………………………………… 2
1.2 The effects of methamphetamine……………………………………………………….4
1.2.1 Cardiovascular effects………………………………………………………..4
1.2.2 Cognitive effects……………………………………………………………..4
1.2.3 Developmental effects………………………………………………………..5
1.2.4 "Meth mouth"………………………………………………………………...5
1.2.5 Neurotoxic effects……………………………………………………………6
1.2 Neurons and neurotransmitters…………………………………………………………7
1.2.1 The neuron…………………………………………………………………...7
1.2.1 Dopamine…………………………………………………………………….8
1.2.2 Serotonin……………………………………………………........................10
1.2.3 Glutamate………………………………………………………...................11
1.4 Neurotoxicity of methamphetamine…………………………………………………...12
1.41 Metabolism of methamphetamine…………………………………………...17
1.42 Methamphetamine addiction………………………………………………...17
1.5 Metabolomics………………………………………………………………………….19
1.6 Gas chromatography-mass spectrometry……………………………………………...22
1.7 Aims…………………………………………………………………………………...25
2. Materials and methods………………………………………………………………………..26
2.1 Materials……………………………………………………………………………….26
2.1.1 Chemicals and kits………………………………………………………….26
2.1.2 Cells………………………………………………………………………...26
2.2 Methods……………………………………………………………………………….26
2.2.1 Cell culture…………………………………………………………………26
2.2.2 Cell counting……………………………………………………………….27
2.2.3 LDH assay………………………………………………………………….27
2.2.4 Harvesting………………………………………………………………….28
vi
2.2.5 Extraction…………………………………………………………………..29
2.2.6 Derivatization………………………………………………………………29
2.2.7 Instrumental analysis……………………………………………………….30
2.2.8 Data analysis………………………………………………………………..31
2.3 Experiments…………………………………………………………………………...31
2.3.1 LDH assay………………………………………………………………….31
2.3.2 Dose curve………………………………………………………………….31
2.3.3 Time course………………………………………………………………....32
3. Results ...................................................................................................................................... 33
3.1 Cell viability testing…………………………………………………………………...33
3.2 Dose curve…………………………………………………………………………….37
3.2.1 Intracellular metabolites……………………………………………………37
3.2.2 Extracellular metabolites…………………………………………………...41
3.3 Time course…………………………………………………………………………...46
3.3.1 Intracellular metabolites…………………………………………………....46
3.3.2 Extracellular metabolites…………………………………………………...50
4. Discussion ................................................................................................................................ 55
4.1 Cell viability testing…………………………………………………………………...55
4.2 Dose curve…………………………………………………………………………….56
4.2.1 Overall discussion of dose curve…………………………………………...59
4.3 Time course……………………………………………………………………………60
4.3.1 Overall discussion of time course…………………………………………..63
4.4 Effect of methamphetamine…………………………………………………………...63
4.5 Limitations and expansions……………………………………………………………64
4.6 Conclusion……………………………………………………………………………..66
5. References .................................................................................................................................. 67

vii
Index to figures
Figure 1.0 Chemical structures of methamphetamine and other psychostimulants…………………1
Figure 1.1 The two major routes of methamphetamine synthesis…………………………………..3
Figure 1.21 Dental caries due to methamphetamine abuse…………………………………………6
Figure 1.31 The basic structure of a neuron…………………………………………………………7
Figure 1.32 The dopamine and serotonin pathways through the brain……………………………...9
Figure 1.33 The dopamine biosynthesis pathway………………………………………………….10
Figure 1.34 A serotonergic synapse………………………………………………………………..11
Figure 1.41 Pathways involved in methamphetamine neurotoxicity………………………………12
Figure 1.42 Mechanisms whereby methamphetamine causes the release of dopamine and
catecholamines……………………………………………………………………………………..13
Figure 1.43 The main metabolic pathways of methamphetamine…………………………………18
Figure 1.51 Comparison of publications on metabolomic applications……………………………20
Figure 1.61 Overview of the GC-MS instrument………………………………………………….23
Figure 3.11 Photographs of B50 cells after 48 hours of methamphetamine treatment……………34
Figure 3.12 Cytotoxicity of methamphetamine measured by LDH assay…………………………35
Figure 3.13 Cell viability after methamphetamine exposure measured by Trypan blue exclusion
testing………………………………………………………………………………………………36
Figure 3.21 PCA of GC-MS metabolomics data from B50 cells following exposure to
methamphetamine at a range of doses……………………………………………………………..38
Figure 3.22 Changes in intracellular amino acids of B50 cells with dose of methamphetamine….39
Figure 3.23 Changes in intracellular metabolites of B50 cells with dose of methamphetamine…..40
Figure 3.24 PCA of GC-MS metabolomic data from medium of B50 cells following exposure to
methamphetamine at a range of doses………………………………………………………….…..42
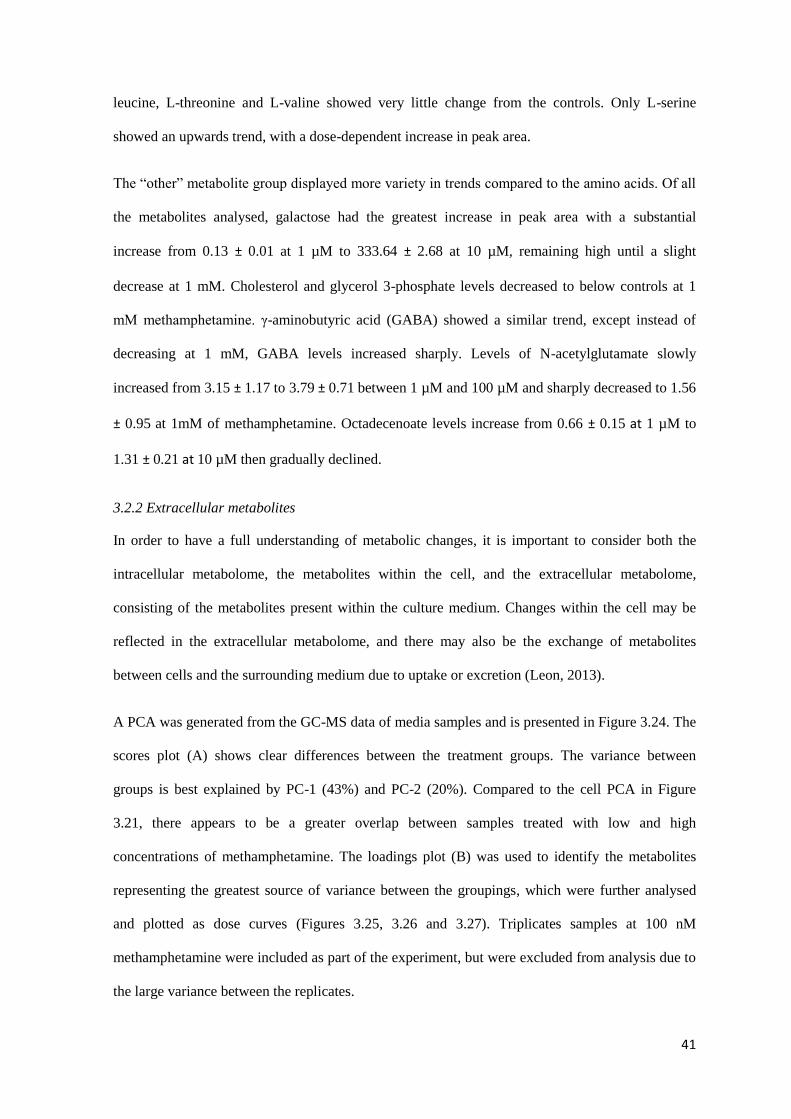
Figure 3.25 Changes in extracellular amino acids of B50 cells with dose of methamphetamine….43
Figure 3.26 Changes in extracellular amino acids of B50 cells with dose of methamphetamine….44
Figure 3.27 Changes in extracellular metabolites of B50 cells with dose of methamphetamine….45
Figure 3.31 PCA of GC-MS metabolomics data from B50 cells following 6, 24 or 48 hours
exposure to methamphetamine…………………………………………………………………….47
Figure 3.32 Changes over time of intracellular amino acids of B50 cells…………………………48

viii
Figure 3.33 Changes over time of intracellular metabolites of B50 cells………………………….49
Figure 3.34 PCA of GC-MS metabolomics data from medium of B50 cells following 6, 24 or 48
hours exposure to methamphetamine………………………………………………………………51
Figure 3.35 Changes over time of extracellular amino acids of B50 cells…………………………52
Figure 3.36 Changes over time of extracellular metabolites of B50 cells…………………………53
Index to tables
Table 1.5 A comparison of NMR, GC-MS and LC-MS………………………………………….22

ix
List of abbreviations
5-HIAA 5-hydroxyindoleacetic acid
5-HT 5-hydroxytryptamine
ATP Adenosine triphosphate
B50 B50 rat neuroblastoma cell line
Ca2+
Calcium
CNS Central nervous system
DAT Dopamine transporter
DMEM Dulbecco‟s modified Eagle‟s medium
EAA Excitatory amino acid
GABA γ-aminobutyric acid
GC Gas chromatography
IL-1 Interleukin 1
LC Liquid chromatography
LDH Lactate dehydrogenase
m/z Mass to charge ratio
MAO Monoamine oxidase
MS Mass spectrometry
MSTFA N-methyl-N-(trimethylsilyl)trifluroacetamide
NMDA N-methyl-D-aspartate
NMR Nuclear magnetic resonance
nNOS Nitric oxide synthase
P2P Phenyl-2-propanone
PBS Phosphate buffered solution
PCA Principal component analysis
PKC Protein kinase C
ROS Reactive oxygen species
SERT Serotonin transporter
VMAT-2 Vesicular monoamine transporter

x
Index to units
oC Degrees centigrade
µg Microgram
µL Microlitre
µm Micrometre
µM Micromolar
cm Centimetre
g Gram
g G-force
m Metre
mg Microgram
mL Millilitre
mm Millimetre
mM Millimolar
rpm Revolutions per minute

xi
Acknowledgements
Although challenging, my Honours year has been one of the most rewarding experiences of my
university education. It has given me an invaluable insight into the process of conducting research
and taught me that persistence and hard work pays off. I have gained valuable knowledge from
experienced supervisors and from being part of a fantastic team.
I would like to sincerely thank my supervisors, Dr. Garth Maker and A/Prof. Ian Mullaney, for all
their help throughout this year, for the support, patience and guidance they have given me. I would
especially like to thank Garth for his proof reading, constructive feedback and always taking the
time to answer my questions. I have enjoyed working with and, am immensely grateful to both of
them.
I extend my thanks to the metabolomics team: A/Prof. Robert Trengove, for his suggestions;
Catherine Rawlinson, for her help and guidance with the GC-MS and my data processing; Maria
Wenner, for her advice about my cells; Hayley Abbiss, for her assistance with the GC-MS; and to
Dr. Joel Gummer, for answering my questions in the lab.
To my fellow Honours students, thank you for listening to my troubles, for offering support and
advice and most of all for making this year enjoyable.
Lastly, I would like to thank my family for their support and understanding. I couldn‟t have
completed this without them.

1
1. Introduction
The amphetamine derivative, methamphetamine, also known as “meth”, “speed” and “crank” is a
powerful psychoactive drug. Whilst nearly identical in structure, methamphetamine is more potent
than amphetamine (Figure 1.0), with effective doses of 0.06 and 0.28 mg/kg respectively
(Bondareva et al., 2002). This is thought to be due to the presence of an additional methyl group on
the amine making the compound more stable and lipid soluble, aiding its transport across the blood
brain barrier (Carvalho et al., 2012). Two isomeric forms of methamphetamine exist; (+)
methamphetamine and (-) methamphetamine, with the former being dominant and five times more
biologically active (Schep et al., 2010). Methamphetamine has stimulant, euphoric, anorectic and
hallucinogenic properties. It is highly abused for its effects of increased concentration, reduced
need for food and sleep and for feelings of well-being. In addition to these sought after effects,
methamphetamine causes anxiety, psychosis, cognitive and motor impairments, stroke, cardiac
irregularities and death (Cadet et al., 2007).
Figure 1.0: Chemical structures of methamphetamine and other psychostimulants ephedrine,
MDMA (methylenedioxymethamphetamine or ecstasy), amphetamine, pseudoephedrine and
cocaine (adapted from Vearrier et al., 2012).

2
1.1 The methamphetamine problem
While methamphetamine‟s beginnings were innocent, misuse of the drug has developed into a
global problem. Since its synthesis in 1919 by Japanese chemist Akira Ogata, methamphetamine
has had a range of uses. Similar to amphetamine, methamphetamine was first put to use for nasal
decongestion and for the treatment of asthma (Vearrier et al., 2012). It was also used as a diet aid
and to combat depression and alcoholism (Watanabe-Galloway et al., 2009). During World War II
methamphetamine was favoured by the German and Japanese militaries for its stimulant properties,
keeping soldiers awake and alert. However, adverse effects soon made themselves known with
reports of increased blood pressure and heart rate, palpitations, convulsions, tremor and difficulty
breathing. Restrictions were put in place, limiting the availability of methamphetamine to
prescription only, eventually outlawing the drug completely. These measures were mostly
ineffective for soon after these restrictions were put in place, the first clandestine laboratories
appeared (Vearrier et al., 2012).
There are two main methods for the production of methamphetamine: the phenyl-2-propanone
(P2P) method, which uses P2P and methylamine as precursors and the ephedrine/pseudoephedrine
reduction method (Figure 1.1). Clandestine labs mostly use the ephedrine/pseudoephedrine method
as it is simple and is based on easily available household products such as acetone, lithium (lithium
batteries), sodium hydroxide (lye), toluene (paint thinner) and ephedrine/pseudoephedrine (cold
and allergy medication). This has resulted in the restricted sale of some of these goods (Weisheit,
2008); however, its effectiveness in reducing production is questionable due to lack of
comprehensive control (Schloenhardt, 2007). Substitution of new ingredients to replace those
restricted has resulted in a reduction in purity with the median purity being between 1.9 and 49.9%
in Australia (Australian Crime Commission, 2012). Some of these impurities and adulterants can
result in adverse consequences or death. A report by the US Centres for Disease Control (1990)
discovered eight cases of lead poisoning due to intravenous methamphetamine use where the drug
samples tested contained up to 60% lead by weight.

3
Figure 1.1: The two major routes of methamphetamine synthesis; the ephedrine/pseudoephedrine
reduction method (top) and the phenyl-2-propanone (P2P) method (bottom) (Mendelson et al.,
2006).
As a result of its availability, low cost and long duration of action methamphetamine has a high
potential for abuse. The United Nations Office on Drugs and Crime 2008 report estimated that
there were 25 million methamphetamine users worldwide, exceeding the use of cocaine and heroin
(Panenka et al., 2012). In Australia, estimates place the number of people over 14 years of age who
have used methamphetamine in the last 12 months at 2.1 % (Australian Institute of Health and
Welfare, 2011). Associated with a high risk of unemployment and financial trouble, psychological
and health problems and violent and criminal behaviour, methamphetamine addiction places a
great burden on society (Brecht et al., 2004). Amphetamine stimulants account for 15% of national
illicit drug arrests second only to cannabis (Australian Crime Commission, 2012).
4
1.2 Effects of methamphetamine
Methamphetamine users seek the drug‟s pleasurable effects such as euphoria, decreased appetite
and increased alertness, concentration and libido. However, in seeking these effects, users are
risking their lives as methamphetamine use has a dark side. The damaging effects of
methamphetamine on the body are multiple and wide spread including cardiovascular, cognitive,
developmental, dental caries and neurotoxic effects (Barr et al., 2006).
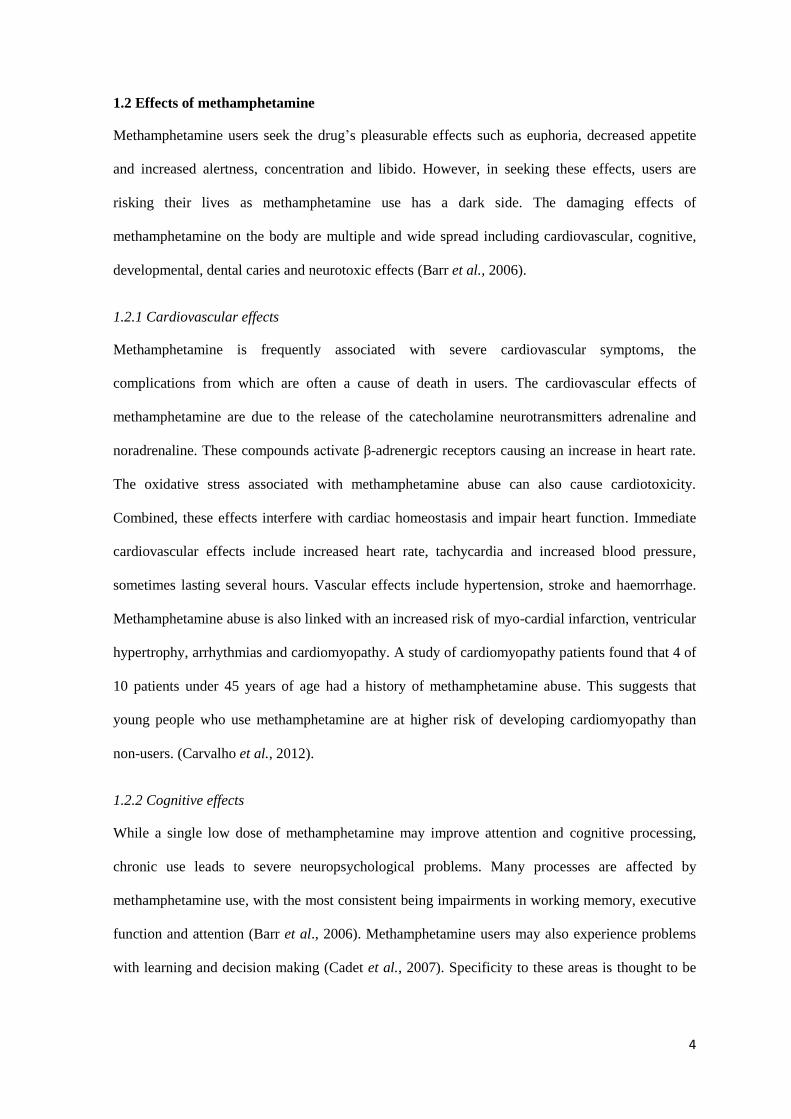
1.2.1 Cardiovascular effects
Methamphetamine is frequently associated with severe cardiovascular symptoms, the
complications from which are often a cause of death in users. The cardiovascular effects of
methamphetamine are due to the release of the catecholamine neurotransmitters adrenaline and
noradrenaline. These compounds activate β-adrenergic receptors causing an increase in heart rate.
The oxidative stress associated with methamphetamine abuse can also cause cardiotoxicity.
Combined, these effects interfere with cardiac homeostasis and impair heart function. Immediate
cardiovascular effects include increased heart rate, tachycardia and increased blood pressure,
sometimes lasting several hours. Vascular effects include hypertension, stroke and haemorrhage.
Methamphetamine abuse is also linked with an increased risk of myo-cardial infarction, ventricular
hypertrophy, arrhythmias and cardiomyopathy. A study of cardiomyopathy patients found that 4 of
10 patients under 45 years of age had a history of methamphetamine abuse. This suggests that
young people who use methamphetamine are at higher risk of developing cardiomyopathy than
non-users. (Carvalho et al., 2012).
1.2.2 Cognitive effects
While a single low dose of methamphetamine may improve attention and cognitive processing,
chronic use leads to severe neuropsychological problems. Many processes are affected by
methamphetamine use, with the most consistent being impairments in working memory, executive
function and attention (Barr et al., 2006). Methamphetamine users may also experience problems
with learning and decision making (Cadet et al., 2007). Specificity to these areas is thought to be

5
due to the rich dopaminergic innervation of pathways controlling cognitive processes which
methamphetamine is known to target (Barr et al., 2006).
One of the most serious cognitive effects associated with methamphetamine abuse is the
development of drug-related psychosis. Very similar in nature to schizophrenia, this enduring
effect results from high dose or continuous methamphetamine use (Levi et al., 2012). A Japanese
survey of young people who regularly used methamphetamine found 80% had suffered from
psychotic symptoms. This has raised concern as those who suffer repeated psychotic episodes are
less responsive to treatment (Barr et al., 2006).
1.2.3 Developmental effects
Methamphetamine is increasingly becoming the drug of choice for drug-dependent women during
pregnancy. In a study of drug use in pregnant women, only 35% decreased their methamphetamine
use, while 10% increased and 55% made no change. These women were also less likely to seek
prenatal advice (Della Grotta et al., 2010). Methamphetamine is able to quickly cross the placenta
and distributes to the foetal organs where it causes changes such as increased heart weight and
myocardial damage. Other problems include hypoxia, hyperglycemia and hypertension. At birth,
these infants often show a decreased weight, length and head circumference (Schep et al., 2010).
Children who have been exposed in utero perform poorly on attention and verbal memory tests.
They also display changes in brain development, with smaller striatal and hippocampal volumes
which may account for their cognitive problems (Chang et al., 2007).
1.2.4 “Meth mouth”
Methamphetamine has devastating effects on oral health. “Meth mouth” has become the term used
to describe the decay and oral problems associated with methamphetamine abuse (Figure 1.21).
Methamphetamine users often neglect their oral hygiene and frequently favour sugary drinks
during times of drug use. Dehydration and stimulation of the sympathetic nervous system reduce
the amount of saliva produced leading to development of dental caries. Also contributing to tooth
decay are the acidic substances used in the production of methamphetamine. Users of

6
methamphetamine are known to display bruxism, clenching of the jaw and grinding of the teeth,
causing wear. Often patients do not feel any pain but seek dental treatment for cosmetic reasons
(Donaldson et al., 2006).
Figure 1.21: Dental caries due to methamphetamine abuse (Vearrier et al., 2012).
1.2.5 Neurotoxic effects
Neurotoxicity is an adverse effect on the structure or function of the central or peripheral nervous
system caused by exposure to toxic substances called neurotoxins. These neurotoxic effects can
range from short-term to permanent changes. In serious cases neurotoxicity can result in neuron
loss and changes to brain structure. Neurotoxicity is associated with a number of disorders
including behavioural problems, deficit regulation of emotion, impaired intelligence and
depression (Cunha-Oliveira et al., 2008).
Methamphetamine is a neurotoxin which, in high doses, causes the lasting depletion of the
monoamines dopamine, serotonin, adrenaline and noradrenaline and damage to nerve terminals
and cell bodies. While not completely understood, the neurotoxic effects of methamphetamine are
believed to stem from interaction with the dopaminergic and serotonergic systems. Implicated in
the neurotoxicity of methamphetamine are oxidative stress, excitotoxicity, hyperthermia,

7
mitochondrial dysfunction, inflammation and endoplasmic reticulum induced apoptosis (Cadet et
al., 2007).
1.3 Neurons and neurotransmitters
1.3.1 The neuron
The principal components of the nervous system, the neurons or nerve cells sense changes in the
environment, then communicate these changes to other neurons and stimulate the body‟s response.
The neuron is comprised of two parts: the cell body or soma, which contains the cell nucleus and
organelles, and the neurites, numerous thin tubes radiating away from the cell body (Figure 1.31).
The neurites are made up of multiple dendrites, and the axon, which is usually singular, branching
and travels over great distances (Brown et al., 2007), for example, the sciatic nerve which runs
from the base of the spine to the big toe (Encyclopaedia Britannica, 2014).
Figure 1.31: The basic structure of a neuron consisting of the cell body or soma, the axon and
dendrites (adapted from Brown et al., 2007).
The synapse is the site where the end of an axon, or axon terminal, comes into contact with and
passes information to other neurons. At the synapse, information in the form of electrical impulses
is converted into a chemical signal that crosses the space between the neurons, called the synaptic
cleft. These chemical signals, known as neurotransmitters of which there are several different
types, activate receptors on the receiving or post-synaptic neuron creating a response or further

8
propagation of the electrical signal (Bear et al., 2007). Of these neurotransmitters, the most
important are dopamine, serotonin and glutamate.
1.3.2 Dopamine
Dopamine is a catecholamine neurotransmitter within the CNS, where it controls a number of
functions such as cognition, emotion, locomotion, endocrine regulation and reward processes.
Dopamine is also active in the peripheral nervous system (the nerves and ganglia outside the CNS),
with roles including catecholamine release, hormone secretion and the regulation of renal, heart
and gastrointestinal function (Missale et al., 1998). Dopamine has been associated with disorders
such as schizophrenia and Parkinson‟s disease and is known to be involved in the neurotoxicity of
methamphetamine and a number of other drugs (Salamone et al., 2005).
Accounting for less than 1% of the total neuronal population (Arias-Carrión et al., 2010),
dopaminergic neurons are localized in the mesolimbic, mesocortical and nigrostriatal pathways
(Schep et al., 2010) (Figure 1.32). These pathways encompass the nucleus accumbens, amygdala,
hippocampus and striatum (Völlm et al., 2004), which are involved in emotion, motor control and
reward (Schep et al., 2010). There are five subtypes of dopaminergic receptors. Two are D1-like
receptors (D1 and D5) which are coupled to the G protein, Gs, and activate adenylyl cyclase. The
other receptors are D2-like (D2, D3 and D4) and are G protein coupled receptors that act to
activate potassium ion channels and inhibit adenylyl cyclase (Missale et al., 1998). The receptors
have a similar distribution to the dopaminergic neurons (Arias-Carrión et al., 2010).

9
Figure 1.32: The dopamine (yellow) and serotonin (red) pathways through the brain. Some
functions of each neurotransmitter are listed (NIDA, 2008).
Dopamine is produced in a two step process. The rate limiting enzyme tyrosine hydroxylase
converts the amino acid tyrosine to L-3,4-dihydroxyphenylalanine (DOPA), which then undergoes
decarboxylation to dopamine (Figure 1.33; Daubner et al., 2011). After synthesis, dopamine is
stored in presynaptic vesicles until release. Under normal physiological conditions dopamine is
released from the pre-synaptic neuron into the synapse in response to relevant stimuli. Once in the
synapse it diffuses in the extracellular fluid and activates its receptors (Arias-Carrión et al., 2010).
Dopamine is cleared from the synapse as a result of reuptake via the dopamine transporter (DAT)
and is metabolised by monoamine oxidase (MAO) (Riddle et al., 2006).

10
Figure 1.33: The dopamine biosynthesis pathway. Phenylalanine is converted to tyrosine by
phenylalanine hydroxylase, tyrosine to DOPA by tyrosine hydroxylase, and DOPA to dopamine by
aromatic acid decarboxylase. Dopamine is able to undergo further reactions to produce the
catecholamines norepinephrine and epinephrine (Daubner et al., 2011).
1.3.3 Serotonin
Serotonin or 5-hydroxytryptamine (5-HT) has a wide range of functions, including regulation of
the sleep/wake cycle, learning, appetite and aggression. In the brain, serotonin acts as a
neurotransmitter and is involved in emotional responses, movement and the reward system (Homer
et al., 2008). The serotonergic system is one of the most diffuse, reaching almost every part of the
CNS, but is mostly concentrated in the cerebral cortex, limbic structures, basal ganglia and
brainstem (Figure 1.34) (Kranz et al., 2010).
The amino acid tryptophan is converted in a two-step process to serotonin, involving the enzyme
tryptophan hydroxylase, which is considered the rate-limiting enzyme. Serotonin is then stored in
presynaptic vesicles until release into the synaptic cleft upon depolarisation. Serotonin can bind to
post-synaptic serotonin receptors or to auto-receptors which act as negative feedback against
further serotonin release. Reuptake of serotonin from the synapse is performed by the serotonin

11
transporter (SERT) located on the presynaptic neuron. Metabolism of serotonin occurs by MAO to
produce 5-hydroxyindoleacetic acid or 5-HIAA (Figure 1.34) (Mohammad Zadeh et al., 2008).
Figure 1.34: A serotonergic synapse showing the synthesis, storage, release, metabolism and
reuptake of serotonin (Mohammad Zadeh et al., 2008).
1.3.4 Glutamate
Glutamate is the principal excitatory neurotransmitter and is ubiquitously distributed throughout
the brain. Glutamate is important in the synthesis of proteins and peptides including glutathione
(Fonnum, 1984). Due to its role in neuronal plasticity, glutamate is also involved in learning and
memory functions. While glutamate is essential to brain function, excessive glutamate release has
been implicated in neurotoxicity (Nakanishi, 1992).
Glutamate can be synthesised from a number of different precursors: glutaminase can convert
glutamine, aspartate aminotransferase converts 2-oxoglutarate and aspartate, and ornithine δ-
aminotransferase converts 2-oxoglutarate (Fonnum, 1984). Like dopamine and serotonin,
glutamate is stored in vesicles after synthesis and is released upon depolarization by a calcium-
dependent mechanism. It may also be released in a non-calcium dependent process by reverse
operation of the glutamate transporters, responsible for glutamate reuptake from extracellular
12
space. This occurs when the sodium and potassium ion gradient across the membrane is reduced in
situations such as ischemic stroke (Meldrum, 2000).
Until recently glutamate was thought to exclusively activate glutamate-gated cation channels called
ionotropic glutamate receptors such as N-methyl-D-aspartate (NMDA) receptor. It has now been
determined that glutamate also acts through metabotropic receptors bound to a G protein. It is the
Ca2+
permeability of NMDA that is responsible for the neuronal plasticity and the neurotoxic
properties of glutamate (Nakanishi, 1992).
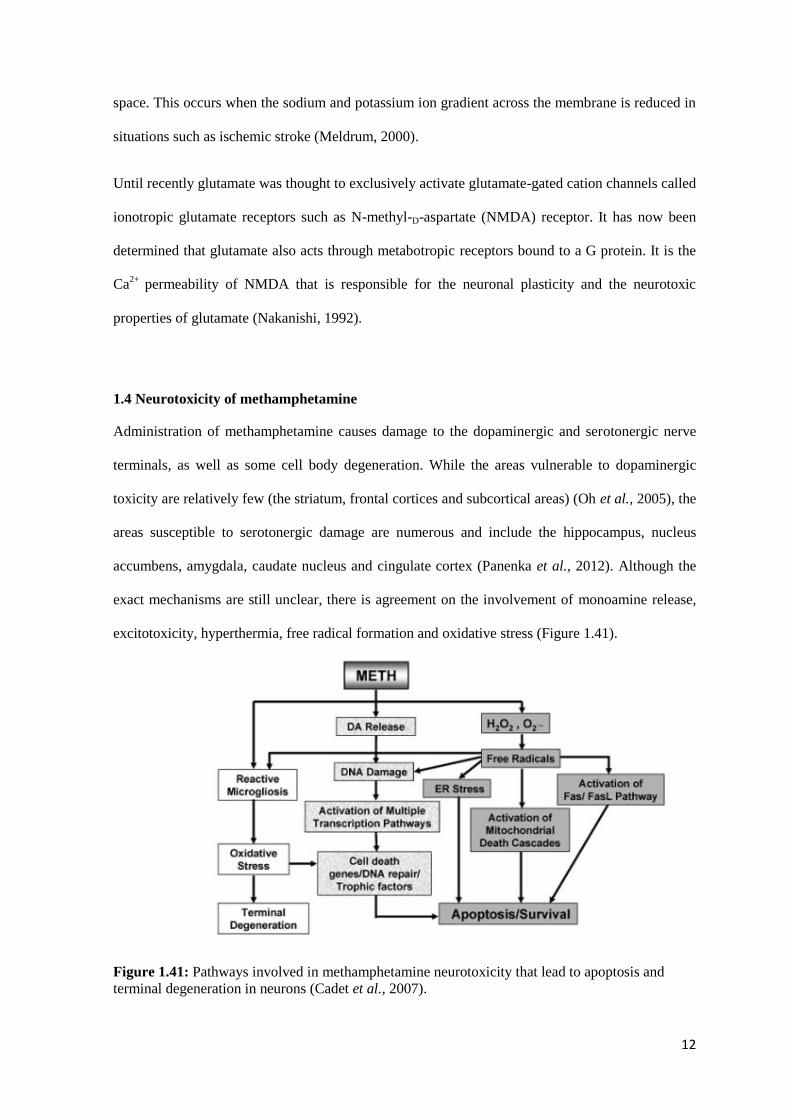
1.4 Neurotoxicity of methamphetamine
Administration of methamphetamine causes damage to the dopaminergic and serotonergic nerve
terminals, as well as some cell body degeneration. While the areas vulnerable to dopaminergic
toxicity are relatively few (the striatum, frontal cortices and subcortical areas) (Oh et al., 2005), the
areas susceptible to serotonergic damage are numerous and include the hippocampus, nucleus
accumbens, amygdala, caudate nucleus and cingulate cortex (Panenka et al., 2012). Although the
exact mechanisms are still unclear, there is agreement on the involvement of monoamine release,
excitotoxicity, hyperthermia, free radical formation and oxidative stress (Figure 1.41).
Figure 1.41: Pathways involved in methamphetamine neurotoxicity that lead to apoptosis and
terminal degeneration in neurons (Cadet et al., 2007).

13
With prolonged use, methamphetamine causes a significant depletion of monoamines, dopamine
and serotonin, an effect which has been shown to last several years after abstinence in primates
(Friedman et al., 1998). Initially, methamphetamine causes an increase in the extracellular
concentrations of dopamine and serotonin by stimulating their release from presynaptic terminals
and preventing their reuptake or breakdown. This is achieved by disrupting several points in the
monoamine release and reuptake pathway (Figure 1.42) (Riddle et al., 2006).
Figure 1.42: Mechanisms whereby methamphetamine causes the release of dopamine and
catecholamines from neuronal terminals into the synapse: (i) methamphetamine (triangles) enters
the cell via diffusion or (ii) by dopamine transporters; (iii) methamphetamine reverses transport of
dopamine (circles) from the vesicles to the cytosol; and (iv) and promotes the expression of
tyrosine hydroxylase, increasing dopamine production; (v); decreases the expression of dopamine
transporters at cell membrane; and (vi) inhibits monoamine oxidase activity (Schep et al., 2010).
Due to its structural similarity to the monoamines, methamphetamine acts as a substrate for the
membrane-bound dopamine and serotonin transporters (DAT and SERT), and is transported into
the cytosol (Cho, 1990). Methamphetamine can also enter the cell via diffusion (Schep et al.,
2010). Once inside, methamphetamine causes reversal of the vesicular monoamine transporter

14
(VMAT-2), responsible for the storage of dopamine and serotonin in vesicles by reducing the pH
of the vesicle. This compromises the ability of VMAT-2 to sequester monoamines (Panenka et al.,
2012), resulting in the displacement of the monoamines to the cytoplasm, where they are at risk of
auto-oxidation. Methamphetamine is also responsible for the blockage of further uptake into the
vesicles (Carvalho et al., 2012) and the redistribution of VMAT-2 to an as-yet unidentified cellular
location (Panenka et al., 2012).
The build-up of monoamines in the cytosol is further enhanced by the inhibition of the enzyme
monoamine oxidase (MAO). MAO is present on the outer mitochondrial membrane and is
responsible for monamine catabolism in presynaptic terminals (Panenka et al., 2012).
Methamphetamine further increases the concentration of dopamine by promoting its synthesis
through the up-regulation of tyrosine hydroxylase, the enzyme which catalyses the transformation
of the dopamine precursor, tyrosine, into dopamine (Cunha-Oliveira et al., 2008). However, with
chronic use of methamphetamine this effect is reversed, reducing the activity of tyrosine
hydroxylase as well as the enzyme tryptophan hydroxylase involved in serotonin production
(Hotchkiss, 1980).
The binding of methamphetamine to the monoamine transporters causes the reverse transport of
dopamine and serotonin into the synapse, where they are able to activate the postsynaptic receptor
causing hyperstimulation. The reversal of the transporters is thought to occur through a facilitated
exchange process, by which the inward transport of methamphetamine increases the inward facing
binding sites for monoamine efflux (Khoshbouei et al., 2004). Methamphetamine also prevents
reuptake of the monoamines from the synapse by reducing the number of transporters at the cell
membrane. This effect is more likely due to internalisation or phosphorylation than destruction
(Riddle et al., 2006). This has been confirmed with the finding that protein kinase C (PKC) activity
increases with methamphetamine administration and can lead to phosphorylation of DAT
(Khoshbouei et al., 2004).

15
Methamphetamine enhances the formation of reactive oxygen species (ROS) which cause damage
to amino acids, phospholipids and nucleic acids (Cunha-Oliveira et al., 2008). The released
dopamine is a potential source of ROS, as dopamine can undergo auto-oxidation via the Fenton
reaction, using iron as a co-factor. Dopamine is also thought to be oxidised to dopamine quinones
which can be converted to toxic radicals through redox cycling (Thrash et al., 2009). While the
mechanisms are less well known, serotonin toxicity is also believed to be mediated by free radicals
(Barr et al., 2006).
The involvement of ROS has been confirmed by reports of increased oxidised and reduced
glutathione levels after methamphetamine treatment (Gluck et al., 2001). Glutathione protects
against oxidising environments by acting as a reducing agent and an antioxidant (Deneke et al.,
1989). Furthermore, mice over-expressing the antioxidant enzyme CuZn superoxide dismutase
show reduced neurotoxicity (Gluck et al., 2001).
The mitochondria present another source of intracellular ROS. Mitochondrial ROS are generated
as a result of ATP production. The electron transport chain, located on the inner mitochondrial
membrane, produces ROS as a side product during ATP formation. Methamphetamine is also
known to inhibit complexes within the electron transport chain, increasing free radical production.
The hydrogen peroxide produced during the breakdown of dopamine via MAO also interferes with
electron transport chain activity. Electron transport chain complexes II and III seem to be the most
affected, showing rapid inhibition within 1 hour of methamphetamine administration (Brown et al.,
2003). Using an infusion of methamphetamine and the complex II inhibitor malonate, Brown and
colleagues (2005) found lasting depletions of dopamine in the striatum greater than that seen with
malonate alone. The breakdown of the electron transport chain and associated depletion of ATP
initiates transcription factor p53. p53, responsible for the apoptotic death pathway, has been shown
to accumulate following methamphetamine administration (Thrash et al., 2009).
Decrease in ATP production can also lead to excitotoxicity, a process of neuronal death brought
about by excessive and prolonged activation of the excitatory amino acid (EAA) receptors. Release

16
of glutamate, the major mammalian excitatory amino acid, is enhanced by methamphetamine
administration and is responsible for its excitotoxic effect (Pederson et al., 2000). The increase in
glutamate availability causes over stimulation of the N-methyl-D-aspartate (NMDA) receptor which
is spatially linked to neuronal nitric oxide synthase (nNOS), which can produce the nitric oxide
involved in neuronal degeneration (Lau et al., 2010). Glutamate release is highly dependent on
calcium influx which is mediated by the activation of ionotropic and metabotropic glutamate
receptors. High calcium levels can lead to activation of kinases, proteases and lipases, the
breakdown of cytoskeletal proteins and the production of free radicals and resulting DNA damage
(Quinton et al., 2006).
Much of the intracellular calcium released by excitotoxicity enters the mitochondria where it
causes de-energisation and the release of pro-apoptotic factor cytochrome C (Lankiewicz et al.,
2000). Calcium influx can also activate ROS formation, further inhibiting mitochondrial function
(Brown et al., 2003). The involvement of glutamate excitotoxicity in mitochondrial damage has
been confirmed by the administration of NMDA antagonist MK-801, which prevented the decrease
of complex II-III activity induced by methamphetamine (Brown et al., 2005). Whether the
mitochondria recovers after an excitotoxic injury determines the mechanism by which the neuron
dies. Necrosis occurs immediately after glutamate exposure and is associated with loss of
mitochondrial function. Death of surviving neurons with functional mitochondria occurs by
apoptosis and is a delayed process (Ankarcrona et al., 1995). The hyperthermic response brought
on by methamphetamine may also contribute to the decreased activity of the electron transport
chain (Brown et al., 2003).
While not directly responsible for the neurotoxicity of methamphetamine, hyperthermia greatly
potentiates neurotoxic effects. Lowering the ambient temperature using substances such as
haloperidol, diazepam and MK-801, is effective in preventing neurotoxicity, however, this effect
was negated with an increase an ambient temperature. Importantly, methamphetamine treatment is
able to produce neurotoxic damage without a hyperthermic response and in hypothermic animals.

17
While the exact mechanisms of methamphetamine-induced hyperthermia are unknown, the release
of monoamines is thought to be involved (Albers et al., 1995). Also implicated in the hyperthermia
response are vasoconstriction produced by methamphetamine release of noradrenaline and
interleukin-1 (IL-1) produced during microglia stimulation (Bowyer et al., 1994).
1.41 Metabolism of methamphetamine
Methamphetamine has a relatively long half-life of approximately 12 hours in humans (Cho, 1990)
and undergoes a number of metabolic reactions within the liver, mainly involving the enzyme
CYP2D6 (Figure 1.43; Schep et al., 2010). Primary reactions include aromatic hydroxylation, N-
demethylation and aliphatic hydroxylation, although, the extent of these reactions varies widely
with species (Caldwell et al., 1972). Excretion is mainly via the urine and to a small extent by
sweat and in the faeces (Schep et al., 2010). In man, methamphetamine is not well metabolised
with 30-40% of the drug being eliminated unchanged compared to 15% in the rat. Other
metabolites found in urine include 4-hydroxymethamphetamine (15 %), hippuric acid (5 %),
amphetamine (2-3 %) norephedrine (2 %) and 4-hydroxynorephedrine (1-2 %) (Caldwell et al.,
1972).
1.42 Methamphetamine addiction
Methamphetamine is often described as the most addictive drug and can cause dependence after
the first use. While methamphetamine is highly addictive, addiction is a long term consequence
and results from changes in brain chemistry that compromise top-down control (Salo et al., 2006).
It is the euphoria experienced after intake to which users become addicted. This effect comes about
due to the stimulation of the mesolimbic and nigrostriatal reward pathways by the release of
dopamine (Thrash et al., 2009).

18
Figure 1.43: The main metabolic pathways of methamphetamine: (i) aromatic hydroxylation, (ii)
N-demethylation, (iii) β-hydroxylation, (iv) oxidative deamination (v) side-chain oxidation. In
man, the main pathways are (i) and (ii) resulting in 4-OH methamphetamine and amphetamine
respectively (Schep et al., 2010).
When questioned about their reasons for taking methamphetamine or relapsing to
methamphetamine, 27% of the study participants claimed to take the drugs impulsively with 31%
being unable to stop once they began preparation. Cravings were a highly rated motivation and
27% claimed to use drugs to lessen withdrawal symptoms (Newton et al., 2009). Withdrawal is
associated with disturbances of cognition and mood characterised by depression, anxiety, cravings
and increased sleeping and eating. These symptoms begin to lessen within 7 to 10 days of
abstinence (Berman et al., 2008).
The work of Day and colleagues (2008) revealed that mice which had been repeatedly exposed to
methamphetamine showed a decreased rate of glutamate release indicating presynaptic depression
at corticostriatal terminals. Withdrawal from the drug did not return glutamate to normal levels;
however, the effect was reversed upon the re-administration of the drug. Similarly, Bamford et al.
(2008) found a reduction of acetylcholine causing corticostriatal terminal depression which was
reversed with methamphetamine re-administration. These studies provide new insight into the
changes within the brain and account for some of the physiological components of addiction and

19
tolerance to the pleasurable effects which can develop after repeated use. As methamphetamine
causes a sustained depletion of dopamine, users have difficultly feeling any pleasure other than that
gained using the drug (NIDA, 2013).
The neurotoxic effects of methamphetamine severely impact the mechanisms of cellular function
such as the mitochondrial electron transport chain. This would result in changes to the biochemical
make up of the cell.
1.5 Metabolomics
The metabolome, as first described by Oliver and colleagues (1998), is the set of all low-
molecular-weight compounds, or metabolites, present within a cell or organism, that participate in
metabolic reactions. As the metabolome is the downstream product of gene expression, it shows
more diversity in physical and chemical properties than the transcriptome (RNA) or proteome
(protein) (Dunn et al., 2005). Any changes in the transcriptome or proteome, would consequently
be expected to be amplified in the metabolome (Goodacre et al., 2004). Metabolomics, therefore, is
the study of metabolites and how they are affected by genetic modification, stimuli or changes in
the environment. Metabolomics aims to identify and measure all metabolites in a system
(Almstetter et al, 2012).
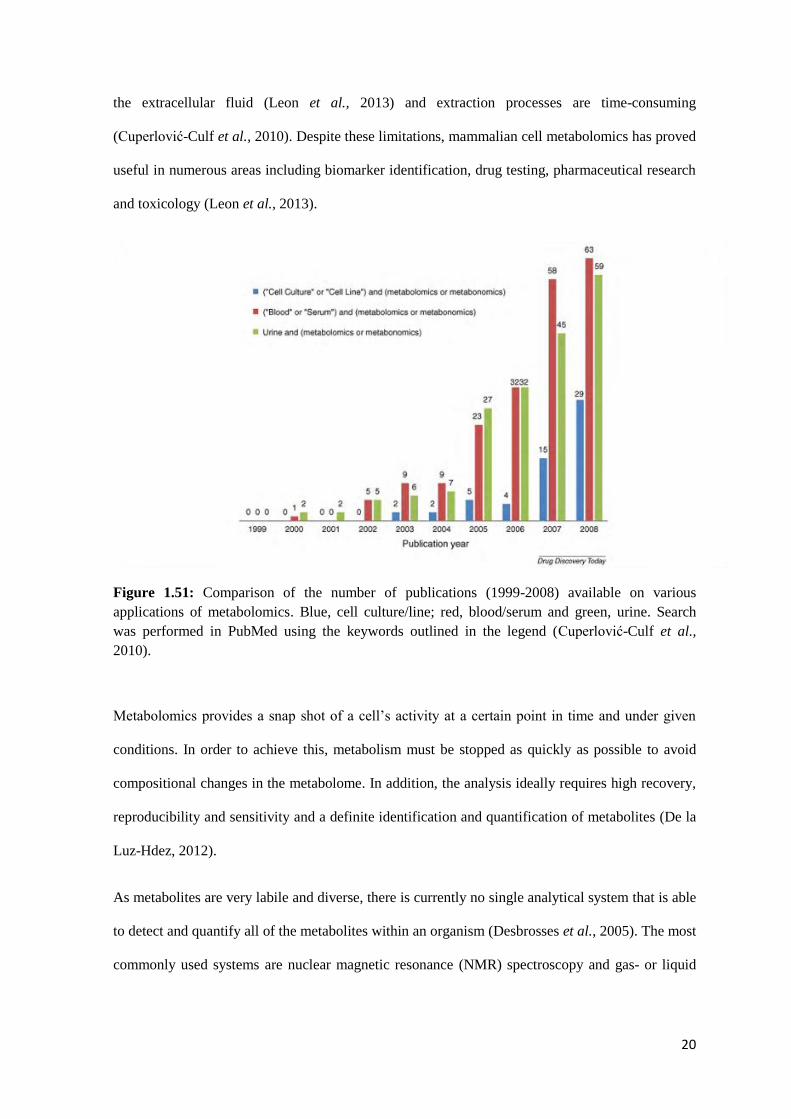
Although metabolomics has been in use for a number of years, metabolomic studies using
mammalian cells are limited. A review of the literature available shows that cell culture analysis,
while on the rise, still lags behind body fluids metabolomics (Figure 1.51; Cuperlović-Culf et al.,
2010). While they offer more limited metabolic functions, clonal cell lines are often preferred over
primary cells in metabolomic studies for their availability, simple handling and reduced variability
(Leon et al., 2013). In spite of this, the application of metabolomics to cell lines has been impeded
by several factors, key among them being the fact that the composition of the medium, seeding
density and age of the cells can all influence the metabolome. Common quenching processes, such
as the use of methanol, can cause damage to cell membranes, leading to leakage of metabolites into
20
the extracellular fluid (Leon et al., 2013) and extraction processes are time-consuming
(Cuperlović-Culf et al., 2010). Despite these limitations, mammalian cell metabolomics has proved
useful in numerous areas including biomarker identification, drug testing, pharmaceutical research
and toxicology (Leon et al., 2013).
Figure 1.51: Comparison of the number of publications (1999-2008) available on various
applications of metabolomics. Blue, cell culture/line; red, blood/serum and green, urine. Search
was performed in PubMed using the keywords outlined in the legend (Cuperlović-Culf et al.,
2010).
Metabolomics provides a snap shot of a cell‟s activity at a certain point in time and under given
conditions. In order to achieve this, metabolism must be stopped as quickly as possible to avoid
compositional changes in the metabolome. In addition, the analysis ideally requires high recovery,
reproducibility and sensitivity and a definite identification and quantification of metabolites (De la
Luz-Hdez, 2012).
As metabolites are very labile and diverse, there is currently no single analytical system that is able
to detect and quantify all of the metabolites within an organism (Desbrosses et al., 2005). The most
commonly used systems are nuclear magnetic resonance (NMR) spectroscopy and gas- or liquid
21
chromatography (GC; LC) coupled with mass spectrometry (MS). A comparison of various aspects
of these technologies is given in Table 1.5 (Mayr, 2008).
NMR detects the nuclear spin of molecules with uneven numbers of protons and neutrons such as
1H, which is present in high abundance in organic compounds. NMR is therefore able to detect a
wide range of metabolites, and is also highly reproducible and robust. NMR has the added
advantages of not destroying the sample during analysis and has the ability to perform in-vivo
analysis. However, NMR does have poor sensitivity when compared with mass spectrometry
(Mayr, 2008) and many functional groups are proton-deficient making identification challenging
(Villas-Boas et al., 2004).
GC-MS is a popular alternative to NMR due to its sensitivity. This technique separates compounds
by GC, based on their affinity for a gas or solid phase, before they undergo ionization,
fragmentation and detection in the MS (Desbrosses et al., 2005). Metabolites are identified by
comparison of retention time with known standards. GC-MS is most useful in the analysis of
volatile compounds, meaning that non-volatile metabolites (e.g. amino acids, sugars, fatty acids
and other polar metabolites) must be made thermally stable through chemical derivatisation before
being analysed by GC-MS (Dunn et al., 2005). This process is time-consuming and can introduce
confounding factors to the chromatogram (Halket et al., 2005). A key draw back of GC-MS is that
samples are destroyed during analysis (Dunn et al., 2005).
Functionally, LC-MS is similar to GC-MS, however LC separates metabolites based on their
affinity for a liquid or solid phase. LC-MS is suited to the analysis of non-volatile compounds that
are soluble in solution. An advantage of LC-MS is the ability to directly analyse many polar
metabolites without derivatisation (De la Luz-Hdez et al., 2012).

22
Table 1.5: A comparison of NMR, GC-MS and LC-MS in relation to metabolomics analysis
(Mayr, 2008).
1.6 Gas Chromatography-Mass Spectrometry
GC-MS is well established in mammalian cell metabolomics research (Leon, 2013). For this
reason, as well as its good sensitivity, separation power and ability to be applied to a wide range of
metabolites (Mayr, 2008), it is the platform utilised in the following experiments.
The GC consists of a gas supply, an injector, flow and pressure regulators and a column contained
within an oven (Figure 1.61). The sample is injected into the injector site, which is maintained at a
set temperature, and is evaporated. A carrier gas flows into the injector port at a constant and
controlled rate and carries the vaporised sample into the column. The column is usually an open
tubular, narrow bore fused silica tube to which the stationary phase is chemically bound. Within
the column, the evaporated compounds are separated according to their distribution between the
solid and gaseous phases. After separation, the sample is transferred to the MS (Villas-Boas et al.,
2007).
The MS performs the functions of analysing, detecting and determining structural information of
the sample. It consists of an ion source, mass analyser, detector and data system (Figure 1.61). The
most common ionization method used in GC-MS is electron impact. The ion source emits
energized electrons which collide with the sample molecules, producing ions in a fragmentation

23
pattern highly unique to that compound. The ions are transferred to a vacuum for determination of
the mass-to-charge ratio (m/z) in the mass analyser. The quadrupole mass analyser is commonly
used in the GC-MS system for its simplicity and reliability. It consists of four parallel rods with a
voltage supplied. The voltage creates a cylinder through which the molecules pass to reach the
detector. Only ions within a certain m/z range are allowed to pass through the entire cylinder;
others hit the rods and are neutralised. The detector measures the current or the number of ions
passing through as a function of time. This information is then read by the data system which
processes the information (Villas-Boas et al., 2007).
Figure 1.61: Overview of the GC-MS instrument. (Adapted from Dunnivant and Ginsbach, 2008)
There are seven main steps involved in GC-MS metabolomics. Firstly, quenching of the sample to
prevent further metabolic activity. This usually involves the separation of cells from the culture

24
medium and detachment from the culture plates which can lead to cell leakage. The quenching
process must be rapid and avoid metabolite destruction or modification (Desbrosses et al., 2005).
Secondly, metabolites must be extracted from the cells in an unbiased manner. This can be difficult
due to the range of metabolite polarities. Again, extraction must aim to minimise metabolite
changes (Dettmer et al., 2011). Next, the samples must undergo derivatisation to create thermal
stability for the GC-MS analysis. The samples are then separated and detected by GC-MS and,
lastly the chromatographic output is analysed by software to identify fragmentation patterns using
reference libraries (Desbrosses et al., 2005).

25
1.7 Aims
The impact of methamphetamine‟s neurotoxic effects is evident in the altered biochemistry of the
neuronal cell. The GC-MS metabolomics method provides an insight into these changes through
the identification and quantification of intra- and extracellular metabolites.
The aims of this project were to utilise an established in-vitro neuronal cell culture model to
investigate cellular mechanisms of methamphetamine neurotoxicity, specifically:
1) To demonstrate, measure and compare the decrease in neuronal viability after exposure to a
range of methamphetamine concentrations;
2) To analyse the metabolite profile of neuronal cells after administration of a range of
methamphetamine concentrations, and;
3) To study the changes to the metabolite profile of neuronal cells over time after administration of
a toxic dose of methamphetamine

26
2. Materials and methods
2.1 Materials
2.11 Chemicals and kits
D-sorbitol-6-13
C, Dulbecco‟s modified Eagle‟s medium (DMEM), foetal calf serum, L-glutamine,
methamphetamine hydrochloride, methoxyamine hydrochloride, n-alkanes (C10, C12, C15, C19, C22,
C28, C32, C36), N-methyl-N-(trimethylsilyl)trifluroacetamide (MSTFA), penicillin/streptomycin
solution, phosphate buffered solution (PBS), pyridine and trypsin-EDTA solution were all
purchased form Sigma-Aldrich, (Sydney Australia) in the highest purity available. LDH assay was
performed using a CytoTox 96 Non-Radioactive Cytotoxicity Assay kit purchased from Promega
Corporation, (Sydney, Australia). LC-MS grade methanol and HPLC grade water were purchased
from Fisher Scientific (Fair Lawn, USA). n-hexane (95%) was purchased from LabScan, (Gliwice,
Poland). Carbon dioxide (CO2) (food grade) and helium (ultra-high purity) were obtained from
BOC Gases, (Perth, Australia).
2.12 Cells
Cells used for all experiments were a B50 rat neuroblastoma cell line obtained through the
European Collection of Cell Cultures and purchased from Sigma Aldrich. Cells were grown in
75cm2 flasks (Corning, NY,USA) and maintained at 37
oC in a humidified atmosphere of 95% air
and 5% CO2 using a Thermo Scientific Heraeus Function Line incubator (Scoresby, Australia).
2.2 Methods
2.21 Cell culture
B50 cells were maintained in DMEM (12 mL) supplemented with 5% foetal calf serum, 1% L-
glutamine and 1% penicillin/streptomycin. Cells were cultured until 70-80% confluent before
being passaged or seeded onto 6-well plates for experimentation. Cells were dislodged from the
flask for passaging by trypsinisation. This involved the removal of DMEM and the addition of 2 ml
1 x trypsin-EDTA, incubation for 2 minutes at 37oC and 5% CO2 followed by inactivation of
trypsin by the addition of DMEM containing the above supplements. Cells were then resuspended
with fresh DMEM, aliquoted into new flasks and made up to 12 mL with DMEM.

27
Photos were taken using a Moticam 2300 camera (Motic Instruments Inc., Hong Kong) and Motic
Images Plus software (v2.0) in combination with an Olympus CKX41 microscope (Tokyo Japan)
immediately prior to harvesting to record morphological differences between control and
methamphetamine-treated cells.
2.22 Cell counting
One well on each plate was reserved for cell counting. In this process, which was conducted at the
same time as harvesting (2.24), the medium was removed from the well and 500 µL of trypsin
added to detach cells from the plate. The plate was incubated at 37oC for 5 minutes before the
addition of 2 mL of DMEM to terminate trypsinisation. An aliquot of 10 µL was transferred to a
haemocytometer and counted using an Olympus inverted research microscope (model IMT-2,
Tokyo, Japan.). The cells in the four corner squares were counted, excluding those on the outside
borders. The average of these counts was used to estimate the number of cells per well for each
plate.
The Trypan blue exclusion test was conducted during the cell counting process. In this assay, the
media was removed and 500 µL trypsin added to a single well as per the counting method above.
After 5 minutes incubation at 37oC, 2 mL of fresh DMEM was added. A 2 mL aliquot of the cell
suspension was centrifuged at 150 x g for 3 minutes and the supernatant discarded. The resulting
pellet was resuspended in 1 mL of PBS. Equal amounts (10 µL) of the cell suspension and 0.4%
Trypan blue were mixed in a 96-well plate and applied to the haemocytometer for counting. The
unstained (viable) and blue stained (dead or damaged) cells were counted separately and used to
estimate the percentage cell viability for each experimental condition.
2.23 LDH Assay
A lactate dehydrogenase (LDH) assay is a useful way to measure cytotoxicity mediated by
chemicals. Using colorimetric methods, the assay quantitatively measures lactate dehydrogenase,
an enzyme released upon cell lysis. Due to a coupled enzymatic reaction, the amount of colour
produced is directly proportional to the amount of LDH present (Promega, 2012).
28
Before experimental use, the method was optimised for use with B50 cells and Dulbecco‟s
modified Eagle‟s medium to determine correct dilution factors.
A 500 µL sample of media was collected from each well and placed in separate tubes before being
centrifuged at 1092 x g and 4oC for 5 minutes. These samples were diluted 1:50 with DMEM,
vortexed and kept on ice.
6-well plates containing cells and remaining media then underwent a freeze-thaw lysis process: 30
minutes at -80oC followed by a 15-minute incubation at 37
oC. During freeze-thaw lysis, the cells
break open as ice crystals formed during the freeze stage contract when thawing (Tansey, 2006).
Cells were scraped from each well into the media and both media and cells collected into tubes.
The tubes were vortexed and centrifuged at 1092 x g for 4 minutes. Each sample was diluted 1:100
with DMEM, vortexed and placed on ice.
Triplicate media and cell-media lysis samples was transferred to a 96-well plate at 50 µL per well.
Triplicates of media and treatment blanks were also included to ensure no background absorbance
or interaction of methamphetamine with the assay substrate. The assay substrate mix was added
(50 µL) to each well and the plate was covered and incubated at room temperature for 30 minutes.
After the incubation period, the assay stop solution was added (50 µL) and, after ensuring the
absence of bubbles, the absorbance was read at 490 nm using an iMark microplate absorbance
reader (Bio-rad; Gladesville, Australia).
2.24 Harvesting
The harvesting process is a crucial step in metabolomics studies. In order to stop enzymatic
activity, the samples must be quenched as quickly as possible after the treatment period. Without
this quenching step, degradation of the metabolites may occur and the composition of the sample
may alter. Harvesting also acts to detach adherent cells from culture plates (Dettmer et al., 2010).
From each plate, a medium sample of 40 µL was taken from five wells, pooled in a 1.5 mL tube
and stored on ice. Any remaining medium from these wells was then discarded. Cold PBS was
used as a cell wash buffer with the addition of 1 mL to each well. PBS was carefully removed and

29
discarded to avoid disturbing the cells. To quench the cells, a further 100 µL of cold PBS was
added and cells scraped into the buffer using a plastic cell scraper. The contents of the wells was
collected into a single 1.5 mL tube and stored on ice until freezing. All samples were transferred to
-80oC until frozen, after which they were freeze-dried using a Labconco FreeZone 2.5 Plus (Kansas
City, USA) and stored at -80oC until extraction.
2.25 Extraction
For metabolomic analysis to be successful, efficient metabolite extraction is required. Extraction is
the process by which metabolites are released from the cell sample and separated from other,
undesired, compounds such as proteins (Sana et al., 2007).
An extraction solution was prepared by dissolving the internal standard of 13
C6-sorbitol in LC-MS
grade methanol at 2.6 µg/mL. 500 µL of extraction solution was added to each cell and media
sample. The cell samples were vortexed and the contents transferred to lysis tubes. The contents of
the cells were extracted using the Precellys 24 lysis and homogenisation tissue lyser (Bertin
Technologies, Aix-en-Provence, France), run for two 20-second cycles at 6500 rpm.
Both the medium and cell samples were centrifuged at 16,100 x g for 10 minutes and 300 µL of the
resulting supernatant transferred to fresh 1.5 mL tubes. The volume was reduced using the
Eppendorf Concentrator Plus rotary vacuum concentrator (North Ryde, Australia) for 90 minutes
to reduce the volume by at least 75% to facilitate freezing. 300 µL HPLC grade water was added to
each sample and tubes were frozen at -80oC. Once frozen, the samples were freeze-dried and stored
at -80oC until derivatisation.
2.26 Derivatisation
In order to improve the sensitivity and specificity of analysis using gas chromatography, a
derivatisation step is required. This enables the analysis of non-volatile compounds and improves
separation on GC columns (Almstetter et al., 2012). The derivatisation method used in this project
is well-established (Abbiss et al., 2012).

30
A solution of 20 mg/mL methoxyamine hydrochloride in pyridine was prepared and 20 µL added
to each extracted sample. By reacting with carbonyl groups to form oxime derivatives,
methoxyamine acts as a protective agent, ensuring compounds are able to be derivatised (Sellers,
2007). Using the Eppendorf Thermomixer comfort (North Ryde, Australia) samples were agitated
at 1200 rpm and 30oC for 90 minutes. Samples were then centrifuged at 16,100 x g for 1 minute
and 40 µL of MSTFA was added to each. The samples were further agitated at 300 rpm at 37oC for
30 minutes. Each sample was transferred to a 2 mL GC vial, 100 µL standard insert and aluminium
combination seal, and 5 µL of a mixture of n-alkanes in n-hexane were added. This alkane mixture
(C10-C36, 0.625 mg/mL) is added to allow the calculation of a Kovat‟s index.
2.27 Instrumental analysis
The gas chromatography-mass spectrometry (GC-MS) system used for these experiments was an
Agilent 6890 Series gas chromatograph with an Agilent 7683 autosampler and injector, coupled
with an Agilent 5973 Series single quadrupole mass selective detector (Agilent Technologies,
Santa Clara, USA) using an established metabolomic analysis method (Abbiss et al., 2012). The
GC carrier gas was helium and a deactivated inlet liner with glass wool was used. The column used
for analyte separation in these experiments was an Agilent FactorFour VF-5ms fused silica
capillary column (30 m length x 0.25 mm internal diameter 0.25µm film thickness + 10 m EZ-
Guard; Agilent Technologies).
The GC program was as follows: inlet temperature was set to 230oC and the oven had an initial
temperature of 70oC. The temperature was ramped at 1
oC per minute for 6 minutes and then
increased a further 5.63oC per minute to reach a final temperature of 330
oC, which was maintained
for 10 minutes. The GC to MS transfer line was held at 330oC and the ion source was set to 230
oC
and 70 eV, with an 8-minute solvent delay. The detector performed a full scan for the mass range
of m/z 45 to 600 at 1 scan per second.

31
2.28 Data analysis
GC-MS data was imported into Analyzer Pro (v2.7.0; Spectral Works Ltd., Runcorn, United
Kingdom). This program assigns peaks to the data and identifies metabolites by comparison with a
target component library (Metabolomics Node, Murdoch University and National Institute of
Standards and Technology (NIST) 2005), matching according to mass spectrum and retention
index information. The results of this analysis were exported as a matrix into Microsoft Excel
(v12.0; Microsoft Corporation, Redmond, USA) to allow for manual inspection and data clean-up.
The Excel matrix was imported into The Unscrambler X (v10.1; CAMO, Oslo, Norway) to allow
for comparison between samples. The matrix data was transformed by log10 before performing a
principal component analysis, using non-linear iterative partial squares algorithm, cross validation
and no rotation. For the dose curve and time course experiments, data was normalised to the total
ion chromatogram (TIC) for each sample.
2.3 Experiments
2.31 LDH assay
B50 cells were grown in 75cm2 flasks until 70-80% confluent before being seeded onto 6-well
plates at 3 mL per well. Methamphetamine solution was prepared at 14.9 mg/mL
methamphetamine hydrochloride in HPLC grade H2O and serially diluted to achieve the desired
dose. After 24 hours incubation at 37oC and 5% CO2, cells were treated with 30 µL
methamphetamine to reach final concentrations of 1 µm, 10 µM, 100 µM and 1 mM which were
tested in triplicate. Three wells were used as a vehicle control using HPLC grade H2O. Plates were
incubated for 48 hours and after the treatment period, LDH cytotoxicity assay was performed as
described in 2.23.
2.32 Dose curve
To examine the influence of methamphetamine concentration on the neuronal metabolite profile,
an experimental dose curve was conducted. A reduction in cell viability following exposure to
methamphetamine at various concentrations has been well recorded within the literature. In
neuronal cells, Stumm and colleagues (1999) found 1 mM methamphetamine led to approximately
32
50% reduction in viability after 96 hours exposure. Similar results were found by Shao and
colleagues (2012), who found a 50% drop in the viability of endothelial cells compared to control
after 48 hours exposure to methamphetamine. At methamphetamine concentrations below 0.125
mM, little to no change in neuronal viability was reported after 24 hours incubation (Sinchai et al.,
2011). Using a range of concentrations would allow us to compare the metabolic changes
occurring at toxic and sub-toxic doses of methamphetamine.
Cells were grown in 75cm2 flasks until 70-80% confluent before being plated in 6-well plates.
Methamphetamine solution was prepared at 14.9 mg/mL methamphetamine hydrochloride in
HPLC grade H2O and serially diluted to achieve the desired dose. After 24 hours incubation at
37oC and 5% CO2, cells were treated with 30 µL methamphetamine solution to final concentrations
of 100 nM, 1 µM, 10 µM, 100 µM and 1 mM. Each concentration was tested in triplicate with an
additional three plates used as controls with the addition of HPLC grade H2O. The plates were
incubated for 48 hours before harvesting and this experiment was undertaken in duplicate.
2.33 Time Course
The biochemical changes over time due to methamphetamine administration were investigated
using a time course experiment. Cells were cultured in 75cm2 flasks until 70-80% confluent, plated
into 6-well plates and incubated for 24 hours at 37oC and 5% CO2. Methamphetamine solution was
prepared at 14.9 mg/mL methamphetamine hydrochloride in HPLC grade H2O. Six plates were
administered 30 µL of methamphetamine for a final concentration of 1 mM, with the remaining six
kept as controls by adding HPLC grade H2O. At 6, 24 and 48 hours after drug administration,
duplicate treated and control plates were harvested. This time course experiment was conducted in
duplicate.
33
3. Results 3.1 Cell viability testing
To investigate the effect of methamphetamine dose on B50 neuroblastoma cells, cells were
exposed to a range of methamphetamine concentrations (100 nM, 1µM, 10 µM, 100 µM and 1
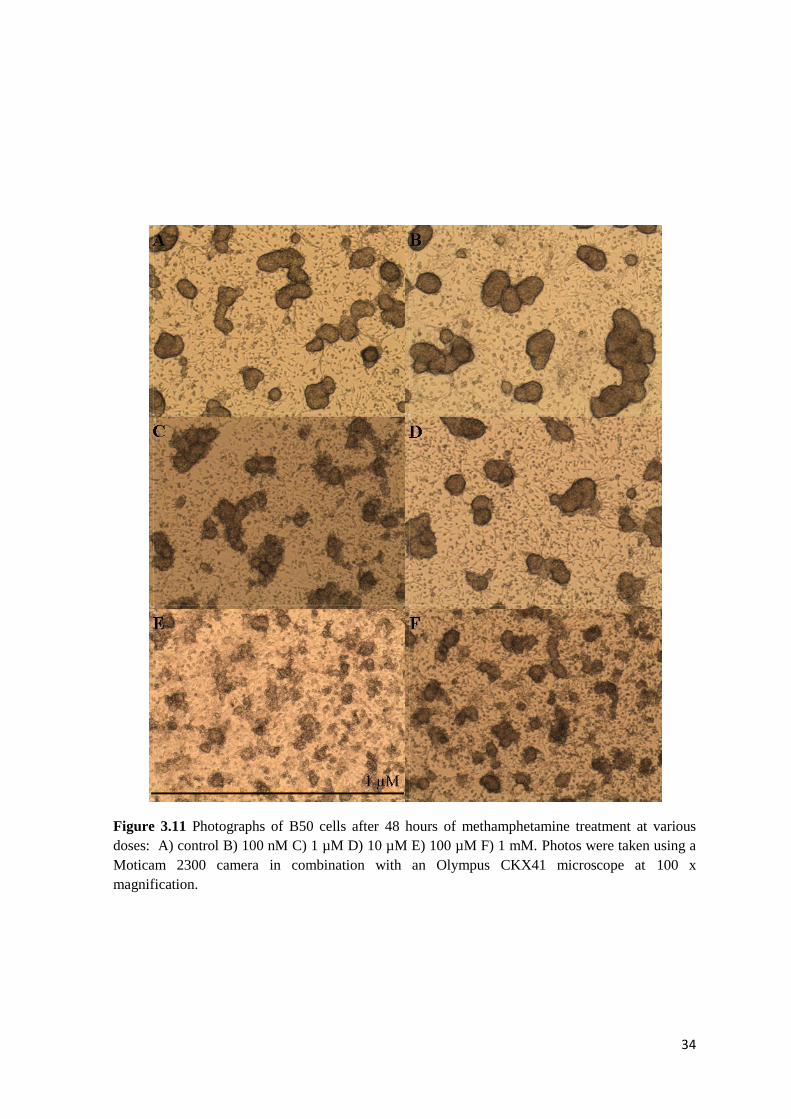
mM) for 48 hours. The photographic evidence of observed changes is shown in Figure 3.11.
At 48 hours, all cells including controls displayed some indications of clumping or aggregation.
The cells demonstrated little change in appearance from controls at concentrations below 100 µM.
At 100 µM and 1 mM methamphetamine, the B50 cells showed excessive aggregation and retained
little normal neuronal morphology.
To determine if the morphological changes coincided with cell death, toxicity was quantified using
a LDH cytotoxicity assay. B50 rat neuroblastoma cells were incubated with methamphetamine (1
µM, 10 µM, 100 µM and 1 mM) for 48 hours and cytotoxicity compared to controls was
determined by LDH assay (see 2.23). The results, expressed as percentage cytotoxicity are
presented in Figure 3.12. The cytotoxicity of 1 mM methamphetamine (21.9% ± 4.8) was found to
be considerably higher than the control (14.9% ± 1.6) while the lowest concentration tested, 1 µM,
showed very little change from the control (15.3% ± 0.9). Conversely, the mid-range
concentrations of 10 µM and 100 µM showed less toxicity than the control and 1 µM
methamphetamine.
As a comparison to the LDH method, Trypan blue exclusion was also used to assess cell viability.
B50 cells treated with methamphetamine at a range of concentrations (100 nM, 1 µM, 10 µM, 100
µM and 1 mM) were compared to control cells after 48 hours of exposure. The results, given as a
percentage of the control, are shown in Figure 3.13. This shows a dose-dependent decrease in the
viability of neuronal cells as compared to controls, with the viability of the highest concentration (1
mM) being 69.9% ± 3.4 of the control.
34
Figure 3.11 Photographs of B50 cells after 48 hours of methamphetamine treatment at various
doses: A) control B) 100 nM C) 1 µM D) 10 µM E) 100 µM F) 1 mM. Photos were taken using a
Moticam 2300 camera in combination with an Olympus CKX41 microscope at 100 x
magnification.

35
Figure 3.12: Cytotoxicity of methamphetamine after 48 hours exposure to neuronal cells as
measured by LDH assay. The percentage cytotoxicity of methamphetamine (concentration 1 µM,
10 µM, 100 µM and 1 mM) to cultured neuronal cells compared to controls. % cytotoxicity
represents mean ± standard error (n=3). Percentage cytotoxicity was calculated by comparing LDH
release of medium samples taken from each concentration or control with its corresponding total
cell fraction.
0
5
10
15
20
25
30
Control 1uM 10uM 100uM 1mM
% C
yto
toxi
city
Methamphetamine concentration

36
Figure 3.13: Cell viability after 48 hours exposure to methamphetamine as measured by Trypan
blue exclusion testing. The viability of neuronal cells after methamphetamine exposure
(concentrations 100 nM, 1 µM, 10 µM, 100 µM and 1 mM) compared to controls. Viability is
given as a percentage of the control value. % viability represents mean ± standard error (n=4).
0
20
40
60
80
100
120
Control 100nM 1uM 10uM 100uM 1mM
% V
iab
ility
Methamphetamine concentration

37
3.2 Dose curve
The fact that methamphetamine causes neuronal death is well known, however, the biochemical
response of cells to methamphetamine administration is less well documented. A dose curve
experiment was undertaken to compare the changes occurring in the metabolome under
administration of methamphetamine at toxic and sub-toxic doses from 100 nM to 1 mM. In order
to compare the results from duplicate experiments, the data was normalized to the total ion
chromatogram (TIC) for each sample.
3.2.1. Intracellular metabolites
Principal component analysis (PCA) is a common method for data mining in metabolomics
analysis (Putri et al., 2013). The scores plot (Figure 3.21-A) shows the relationship between the
treatment groups. Variance in the cell sample dataset is best described by principal component 1
(PC-1), which explains 48%, while PC-2 explains 28%. The control samples grouped most closely
with the 1 µM samples and separate from the higher concentrations, which grouped together.
Triplicate samples at 100 nM methamphetamine were included as part of the experiment, but were
excluded from analysis due to the large variance between the replicates.
The loadings plot (Figure 3.21-B) identifies the metabolites which contribute most to the difference
observed between samples. The loadings data was extracted from this plot and twelve metabolites
which had the most impact on the variance between samples were chosen from the loadings plot
for further study. The peak area at each concentration was then expressed as a percentage of the
control. Figures 3.22 and 3.23 display the results of this analysis, showing the amino acids and
other metabolites, respectively.
A number of amino acids including L-isoleucine, showed a decrease in peak area as dose increased
from 100 µM to 1 mM. L-proline followed a similar trend, with peak area increasing from 0.76 ±
0.10 to 1.26 ± 0.07 between 1 µM and 100 µM before dropping below control at 1 mM. Overall, L-

38
Figure 3.21: Principal component analysis of GC-MS metabolomics data generated from B50 rat
neuroblastoma cells following exposure to methamphetamine. Cells were incubated with or
without methamphetamine (1 µM, 10 µM, 100 µM, 1 mM) for 48 hours. (A) Scores plot, with
sample groupings identified. (B) Loadings plot, showing metabolites and their influence on the
sample groupings in (A). Data was deconvoluted, compounds identified and normalised to internal
standard prior to multivariate analysis.

39
Figure 3.22: Changes in intracellular amino acids of B50 cells with dose of methamphetamine
identified by PCA as contributing most to the variance observed between samples. Cells were
incubated with or without methamphetamine (1 µM, 10 µM, 100 µM, 1 mM) for a period of 48
hours. Amino acids were chosen from the GC-MS metabolite data, normalised to total ion
chromatogram and presented as a percentage of the control value. Peak area is mean ± standard
error. n=3

40
Figure 3.23: Changes in intracellular metabolites of B50 cells with dose of methamphetamine
identified by PCA as contributing most to the variance observed between samples. Cells were
incubated with or without methamphetamine (1 µM, 10 µM, 100 µM, 1 mM) for a period of 48
hours. Metabolites were chosen from the GC-MS metabolite data, normalised to total ion
chromatogram and presented as a percentage of the control value. Peak area is mean ± standard
error. n=3
41
leucine, L-threonine and L-valine showed very little change from the controls. Only L-serine
showed an upwards trend, with a dose-dependent increase in peak area.
The “other” metabolite group displayed more variety in trends compared to the amino acids. Of all
the metabolites analysed, galactose had the greatest increase in peak area with a substantial
increase from 0.13 ± 0.01 at 1 µM to 333.64 ± 2.68 at 10 µM, remaining high until a slight
decrease at 1 mM. Cholesterol and glycerol 3-phosphate levels decreased to below controls at 1
mM methamphetamine. γ-aminobutyric acid (GABA) showed a similar trend, except instead of
decreasing at 1 mM, GABA levels increased sharply. Levels of N-acetylglutamate slowly
increased from 3.15 ± 1.17 to 3.79 ± 0.71 between 1 µM and 100 µM and sharply decreased to 1.56
± 0.95 at 1mM of methamphetamine. Octadecenoate levels increase from 0.66 ± 0.15 at 1 µM to
1.31 ± 0.21 at 10 µM then gradually declined.
3.2.2 Extracellular metabolites
In order to have a full understanding of metabolic changes, it is important to consider both the
intracellular metabolome, the metabolites within the cell, and the extracellular metabolome,
consisting of the metabolites present within the culture medium. Changes within the cell may be
reflected in the extracellular metabolome, and there may also be the exchange of metabolites
between cells and the surrounding medium due to uptake or excretion (Leon, 2013).
A PCA was generated from the GC-MS data of media samples and is presented in Figure 3.24. The
scores plot (A) shows clear differences between the treatment groups. The variance between
groups is best explained by PC-1 (43%) and PC-2 (20%). Compared to the cell PCA in Figure
3.21, there appears to be a greater overlap between samples treated with low and high
concentrations of methamphetamine. The loadings plot (B) was used to identify the metabolites
representing the greatest source of variance between the groupings, which were further analysed
and plotted as dose curves (Figures 3.25, 3.26 and 3.27). Triplicates samples at 100 nM
methamphetamine were included as part of the experiment, but were excluded from analysis due to
the large variance between the replicates.

42
Figure 3.24: Principal component analysis of GC-MS metabolomic data generated from medium
obtained from B50 rat neuroblastoma cells following exposure to methamphetamine. Cells were
incubated with or without methamphetamine (1 µM, 10 µM, 100 µM, 1 mM) for a period of for 48
hours. (A) Scores plot, with sample groupings identified. (B) Loadings plot, showing metabolites
and their influence on the sample groupings in (A). Data was deconvoluted, compounds identified
and normalised to internal standard prior to multivariate analysis.

43
Figure 3.25: Changes in extracellular amino acids of B50 cells with dose of methamphetamine
identified by PCA as contributing most to the variance observed between samples. Cells were
incubated with or without methamphetamine (1 µM, 10 µM, 100 µM, 1 mM) for a period of 48
hours. Amino acids were chosen from the GC-MS metabolite data, normalised to total ion
chromatogram and presented as a percentage of the control value. Peak area is mean ± standard
error. n=3
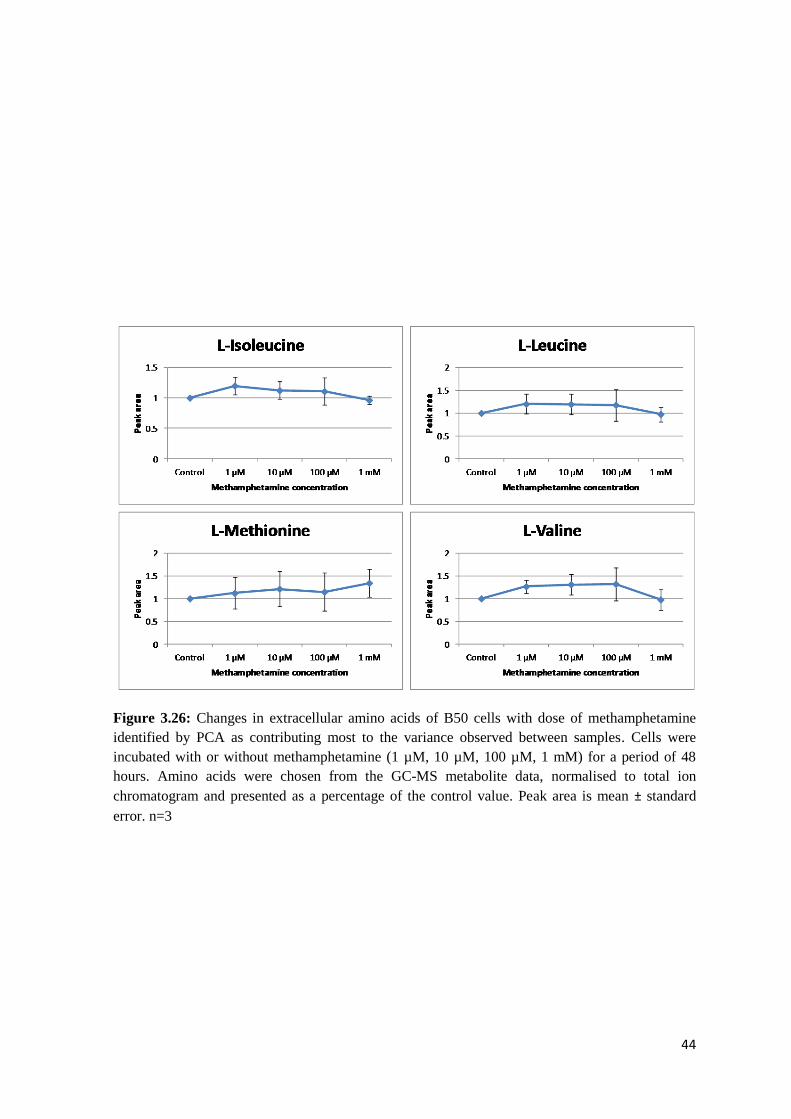
44
Figure 3.26: Changes in extracellular amino acids of B50 cells with dose of methamphetamine
identified by PCA as contributing most to the variance observed between samples. Cells were
incubated with or without methamphetamine (1 µM, 10 µM, 100 µM, 1 mM) for a period of 48
hours. Amino acids were chosen from the GC-MS metabolite data, normalised to total ion
chromatogram and presented as a percentage of the control value. Peak area is mean ± standard
error. n=3

45
Figure 3.27: Changes in extracellular metabolites of B50 cells with dose of methamphetamine
identified by PCA as contributing most to the variance observed between samples. Cells were
incubated with or without methamphetamine (1 µM, 10 µM, 100 µM, 1 mM) for a period of 48
hours. Metabolites were chosen from the GC-MS metabolite data, normalised to total ion
chromatogram and presented as a percentage of the control value. Peak area is mean ± standard
error. n=3

46
The extracellular metabolites chosen for further review have been placed into three groups for
analysis according to type and direction of change. The first group (Figure 3.25) containing the
amino acids L-alanine, glycine, L-proline, L-serine and L-threonine, showed an increase in peak
area as the dose of methamphetamine increased. The second group (Figure 3.26) is the amino acids
L-isoleucine, L-leucine, L-methionine and L-valine, which followed a trend of decreasing peak
area with increasing dose. Lastly, non-amino acid metabolites (Figure 3.27). Arabitol and urea
levels decreased with increasing methamphetamine concentration. The levels of galactofuranose
remained steady before a sharp decrease in peak area from 1.20 ± 0.11 at 100 µM to 0.88 ± 0.41 at
1 mM. Both myo-inositol and octadecenoate followed a general increase in peak area as the
methamphetamine concentration increased. Similarly, uracil levels also increased with dose;
however, a drop in peak area was recorded at 100 µM (0.86 ± 0.14) before rising again at 1 mM
(1.71 ± 0.35).
3.3 Time course
To measure the biochemical response of B50 neuroblastoma cells to methamphetamine over time,
a time course experiment was conducted. This analysis compared incubation periods of various
lengths: a short incubation of 6 hours, an intermediate 24 hours and an extended 48-hour
incubation.
3.3.1 Intracellular metabolites
The PCA created from the intracellular GC-MS dataset is presented in Figure 3.31. The scores plot
(A), shows the difference between the groups as best modelled by PC-1 (44%) and PC-2 (20%).
The scores plot shows distinct differences between the different time groups with the control and
treatment groups for each time period close together. This shows there was more variance based on
time than based on treatment. The loadings plot (B) identifies the metabolites which accounted for
the variation between samples. From this data, the change in peak area over time has been
graphically represented for the metabolites representing the most variance (Figures 3.32 and 3.33).
47
Figure 3.31: Principal component analysis of GC-MS metabolomics data generated from B50 rat
neuroblastoma cells following exposure to methamphetamine. Cells were incubated with or
without 1 mM methamphetamine for 6, 24 or 48 hours. (A) Scores plot, with sample groupings
identified. (B) Loadings plot, showing metabolites and their influence on the sample groupings in
(A). Data was deconvoluted, compounds identified and normalised to internal standard prior to
multivariate analysis.

48
Figure 3.32: Changes over time of intracellular amino acids of B50 cells incubated with
(treatment) or without (control) methamphetamine (1 mM) for periods of 6, 24 or 48 hours.
Metabolites were identified from the GC-MS metabolite data by PCA as contributing most to the
variance observed between samples. Data was normalised to total ion chromatogram. Peak area is
mean standard ± error. n=3
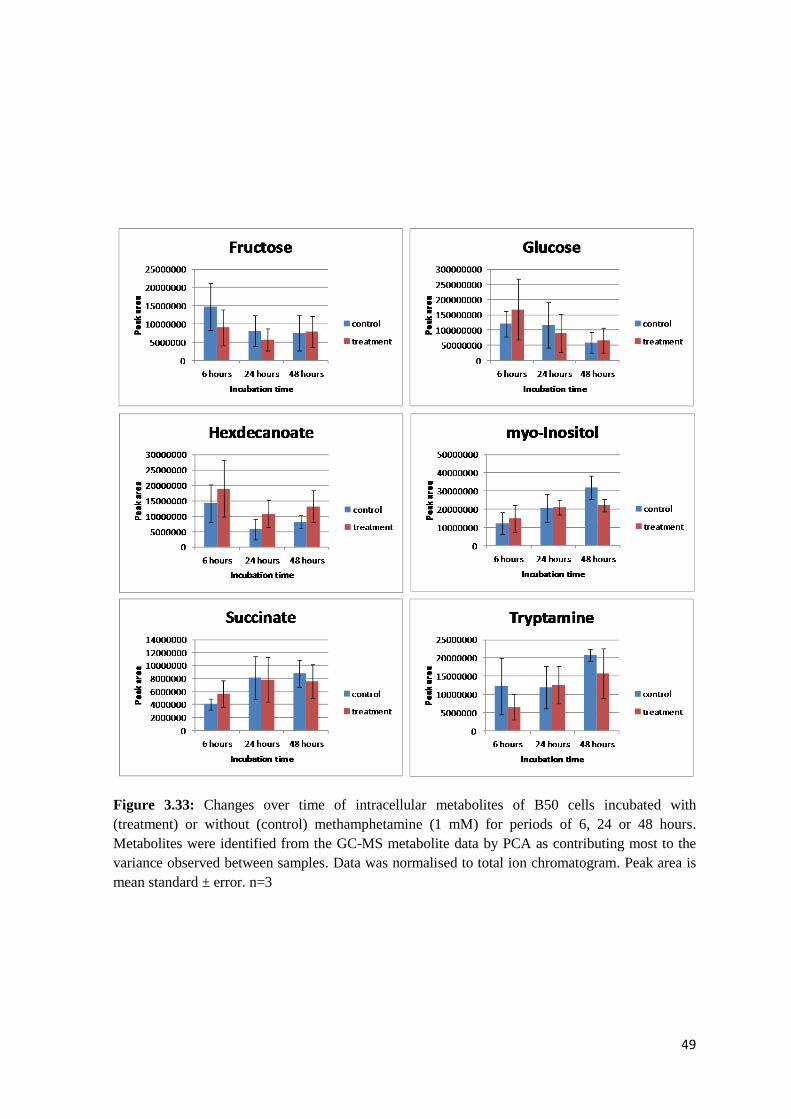
49
Figure 3.33: Changes over time of intracellular metabolites of B50 cells incubated with
(treatment) or without (control) methamphetamine (1 mM) for periods of 6, 24 or 48 hours.
Metabolites were identified from the GC-MS metabolite data by PCA as contributing most to the
variance observed between samples. Data was normalised to total ion chromatogram. Peak area is
mean standard ± error. n=3
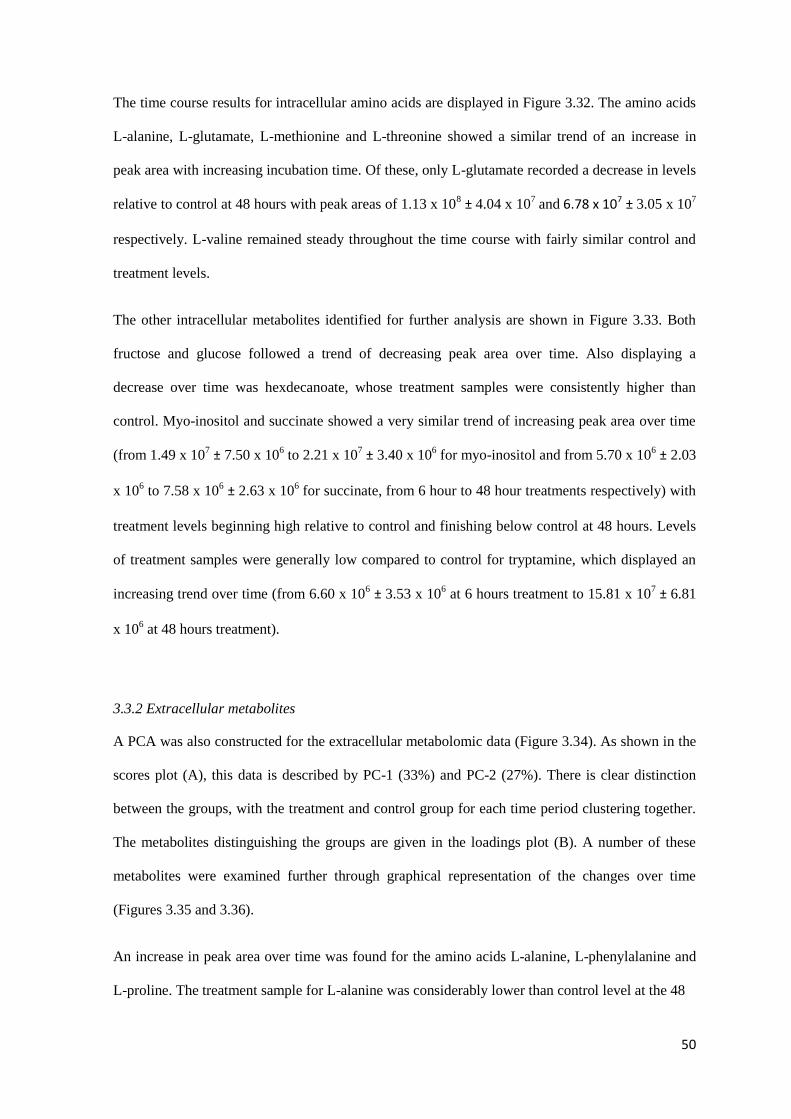
50
The time course results for intracellular amino acids are displayed in Figure 3.32. The amino acids
L-alanine, L-glutamate, L-methionine and L-threonine showed a similar trend of an increase in
peak area with increasing incubation time. Of these, only L-glutamate recorded a decrease in levels
relative to control at 48 hours with peak areas of 1.13 x 10⁸ ± 4.04 x 10
7 and 6.78 x 10⁷ ± 3.05 x 10
7
respectively. L-valine remained steady throughout the time course with fairly similar control and
treatment levels.
The other intracellular metabolites identified for further analysis are shown in Figure 3.33. Both
fructose and glucose followed a trend of decreasing peak area over time. Also displaying a
decrease over time was hexdecanoate, whose treatment samples were consistently higher than
control. Myo-inositol and succinate showed a very similar trend of increasing peak area over time
(from 1.49 x 10⁷ ± 7.50 x 10
6 to 2.21 x 10
7 ± 3.40 x 10
6 for myo-inositol and from 5.70 x 10
6 ± 2.03
x 106 to 7.58 x 10
6 ± 2.63 x 10
6 for succinate, from 6 hour to 48 hour treatments respectively) with
treatment levels beginning high relative to control and finishing below control at 48 hours. Levels
of treatment samples were generally low compared to control for tryptamine, which displayed an
increasing trend over time (from 6.60 x 10⁶ ± 3.53 x 10
6 at 6 hours treatment to 15.81 x 10
7 ± 6.81
x 106 at 48 hours treatment).
3.3.2 Extracellular metabolites
A PCA was also constructed for the extracellular metabolomic data (Figure 3.34). As shown in the
scores plot (A), this data is described by PC-1 (33%) and PC-2 (27%). There is clear distinction
between the groups, with the treatment and control group for each time period clustering together.
The metabolites distinguishing the groups are given in the loadings plot (B). A number of these
metabolites were examined further through graphical representation of the changes over time
(Figures 3.35 and 3.36).
An increase in peak area over time was found for the amino acids L-alanine, L-phenylalanine and
L-proline. The treatment sample for L-alanine was considerably lower than control level at the 48
51
Figure 3.34: Principal component analysis of GC-MS metabolomics data generated from medium
obtained from B50 rat neuroblastoma cells following methamphetamine exposure for 6, 24 or 48
hours. (A) Scores plot, with sample groupings identified. (B) Loadings plot, showing metabolites
and their influence on the sample groupings in (A). Data was deconvoluted, compounds identified
and normalised to internal standard prior to multivariate analysis.

52
Figure 3.35: Changes over time of extracellular amino acids of B50 cells incubated with
(treatment) or without (control) methamphetamine (1 mM) for periods of 6, 24 or 48 hours. Amino
acids were identified from the GC-MS metabolite data by PCA as contributing most to the variance
observed between samples. Data was normalised to total ion chromatogram. Peak area is mean
standard ± error. n=3

53
Figure 3.36: Changes over time of extracellular metabolites of B50 cells incubated with
(treatment) or without (control) methamphetamine (1 mM) for periods of 6, 24 or 48 hours.
Metabolites were identified from the GC-MS metabolite data by PCA as contributing most to the
variance observed between samples. Data was normalised to total ion chromatogram. Peak area is
mean standard ± error. n=3

54
hour mark (48 hours control, 1.55 x 10⁶ ± 2.62 x 10
5 and 48 hours treatment, 5.42 x 10⁵ ± 3.08 x
105). L-phenylalanine treatment samples were above control at all incubation times. A trend of
decreasing peak area over time was shown by L-isoleucine, L-serine and L-valine. At the 24- and
48-hour time periods (1.32 x 10⁷ ± 6.82 x 10
6 and 1.05 x 10
7 ± 6.35 x 10
6 respectively), the levels
of L-serine treatment samples were noticeably higher than control (6.32 x 10⁶ ± 4.52 x 10
6 and 4.22
x 106 ± 4.75 x 10
6 respectively).
Of the extracellular metabolites presented in Figure 3.36, only myo-inositol followed a trend of
decreasing peak area over time (7.22 x 10⁷ ± 2.19 x 10
7 at 6 hours treatment and 5.40 x 10⁷ ± 1.02
x 107 at 48 hours treatment) with the remaining metabolites increasing over time. The glycerol
samples show a noticeable increase in peak area from 24 to 48 hours (2.64 x 10⁵ ± 3.61 x 10
4 at 24
hours treatment to 7.06 x 10⁵ ± 2.52 x 10
5 at 48 hours treatment). The levels of treatment samples
compared to control remained fairly similar for all metabolites analysed.

55
4. Discussion 4.1 Cell viability testing
To demonstrate the neurotoxic effects of methamphetamine at a range of doses, neuronal cells
were exposed to the drug and the cells subsequently photographed (Figure 3.11). The clumping and
aggregation observed upon methamphetamine administration shows that the drug caused visible
morphological damage to these cells. This damage would affect neuronal function and result in the
loss of neuronal viability.
The B50 cells displayed increased aggregation and altered morphology when exposed to high
concentrations of methamphetamine compared to low concentrations. This shows that the degree
of damage due to methamphetamine was dose-dependent, with damage increasing with increased
dose.
To test whether the visible damage translated into cytotoxicity and cell death, an LDH assay was
performed. It was expected that cytotoxicity would increase as the dose of methamphetamine
increased. However, the results of the LDH assay were unusual, with the 10 µM and 100 µM doses
of methamphetamine resulting in cytotoxicity below control and the 1 µM levels (Figure 3.12).
These results are in conflict with those of Huang et al. (2009) and Zhou et al. (2004), who found a
dose-dependent increase in cytotoxicity in response to methamphetamine by quantifying LDH.
Zhou and colleagues (2004) reported a cytotoxicity level 30.2% above control for 1 mM
methamphetamine after 48 hours. This is considerably higher than the result of 6.96% above
control for the same dosage achieved in this experiment. In keeping with the results of this
experiment, Huang and colleagues (2009) found that methamphetamine concentrations at and
below 1 mM did not have a significant cytotoxic effect after 24 hours of exposure. However,
Welder (1992) reported a significant LDH release for 1 mM methamphetamine in the same time
frame. This disparity may be due to a difference in method or cell type used, as some cell types
may be more susceptible to the effects of methamphetamine than others. To discount the
possibility of interference on the LDH results, both the modified DMEM and methamphetamine
used in the experiment were analysed using the procedure given in 2.23. Neither was found to

56
cause interference effects or react with the reagents. It may be that this LDH test kit is unsuitable
for the cell culture model used in this experiment.
Due to the inconsistent results obtained using LDH assay, Trypan blue exclusion testing was
conducted as a comparison (Figure 3.13). The results of this test showed a decrease in cell viability
with increased dose of methamphetamine. This result is backed up by similar findings by Wu et al.
(2007). However, the decrease in viability found in this experiment was greater than that reported
by Wu. After 48 hours exposure to 1 mM methamphetamine the viability was found to be 69.9%
compared to control. In contrast, Wu and colleagues (2007) found a viability of 85% compared to
control for 1 mM. The decrease in viability for the other concentrations tested was also greater than
that found by Wu et al. (2007) who saw very little change in viability for concentrations below 1
mM using Trypan blue. Possibly the B50 cell type used in this experiment was more sensitive to
methamphetamine than that used by Wu. A difference in the method used may also account for
these changes, as the vortex used in this experiment to separate cells from medium may have
caused additional damage to cell membranes. Also, as Trypan blue counting techniques rely on
observing the change in colour of the cells, human error could play a part in the discrepancies.
4.2 Dose curve
In order to study the biochemical response of neuronal cells to methamphetamine administration, a
dose curve was established, comparing the changes within the cell and the surrounding medium at
a range of doses. Those metabolites that showed the most difference between doses were chosen
for further analysis, a large proportion of which were amino acids. Other metabolites affected
included carbohydrates, fatty acids and organic compounds.
The release of the excitatory amino acid and neurotransmitter glutamate is known to occur as part
of the neurotoxic action of methamphetamine. This event is highly dependent on the influx of Ca2+
and causes the continued activation of glutamate receptors, leading to excitotoxicity and neuronal
death (Jayanthi et al., 2005). Further damage is caused by the influx in Ca2+
through the activation

57
of kinases, proteases and lipases, the breakdown of cytoskeletal proteins and the production of free
radicals and resulting DNA damage (Quinton et al., 2006).
The metabolite N-acetylglutamate is a product of glutamate and therefore is reflective of glutamate
levels within the cell (Caldovic and Tuchman, 2003). Upon exposure to methamphetamine, the
amount of N-acetylglutamate within the cell was found to increase relative to control, before
decreasing at the highest methamphetamine concentration. Release of glutamate is enhanced by
methamphetamine administration (Pederson et al., 2000) and may be responsible for the increase
in N-acetylglutamate. The reduction in N-acetylglutamate at high doses of methamphetamine may
be due to protective mechanisms lowering the amount of free glutamate available and thereby
reducing excitotoxicity.
The amount of L-threonine detected within the treated cell followed a bell shaped curve, with
levels increasing until 100 µM and then decreasing. The decrease of L-threonine seen with higher
doses could be due to the amino acid being transported out of the cell to the media. This coincides
with the increase in extracellular L-threonine at 1 mM methamphetamine. The reduction of
intracellular L-threonine may also be accounted for by conversion to glycine via serine
hydroxymethyl transferase followed by export to the medium (Fraser and Newman, 1975). This is
supported by an increased detection of glycine within the medium. Glycine has neurotransmitter
properties and acts as a co-agonist with glutamate for the NMDA receptor. Excessive stimulation
of this receptor can result in excitotoxic damage (Laube et al., 1997).
The amino acid L-proline is an intracellular metabolite that was found to be affected by
methamphetamine. Proline is synthesised from its precursor, L-glutamate, via a number of steps
(Jones, 1985). The decrease in availability of glutamate as a precursor could explain the reduced
levels of proline at high doses of methamphetamine. Export of proline to the extracellular space
could provide another possible explanation for the decrease. This is supported by a corresponding
increase in proline levels in the medium at 1 mM methamphetamine.

58
The level of urea within the medium was found to decrease with increasing methamphetamine
concentration. In the urea cycle, urea is produced as a by-product during the conversion of arginine
to ornithine. Ornithine is then able to undergo further changes to produce proline (Brown and
Cohen, 1959). The increased intracellular proline at low concentrations of methamphetamine could
cause increased production of urea. As a waste product, urea would then be transported out of the
cell to the medium. Also, as proline levels decreased, so would urea production, further
establishing the production of urea as a result of proline synthesis.
Another neurotoxic event known to occur in response to methamphetamine is the production of
damaging ROS of which there are a number of potential sources. Firstly, excess dopamine released
into the cytosol can undergo auto-oxidation to dopamine quinones, which are further converted to
toxic radicals (Thrash et al., 2009). A second source of ROS is derived from serotonin toxicity
(Barr et al., 2006) and lastly, the mitochondria are known to produce ROS as a side product of
ATP synthesis and as a result of electron transport chain dysfunction (Brown et al., 2003).
To combat the oxidative stress caused by methamphetamine-induced ROS the cell may increase
the release of antioxidant substances. The level of L-serine within the treated cell was found to
increase with increasing dose of methamphetamine. This could be a protective response to the
oxidative damage as serine has been shown to possess anti-oxidant effects. It has been suggested
that L-serine supports the growth and survival of neurons and is essential for specific brain
functions (Wang et al., 2010). Within the medium, the levels of L-serine were found to increase at
1 mM methamphetamine. This may be caused by expulsion from within the cell due to high
intracellular L-serine causing transport to the medium in an attempt to restore homeostasis.
Octadecenoate, a salt or ester of the fatty acid oleic or octadecenoic acid, was also affected by
methamphetamine administration. The increased production of ROS within the cell associated with
methamphetamine exposure, could lead to the breakdown of fatty acids by per-oxidation (Thrash et
al., 2009; Catala, 2009). This may account for the initial increase in octadecenoate seen within the
treated cell. As a fatty acid derivative, octadecenoate may also be utilised as a fuel source causing

59
levels of the metabolite to decrease with increased methamphetamine concentration. Another
possibility is that octadecenoate was transported out of the cell, reducing intracellular levels. This
idea is plausible given the increase in octadecenoate within the medium.
Other intracellular amino acids which decreased as methamphetamine dose increased were L-
isoleucine, L-leucine and L-valine. These amino acids all rely on pyruvate as a precursor for their
synthesis (Freundlich et al., 1962). Pyruvate is produced as a product of glycolysis, the metabolic
pathway employed by tissues to produce energy in the form of ATP via the oxidation of glucose
(Ferrier, 2011). The reduction of these metabolites suggests that less pyruvate was available within
the cell as methamphetamine damage increased, which may be due to inference with energy
production.
Galactose levels greatly increased within the cell as the dose of methamphetamine increased.
Metabolism of galactose via the Leloir pathway results in the production of UDP-glucose which is
able to participate in glycolysis (Ferrier, 2011). A build-up of galactose within the cell suggests
dysfunction of the mechanisms responsible for clearing galactose and dysfunctional energy
production pathways.
4.2.1 Overall discussion of dose curve
Most affected by increased methamphetamine concentration were metabolites related to energy
production and utilisation. These included octadecenoate, amino acids L-isoleucine, L-leucine and
L-valine, and galactose.
Changes in N-acetylglutamate, L-proline and glycine with the dose of methamphetamine were
observed which may be in response to increased glutamate release and excitotoxicity associated
with methamphetamine administration.
The overall picture of methamphetamine toxicity is that glutamate is released in response to
methamphetamine administration, which causes excitotoxicity and oxidative stress. These cause
damage to the cell, disrupting energy production. The cell utilises a number of mechanisms to

60
attempt to reduce oxidative stress, but as dose increases, the degree of damage also increases,
making it difficult for the cell to survive.
4.3 Time course
The time dependency of the biochemical response of B50 cells to methamphetamine was analysed
using a time course experiment. Using a dose of methamphetamine known to be toxic to neuronal
cells, a number of time points were targeted, 6-, 24- and 48 hours. The metabolites identified as
showing the most variance between the samples included, amongst others, amino acids,
carbohydrates and fatty acids.
Release of glutamate, an amino acid neurotransmitter, was increased at 24 hours as a result of
methamphetamine administration. The released glutamate would be able to cause excessive
stimulation of glutamate receptors such as NMDA, leading to excitotoxicity and nitric oxide
production, which can be highly damaging to the cell (Pederson et al., 2000).
The levels of intracellular L-glutamate changed greatly over the 48-hour period with the largest
change occurring between 6 and 24 hours. At 6 hours, the amount of glutamate present in treated
cells was less than that in control. This reversed at 24 hours, with treated cells having greater
glutamate than control. A possible reason for this change is the release of glutamate triggered by
methamphetamine. This excess glutamate could lead to excitotoxic damage through the over-
activation of glutamate receptors (Pederson et al., 2000). N-acetylglutamate was found to increase
in the medium over time. Release of glutamate, the precursor of N-acetylglutamate, is enhanced by
methamphetamine exposure (Caldovic and Tuchman, 2003). As excess glutamate can have
detrimental effects due to the activation of NMDA receptors (Pederson et al., 2000), it would
benefit the cell to remove glutamate via conversion to N-acetylglutamate and expulsion from the
cell.
The increase in intracellular glutamate could account for the changes in L-alanine in
methamphetamine treated cells. L-alanine levels showed an increase over time, increasing greatly
when compared to control at 48 hours. This could be due to glutamate being converted to alanine
61
via the enzyme alanine transaminase in an attempt to reduce intracellular glutamate and thereby
excitotoxicity (Matthews et al., 2000). This effect was noted by Matthews et al. (2000), who
reported increased neuronal viability after glutamate exposure in the presence of alanine
transaminase. Uptake of alanine from outside the cell could also contribute to this increase in
alanine. This is supported by the corresponding decrease in extracellular alanine at 48 hours.
An extracellular metabolite found to increase over time after methamphetamine treatment was
myo-inositol. This result is confirmed by Ernst et al. (2000), who detected an increase in myo-
inositol in the frontal grey matter after methamphetamine exposure. Myo-inositol is considered an
indirect marker of glial cell integrity (Perrine et al., 2010). Inhibition of myo-inositol containing
IP3 receptors reduces Ca2+
release suggesting that it is also involved in regulation of intracellular
calcium concentration (Gerasimenko et al., 2006). Myo-inositol could be increased in an effort to
reduce the Ca2+
influx brought about by methamphetamine-induced excitotoxicity. The increase in
intracellular myo-inositol could also be accounted for by an intake from the medium as shown by a
decrease in extracellular myo-inositol.
Methamphetamine exposure is associated with an increased production of ROS. This is brought
about through the auto-oxidation of monoamines such as dopamine, excitotoxicity, and the
production of ATP and the inhibition of the electron transport chain within the mitochondria
(Thrash et al., 2009; Barr et al., 2006; Brown et al., 2003). ROS can have damaging effects on
amino acids, phospholipids and nucleic acids (Cunha-Oliveira et al., 2008).
The amino acids L-methionine and L-serine were also influenced by methamphetamine
administration. The levels of methionine were found to increase over time while serine decreased.
These metabolites are known to have antioxidant properties (Levine et al., 2000; Wang et al.,
2010) and could be produced in response to the production of ROS brought about by
methamphetamine toxicity (Barr et al., 2006). Serine levels were highest at 6 hours, while
methionine was greatest at 48 hours. This suggests that there are two ROS events occurring, an
initial event occurring soon after exposure and a delayed event.

62
Levels of glycerol were also shown to be elevated over time in the medium of methamphetamine-
treated cells. Glycerol forms an important structural component of cell membranes (Nelson and
Cox, 2013). Methamphetamine is known to cause the release of ROS through monoamine
autooxidation and mitochondrial damage (Trash et al., 2009; Brown et al., 2003). The
consequential oxidative stress may cause damage to cellular structures including cell membranes
(Cuhna-Oliveira et al., 2008) which would result in the release of glycerol and the death of the cell.
Both glucose and fructose followed a trend of decreasing peak area over time within the cell when
exposed to methamphetamine. The ROS produced in response to methamphetamine would have an
adverse effect on mitochondrial function. Damage to the mitochondria could result in a decrease in
aerobic respiration which could lead to the cell using carbohydrates at an accelerated rate. This
may explain the decrease in both glucose and fructose over the time course. A metabolomic study
by McClay and colleagues (2013) also reported a decrease in fructose concentration after
methamphetamine administration.
Levels of intracellular succinate, a TCA cycle intermediate, also increased over time.
Mitochondrial damage from ROS could also have resulted in TCA cycle dysfunction. This could
lead to a build-up of succinate over time. The finding of increased succinate levels after
methamphetamine administration is supported by the work of McClay et al, (2013).
The release of catecholamines such as dopamine and serotonin by methamphetamine is well
established. Methamphetamine administration results in the accumulation of catecholamines
through redistribution from storage vesicles to the cytosol, transport to the synapse and prevention
of reuptake, increasing the risk auto-oxidation of catecholamines to harmful compounds (Thrash et
al., 2009).
Levels of L-phenylalanine within the medium were elevated compared to control at all time points
tested. The catecholamine precursor tyrosine is produced from the hydroxylation of phenylalanine
(Scarnà et al., 2003). The release and production of catecholamines is triggered by the actions of
methamphetamine and is known to cause long-term damage to nerve terminals (Friedman et al.,

63
1998). Therefore the increased release of phenylalanine into the medium may be an attempt to
reduce the production of catecholamines.
4.3.1 Overall discussion of time course
The majority of metabolites affected by methamphetamine over time were related to the increased
release of glutamate brought about by methamphetamine treatment. These were the increase in L-
glutamate, N-acetylglutamate and L-alanine, and the decrease in myo-inositol. These changes
occurred slowly, building to peak at 48 hours.
Increased levels of L-methionine at 48 hours, L-serine at 6 hours and glycerol, which greatly
increased between 24- and 48-hours may be in response to the damaging effects of ROS, known to
be caused by methamphetamine.
A disruption to energy production by methamphetamine is reflected in the changes to glucose,
fructose and succinate and an attempt to reduce catecholamines is shown by the reduction of L-
phenylalanine. This effect occurred early in the time course, with changes evident as early as 6
hours.
4.4 Effect of methamphetamine
The exposure of B50 cells to methamphetamine affected several aspects of metabolism, including
changes to glutamate, carbohydrates, fatty acids and amino acids.
Changes were observed in cellular glutamate production as shown by increased L-glutamate, N-
acetylglutamate, L-alanine and L-proline. These changes are reflective of the release of glutamate
and subsequent excitotoxic effects that are known to be associated with methamphetamine
administration (Pederson et al., 2000). The increase in glutamate is highly dependent on the influx
of Ca2+
, the majority of which is taken up by mitochondria, causing further damage (Brown et al.,
2003). The increase in N-acetylglutamate, L-alanine and L-proline, as products of glutamate
(Caldovic and Tuchman, 2003; Matthews et al., 2000; Jones, 1985), suggests attempts by the cell
to reduce intracellular glutamate through diversion to other pathways.

64
A number of carbohydrates and fatty acids were also affected; suggesting alterations in energy
pathways are brought about by methamphetamine treatment. Decreased levels of fructose and
glucose within the cell may have resulted from the break down of aerobic respiration brought about
by mitochondrial damage (Brown et al., 2003), causing an accelerated rate of carbohydrate use.
The increase in octadecenoate, a derivative of oleic acid, suggests that the cell was increasingly
utilising fatty acid as an energy source. The fatty acid glycerol was also found to increase. This
may be caused by an increased production of ROS in response to methamphetamine treatment.
ROS may arise from mitochondrial damage and dopamine and serotonin oxidation causing damage
to cellular structures such as the glycerol-containing cell membranes (Cuhna-Oliveira et al., 2008).
The group most widely affected by methamphetamine was the amino acids. Amino acids are
involved in numerous pathways and have a vast variety of functions, making it difficult to
determine the reasons for their involvement with confidence. The increase in L-serine and L-
methionine, which are known to have antioxidant properties, could be brought about to combat the
increased ROS associated with methamphetamine toxicity (Brown et al., 2003). Another protective
response to methamphetamine was seen in the changes to L-phenylalanine levels. As
catecholamines are known to rise to damaging levels after methamphetamine administration, a
decrease in phenylalanine, a precursor for catecholamines, would reduce further formation (Scarnà
et al., 2003).
The neurotoxic effects of methamphetamine include monoamine release, oxidative stress,
excitotoxicity, mitochondrial damage and alterations to energy utilisation. The changes in
metabolite levels over dose and time of methamphetamine treated cells and medium were
reflective of these effects.
4.5 Limitations and expansions
As a preliminary study, this work has a number of factors which may limit the interpretation of the
data contained within.

65
The study employed the use of cell cultures to simulate the neurotoxic effects of methamphetamine
upon the brain. Whilst this method is convenient and eliminates any differences between test
subjects, as may be found in animal studies, it uses a single cell type to represent the entire CNS.
To examine the biochemical changes of the CNS as a whole, an in-vivo method could be applied,
or alternatively, a mixed brain cell culture as used by Fabian and Rea (1993).
An untargeted metabolomics approach was used in this study to identify metabolites of interest.
While limited information of specific metabolites affected by methamphetamine made this
necessary, further studies could benefit from a targeted approach. This would allow a more precise
quantification and a more in-depth look at the metabolites (Almstetter et al., 2012). The
metabolomic data obtained from the dose curve and time course experiments showed considerable
variance between the replicates, evident in the size of the standard error. As this is preliminary
work, some variation in the results is to be expected until methods are consolidated. The sample
size used for these experiments was also small, adding to the variance. To improve this aspect, a
larger number of replicates might be used and all experiments should be performed on the same
passage of cells at the same time, instead of in separate batches as was done here.
This study was limited to the administration of methamphetamine at a single time point.
Continuation of this work may utilise repeated doses of methamphetamine to simulate real-life
drug use. In addicts, patterns of methamphetamine administration often show repeated, high dose
binging, taken within a short period of time (Segal and Kuczenski, 1997). This could be easily
emulated, in vitro, as a comparison to a single toxic dose.
4.6 Conclusion
This work has shown that methamphetamine causes visible and dose-dependent damage to
neuronal cells. The viability of cells treated with methamphetamine at a range of doses was able to
66
be quantified via Trypan blue exclusion testing which demonstrated that cell death occurred in
response to methamphetamine administration.
These experiments found that methamphetamine exposure resulted in measurable biochemical
changes over dose and time. The use of a metabolomic method provided a snap shot of the activity
of the cell giving new information on the biochemical response of the cell. These metabolite
changes were reflective of the known mechanisms of methamphetamine toxicity including
glutamate release and excitotoxicity, changes to energy utilisation and production of ROS. The
result of this study furthers our understanding of neurochemical processes in response to
methamphetamine and could potentially lead to the identification of therapeutic targets.

67
5. References
Abbiss, H., Maker, G. L., Gummer, J., Sharman, M. J., Phillips, J. K., Boyce, M., &
Trengove, R. D. (2012). Development of a non-targeted metabolomics method to
investigate urine in a rat model of polycystic kidney disease: Use of metabolomics to
investigate PKD. Nephrology, 17(2), 104–110. doi:10.1111/j.1440-1797.2011.01532.x
Almstetter, M. F., Oefner, P. J., & Dettmer, K. (2012). Comprehensive two-dimensional gas
chromatography in metabolomics. Analytical and Bioanalytical Chemistry, 402(6), 1993–2013.
doi:10.1007/s00216-011-5630-y
Ankarcrona, M., Dypbukt, J. M., Bonfoco, E., Zhivotovsky, B., Orrenius, S., Lipton, S. A., &
Nicotera, P. (1995). Glutamate-induced neuronal death: a succession of necrosis or apoptosis
depending on mitochondrial function. Neuron, 15(4), 961–973.
Arias-Carrión, O., Stamelou, M., Murillo-Rodríguez, E., Menéndez-González, M., & Pöppel, E.
(2010). Dopaminergic reward system: a short integrative review. International archives of
medicine, 3(1), 24.
Australian Crime Commission (2012). Illicit Drug Data Report 2010-11. ACC, Canberra
Australian Institute of Health and Welfare (AIHW) 2011,„2010 National Drug Strategy Household
Survey report: detailed findings‟, Drug statistics series, Number 25, Cat. No. PHE 145. AIHW,
Canberra
Bamford, N. S., Zhang, H., Joyce, J. A., Scarlis, C. A., Hanan, W., Wu, N.-P., Sulzer, D. (2008).
Repeated Exposure to Methamphetamine Causes Long-Lasting Presynaptic Corticostriatal
Depression that Is Renormalized with Drug Readministration. Neuron, 58(1), 89–103.
doi:10.1016/j.neuron.2008.01.033
Barr, A.M., Panenka, W.J., MacEwan, W., Thornton, A.E., Lang, D.J., Honer, W.G., Lecomte, T.
(2006). The need for speed: an update on methamphetamine addiction. Journal of Psychiatry &
Neuroscience, 31(5), 301-13
Bear, M.F., Connors, B.W., Paradiso, M.A. (2007). Neuroscience: Exploring the Brain. 3rd
Edition.
Lippincott Williams & Wilkins, Philadelphia
Berman, S. M., Voytek, B., Mandelkern, M. A., Hassid, B. D., Isaacson, A., Monterosso, J.,
London, E. D. (2007). Changes in cerebral glucose metabolism during early abstinence from
chronic methamphetamine abuse. Molecular psychiatry, 13(9), 897–908.
Bondareva, T.S., Young, R., Glennon, R.A. (2002). Central stimulants as discriminative stimuli:
Asymmetric generalization between (-)ephedrine and S(+)methamphetamine. Pharmacology,
Biochemistry and Behavior 74, 157 – 162
Brecht, M.-L., O‟Brien, A., von Mayrhauser, C., & Anglin, M. D. (2004). Methamphetamine use
behaviors and gender differences. Addictive Behaviors, 29(1), 89–106. doi:10.1016/S0306-
4603(03)00082-0
Brown, G.W. and Cohen, P.P. (1959). Comparative Biochemistry of Urea Synthesis. Journal of
Biological Chemistry, 234(7), 1769-1774

68
Brown, J. M., & Yamamoto, B. K. (2003). Effects of amphetamines on mitochondrial function:
role of free radicals and oxidative stress. Pharmacology & Therapeutics, 99(1), 45–53.
doi:10.1016/S0163-7258(03)00052-4
Brown, J. M., Quinton, M. S., & Yamamoto, B. K. (2005). Methamphetamine-induced inhibition
of mitochondrial complex II: roles of glutamate and peroxynitrite. Journal of Neurochemistry,
95(2), 429–436. doi:10.1111/j.1471-4159.2005.03379.x
Buchsbaum, M. S. (2004). Frontal Cortex Function. American Journal of Psychiatry, 161, 2178-
2178. doi:10.1176/appi.ajp.161.12.2178
Cadet, J.L., Krasnova, I.N., Jayanthi, S., Lyles, J. (2007). Neurotoxicity of Substituted
Amphetamines: Molecules and Cellular Mechanisms. Neurotoxicity Research, 11(3,4), 183-202
Caldovic, L. and Tuchman, M. (2003). N-Acetylglutamate and its changing role through evolution.
Biochemistry Journal, 372, 279–290
Caldwell, J., Dring, L. G., & Williams, R. T. (1972). Metabolism of [14
C] methamphetamine in
man, the guinea pig and the rat. Biochemical Journal, 129, 11–22.
Carvalho, M., Carmo, H., Costa, V. M., Capela, J. P., Pontes, H., Remião, F., Bastos, M. de L.
(2012). Toxicity of amphetamines: an update. Archives of Toxicology, 86(8), 1167–1231.
doi:10.1007/s00204-012-0815-5
Centers for Disease Control and Prevention (1990). Lead poisoning associated with intravenous-
methamphetamine use - Oregon, 1988. Journal of the American Medical Association, 263(6), 797-
798
Chang, L., Alicata, D., Ernst, T., & Volkow, N. (2007). Structural and metabolic brain changes in
the striatum associated with methamphetamine abuse. Addiction, 102(s1), 16–32.
Cho, A.K. (1990). Ice: A New Dosage Form of an Old Drug. Science; 249, 4969; 631-634
Cunha-Oliveira, T., Rego, A. C., & Oliveira, C. R. (2008). Cellular and molecular mechanisms
involved in the neurotoxicity of opioid and psychostimulant drugs. Brain Research Reviews, 58(1),
192–208. doi:10.1016/j.brainresrev.2008.03.002
Cuperlović-Culf, M., Barnett, D. A., Culf, A. S., & Chute, I. (2010). Cell culture metabolomics:
applications and future directions. Drug discovery today, 15(15), 610–621.
Daubner, S. C., Le, T., & Wang, S. (2011). Tyrosine hydroxylase and regulation of dopamine
synthesis. Archives of Biochemistry and Biophysics, 508(1), 1–12. doi:10.1016/j.abb.2010.12.017
Day, J. J., & Carelli, R. M. (2008). Methamphetamine Induces Chronic Corticostriatal Depression:
Too Much of a Bad Thing. Neuron, 58(1), 6–7. doi:10.1016/j.neuron.2008.03.014
De la Luz-Hdez, K. (2012). Metabolomics and Mammalian Cell Culture. Retrieved from
http://cdn.intechopen.com/pdfs/28001/InTech-Metabolomics_and_mammalian_cell_culture.pdf
Della Grotta, S., LaGasse, L. L., Arria, A. M., Derauf, C., Grant, P., Smith, L. M., Lester, B. M.
(2009). Patterns of Methamphetamine Use During Pregnancy: Results from the Infant
Development, Environment, and Lifestyle (IDEAL) Study. Maternal and Child Health Journal,
14(4), 519–527. doi:10.1007/s10995-009-0491-0

69
Deneke, S. M., & Fanburg, B. L. (1989). Regulation of cellular glutathione. American Journal of
Physiology-Lung Cellular and Molecular Physiology, 257(4), L163–L173.
Desbrosses, G., Steinhauser, D., Kopka, J., Udvardi, M. (2005). Metabolome analysis suing GC-
MS, chapter 4.6. Lotus japonicus Handbook, 165-174
Deshmukh, S. S., & Knierim, J. J. (2012). Hippocampus. Wiley Interdisciplinary Reviews:
Cognitive Science, 3(2), 231–251. doi:10.1002/wcs.1164
Donaldson, M., & Goodchild, J. H. (2006). Oral health of the methamphetamine abuser. American
Journal of Health-System Pharmacy, 63(21), 2078–2082. doi:10.2146/ajhp060198
Dunn, W. B., Bailey, N. J. C., & Johnson, H. E. (2005). Measuring the metabolome: current
analytical technologies. The Analyst, 130(5), 606. doi:10.1039/b418288j
Dunnivant and Ginsbach, (2008). GC-MS and LC-MS: A basic introduction. Whitman College
Eichenbaum, H. (2004). Hippocampus: cognitive processes and neural representations that underlie
declarative memory. Neuron, 44(1), 109–120.
Encyclopaedia Britannica (2014). Sciatic Nerve. Retrieved January 18, 2014 from
http://www.britannica.com/EBchecked/topic/528745/sciatic-nerve.
Ernst, T., Chang, L., Leonido-Yee, M., Speck, O, (2000). Evidence for long-term neurotoxicity
associated with methamphetamine abuse. Neurology, 54, 1344-1349
Fabian, R.L., Rhea, H.C. (1993). Neuronal toxicity by macrophages in mixed brain cell culture is
augmented by antineuronal IgG and dependent upon nitric oxide synthesis. Journal of
Neuroimmunology, 44(1): 95-102.
Ferrier, D.R. (2011). Lippincott‟s Illustrated Reviews: Biochemistry, 6th Edition. Lippincott
Williams & Wilkins, Philadelphia
Fonnum, F. (1984). Glutamate: A Neurotransmitter in Mammalian Brain. Journal of
Neurochemistry, 42(1), 1-12
Fraser, J., Newman, E.B., 1975. Derivation of Glycine from Threonine in Escherichia coli K-12
Mutants. Journal of Bacteriology, 122(3), 810-817
Freundlich, M., Burns, R.O., Umbarger, H.E. (1962). Control of isoleucine, valine, and leucine
Biosynthesis, I. Multi-valent repression. Biochemistry, 48, 1804-1808
Friedman, S.D., Castaneda, E., Hodge, G.K. (1998). Long-Term Monoamine Depletion,
Differential Recovery, and Subtle Behavioral Impairment Following Methamphetamine-Induced
Neurotoxicity. Pharmacology Biochemistry and Behavior, 61(1), 35–44
Gerasimenko, J. V., Flowerdew, S. E., Voronina, S. G., Sukhomlin, T. K., Tepikin, A. V., Petersen,
O. H., & Gerasimenko, O. V. (2006). Bile Acids Induce Ca2+ Release from Both the Endoplasmic
Reticulum and Acidic Intracellular Calcium Stores through Activation of Inositol Trisphosphate
Receptors and Ryanodine Receptors. Journal of Biological Chemistry, 281(52), 40154–40163.
doi:10.1074/jbc.M606402200
Gluck, M. R., Moy, L. Y., Jayatilleke, E., Hogan, K. A., Manzino, L., & Sonsalla, P. K. (2001).
Parallel increases in lipid and protein oxidative markers in several mouse brain regions after
methamphetamine treatment. Journal of neurochemistry, 79(1), 152–160.
70
Goodacre, R., Vaidyanathan, S., Dunn, W. B., Harrigan, G. G., & Kell, D. B. (2004).
Metabolomics by numbers: acquiring and understanding global metabolite data. Trends in
Biotechnology, 22(5), 245–252. doi:10.1016/j.tibtech.2004.03.007
Halket, J. M. (2005). Chemical derivatization and mass spectral libraries in metabolic profiling by
GC/MS and LC/MS/MS. Journal of Experimental Botany, 56(410), 219–243.
doi:10.1093/jxb/eri069
Halket, J.M, Waterman, D., Przyborowska, A.M, Patel, R.K.P, Fraser, P.D, Bramley, P.M. (2005).
Chemical derivatization and mass spectral libraries in metabolic profiling by GC/MS and
LC/MS/MS. Journal of Experimental Botany. 56 (410): 219-243.
Homer, B. D., Solomon, T. M., Moeller, R. W., Mascia, A., DeRaleau, L., & Halkitis, P. N.
(2008). Methamphetamine abuse and impairment of social functioning: a review of the underlying
neurophysiological causes and behavioral implications. Psychological bulletin, 134(2), 301.
Huang, Y.-N., Wu, C.-H., Lin, T.-C., & Wang, J.-Y. (2009). Methamphetamine induces heme
oxygenase-1 expression in cortical neurons and glia to prevent its toxicity. Toxicology and Applied
Pharmacology, 240(3), 315–326. doi:10.1016/j.taap.2009.06.021
Jayanthi, S., Deng, X., Ladenheim, B., McCoy, M. T., Cluster, A., Cai, N., & Cadet, J. L. (2005).
Calcineurin/NFAT-induced up-regulation of the Fas ligand/Fas death pathway is involved in
methamphetamine-induced neuronal apoptosis. Proceedings of the National Academy of Sciences
of the United States of America, 102(3), 868–873
Kranz, G. S., Kasper, S., & Lanzenberger, R. (2010). Reward and the serotonergic system.
Neuroscience, 166(4), 1023–1035. doi:10.1016/j.neuroscience.2010.01.036
Lankiewicz, S., Luetjens, C. M., Bui, N. T., Krohn, A. J., Poppe, M., Cole, G. M., Prehn, J. H.
(2000). Activation of calpain I converts excitotoxic neuron death into a caspase-independent cell
death. Journal of Biological Chemistry, 275(22), 17064–17071.
Lau, A., & Tymianski, M. (2010). Glutamate receptors, neurotoxicity and neurodegeneration.
Pflügers Archiv - European Journal of Physiology, 460(2), 525–542. doi:10.1007/s00424-010-
0809-1
Laube, B., Hirai, H., Sturgess, M., Betz, H., & Kuhse, J. (1997). Molecular determinants of agonist
discrimination by NMDA receptor subunits: analysis of the glutamate binding site on the NR2B
subunit. Neuron, 18(3), 493–503
LeDoux, J. (2007). The amygdala. Current Biology, 17(20), R868–R874.
León, Z., García-Cañaveras, J. C., Donato, M. T., & Lahoz, A. (2013). Mammalian cell
metabolomics: experimental design and sample preparation. Electrophoresis, 34(19):2762-75.
doi:10.1002/elps.201200605
Levi, M. S., Divine, B., Hanig, J. P., Doerge, D. R., Vanlandingham, M. M., George, N. I.,
Bowyer, J. F. (2012). A comparison of methylphenidate-, amphetamine-, and methamphetamine-
induced hyperthermia and neurotoxicity in male Sprague–Dawley rats during the waking (lights
off) cycle. Neurotoxicology and Teratology, 34(2), 253–262. doi:10.1016/j.ntt.2012.01.007
Levine, R. L., Moskovitz, J., & Stadtman, E. R. (2000). Oxidation of methionine in proteins: roles
in antioxidant defense and cellular regulation. IUBMB life, 50(4-5), 301–307.

71
Matthews, C. C., Zielke, H. R., Wollack, J. B., & Fishman, P. S. (2000). Enzymatic degradation
protects neurons from glutamate excitotoxicity. Journal of neurochemistry, 75(3), 1045–1052
Mayr, M. (2008). Metabolomics: Ready for the Prime Time? Circulation: Cardiovascular
Genetics, 1(1), 58–65. doi:10.1161/CIRCGENETICS.108.808329
McClay, J. L., Adkins, D. E., Vunck, S. A., Batman, A. M., Vann, R. E., Clark, S. L., Oord, E. J.
C. G. (2013). Large-scale neurochemical metabolomics analysis identifies multiple compounds
associated with methamphetamine exposure. Metabolomics, 9(2), 392–402. doi:10.1007/s11306-
012-0456-y
Meldrum, B. S. (2000). Glutamate as a neurotransmitter in the brain: review of physiology and
pathology. The Journal of nutrition, 130(4), 1007S–1015S.
Mendelson, J., Uemura, N., Harris, D., Nath, R.P., Fernandez, E., Jacob, P., Everhart, E.T., and
Jones, R.T. (2006). Human Pharmacology of the methamphetamine stereoisomers. Clinical
Pharmacology & Therapeutics 80, 403–420
Missale, C., Nash, S. R., Robinson, S. W., Jaber, M., & Caron, M. G. (1998). Dopamine receptors:
from structure to function. Physiological reviews, 78(1), 189–225.
Mohammad-Zadeh, L. F., Moses, L., & Gwaltney-Brant, S. M. (2008). Serotonin: a review.
Journal of Veterinary Pharmacology and Therapeutics, 31(3), 187–199. doi:10.1111/j.1365-
2885.2008.00944.x
Nakanishi, S. (1992). Molecular Diversity of Glutamate Receptors and Implications for Brain
Function. Science, New Series, 258(5082), 597-603
National Institute on Drug Abuse. “Methamphetamine Abuse and Addiction.” NIDA Research
Report Sept. 2006: NIH Publication No. 06-4210. 2006. National Institutes of Health, Bethesda,
MD. <www.drugabuse.gov/ResearchReports/methamph/methamph.html>.
Nelson, D.L and Cox, M.M. (2013). Principles of Biochemistry, 6th Edition. W. H. Freeman and
Company, New York
Newton, T. F., De La Garza, R., Kalechstein, A. D., Tziortzis, D., & Jacobsen, C. A. (2009).
Theories of Addiction: Methamphetamine Users‟ Explanations for Continuing Drug Use and
Relapse. American Journal on Addictions, 18(4), 294–300. doi:10.1080/10550490902925920
NIDA (2008). Addiction Science: From Molecules to Managed Care. National Institute on Drug
Abuse. Available http://www.drugabuse.gov/publications/addiction-science (accessed 31.10.2013)
NIDA (2013). Methamphetamine: abuse and addiction. National Institute on Drug Abuse.
Available: http://www.drugabuse.gov/publications/research-reports/methamphetamine-abuse-
addiction
Oh, J. S., Lyoo, I. K., Sung, Y. H., Hwang, J., Kim, J., Chung, A., Song, I. C. (2005). Shape
changes of the corpus callosum in abstinent methamphetamine users. Neuroscience Letters, 384(1-
2), 76–81. doi:10.1016/j.neulet.2005.04.082
Oliver S.G., Winson, M.K., Kell, D.B., Baganz, F. (1998). Systematic functional analysis of the
yeast genome. Trends in Biotechnology 16, 373–378
Panenka, W. J., Procyshyn, R. M., Lecomte, T., MacEwan, G. W., Flynn, S. W., Honer, W. G., &
Barr, A. M. (2013). Methamphetamine use: A comprehensive review of molecular, preclinical and

72
clinical findings. Drug and Alcohol Dependence, 129(3), 167–179.
doi:10.1016/j.drugalcdep.2012.11.016
Perrine, S. A., Ghoddoussi, F., Michaels, M. S., Hyde, E. M., Kuhn, D. M., & Galloway, M. P.
(2010). MDMA administration decreases serotonin but not N-acetylaspartate in the rat brain.
NeuroToxicology, 31(6), 654–661. doi:10.1016/j.neuro.2010.08.005
Quinton, M. S., & Yamamoto, B. K. (2006). Causes and consequences of methamphetamine and
MDMA toxicity. The AAPS journal, 8(2), E337–E337.
Riddle, E. L., Fleckenstein, A. E., & Hanson, G. R. (2006). Mechanisms of methamphetamine-
induced dopaminergic neurotoxicity. The AAPS journal, 8(2), E413–E418.
Rolls, E.T. (1994). Neurophysiology and cognitive functions of the striatum. Revue neurologique.
(Paris),150(8-9),648-60
Salamone, J., Correa, M., Mingote, S., & Weber, S. (2005). Beyond the reward hypothesis:
alternative functions of nucleus accumbens dopamine. Current Opinion in Pharmacology, 5(1),
34–41. doi:10.1016/j.coph.2004.09.004
Salo, R., Nordahl, T. E., Natsuaki, Y., Leamon, M. H., Galloway, G. P., Waters, C., Buonocore, M.
H. (2007). Attentional Control and Brain Metabolite Levels in Methamphetamine Abusers.
Biological Psychiatry, 61(11), 1272–1280. doi:10.1016/j.biopsych.2006.07.031
Sana, T. and Fisher, S. (2007). Maximizing Metabolite Extraction for Comprehensive
Metabolomics Studies of Erythrocytes. Agilent Technologies, Inc. Santa Clara, CA, USA
Scarna, A., Gijsman, H. J., McTavish, S. F. B., Harmer, C. J., Cowen, P. J., & Goodwin, G. M.
(2003). Effects of a branched-chain amino acid drink in mania. The British Journal of Psychiatry,
182(3), 210–213.
Schep, L.J., Slaughter, R.J., Beasley, D.M.G. (2010). The clinical toxicology of metamfetamine.
Clinical Toxicology, 48, 675-694.
Schloenhardt, A. (2007). „The market for amphetamine-type stimulants and their precursors in
Oceania‟, Research and Public Policy Series, No. 81. Australian Institute of Criminology,
Canberra.
Segal, D.S. and Kuczenski, R. (1997). Repeated Binge Exposures to Amphetamine and
Methamphetamine: Behavioral and Neurochemical Characterization. The Journal of
Pharmacology and Experimental Therapeutics, 282(2), 561-573
Sellers, K. (2007). Why Derivatize? Improve GC separations with derivatization. Restek
Corporation: Clinical/Forensic vol 3, available: www.restek.com www.restek.com
Shao, X., Hu, Z., Hu, C., Bu, Q., Yan, G., Deng, P., Lv, L., Wu, D., Deng, Yi., Zhao, J., Zhu, R.,
Li, Y., Li, H., Xu, Y., Yang, H., Zhao, Y., Cen, X. (2012). Taurine protects methamphetamine-
induced developmental angiogenesis defect through antioxidant mechanism. Toxicology and
Applied Pharmacology 260, 260–270
Sinchai, T., Plasen, S., Sanvarinda, Y., Jaisin, Y., Govitrapong, P., Phumala Morales, N.,
Ratanachamnong, P., Plasen, D. (2011). Caffeine potentiates methamphetamine-induced toxicity
both in vitro and in vivo. Neuroscience Letters 502: 65– 69

73
Stumm, G., Schlegel, J., Schafer, T., Wurz, C., Mennel, H.D., Krieg, J.C., Vedder, H. (1999).
Amphetamines induce apoptosis and regulation of bcl-x splice variants in neocortical neurons.
FASEB Journal 13, 1065–1072
Tansey, WP. (2006). Freeze-Thaw Lysis for Extraction of Proteins from Mammalian Cells. Cold
Spring Harbor Protocols.
Thrash, B., Thiruchelvan, K., Ahuja, M., Suppiramaniam, V., & Dhanasekaran, M. (2009).
Methamphetamine-induced neurotoxicity: the road to Parkinson‟s disease. Pharmacol Rep, 61(6),
966–77.
Vearrier, D., Greenberg, M. I., Miller, S. N., Okaneku, J. T., & Haggerty, D. A. (2012).
Methamphetamine: History, Pathophysiology, Adverse Health Effects, Current Trends, and
Hazards Associated with the Clandestine Manufacture of Methamphetamine. Disease-a-Month,
58(2), 38–89. doi:10.1016/j.disamonth.2011.09.004
Villas-Bôas, S. G., Mas, S., Åkesson, M., Smedsgaard, J., & Nielsen, J. (2005). Mass spectrometry
in metabolome analysis. Mass Spectrometry Reviews, 24(5), 613–646. doi:10.1002/mas.20032
Villas-Bôas, S.G., Roessner, U., Hansen, M.A.E., Smedsgaard, J., Nielsen, J. (2007). Metabolome
Analysis, An Introduction. John Wiley & Sons, Inc, New Jersey.
Völlm, B. A., de Araujo, I. E., Cowen, P. J., Rolls, E. T., Kringelbach, M. L., Smith, K. A.,
Matthews, P. M. (2004). Methamphetamine Activates Reward Circuitry in Drug Naïve Human
Subjects. Neuropsychopharmacology, 29(9), 1715–1722. doi:10.1038/sj.npp.1300481
Wang, G.-H., Jiang, Z.-L., Chen, Z.-Q., Li, X., & Peng, L.-L. (2010). Neuroprotective effect of L-
serine against temporary cerebral ischemia in rats. Journal of Neuroscience Research, NA–NA.
doi:10.1002/jnr.22365
Watanabe-Galloway, S., Ryan, S., Hansen, K., Hullsiek, B., Muli, V., Malone, C. (2009). Effects
of Methamphetamine Abuse Beyond Individual Users. Journal of Psychoactive Drugs, 41(3), 241-
248
Weisheit, R. (2008). Making Methamphetamine. Southern Rural Sociology, 25(2), 78-107
Welder, A.A. (1992). A primary culture system of postnatal rat heart cells for the study of cocaine
and methamphetamine toxicity. Toxicology Letters, 60(2), 183–196
Wu, C.-W., Ping, Y.-H., Yen, J.-C., Chang, C.-Y., Wang, S.-F., Yeh, C.-L., Lee, H.-C. (2007).
Enhanced oxidative stress and aberrant mitochondrial biogenesis in human neuroblastoma SH-
SY5Y cells during methamphetamine induced apoptosis. Toxicology and Applied Pharmacology,
220(3), 243–251. doi:10.1016/j.taap.2007.01.011
Zhou, J.-L., Liang, J.-H., Zheng, J.-W., & Li, C.-L. (2004). Nerve growth factor protects R2 cells
against neurotoxicity induced by methamphetamine. Toxicology Letters, 150(2), 221–227.
doi:10.1016/j.toxlet.2004.01.007