actuarial note - ssa.gov
TRANSCRIPT

ACTUARIAL NOTESOCIAL SECURITY ADMINISTRATION
Number 146June 2005
Office of the Chief ActuaryBaltimore, Maryland
DEATH TERMINATION EXPERIENCE FOR DI DISABLED WORKERS ANDSSI DISABLED ADULTS WITH HIV-RELATED IMPAIRMENTS
by Nettie Barrick and Tim Zayatz, A.S.A.
IntroductionIt has been over 20 years since disabled beneficiaries firstappeared on the Social Security Disability Insurance (DI) andSupplemental Security Income (SSI) rolls as a result ofAcquired Immunodeficiency Syndrome (AIDS). Since thefirst several hundred of such beneficiaries began receivingpayments in 1982, the Social Security Administration hasmonitored the epidemic’s impact on expenditures from the DITrust Fund as well as expenditures of Federal general revenueunder the SSI program.
This monitoring process has involved periodic examinationsof agency administrative records for cases on the DI or SSIprogram rolls that could be identified as receiving disabilitybenefits, at least in part, due to infection with the HumanImmunodeficiency Virus (HIV). The results of these analyseswere used to produce rough estimates of historical and pro-jected program expenditures due to HIV. Modeling the impactof HIV on program expenditures required an understanding ofthe circumstances causing HIV-infected persons to apply forbenefits, the factors involved in favorable disability determi-nations, and the reasons that HIV beneficiaries leave the rolls.
The primary reason for termination of benefits payable toHIV beneficiaries has been death, so a careful examination ofmortality experience is clearly a key to understanding dura-tion on the rolls. Prior evaluations of HIV mortality had beendone on a rough aggregate basis. The purpose of this note is topresent the detailed results of the first person-based mortalitystudy of the extensive data that we have collected. The currentstudy is based on a total of roughly 1.4 million life-years ofexposure distributed over two 5-year periods: 1992-96 and1997-2001, and represents the most extensive case study ofHIV mortality produced from administrative records.
History of the HIV data collection projectAs indicated, this study represents the culmination of twodecades of efforts to track the impact of HIV on the cash ben-efit programs administered by the Social Security Administra-tion (SSA). The agency’s collection of administrative datathat provide the basis for this study was developed over timeas the world’s scientific community gained a greater under-standing of the effects of HIV infection on diverse body sys-tems. Those findings have, in turn, come to affect SSA’sevaluation of claims for disability benefits based on the pres-ence of the infection. To fully appreciate the value of the cur-
rent study, as well as its limitations, it is important to havesome understanding of how SSA’s collection of HIV data hasevolved over the past 20 years.
In the early years of the HIV epidemic, infected persons whopresented themselves as claimants for DI or SSI benefits,most often did so as a result of one or more diseases, such asKaposi’s sarcoma and pneumocystis carinii pneumonia.These particular diseases appeared to be present primarily dueto an impaired immune system which resulted from the pres-ence of an HIV infection. Such claims were tentatively identi-fied as being associated with HIV, and the claims folders wereforwarded to SSA headquarters for confirmation. The firstdata collection on HIV claimants was the result of this manualexamination of claims folders.
As the HIV epidemic spread, and the number of disabilityclaims grew correspondingly, SSA could no longer managethe “hand-selection” of cases for its compilation of HIV data.As a proxy for the manual identification process, the Office ofthe Chief Actuary compiled a list of certain impairmentcodes1 commonly assigned to HIV cases, which was thenused to electronically retrieve the corresponding administra-tive records from SSA’s two main payment record files—theMaster Beneficiary Record (MBR) for DI and the Supplemen-tal Security Record (SSR) for SSI.
However, since no single impairment code yet existed forHIV, and since the assignment of impairment codes can besubject to some misclassification in the claims taking process,the selection of cases included in SSA’s compilation of HIVdata was exposed to both type I and type II error.2 Neverthe-less, the overall characteristics of the cases identified seemedconsistent with the cases that had been identified in the earliermanual folder evaluation, providing some assurance that thecases under study were to a large degree correctly identified.
1 SSA diagnosis codes are similar in concept to (but not identical with) the codes promulgated by the World Health Organization in its International Classification of Diseases (ICD codes). Before 1987, there was no ICD code specifically for HIV. The proxy used for our data selection criterion was to include all cases which had been assigned a primary diagnosis code in the range 2790-2794 (for general impairments related to immune deficiency), 1363 (for pneumocystis carinii pneumonia), and 1739 (for Kaposi’s sar-coma).2 Allegorical reference to statistical errors made in classic hypothesis testing. In this context, type I error refers to classifying an infected beneficiary as non-HIV; type II error refers to classifying a non-infected beneficiary as HIV.

2
When the World Health Organization introduced ICD series042.0-044.9 specifically for HIV-related diseases3, SSA fol-lowed with a corresponding series of impairment codes. Atthat time all HIV-related impairments were to be assigned adiagnosis code in that range. As a result, the collection of datashifted to identifying new cases using the now-familiar HIVdiagnosis codes of 042, 043, and 044, while continuing totrack the experience of HIV cases that had been identifiedunder prior evaluations.
Soon after, some information was added to the data collectionprocess from the agency’s transactions file for disabilityclaims processed by the State Disability Determinations Ser-vices—known as the 831 file. In addition to the primary diag-nosis code—which is carried on the MBR and SSR—the 831file also contains a secondary diagnosis code. This codeallowed us to identify additional cases involving HIV as acontributing (if not the primary) reason for impairment.
Since 1990, our process for collecting HIV data has remainedrelatively unchanged. Administrative data on previously iden-tified cases is updated every six months, in June and Decem-ber. At the same time, newly-identified HIV beneficiary casesare added to the data collection.
SSA’s evaluation of HIV-related impairmentsIn addition to changes in the way we have collected data onHIV cases, the standards used to evaluate potential HIV dis-ability claims have also been modified over time as medicalknowledge of HIV has progressed. While SSA has tried toremain consistent with the criteria and rationale of the Centersfor Disease Control and Prevention (CDC) and World HealthOrganization, the agency has found it necessary to define itsown guidelines for evaluating HIV-related impairments fromthe perspective of administering the DI and SSI programs.The SSA definition and medical listings with regard to HIVhave evolved from the earliest definitions provided by CDCwhen the disease was first listed under infectious/parasiticcategory, to the time when HIV received its own regulatorylisting in the Listing of Impairments4 in June 1993.
As the spectrum of manifestations of HIV-infection becamebetter defined, it became apparent that some progressive andseriously disabling conditions were not included in the defini-tion of AIDS. In addition, clinicians began to identify a groupof individuals with a variety of signs and symptoms whichwere thought to be caused by the HIV virus. The collection ofthese symptoms came to be known as AIDS-Related Complex(ARC). Effective September 1987, the CDC began using arevised criteria for determining which cases involving HIV
should be reported for AIDS statistical surveillance purposes.The revision expanded the definition to include HIV Demen-tia and HIV Wasting. To remain consistent, SSA revised itsdefinition for AIDS, but discontinued the automatic link withthe CDC definition. The revised criteria lead to reclassifyingas AIDS a number of then-current beneficiaries who were onthe disability rolls due to ARC, rather than a definitively diag-nosed case of AIDS. During this time, the number of AIDS-related impairments on the DI rolls grew rapidly from 5,700at the end of 1986 to 17,400 by the end of 1988.
In 1990, SSA issued new guidelines to include criteria forsymptomatic HIV which is not AIDS, including all lympho-mas and other disease manifestations coupled with 200 CD4count and marked functional limitations. The expandedguidelines resulted in a new class of HIV impairments, and by1992, the DI program had experienced its most critical yearfor new HIV entitlements as an additional 33,000 workersbegan receiving payments. However, the death rate amongthose afflicted was so high that monthly benefit paymentswere often made only for a relatively short period of time, ifat all. Many never received payments, failing to survive therequisite 5-month waiting period under the DI program. One-third of those who made it onto the rolls because of HIVimpairments had died by the end of the calendar year in whichthey became entitled; two-thirds had died by the end of thefollowing year.
By 1996, CDC began reporting sharp declines in AIDS inci-dence as a result of public awareness and widespread use ofhighly-active antiretroviral therapy (HAART) which slowsthe reproduction of the virus and thus the progression of HIVinfection to AIDS.5 By 1998, CDC reported a leveling of inci-dence and essentially no change from 1999 to 2001 withroughly 41,000 new AIDS cases reported each year over thatperiod. DI entitlements followed the decline in populationincidence as infected workers remained employed for longerperiods of time. Since peaking in 1992, the number of work-ers becoming entitled to DI benefits based on HIV has fallenin recent years to roughly 10,000 annually.
Mortality 1997-2001As of December 31, 2002, the CDC reported nearly 385,000persons in the U.S. living with AIDS, and an estimated 41,000new diagnoses of AIDS infections occurring annually. Fromthe beginning of the epidemic through 2002, CDC estimatesthat roughly 502,000 persons have died with AIDS in theU.S.6
3 As set forth in Ninth Revision of the International Classification of Diseases (ICD-9) of the World Health Organization, effective 1987. Note that these codes have since been converted under Tenth Revision (ICD-10) to B20-B24 series, effective 1998.4 Refer to Appendix C for an overview of the definition of disability and the determination process.
5 For further insight, refer to the CDC annual HIV/AIDS Surveillance Report, which can be obtained from their website www.cdc.gov. CDC provides annual compilations of State HIV surveillance data and Federally mandated AIDS reports. This national report on cases of HIV infection and AIDS in the United States is used by CDC’s public health partners and professionals in other Federal agencies, health departments, and academic institutions.6 HIV/AIDS Surveillance Report (December 2002, Vol.14).

3
Social Security records on HIV impairments show that by theend of 2002, there were nearly 98,500 workers receiving DIbenefits—with approximately 10,500 becoming newly enti-tled in that year7—and roughly 72,000 individuals receivingSSI benefits.8 Over the 10-year period covered by this study(1992-2001), approximately 204,100 HIV beneficiaries wereterminated from the DI and SSI rolls as a result of death.
Results found in this study reflect DI (worker only) and SSIdisability experience. We caution against viewing theseresults as a proxy for the HIV/AIDS mortality of the popula-tion being monitored by CDC. Only a fraction of those diag-nosed with the HIV infection or full-blown AIDS actuallybecome eligible for DI or SSI benefits. Many remain in thework force for extended periods of time, delaying, perhapsindefinitely, pursuit of disability benefits. For those whoattain beneficiary status—and subsequently come underobservation—the infection has progressed to the point ofbeing disabling. Consequently, the make-up of the HIV popu-lation that is the basis for this study is quite different from theoverall AIDS population tracked by CDC. Furthermore, theprimary variable of interest for this mortality study is durationsince becoming entitled to disability benefits. The time of ini-tial diagnosis of HIV may not be known, and therefore theamount of time from onset of the infection to death cannot bemeasured.
As mentioned earlier, the expansion of the guidelines in 1990more clearly defined the aspects of disability for individualswho had HIV, but had not progressed to the point of havingAIDS or showed other severe manifestations of the infection.9For purposes of this study, HIV infection must be present andwould be a contributing factor (if not the primary reason) for afavorable disability determination.
The main section of this study presents HIV mortality experi-ence for the DI and SSI rolls over the period 1997-2001. Forcomparison, similar actuarial tables are provided inappendix A for 1992-96. Dramatic differences in mortalityexist between the two 5-year periods. Among male beneficia-ries in early durations, HIV mortality for 1997-2001 rangesfrom 30-50 percent of HIV mortality for 1992-96. Mortalityimprovements in later durations are less dramatic, but stillsignificant, ranging from 50-75 percent of the earlier period.A similar comparison for females shows mortality for1997-2001 is 40-60 percent of the previous period in earlydurations, and 60-80 percent in later durations.
Much of the decline in mortality experience among DI andSSI recipients appears to be consistent with the wider use ofHAART. To a lesser extent, the improvement may also be theresult of differences in the composition of the rolls betweenthe two periods. Over the period 1992-96, the number of indi-viduals that appeared on the disability rolls with HIV as theprimary reason for impairment was greater than those forwhom HIV was the secondary reason by a ratio of 10-to-1.During 1997-2001, this ratio had dropped to less than 7-to-1.Furthermore, the ratio of symptomatic HIV cases to asymp-tomatic HIV cases10 fell from roughly 6-to-1 in the earlierperiod, to 4-to-1 in the later period. Data suggest that caseshaving HIV impairment as the secondary diagnosis ratherthan the primary diagnosis, or an asymptomatic HIV diagno-sis rather than symptomatic HIV diagnosis, exhibit inherentlylower mortality. Consequently, a relatively higher concentra-tion of lower-mortality individuals on the rolls contributes tolower overall mortality.
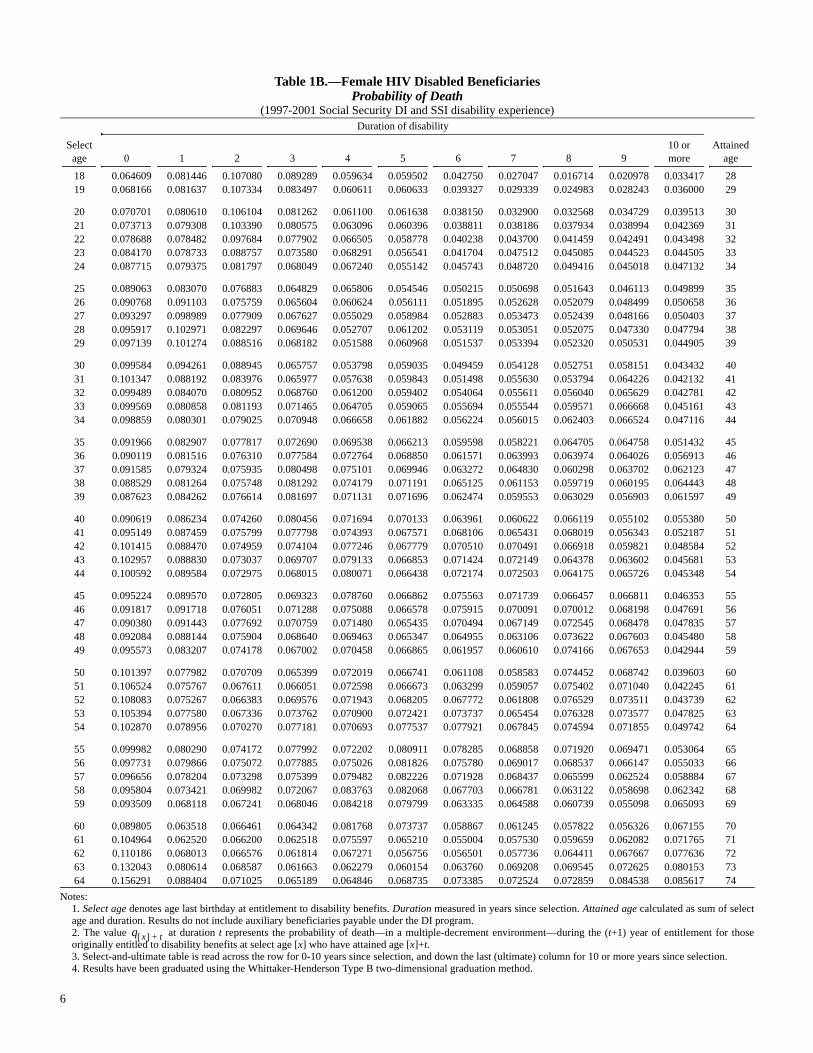
Tables 1A and 1B show select-and-ultimate probabilities ofdeath for male and female HIV disabled beneficiaries, byselect age (that is, age at entitlement/eligibility to disabilitybenefits) and duration since selection. Data reflect the com-bined actual experience of the DI and SSI rolls from January1, 1997 through December 31, 2001. The probability of deathamong HIV beneficiaries is generally highest within the firstseveral durations, then typically decreases in later durations.In comparing HIV mortality to general disability mortality,we see several common characteristics found in the overalldisability population do not necessarily hold for HIV experi-ence.11 Deviations may be due to uncertainty over the lengthof time individuals have been infected, and the degree of ther-apy received. Certain characteristics generally seen in mortal-ity patterns in the overall disability population appear to beless influential in the HIV disability population. Theseinclude:
• Gender differences—the probability of death forfemales exceeds that for males in less than 3 percent ofall attained ages in the general disability population.This phenomenon occurs roughly 20 percent of the timein the HIV disability population, often at younger selectages and either very early or very late durations.
• General demographic factors—such as age of the bene-ficiary—would normally play a more dominant role indetermining mortality for later durations. The generaldisability population exhibits a smoother progression ofdeath probabilities across durations; whereas the HIVpopulation shows greater fluctuation from one durationto the next.
7 Totals include beneficiaries concurrently entitled to DI and SSI benefits, but do not include beneficiaries entitled to SSI only.8 Recipients include roughly 30 percent concurrently entitled to DI and SSI benefits, as well as some Federally administered State Supplementation only recipients.9 A group of common complications found in early stage HIV infection was categorized as AIDS-Related Complex. Individuals may have exhibited seri-ous impairments that were reasonably assumed to be related to the infection, but did not have a definitively diagnosed case of AIDS. Symptoms include unexplained chronic deficiency of white blood cells, poorly functioning lym-phatic system, fungus infection of the mouth, herpes, recurrent fever, pro-longed diarrhea, or presence of HIV antibodies.
10 See discussion in appendix B for explanation of these terms.11 Findings are based on comparisons with overall disability mortality as dis-cussed in Actuarial Study No. 118: Social Security Disability Insurance Pro-gram Worker Experience (Zayatz, June 2005).

4
Over the period 1997-2001, male HIV mortality ranges fromone-and-a-half to three times that of overall disability mortal-ity for early durations, and up to four times as high for laterdurations. Female HIV mortality can be three to six times ashigh as overall disability mortality over the same period. Sev-eral unique circumstances were encountered in the data thataffect mortality estimates. These include death within the dis-ability waiting period, and cases where HIV is present but isnot material to benefit allowance. These and other data con-siderations are discussed in appendix B.
A survival table is a concise way of representing the probabil-ities of a particular population living to a particular age.Tables 2A and 2B show the progression of a series ofcohorts—each for a given select age—reflecting the probabil-ities of death shown in tables 1A and 1B. See appendix B fordetails on table construction and usage.
Tables 3A and 3B show the expected future lifetime of maleand female HIV disabled beneficiaries. Females have a higherfuture lifetime than males. As with general disability mortal-ity, HIV beneficiaries often exhibit a shorter life expectancyin the first several years of entitlement than in later durations.This is due to higher mortality in those years.
Tables 4 and 5 show aggregate probability of death andexpected future lifetime, by select and attained ages. Proba-bilities are exposure-weighted averages of those found intables 1A and 1B. They represent the average probability ofdeath, within one year, for those originally entitled to disabil-ity benefits at a particular select age (table 4), or those entitledto disability benefits who have attained a particular age(table 5). Similarly, aggregate future lifetime represents thelife expectancy for those of a particular select or attained age.These values are exposure-weighted averages of the select-and-ultimate future lifetimes shown in tables 3A and 3B.
Table 6 shows aggregate results based on years since selec-tion, or duration. Probabilities are based on aggregate countsof exposure and deaths across all select ages, and representthe average probability of death within the next year of enti-tlement to disability benefits. Aggregate future lifetime repre-sents the average life expectancy for all those who have beenentitled to disability benefits for the stated number of years.
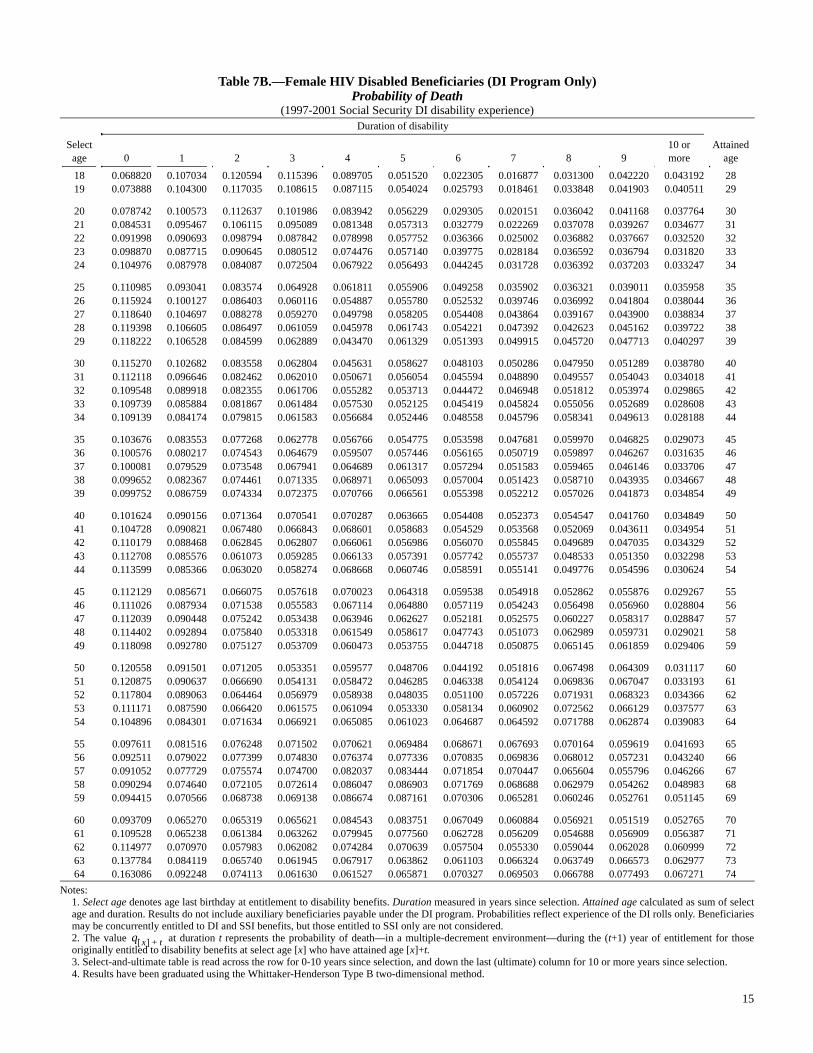
Tables 7A and 7B show select-and-ultimate probabilities ofdeath for HIV disabled beneficiaries by select age and dura-tion. These tables are similar to tables 1A and 1B, howeverthey reflect only the experience of the DI rolls. As such, bene-ficiaries may be concurrently eligible for DI and SSI benefits,but those eligible for SSI only are not considered.
When comparing tables 1A-1B to tables 7A-7B, we observethat the mortality of the combined DI and SSI rolls is higherthan that of the DI rolls in roughly two-thirds of all attainedages; this proportion increases to roughly three-fourths whenconsidering only durations 5 and later. This indicates some-what higher mortality among those receiving only SSI bene-fits (whose experience is included in tables 1A-1B, but not intables 7A-7B) than among DI beneficiaries, particularly forolder attained ages. Reasons for higher SSI mortality may berelated to the means-tested nature of the SSI program itself.By definition, SSI-only recipients are of lesser economicmeans and typically uninsured for DI benefits and, hence,ineligible for any Medicare benefits that are available underthe DI program. Generally, SSI recipients are categoricallyeligible for Medicaid. However, prior to SSI eligibility, medi-cal assisitance through Federal or State sponsored programsmay not have been available. The lack of medical treatment—both prior to and during eligibility—may contribute to highermortality rates.
Similar tables for combined experience from January 1, 1992through December 31, 1996 are presented in appendix A.

5
Notes:1. Select age denotes age last birthday at entitlement to disability benefits. Duration measured in years since selection. Attained age calculated as sum of selectage and duration. Results do not include auxiliary beneficiaries payable under the DI program.2. The value at duration t represents the probability of death—in a multiple-decrement environment—during the (t+1) year of entitlement for thoseoriginally entitled to disability benefits at select age [x] who have attained age [x]+t.3. Select-and-ultimate table is read across the row for 0-10 years since selection, and down the last (ultimate) column for 10 or more years since selection.4. Results have been graduated using the Whittaker-Henderson Type B two-dimensional method.
Table 1A.—Male HIV Disabled BeneficiariesProbability of Death
(1997-2001 Social Security DI and SSI disability experience)
Selectage
Duration of disability
Attainedage0 1 2 3 4 5 6 7 8 9
10 ormore
18 0.072424 0.061970 0.049041 0.044395 0.039615 0.062552 0.050563 0.057413 0.046820 0.039698 0.016877 2819 0.067844 0.068649 0.060102 0.051266 0.048380 0.064879 0.054528 0.056563 0.050111 0.039005 0.022984 29
20 0.064963 0.073503 0.071242 0.059366 0.055251 0.065836 0.056733 0.056155 0.052490 0.038579 0.028405 3021 0.066546 0.078799 0.081851 0.067355 0.060825 0.063942 0.057519 0.056165 0.054115 0.040173 0.033340 3122 0.072324 0.086560 0.089234 0.073580 0.065340 0.063329 0.056180 0.056407 0.057050 0.042813 0.038440 3223 0.080407 0.091846 0.093061 0.077980 0.068095 0.060679 0.052140 0.058231 0.061400 0.046054 0.043497 3324 0.088382 0.091723 0.094113 0.079606 0.071543 0.058835 0.048438 0.060613 0.063335 0.048721 0.045157 34
25 0.095077 0.088169 0.091669 0.078076 0.071820 0.060192 0.047746 0.060269 0.060925 0.052236 0.046840 3526 0.098407 0.084635 0.087606 0.077251 0.068332 0.060435 0.051807 0.058921 0.056224 0.054558 0.050940 3627 0.099076 0.084135 0.086235 0.077844 0.065436 0.059663 0.056796 0.056627 0.053400 0.054879 0.052618 3728 0.096614 0.081876 0.085671 0.076535 0.067543 0.061464 0.058762 0.055881 0.052606 0.056308 0.054454 3829 0.095514 0.080739 0.082391 0.073460 0.065730 0.059894 0.059900 0.054818 0.051790 0.057995 0.053766 39
30 0.098075 0.082003 0.080945 0.070926 0.066397 0.060144 0.058286 0.052993 0.050554 0.057884 0.054635 4031 0.105141 0.080829 0.079860 0.067207 0.066918 0.060372 0.055105 0.052590 0.052181 0.056308 0.059580 4132 0.106784 0.081482 0.078830 0.070700 0.066557 0.058501 0.056156 0.051882 0.054628 0.054098 0.060942 4233 0.102632 0.080881 0.077698 0.071781 0.066740 0.061156 0.061485 0.052391 0.061413 0.052325 0.060479 4334 0.100541 0.080806 0.079623 0.069893 0.067752 0.066658 0.061722 0.054631 0.063452 0.055974 0.061777 44
35 0.099457 0.079650 0.079024 0.072943 0.072329 0.069893 0.058148 0.057933 0.062774 0.062264 0.064911 4536 0.101599 0.078694 0.076795 0.072894 0.070951 0.070526 0.061498 0.061874 0.059468 0.069090 0.067332 4637 0.104829 0.079212 0.077374 0.070885 0.073004 0.066536 0.063171 0.063272 0.061576 0.075098 0.068115 4738 0.109102 0.083811 0.080687 0.072044 0.070583 0.062784 0.066599 0.065365 0.065264 0.075316 0.068800 4839 0.113059 0.084416 0.081142 0.071814 0.070783 0.066801 0.069815 0.067368 0.068998 0.073892 0.069489 49
40 0.118663 0.084208 0.083062 0.072838 0.073169 0.070082 0.070110 0.068395 0.070498 0.071233 0.069198 5041 0.118099 0.082197 0.081002 0.075125 0.073089 0.074186 0.069905 0.069130 0.072888 0.072268 0.070891 5142 0.114107 0.081139 0.078327 0.074788 0.075417 0.078234 0.069649 0.070990 0.078059 0.075851 0.073921 5243 0.114507 0.084619 0.079357 0.078941 0.077719 0.076880 0.073473 0.073125 0.079232 0.079797 0.071723 5344 0.115781 0.086245 0.077773 0.081938 0.080629 0.076451 0.075154 0.075229 0.079684 0.083732 0.068283 54
45 0.118907 0.088921 0.077261 0.081640 0.084272 0.076000 0.074770 0.076949 0.079540 0.086777 0.063994 5546 0.123508 0.092586 0.078050 0.079662 0.080987 0.074157 0.075519 0.078654 0.079634 0.086510 0.061175 5647 0.130179 0.094964 0.078655 0.078263 0.075861 0.071391 0.074388 0.077342 0.079527 0.082762 0.061600 5748 0.133785 0.093103 0.078087 0.077062 0.073338 0.070598 0.071527 0.076444 0.078246 0.079950 0.065649 5849 0.134264 0.091728 0.076766 0.072519 0.073124 0.068314 0.070221 0.075524 0.078759 0.081462 0.070128 59
50 0.134128 0.090194 0.081422 0.073132 0.075903 0.068483 0.074628 0.077927 0.079951 0.086466 0.072926 6051 0.136355 0.091824 0.086613 0.079117 0.080415 0.073393 0.081526 0.080458 0.082951 0.091564 0.074809 6152 0.131513 0.092727 0.091178 0.081191 0.082324 0.081563 0.087694 0.083939 0.084703 0.093596 0.075441 6253 0.127985 0.089593 0.093635 0.083973 0.084930 0.090748 0.093568 0.087702 0.086421 0.095216 0.078608 6354 0.123458 0.086888 0.092847 0.084004 0.086900 0.099208 0.095610 0.091650 0.086957 0.095312 0.081749 64
55 0.119988 0.085150 0.090099 0.084302 0.088948 0.103877 0.098470 0.094977 0.086312 0.093314 0.083978 6556 0.117971 0.085425 0.090823 0.082740 0.087678 0.106907 0.099372 0.094788 0.087054 0.089746 0.085838 6657 0.118847 0.086343 0.094964 0.081157 0.088624 0.104431 0.098312 0.093651 0.088396 0.087239 0.085478 6758 0.120873 0.088290 0.099041 0.077703 0.088823 0.099500 0.098529 0.091583 0.089062 0.085175 0.084091 6859 0.126070 0.092257 0.102476 0.079562 0.088125 0.093112 0.099982 0.088988 0.088200 0.083563 0.083550 69
60 0.134891 0.100136 0.106536 0.088520 0.088327 0.089833 0.102695 0.086674 0.085556 0.082145 0.085288 7061 0.150343 0.109907 0.110088 0.101728 0.091308 0.090793 0.103014 0.084766 0.082063 0.081182 0.090119 7162 0.165753 0.122347 0.116606 0.113242 0.099408 0.093314 0.101613 0.082816 0.077225 0.079324 0.098050 7263 0.180508 0.136352 0.123795 0.122920 0.108350 0.096861 0.098319 0.081047 0.072080 0.077168 0.107429 7364 0.195326 0.153054 0.128732 0.132037 0.117092 0.101297 0.094211 0.078433 0.066512 0.075118 0.117143 74
q x[ ] t+
6
Notes:1. Select age denotes age last birthday at entitlement to disability benefits. Duration measured in years since selection. Attained age calculated as sum of selectage and duration. Results do not include auxiliary beneficiaries payable under the DI program.2. The value at duration t represents the probability of death—in a multiple-decrement environment—during the (t+1) year of entitlement for thoseoriginally entitled to disability benefits at select age [x] who have attained age [x]+t.3. Select-and-ultimate table is read across the row for 0-10 years since selection, and down the last (ultimate) column for 10 or more years since selection.4. Results have been graduated using the Whittaker-Henderson Type B two-dimensional graduation method.
Table 1B.—Female HIV Disabled BeneficiariesProbability of Death
(1997-2001 Social Security DI and SSI disability experience)
Selectage
Duration of disability
Attainedage0 1 2 3 4 5 6 7 8 9
10 ormore
18 0.064609 0.081446 0.107080 0.089289 0.059634 0.059502 0.042750 0.027047 0.016714 0.020978 0.033417 2819 0.068166 0.081637 0.107334 0.083497 0.060611 0.060633 0.039327 0.029339 0.024983 0.028243 0.036000 29
20 0.070701 0.080610 0.106104 0.081262 0.061100 0.061638 0.038150 0.032900 0.032568 0.034729 0.039513 3021 0.073713 0.079308 0.103390 0.080575 0.063096 0.060396 0.038811 0.038186 0.037934 0.038994 0.042369 3122 0.078688 0.078482 0.097684 0.077902 0.066505 0.058778 0.040238 0.043700 0.041459 0.042491 0.043498 3223 0.084170 0.078733 0.088757 0.073580 0.068291 0.056541 0.041704 0.047512 0.045085 0.044523 0.044505 3324 0.087715 0.079375 0.081797 0.068049 0.067240 0.055142 0.045743 0.048720 0.049416 0.045018 0.047132 34
25 0.089063 0.083070 0.076883 0.064829 0.065806 0.054546 0.050215 0.050698 0.051643 0.046113 0.049899 3526 0.090768 0.091103 0.075759 0.065604 0.060624 0.056111 0.051895 0.052628 0.052079 0.048499 0.050658 3627 0.093297 0.098989 0.077909 0.067627 0.055029 0.058984 0.052883 0.053473 0.052439 0.048166 0.050403 3728 0.095917 0.102971 0.082297 0.069646 0.052707 0.061202 0.053119 0.053051 0.052075 0.047330 0.047794 3829 0.097139 0.101274 0.088516 0.068182 0.051588 0.060968 0.051537 0.053394 0.052320 0.050531 0.044905 39
30 0.099584 0.094261 0.088945 0.065757 0.053798 0.059035 0.049459 0.054128 0.052751 0.058151 0.043432 4031 0.101347 0.088192 0.083976 0.065977 0.057638 0.059843 0.051498 0.055630 0.053794 0.064226 0.042132 4132 0.099489 0.084070 0.080952 0.068760 0.061200 0.059402 0.054064 0.055611 0.056040 0.065629 0.042781 4233 0.099569 0.080858 0.081193 0.071465 0.064705 0.059065 0.055694 0.055544 0.059571 0.066668 0.045161 4334 0.098859 0.080301 0.079025 0.070948 0.066658 0.061882 0.056224 0.056015 0.062403 0.066524 0.047116 44
35 0.091966 0.082907 0.077817 0.072690 0.069538 0.066213 0.059598 0.058221 0.064705 0.064758 0.051432 4536 0.090119 0.081516 0.076310 0.077584 0.072764 0.068850 0.061571 0.063993 0.063974 0.064026 0.056913 4637 0.091585 0.079324 0.075935 0.080498 0.075101 0.069946 0.063272 0.064830 0.060298 0.063702 0.062123 4738 0.088529 0.081264 0.075748 0.081292 0.074179 0.071191 0.065125 0.061153 0.059719 0.060195 0.064443 4839 0.087623 0.084262 0.076614 0.081697 0.071131 0.071696 0.062474 0.059553 0.063029 0.056903 0.061597 49
40 0.090619 0.086234 0.074260 0.080456 0.071694 0.070133 0.063961 0.060622 0.066119 0.055102 0.055380 5041 0.095149 0.087459 0.075799 0.077798 0.074393 0.067571 0.068106 0.065431 0.068019 0.056343 0.052187 5142 0.101415 0.088470 0.074959 0.074104 0.077246 0.067779 0.070510 0.070491 0.066918 0.059821 0.048584 5243 0.102957 0.088830 0.073037 0.069707 0.079133 0.066853 0.071424 0.072149 0.064378 0.063602 0.045681 5344 0.100592 0.089584 0.072975 0.068015 0.080071 0.066438 0.072174 0.072503 0.064175 0.065726 0.045348 54
45 0.095224 0.089570 0.072805 0.069323 0.078760 0.066862 0.075563 0.071739 0.066457 0.066811 0.046353 5546 0.091817 0.091718 0.076051 0.071288 0.075088 0.066578 0.075915 0.070091 0.070012 0.068198 0.047691 5647 0.090380 0.091443 0.077692 0.070759 0.071480 0.065435 0.070494 0.067149 0.072545 0.068478 0.047835 5748 0.092084 0.088144 0.075904 0.068640 0.069463 0.065347 0.064955 0.063106 0.073622 0.067603 0.045480 5849 0.095573 0.083207 0.074178 0.067002 0.070458 0.066865 0.061957 0.060610 0.074166 0.067653 0.042944 59
50 0.101397 0.077982 0.070709 0.065399 0.072019 0.066741 0.061108 0.058583 0.074452 0.068742 0.039603 6051 0.106524 0.075767 0.067611 0.066051 0.072598 0.066673 0.063299 0.059057 0.075402 0.071040 0.042245 6152 0.108083 0.075267 0.066383 0.069576 0.071943 0.068205 0.067772 0.061808 0.076529 0.073511 0.043739 6253 0.105394 0.077580 0.067336 0.073762 0.070900 0.072421 0.073737 0.065454 0.076328 0.073577 0.047825 6354 0.102870 0.078956 0.070270 0.077181 0.070693 0.077537 0.077921 0.067845 0.074594 0.071855 0.049742 64
55 0.099982 0.080290 0.074172 0.077992 0.072202 0.080911 0.078285 0.068858 0.071920 0.069471 0.053064 6556 0.097731 0.079866 0.075072 0.077885 0.075026 0.081826 0.075780 0.069017 0.068537 0.066147 0.055033 6657 0.096656 0.078204 0.073298 0.075399 0.079482 0.082226 0.071928 0.068437 0.065599 0.062524 0.058884 6758 0.095804 0.073421 0.069982 0.072067 0.083763 0.082068 0.067703 0.066781 0.063122 0.058698 0.062342 6859 0.093509 0.068118 0.067241 0.068046 0.084218 0.079799 0.063335 0.064588 0.060739 0.055098 0.065093 69
60 0.089805 0.063518 0.066461 0.064342 0.081768 0.073737 0.058867 0.061245 0.057822 0.056326 0.067155 7061 0.104964 0.062520 0.066200 0.062518 0.075597 0.065210 0.055004 0.057530 0.059659 0.062082 0.071765 7162 0.110186 0.068013 0.066576 0.061814 0.067271 0.056756 0.056501 0.057736 0.064411 0.067667 0.077636 7263 0.132043 0.080614 0.068587 0.061663 0.062279 0.060154 0.063760 0.069208 0.069545 0.072625 0.080153 7364 0.156291 0.088404 0.071025 0.065189 0.064846 0.068735 0.073385 0.072524 0.072859 0.084538 0.085617 74
q x[ ] t+

7
Notes:1. Select age denotes age last birthday at entitlement to disability benefits. Duration measured in years since selection. Attained age calculated as sum of selectage and duration. Results do not include auxiliary beneficiaries payable under the DI program.2. The value at duration 0 represents the assumed number of lives originally entitled to disability benefits at select age [x]; the value at durationt > 0 represents the number of lives remaining from the original who have attained age [x]+t. Lives are decremented using probabilities from table 1A. 3. Select-and-ultimate table is read across the row for 0-10 years since selection, and down the last (ultimate) column for 10 or more years since selection.
Table 2A.—Male HIV Disabled BeneficiariesSurvival Table
(1997-2001 Social Security DI and SSI disability experience)
Selectage
Duration of disability
Attainedage0 1 2 3 4 5 6 7 8 9
10 ormore
18 100,000 92,758 87,010 82,743 79,070 75,938 71,188 67,589 63,709 60,726 58,315 2819 102,206 95,272 88,732 83,399 79,123 75,295 70,410 66,571 62,806 59,659 57,331 29
20 103,400 96,683 89,577 83,195 78,256 73,932 69,065 65,147 61,489 58,261 56,013 3021 104,099 97,172 89,515 82,188 76,652 71,990 67,387 63,511 59,944 56,700 54,422 3122 104,559 96,997 88,601 80,695 74,757 69,872 65,447 61,770 58,286 54,961 52,608 3223 103,533 95,208 86,464 78,418 72,303 67,380 63,291 59,991 56,498 53,029 50,586 3324 100,702 91,802 83,382 75,535 69,522 64,548 60,750 57,807 54,303 50,864 48,386 34
25 96,241 87,091 79,412 72,132 66,500 61,724 58,009 55,239 51,910 48,747 46,201 3526 90,935 81,986 75,047 68,472 63,182 58,865 55,307 52,442 49,352 46,577 44,037 3627 85,925 77,412 70,899 64,785 59,742 55,833 52,502 49,520 46,716 44,221 41,794 3728 81,316 73,460 67,445 61,667 56,947 53,101 49,837 46,908 44,287 41,957 39,595 3829 75,974 68,717 63,169 57,964 53,706 50,176 47,171 44,345 41,914 39,743 37,439 39
30 71,589 64,568 59,273 54,475 50,611 47,251 44,409 41,821 39,605 37,603 35,426 4031 67,575 60,470 55,582 51,143 47,706 44,514 41,827 39,522 37,444 35,490 33,491 4132 63,767 56,958 52,317 48,193 44,786 41,805 39,359 37,149 35,222 33,298 31,496 4233 60,435 54,232 49,846 45,973 42,673 39,825 37,389 35,090 33,252 31,210 29,577 4334 57,537 51,752 47,570 43,782 40,722 37,963 35,432 33,245 31,429 29,435 27,788 44
35 54,756 49,310 45,382 41,796 38,747 35,944 33,432 31,488 29,664 27,802 26,071 4536 51,696 46,444 42,789 39,503 36,623 34,025 31,625 29,680 27,844 26,188 24,379 4637 48,826 43,708 40,246 37,132 34,500 31,981 29,853 27,967 26,197 24,584 22,738 4738 46,330 41,275 37,816 34,765 32,260 29,983 28,101 26,230 24,515 22,915 21,189 4839 43,923 38,957 35,668 32,774 30,420 28,267 26,379 24,537 22,884 21,305 19,731 49
40 41,512 36,586 33,505 30,722 28,484 26,400 24,550 22,829 21,268 19,769 18,360 5041 38,872 34,281 31,463 28,914 26,742 24,787 22,948 21,344 19,868 18,420 17,090 5142 36,447 32,288 29,668 27,344 25,299 23,391 21,561 20,059 18,635 17,180 15,878 5243 34,533 30,579 27,991 25,770 23,736 21,891 20,208 18,723 17,354 15,979 14,704 5344 32,583 28,811 26,326 24,279 22,290 20,493 18,926 17,504 16,187 14,897 13,649 54
45 30,777 27,117 24,706 22,797 20,936 19,172 17,715 16,390 15,129 13,926 12,717 5546 28,947 25,372 23,023 21,226 19,535 17,953 16,622 15,367 14,158 13,031 11,903 5647 27,014 23,497 21,266 19,593 18,060 16,690 15,498 14,345 13,236 12,183 11,175 5748 25,051 21,700 19,680 18,143 16,745 15,517 14,422 13,390 12,366 11,398 10,487 5849 23,170 20,059 18,219 16,820 15,600 14,459 13,471 12,525 11,579 10,667 9,799 59
50 22,007 19,055 17,336 15,924 14,759 13,639 12,705 11,757 10,841 9,974 9,112 6051 21,356 18,444 16,750 15,299 14,089 12,956 12,005 11,026 10,139 9,298 8,447 6152 20,325 17,652 16,015 14,555 13,373 12,272 11,271 10,283 9,420 8,622 7,815 6253 19,274 16,807 15,301 13,868 12,703 11,624 10,569 9,580 8,740 7,985 7,225 6354 17,934 15,720 14,354 13,021 11,927 10,891 9,811 8,873 8,060 7,359 6,657 64
55 16,514 14,533 13,296 12,098 11,078 10,093 9,045 8,154 7,380 6,743 6,113 6556 15,080 13,301 12,165 11,060 10,145 9,256 8,266 7,445 6,739 6,152 5,600 6657 13,776 12,139 11,091 10,038 9,223 8,406 7,528 6,788 6,152 5,608 5,119 6758 12,552 11,035 10,061 9,065 8,361 7,618 6,860 6,184 5,618 5,118 4,681 6859 11,545 10,090 9,159 8,220 7,566 6,899 6,257 5,631 5,130 4,678 4,287 69
60 10,858 9,393 8,452 7,552 6,883 6,275 5,711 5,125 4,681 4,281 3,929 7061 10,392 8,830 7,860 6,995 6,283 5,709 5,191 4,656 4,261 3,911 3,594 7162 9,974 8,321 7,303 6,451 5,720 5,151 4,670 4,195 3,848 3,551 3,270 7263 9,489 7,776 6,716 5,885 5,162 4,603 4,157 3,748 3,444 3,196 2,949 7364 8,931 7,187 6,087 5,303 4,603 4,064 3,652 3,308 3,049 2,846 2,632 74
l x[ ] l x[ ] t+l x[ ]

8
Notes:1. Select age denotes age last birthday at entitlement to disability benefits. Duration measured in years since selection. Attained age calculated as sum of selectage and duration. Results do not include auxiliary beneficiaries payable under the DI program.2. The value at duration 0 represents the assumed number of lives originally entitled to disability benefits at select age [x]; the value at durationt > 0 represents the number of lives remaining from the original who have attained age [x]+t. Lives are decremented using probabilities from table 1B.3. Select-and-ultimate table is read across the row for 0-10 years since selection, and down the last (ultimate) column for 10 or more years since selection.
Table 2B.—Female HIV Disabled BeneficiariesSurvival Table
(1997-2001 Social Security DI and SSI disability experience)
Selectage
Duration of disability
Attainedage0 1 2 3 4 5 6 7 8 9
10 ormore
18 100,000 93,539 85,921 76,721 69,871 65,704 61,794 59,152 57,552 56,590 55,403 2819 98,108 91,420 83,957 74,946 68,688 64,525 60,613 58,229 56,521 55,109 53,552 29
20 96,135 89,338 82,136 73,421 67,455 63,333 59,429 57,162 55,281 53,481 51,624 3021 93,733 86,824 79,938 71,673 65,898 61,740 58,011 55,760 53,631 51,597 49,584 3122 90,819 83,673 77,106 69,574 64,154 59,887 56,367 54,099 51,735 49,590 47,483 3223 87,104 79,772 73,491 66,968 62,040 57,803 54,535 52,261 49,778 47,534 45,418 3324 83,142 75,849 69,828 64,116 59,753 55,735 52,662 50,253 47,805 45,443 43,397 34
25 79,606 72,516 66,492 61,380 57,401 53,624 50,699 48,153 45,712 43,351 41,352 3526 76,638 69,682 63,334 58,536 54,696 51,380 48,497 45,980 43,560 41,291 39,289 3627 73,861 66,970 60,341 55,640 51,877 49,022 46,130 43,691 41,355 39,186 37,299 3728 71,036 64,222 57,609 52,868 49,186 46,594 43,742 41,418 39,221 37,179 35,419 3829 68,018 61,411 55,192 50,307 46,877 44,459 41,748 39,596 37,482 35,521 33,726 39
30 64,977 58,506 52,991 48,278 45,103 42,677 40,158 38,172 36,106 34,201 32,212 4031 62,549 56,210 51,253 46,949 43,851 41,324 38,851 36,850 34,800 32,928 30,813 4132 60,094 54,115 49,566 45,554 42,422 39,826 37,460 35,435 33,464 31,589 29,515 4233 58,080 52,297 48,068 44,165 41,009 38,356 36,091 34,081 32,188 30,271 28,252 4334 55,719 50,211 46,179 42,530 39,513 36,879 34,597 32,652 30,823 28,900 26,976 44
35 53,626 48,694 44,657 41,182 38,188 35,532 33,179 31,202 29,385 27,484 25,705 4536 51,539 46,894 43,071 39,784 36,697 34,027 31,684 29,733 27,830 26,050 24,383 4637 48,806 44,336 40,819 37,719 34,683 32,078 29,834 27,946 26,134 24,558 22,995 4738 45,475 41,449 38,081 35,196 32,335 29,936 27,805 25,994 24,404 22,947 21,566 4839 42,391 38,677 35,418 32,704 30,032 27,896 25,896 24,278 22,832 21,393 20,176 49
40 39,963 36,342 33,208 30,742 28,269 26,242 24,402 22,841 21,456 20,037 18,933 5041 38,442 34,784 31,742 29,336 27,054 25,041 23,349 21,759 20,335 18,952 17,884 5142 37,060 33,302 30,356 28,081 26,000 23,992 22,366 20,789 19,324 18,031 16,951 5243 35,274 31,642 28,831 26,725 24,862 22,895 21,364 19,838 18,407 17,222 16,127 5344 33,666 30,279 27,566 25,554 23,816 21,909 20,453 18,977 17,601 16,471 15,390 54
45 32,163 29,100 26,494 24,565 22,862 21,061 19,653 18,168 16,865 15,744 14,692 5546 30,790 27,963 25,398 23,466 21,793 20,157 18,815 17,387 16,168 15,036 14,011 5647 28,979 26,360 23,950 22,089 20,526 19,059 17,812 16,556 15,444 14,324 13,343 5748 27,094 24,599 22,431 20,728 19,305 17,964 16,790 15,699 14,708 13,625 12,705 5849 25,663 23,210 21,279 19,701 18,381 17,086 15,944 14,956 14,050 13,008 12,127 59
50 24,445 21,966 20,253 18,821 17,590 16,323 15,234 14,303 13,465 12,463 11,606 6051 23,655 21,135 19,534 18,213 17,010 15,775 14,723 13,791 12,977 11,999 11,146 6152 23,025 20,536 18,990 17,729 16,495 15,308 14,264 13,297 12,475 11,520 10,675 6253 22,431 20,067 18,510 17,264 15,991 14,857 13,781 12,765 11,929 11,018 10,208 6354 21,664 19,435 17,900 16,642 15,358 14,272 13,165 12,139 11,315 10,471 9,720 64
55 20,684 18,616 17,121 15,851 14,615 13,560 12,463 11,487 10,696 9,927 9,237 6556 19,434 17,535 16,135 14,924 13,762 12,729 11,687 10,801 10,056 9,367 8,747 6657 18,107 16,357 15,078 13,973 12,919 11,892 10,914 10,129 9,436 8,817 8,266 6758 16,673 15,076 13,969 12,991 12,055 11,045 10,139 9,453 8,822 8,265 7,779 6859 15,158 13,741 12,805 11,944 11,131 10,194 9,381 8,787 8,219 7,720 7,294 69
60 13,709 12,478 11,685 10,908 10,206 9,371 8,680 8,169 7,669 7,226 6,819 7061 12,758 11,419 10,705 9,996 9,371 8,663 8,098 7,653 7,213 6,783 6,361 7162 11,918 10,605 9,884 9,226 8,656 8,074 7,616 7,186 6,771 6,335 5,905 7263 11,785 10,229 9,404 8,759 8,219 7,707 7,243 6,781 6,312 5,873 5,447 7364 11,808 9,963 9,082 8,437 7,887 7,376 6,869 6,365 5,903 5,473 5,010 74
l x[ ] l x[ ] t+l x[ ]

9
Notes:1. Select age denotes age last birthday at entitlement to disability benefits. Duration measured in years since selection. Attained age calculated as sum of selectage and duration. Results do not include auxiliary beneficiaries payable under the DI program.2. The value at duration t represents the average number of years of life remaining for those originally entitled to disability benefits at select age [x] whohave attained age [x]+t. Values are based on survivorship experience from table 2A.3. Select-and-ultimate table is read across the row for 0-10 years since selection, and down the last (ultimate) column for 10 or more years since selection.
Table 3A.—Male HIV Disabled BeneficiariesExpected Future Lifetime
(1997-2001 Social Security DI and SSI disability experience)
Selectage
Duration of disability
Attainedage0 1 2 3 4 5 6 7 8 9
10 ormore
18 18.20 18.58 18.77 18.72 18.56 18.31 18.50 18.45 18.55 18.43 18.18 2819 17.25 17.47 17.72 17.82 17.76 17.64 17.82 17.82 17.86 17.78 17.48 29
20 16.45 16.56 16.83 17.08 17.13 17.10 17.27 17.28 17.28 17.21 16.88 3021 15.70 15.79 16.09 16.48 16.64 16.68 16.79 16.78 16.75 16.68 16.36 3122 14.98 15.11 15.50 15.97 16.20 16.29 16.36 16.31 16.25 16.20 15.91 3223 14.44 14.66 15.09 15.58 15.86 15.98 15.98 15.83 15.78 15.78 15.52 3324 14.09 14.41 14.81 15.30 15.58 15.74 15.69 15.46 15.43 15.44 15.20 34
25 13.93 14.34 14.68 15.11 15.34 15.49 15.45 15.20 15.14 15.09 14.90 3526 13.88 14.34 14.62 14.97 15.18 15.26 15.21 15.01 14.92 14.78 14.61 3627 13.80 14.26 14.53 14.85 15.06 15.08 15.01 14.88 14.74 14.55 14.36 3728 13.72 14.13 14.35 14.65 14.82 14.86 14.80 14.69 14.53 14.31 14.13 3829 13.75 14.15 14.35 14.59 14.71 14.71 14.62 14.51 14.33 14.08 13.92 39
30 13.66 14.09 14.30 14.52 14.59 14.59 14.49 14.36 14.13 13.86 13.68 4031 13.53 14.06 14.26 14.45 14.46 14.46 14.35 14.16 13.92 13.66 13.44 4132 13.40 13.94 14.13 14.30 14.35 14.34 14.20 14.01 13.75 13.52 13.26 4233 13.27 13.73 13.89 14.02 14.06 14.03 13.91 13.79 13.53 13.38 13.09 4334 13.08 13.48 13.63 13.76 13.76 13.72 13.67 13.53 13.29 13.15 12.90 44
35 12.89 13.25 13.36 13.46 13.48 13.49 13.47 13.27 13.05 12.90 12.72 4536 12.75 13.13 13.21 13.27 13.28 13.25 13.22 13.05 12.88 12.66 12.57 4637 12.59 13.01 13.08 13.14 13.10 13.09 12.99 12.83 12.67 12.47 12.44 4738 12.36 12.81 12.93 13.02 13.00 12.95 12.78 12.66 12.51 12.34 12.31 4839 12.14 12.63 12.75 12.83 12.78 12.72 12.59 12.50 12.37 12.25 12.18 49
40 11.93 12.47 12.57 12.67 12.62 12.58 12.49 12.39 12.27 12.16 12.05 5041 11.84 12.36 12.42 12.48 12.45 12.39 12.34 12.23 12.10 12.02 11.91 5142 11.76 12.21 12.25 12.25 12.20 12.15 12.14 12.01 11.89 11.85 11.78 5243 11.54 11.97 12.03 12.03 12.02 11.99 11.94 11.85 11.75 11.71 11.69 5344 11.37 11.79 11.86 11.82 11.83 11.82 11.76 11.67 11.58 11.54 11.55 54
45 11.18 11.62 11.71 11.65 11.64 11.66 11.58 11.47 11.39 11.33 11.36 5546 11.02 11.50 11.62 11.56 11.52 11.49 11.37 11.26 11.17 11.10 11.10 5647 10.89 11.44 11.59 11.54 11.47 11.37 11.21 11.07 10.96 10.86 10.79 5748 10.81 11.41 11.53 11.46 11.38 11.24 11.05 10.87 10.72 10.59 10.47 5849 10.77 11.36 11.46 11.37 11.22 11.07 10.84 10.62 10.45 10.30 10.17 59
50 10.53 11.08 11.13 11.08 10.91 10.77 10.52 10.33 10.16 10.00 9.90 6051 10.13 10.65 10.68 10.64 10.51 10.39 10.17 10.03 9.86 9.71 9.64 6152 9.88 10.30 10.30 10.29 10.15 10.02 9.86 9.76 9.61 9.45 9.38 6253 9.66 10.00 9.94 9.92 9.78 9.64 9.55 9.49 9.35 9.19 9.10 6354 9.54 9.82 9.70 9.64 9.48 9.34 9.31 9.24 9.12 8.94 8.83 64
55 9.46 9.68 9.53 9.43 9.25 9.10 9.10 9.04 8.93 8.73 8.58 6556 9.38 9.57 9.41 9.30 9.10 8.92 8.93 8.86 8.74 8.53 8.32 6657 9.26 9.45 9.29 9.21 8.98 8.81 8.78 8.68 8.53 8.31 8.05 6758 9.15 9.34 9.19 9.15 8.88 8.70 8.60 8.49 8.29 8.05 7.76 6859 8.95 9.17 9.05 9.03 8.77 8.57 8.40 8.27 8.03 7.76 7.42 69
60 8.61 8.87 8.80 8.79 8.60 8.39 8.16 8.04 7.76 7.43 7.06 7061 8.15 8.50 8.48 8.47 8.38 8.17 7.93 7.79 7.46 7.09 6.67 7162 7.66 8.08 8.13 8.14 8.12 7.96 7.73 7.55 7.18 6.74 6.28 7263 7.20 7.68 7.81 7.84 7.87 7.76 7.54 7.31 6.91 6.41 5.91 7364 6.77 7.30 7.53 7.56 7.64 7.59 7.39 7.10 6.66 6.10 5.56 74
e x[ ] t+

10
Notes:1. Select age denotes age last birthday at entitlement to disability benefits. Duration measured in years since selection. Attained age calculated as sum of selectage and duration. Results do not include auxiliary beneficiaries payable under the DI program.2. The value at duration t represents the average number of years of life remaining for those originally entitled to disability benefits at select age [x] whohave attained age [x]+t. Values are based on survivorship experience from table 2B.3. Select-and-ultimate table is read across the row for 0-10 years since selection, and down the last (ultimate) column for 10 or more years since selection.
Table 3B.—Female HIV Disabled BeneficiariesExpected Future Lifetime
(1997-2001 Social Security DI and SSI disability experience)
Selectage
Duration of disability
Attainedage0 1 2 3 4 5 6 7 8 9
10 ormore
18 17.82 18.02 18.57 19.74 20.62 20.90 21.19 21.12 20.69 20.03 19.45 2819 17.46 17.70 18.23 19.36 20.08 20.34 20.62 20.45 20.05 19.55 19.11 29
20 17.12 17.38 17.86 18.92 19.55 19.79 20.06 19.83 19.49 19.13 18.80 3021 16.82 17.12 17.55 18.52 19.10 19.35 19.56 19.33 19.08 18.81 18.55 3122 16.59 16.96 17.37 18.19 18.69 18.98 19.14 18.92 18.76 18.55 18.35 3223 16.48 16.95 17.35 17.99 18.38 18.70 18.79 18.58 18.48 18.33 18.16 3324 16.42 16.95 17.37 17.87 18.14 18.41 18.46 18.32 18.23 18.15 17.99 34
25 16.30 16.85 17.33 17.73 17.93 18.16 18.17 18.11 18.05 18.00 17.85 3526 16.09 16.64 17.26 17.63 17.84 17.95 17.99 17.95 17.92 17.88 17.76 3627 15.83 16.41 17.16 17.56 17.80 17.81 17.89 17.87 17.85 17.81 17.68 3728 15.60 16.21 17.01 17.49 17.76 17.72 17.85 17.82 17.79 17.74 17.59 3829 15.47 16.08 16.83 17.42 17.66 17.59 17.70 17.64 17.60 17.55 17.45 39
30 15.40 16.04 16.66 17.24 17.42 17.38 17.44 17.32 17.28 17.22 17.25 4031 15.25 15.91 16.40 16.86 17.02 17.03 17.08 16.98 16.95 16.89 17.01 4132 15.11 15.73 16.13 16.50 16.68 16.74 16.76 16.69 16.65 16.60 16.74 4233 14.89 15.48 15.80 16.15 16.36 16.45 16.45 16.39 16.33 16.33 16.46 4334 14.74 15.30 15.59 15.88 16.06 16.17 16.20 16.14 16.07 16.10 16.22 44
35 14.55 14.97 15.28 15.53 15.71 15.84 15.93 15.91 15.86 15.93 15.99 4536 14.35 14.73 14.99 15.19 15.42 15.59 15.71 15.71 15.75 15.79 15.83 4637 14.27 14.66 14.88 15.06 15.33 15.54 15.67 15.69 15.75 15.73 15.76 4738 14.33 14.68 14.93 15.11 15.41 15.60 15.76 15.82 15.82 15.79 15.77 4839 14.38 14.71 15.02 15.23 15.54 15.69 15.86 15.89 15.86 15.89 15.82 49
40 14.33 14.71 15.05 15.22 15.50 15.66 15.81 15.85 15.84 15.93 15.83 5041 14.09 14.52 14.87 15.05 15.27 15.46 15.54 15.64 15.70 15.81 15.73 5142 13.85 14.35 14.70 14.85 14.99 15.21 15.28 15.40 15.53 15.60 15.57 5243 13.74 14.26 14.61 14.72 14.78 15.01 15.05 15.17 15.31 15.33 15.34 5344 13.63 14.09 14.43 14.53 14.55 14.78 14.79 14.90 15.03 15.03 15.05 54
45 13.51 13.88 14.19 14.27 14.29 14.47 14.48 14.62 14.71 14.72 14.74 5546 13.34 13.64 13.97 14.07 14.12 14.22 14.20 14.33 14.37 14.41 14.43 5647 13.31 13.59 13.90 14.03 14.06 14.11 14.06 14.09 14.06 14.13 14.13 5748 13.33 13.63 13.90 14.00 14.00 14.01 13.95 13.89 13.79 13.85 13.81 5849 13.23 13.58 13.76 13.83 13.78 13.79 13.74 13.62 13.46 13.50 13.45 59
50 13.08 13.49 13.59 13.59 13.51 13.52 13.45 13.29 13.09 13.10 13.03 6051 12.78 13.25 13.29 13.22 13.12 13.11 13.01 12.85 12.63 12.62 12.54 6152 12.44 12.88 12.89 12.77 12.69 12.64 12.53 12.40 12.18 12.15 12.08 6253 12.08 12.44 12.45 12.31 12.25 12.15 12.06 11.98 11.78 11.72 11.61 6354 11.77 12.06 12.05 11.92 11.88 11.74 11.69 11.63 11.44 11.33 11.16 64
55 11.52 11.75 11.73 11.63 11.57 11.43 11.39 11.32 11.12 10.94 10.72 6556 11.38 11.56 11.52 11.41 11.33 11.21 11.16 11.04 10.82 10.58 10.29 6657 11.28 11.43 11.36 11.22 11.09 11.01 10.95 10.76 10.51 10.21 9.86 6758 11.25 11.39 11.25 11.06 10.88 10.83 10.75 10.49 10.21 9.86 9.45 6859 11.29 11.40 11.20 10.97 10.73 10.67 10.56 10.24 9.91 9.52 9.04 69
60 11.35 11.42 11.16 10.92 10.63 10.54 10.34 9.95 9.57 9.12 8.64 7061 11.11 11.36 11.08 10.83 10.52 10.34 10.03 9.58 9.13 8.68 8.22 7162 10.86 11.14 10.92 10.66 10.33 10.04 9.62 9.16 8.69 8.26 7.82 7263 10.15 10.62 10.51 10.25 9.89 9.51 9.09 8.67 8.28 7.86 7.44 7364 9.40 10.05 9.98 9.70 9.35 8.96 8.58 8.22 7.83 7.40 7.04 74
e x[ ] t+

11
Notes:1. Select age denotes age last birthday at entitlement to disability benefits.2. Probability of death at select age [x] represents the average probability of dying within one year for thoseoriginally entitled to disability benefits at that particular age. Values are exposure-weighted averages of thegraduated and blended probabilities of death across all durations from tables 1A and 1B.3. Future lifetime at select age [x] represents the aggregate life expectancy in years for those originally entitledto disability benefits at that particular age. Values are exposure-weighted averages of expected future lifetimeacross all durations from tables 3A and 3B.
Table 4.—HIV Disabled Beneficiaries Aggregate Probability of Death and Expected Future Lifetime,
by Select Age(1997-2001 Social Security DI and SSI disability experience)
SelectAge
Male Female
Probabilityof death
Futurelifetime
Probabilityof death
Futurelifetime
18 0.048213 17.12 0.055448 19.3719 0.053457 16.61 0.057076 19.00
20 0.056447 16.24 0.059288 18.6621 0.060002 15.96 0.062546 18.2522 0.062310 15.62 0.064290 18.0323 0.066437 15.27 0.063651 17.8624 0.068602 15.03 0.063608 17.74
25 0.068671 14.86 0.064028 17.5626 0.068678 14.71 0.064905 17.4327 0.069004 14.60 0.066358 17.3128 0.069585 14.44 0.068699 17.1829 0.068864 14.36 0.067714 17.09
30 0.068898 14.25 0.068263 16.8631 0.069573 14.14 0.069162 16.5632 0.070649 14.00 0.069513 16.2733 0.071699 13.76 0.070385 15.9934 0.073041 13.51 0.071809 15.72
35 0.074187 13.26 0.072620 15.4436 0.074849 13.08 0.074137 15.1837 0.075537 12.93 0.074859 15.1138 0.077468 12.77 0.074888 15.1539 0.079462 12.58 0.075147 15.20
40 0.081264 12.42 0.075497 15.1841 0.081757 12.27 0.077117 14.9642 0.082009 12.09 0.079028 14.7243 0.084189 11.89 0.078911 14.5644 0.085845 11.71 0.079275 14.33
45 0.086970 11.53 0.078163 14.0946 0.088387 11.38 0.079196 13.8647 0.088709 11.29 0.077546 13.7848 0.088403 11.19 0.076457 13.7149 0.087850 11.06 0.076051 13.52
50 0.089456 10.78 0.075020 13.3451 0.093348 10.39 0.075239 12.9352 0.094668 10.06 0.077450 12.5453 0.096841 9.74 0.077892 12.1054 0.096438 9.53 0.079865 11.77
55 0.095830 9.33 0.080235 11.4656 0.095485 9.21 0.078557 11.0857 0.097109 9.07 0.078631 10.9158 0.096584 8.96 0.076039 10.5759 0.098881 8.76 0.074986 10.71
60 0.103327 8.54 0.072366 10.5561 0.110067 8.16 0.072077 10.2762 0.120178 7.82 0.072019 10.0863 0.131716 7.43 0.079247 9.5164 0.136950 7.22 0.104357 9.01

12
Notes:1. Attained age calculated as sum of select age and duration.2. Probability of death at attained age x represents the average probability of dying within one year for thoseoriginally entitled to disability benefits who have attained that particular age. Values are exposure-weightedaverages of the graduated and blended probabilities of death across all durations from tables 1A and 1B.3. Future lifetime at attained age x represents the aggregate life expectancy in years for those originally entitledto disability benefits who have attained that particular age. Values are exposure-weighted averages of expectedfuture lifetime across all durations from tables 3A and 3B.
Table 5.—HIV Disabled BeneficiariesAggregate Probability of Death and Expected Future Lifetime,
by Attained Age(1997-2001 Social Security DI and SSI disability experience)
Attained Age
Male Female
Probabilityof death
Futurelifetime
Probabilityof death
Futurelifetime
18 0.072424 18.20 0.064609 17.8219 0.065225 17.84 0.073461 17.68
20 0.062027 17.29 0.083118 17.6621 0.064024 16.75 0.084933 17.7122 0.067217 16.33 0.082379 17.7423 0.075035 15.86 0.081905 17.7524 0.080115 15.46 0.079503 17.80
25 0.082972 15.28 0.076135 17.8026 0.083132 15.13 0.073728 17.7227 0.081708 15.02 0.073386 17.5528 0.079202 14.92 0.073907 17.3829 0.077348 14.81 0.074084 17.27
30 0.076674 14.69 0.074314 17.1531 0.076677 14.57 0.074278 17.0332 0.075851 14.47 0.072680 16.9333 0.074393 14.37 0.070594 16.8134 0.072669 14.23 0.070003 16.62
35 0.072307 14.07 0.068819 16.4236 0.072383 13.89 0.068934 16.2037 0.071316 13.71 0.069013 15.9738 0.072337 13.50 0.068528 15.7939 0.074946 13.29 0.069863 15.61
40 0.075837 13.10 0.071790 15.4841 0.076130 12.94 0.073437 15.3742 0.075154 12.79 0.074297 15.2843 0.075049 12.61 0.074795 15.2244 0.076570 12.42 0.074560 15.13
45 0.078055 12.24 0.072875 15.0546 0.080618 12.06 0.072180 14.9347 0.082665 11.92 0.073006 14.7948 0.083607 11.79 0.074307 14.6849 0.084261 11.67 0.074913 14.55
50 0.084513 11.54 0.074023 14.4251 0.083733 11.37 0.073002 14.2652 0.083281 11.18 0.071623 14.0553 0.083813 10.93 0.069624 13.8354 0.084122 10.66 0.070105 13.49
55 0.084070 10.40 0.069954 13.1656 0.084093 10.15 0.069923 12.8657 0.085751 9.90 0.070304 12.5658 0.088392 9.66 0.070815 12.2659 0.091486 9.45 0.071038 12.00
60 0.095506 9.23 0.069360 11.8061 0.098184 9.03 0.069570 11.5662 0.100652 8.82 0.069780 11.3163 0.102997 8.60 0.070852 11.0664 0.102286 8.44 0.069905 10.81
65 0.098855 8.31 0.065096 10.5766 0.097156 8.15 0.061199 10.2767 0.095087 7.97 0.059035 9.9168 0.090852 7.75 0.060025 9.5069 0.086811 7.48 0.062709 9.08
70 0.083694 7.14 0.066641 8.6571 0.085045 6.75 0.071091 8.2372 0.093143 6.32 0.077004 7.8373 0.105225 5.92 0.080230 7.4474 0.117143 5.56 0.085617 7.04

13
Notes:1. Duration measured in years since selection.2. Probability of death at duration t represents the average probability of dying during the (t+1) year ofentitlement to disability benefits. Values are exposure-weighted averages of the graduated and blendedprobabilities of death across all ages from tables 1A and 1B.3. Future lifetime at duration t represents the aggregate life expectancy in years for those originally entitled todisability benefits who have not died after t years. Values are exposure-weighted averages of expected futurelifetime across all ages from tables 3A and 3B.
Table 6.—HIV Disabled BeneficiariesAggregate Probability of Death and Expected Future Lifetime,
by Duration(1997-2001 Social Security DI and SSI disability experience)
Duration
Male Female
Probabilityof death
Futurelifetime
Probabilityof death
Futurelifetime
0 0.112445 12.04 0.094868 14.381 0.084512 12.60 0.085712 14.912 0.081327 12.81 0.078481 15.343 0.074517 13.00 0.072532 15.714 0.072186 13.11 0.067305 16.02
5 0.068041 13.19 0.063969 16.256 0.064653 13.21 0.057920 16.407 0.062874 13.18 0.057519 16.428 0.063826 13.10 0.058041 16.409 0.064739 13.02 0.057854 16.35
10 0.060845 12.97 0.049217 16.2511 0.061610 12.84 0.049763 15.9412 0.062328 12.72 0.050449 15.6013 0.063071 12.58 0.051117 15.2714 0.063998 12.43 0.051803 15.05
15 0.064381 12.39 0.052070 14.8716 0.065032 12.29 0.052459 14.8917 0.065496 12.24 0.053277 14.8318 0.065447 12.28 0.053006 14.9919 0.065376 12.32 0.052955 15.09
20 0.065435 12.30 0.052193 15.1421 0.065964 12.20 0.051484 15.1422 0.066981 12.14 0.052420 15.0023 0.069219 11.97 0.053779 15.1024 0.069744 11.83 0.054038 14.90
25 0.071001 11.63 0.054178 14.8426 0.072043 11.43 0.054665 14.6527 0.073566 11.21 0.055154 14.5228 0.074011 10.80 0.049796 13.6729 0.076903 10.63 0.047408 13.78
30 0.078583 10.76 0.048019 12.5531 0.083898 10.42 0.052971 11.8232 0.080229 9.89 0.057703 10.0833 0.076840 9.38 0.055033 10.2934 0.078741 9.11 0.058884 9.86
35 0.079633 8.89 0.062342 9.4536 0.082223 8.71 0.065093 9.04

14
Notes:1. Select age denotes age last birthday at entitlement to disability benefits. Duration measured in years since selection. Attained age calculated as sum of selectage and duration. Results do not include auxiliary beneficiaries payable under the DI program. Probabilities reflect experience of the DI rolls only. Beneficiariesmay be concurrently entitled to DI and SSI benefits, but those entitled to SSI only are not considered.2. The value at duration t represents the probability of death—in a multiple-decrement environment—during the (t+1) year of entitlement for thoseoriginally entitled to disability benefits at select age [x] who have attained age [x]+t.3. Select-and-ultimate table is read across the row for 0-10 years since selection, and down the last (ultimate) column for 10 or more years since selection.4. Results have been graduated using the Whittaker-Henderson Type B two-dimensional method.
Table 7A.—Male HIV Disabled Beneficiaries (DI Program Only)Probability of Death
(1997-2001 Social Security DI disability experience)
Selectage
Duration of disability
Attainedage0 1 2 3 4 5 6 7 8 9
10 ormore
18 0.068271 0.071075 0.046439 0.029412 0.021024 0.029781 0.045714 0.028605 0.028486 0.019149 0.005990 2819 0.072613 0.076703 0.054723 0.042308 0.034184 0.039730 0.049102 0.034919 0.034457 0.024881 0.015978 29
20 0.076358 0.081758 0.062735 0.054713 0.047208 0.049457 0.050678 0.041374 0.040497 0.030322 0.025934 3021 0.080790 0.087020 0.071357 0.065016 0.059188 0.057638 0.050290 0.047546 0.048328 0.035729 0.035443 3122 0.086500 0.092314 0.078834 0.071646 0.068716 0.062943 0.048187 0.051738 0.056902 0.041117 0.043747 3223 0.091888 0.094522 0.085696 0.075760 0.074314 0.062271 0.045300 0.054890 0.064132 0.047813 0.050496 3324 0.095336 0.091201 0.091606 0.076777 0.076608 0.059477 0.044074 0.056275 0.066809 0.054160 0.052817 34
25 0.099734 0.085267 0.094376 0.074363 0.074167 0.059381 0.045207 0.055863 0.065155 0.058851 0.051809 3526 0.103845 0.082785 0.091703 0.072815 0.067820 0.061082 0.050772 0.056444 0.060343 0.059862 0.051919 3627 0.105822 0.082750 0.087872 0.073719 0.065738 0.059783 0.056730 0.056968 0.055292 0.058890 0.050627 3728 0.103697 0.081121 0.083602 0.074351 0.068152 0.060026 0.060117 0.056866 0.050930 0.058976 0.050368 3829 0.101986 0.081013 0.079786 0.072729 0.067760 0.058740 0.061300 0.054836 0.047806 0.059390 0.051937 39
30 0.102714 0.082020 0.079011 0.069217 0.067656 0.058412 0.060068 0.052156 0.046410 0.059923 0.055621 4031 0.107434 0.081299 0.077870 0.066696 0.066711 0.059669 0.056658 0.053413 0.048591 0.058965 0.060522 4132 0.111109 0.080473 0.077164 0.069272 0.064168 0.058583 0.057472 0.053076 0.052962 0.056112 0.063219 4233 0.111433 0.077329 0.076830 0.069016 0.062268 0.061113 0.061106 0.052541 0.061074 0.053178 0.062743 4334 0.110225 0.076132 0.076952 0.067577 0.063516 0.065985 0.061291 0.053912 0.062405 0.052431 0.063519 44
35 0.107466 0.077638 0.074457 0.070840 0.069373 0.068671 0.059251 0.056333 0.060415 0.055772 0.063124 4536 0.105250 0.078832 0.073683 0.071628 0.069991 0.068221 0.060908 0.059259 0.057525 0.061765 0.063685 4637 0.107908 0.079135 0.073020 0.070080 0.072453 0.064897 0.061453 0.060769 0.059021 0.068391 0.066194 4738 0.116426 0.082358 0.073913 0.071808 0.069669 0.061037 0.066221 0.061877 0.059989 0.070215 0.067565 4839 0.120005 0.083720 0.077749 0.071820 0.068704 0.062718 0.069077 0.062188 0.062844 0.068176 0.067852 49
40 0.122672 0.083799 0.080498 0.072782 0.071178 0.064970 0.067165 0.060844 0.067199 0.066506 0.067549 5041 0.118538 0.081781 0.077710 0.072892 0.070706 0.068931 0.065299 0.061667 0.072837 0.068632 0.064954 5142 0.112346 0.079150 0.075264 0.071844 0.071470 0.070957 0.066148 0.061954 0.078047 0.071417 0.062696 5243 0.114542 0.080987 0.075481 0.076007 0.072265 0.071115 0.070863 0.064901 0.079832 0.073563 0.061027 5344 0.119511 0.083911 0.075815 0.078965 0.072659 0.071885 0.072610 0.068076 0.078755 0.076278 0.060028 54
45 0.128916 0.087518 0.077165 0.082293 0.074672 0.070915 0.070921 0.071338 0.076384 0.078061 0.057412 5546 0.137705 0.092144 0.078727 0.081917 0.071291 0.069102 0.068912 0.075204 0.073441 0.077849 0.055952 5647 0.144601 0.098745 0.077234 0.077542 0.068164 0.066059 0.066926 0.075633 0.072650 0.074871 0.056191 5748 0.145673 0.098522 0.075689 0.072783 0.069805 0.065749 0.067089 0.075351 0.070579 0.071853 0.057672 5849 0.145932 0.097284 0.074819 0.069509 0.072749 0.066217 0.068520 0.075341 0.067776 0.072004 0.059171 59
50 0.143177 0.093773 0.077319 0.072269 0.075188 0.068065 0.075386 0.077963 0.065532 0.074391 0.061165 6051 0.142787 0.092109 0.079363 0.079858 0.077515 0.073270 0.083526 0.080815 0.065386 0.076604 0.062912 6152 0.137683 0.090771 0.084425 0.083864 0.078278 0.080126 0.090433 0.083472 0.067406 0.077628 0.063657 6253 0.134517 0.087967 0.090606 0.087073 0.081050 0.086846 0.095260 0.085530 0.072182 0.079629 0.065987 6354 0.130404 0.087929 0.094037 0.086553 0.084496 0.091527 0.095260 0.086324 0.077373 0.082140 0.069607 64
55 0.127343 0.088175 0.094007 0.085587 0.087801 0.093550 0.095260 0.087634 0.080850 0.083294 0.073900 6556 0.126627 0.090142 0.096386 0.081968 0.088668 0.094270 0.093634 0.087709 0.083861 0.083704 0.079536 6657 0.129975 0.091870 0.098831 0.080933 0.091015 0.090825 0.090835 0.088015 0.086304 0.084658 0.084836 6758 0.135055 0.092981 0.098627 0.079559 0.091449 0.086795 0.090031 0.087518 0.087786 0.085975 0.088400 6859 0.140298 0.096991 0.097709 0.082699 0.090561 0.083310 0.091755 0.086217 0.087477 0.086790 0.090455 69
60 0.147956 0.104275 0.098053 0.090995 0.089676 0.083715 0.095311 0.085510 0.085321 0.086723 0.092485 7061 0.160613 0.113792 0.101031 0.101483 0.090884 0.087959 0.096860 0.084778 0.082473 0.086381 0.096529 7162 0.171302 0.124292 0.108780 0.109707 0.095864 0.093188 0.097541 0.083337 0.079066 0.085544 0.102877 7263 0.182391 0.135917 0.119078 0.116821 0.101385 0.098016 0.097136 0.081609 0.075900 0.084410 0.110060 7364 0.194901 0.149854 0.128624 0.124210 0.106701 0.102466 0.095654 0.079406 0.072407 0.083387 0.118244 74
q x[ ] t+
15
Notes:1. Select age denotes age last birthday at entitlement to disability benefits. Duration measured in years since selection. Attained age calculated as sum of selectage and duration. Results do not include auxiliary beneficiaries payable under the DI program. Probabilities reflect experience of the DI rolls only. Beneficiariesmay be concurrently entitled to DI and SSI benefits, but those entitled to SSI only are not considered.2. The value at duration t represents the probability of death—in a multiple-decrement environment—during the (t+1) year of entitlement for thoseoriginally entitled to disability benefits at select age [x] who have attained age [x]+t.3. Select-and-ultimate table is read across the row for 0-10 years since selection, and down the last (ultimate) column for 10 or more years since selection.4. Results have been graduated using the Whittaker-Henderson Type B two-dimensional method.
Table 7B.—Female HIV Disabled Beneficiaries (DI Program Only)Probability of Death
(1997-2001 Social Security DI disability experience)
Selectage
Duration of disability
Attainedage0 1 2 3 4 5 6 7 8 9
10 ormore
18 0.068820 0.107034 0.120594 0.115396 0.089705 0.051520 0.022305 0.016877 0.031300 0.042220 0.043192 2819 0.073888 0.104300 0.117035 0.108615 0.087115 0.054024 0.025793 0.018461 0.033848 0.041903 0.040511 29
20 0.078742 0.100573 0.112637 0.101986 0.083942 0.056229 0.029305 0.020151 0.036042 0.041168 0.037764 3021 0.084531 0.095467 0.106115 0.095089 0.081348 0.057313 0.032779 0.022269 0.037078 0.039267 0.034677 3122 0.091998 0.090693 0.098794 0.087842 0.078998 0.057752 0.036366 0.025002 0.036882 0.037667 0.032520 3223 0.098870 0.087715 0.090645 0.080512 0.074476 0.057140 0.039775 0.028184 0.036592 0.036794 0.031820 3324 0.104976 0.087978 0.084087 0.072504 0.067922 0.056493 0.044245 0.031728 0.036392 0.037203 0.033247 34
25 0.110985 0.093041 0.083574 0.064928 0.061811 0.055906 0.049258 0.035902 0.036321 0.039011 0.035958 3526 0.115924 0.100127 0.086403 0.060116 0.054887 0.055780 0.052532 0.039746 0.036992 0.041804 0.038044 3627 0.118640 0.104697 0.088278 0.059270 0.049798 0.058205 0.054408 0.043864 0.039167 0.043900 0.038834 3728 0.119398 0.106605 0.086497 0.061059 0.045978 0.061743 0.054221 0.047392 0.042623 0.045162 0.039722 3829 0.118222 0.106528 0.084599 0.062889 0.043470 0.061329 0.051393 0.049915 0.045720 0.047713 0.040297 39
30 0.115270 0.102682 0.083558 0.062804 0.045631 0.058627 0.048103 0.050286 0.047950 0.051289 0.038780 4031 0.112118 0.096646 0.082462 0.062010 0.050671 0.056054 0.045594 0.048890 0.049557 0.054043 0.034018 4132 0.109548 0.089918 0.082355 0.061706 0.055282 0.053713 0.044472 0.046948 0.051812 0.053974 0.029865 4233 0.109739 0.085884 0.081867 0.061484 0.057530 0.052125 0.045419 0.045824 0.055056 0.052689 0.028608 4334 0.109139 0.084174 0.079815 0.061583 0.056684 0.052446 0.048558 0.045796 0.058341 0.049613 0.028188 44
35 0.103676 0.083553 0.077268 0.062778 0.056766 0.054775 0.053598 0.047681 0.059970 0.046825 0.029073 4536 0.100576 0.080217 0.074543 0.064679 0.059507 0.057446 0.056165 0.050719 0.059897 0.046267 0.031635 4637 0.100081 0.079529 0.073548 0.067941 0.064689 0.061317 0.057294 0.051583 0.059465 0.046146 0.033706 4738 0.099652 0.082367 0.074461 0.071335 0.068971 0.065093 0.057004 0.051423 0.058710 0.043935 0.034667 4839 0.099752 0.086759 0.074334 0.072375 0.070766 0.066561 0.055398 0.052212 0.057026 0.041873 0.034854 49
40 0.101624 0.090156 0.071364 0.070541 0.070287 0.063665 0.054408 0.052373 0.054547 0.041760 0.034849 5041 0.104728 0.090821 0.067480 0.066843 0.068601 0.058683 0.054529 0.053568 0.052069 0.043611 0.034954 5142 0.110179 0.088468 0.062845 0.062807 0.066061 0.056986 0.056070 0.055845 0.049689 0.047035 0.034329 5243 0.112708 0.085576 0.061073 0.059285 0.066133 0.057391 0.057742 0.055737 0.048533 0.051350 0.032298 5344 0.113599 0.085366 0.063020 0.058274 0.068668 0.060746 0.058591 0.055141 0.049776 0.054596 0.030624 54
45 0.112129 0.085671 0.066075 0.057618 0.070023 0.064318 0.059538 0.054918 0.052862 0.055876 0.029267 5546 0.111026 0.087934 0.071538 0.055583 0.067114 0.064880 0.057119 0.054243 0.056498 0.056960 0.028804 5647 0.112039 0.090448 0.075242 0.053438 0.063946 0.062627 0.052181 0.052575 0.060227 0.058317 0.028847 5748 0.114402 0.092894 0.075840 0.053318 0.061549 0.058617 0.047743 0.051073 0.062989 0.059731 0.029021 5849 0.118098 0.092780 0.075127 0.053709 0.060473 0.053755 0.044718 0.050875 0.065145 0.061859 0.029406 59
50 0.120558 0.091501 0.071205 0.053351 0.059577 0.048706 0.044192 0.051816 0.067498 0.064309 0.031117 6051 0.120875 0.090637 0.066690 0.054131 0.058472 0.046285 0.046338 0.054124 0.069836 0.067047 0.033193 6152 0.117804 0.089063 0.064464 0.056979 0.058938 0.048035 0.051100 0.057226 0.071931 0.068323 0.034366 6253 0.111171 0.087590 0.066420 0.061575 0.061094 0.053330 0.058134 0.060902 0.072562 0.066129 0.037577 6354 0.104896 0.084301 0.071634 0.066921 0.065085 0.061023 0.064687 0.064592 0.071788 0.062874 0.039083 64
55 0.097611 0.081516 0.076248 0.071502 0.070621 0.069484 0.068671 0.067693 0.070164 0.059619 0.041693 6556 0.092511 0.079022 0.077399 0.074830 0.076374 0.077336 0.070835 0.069836 0.068012 0.057231 0.043240 6657 0.091052 0.077729 0.075574 0.074700 0.082037 0.083444 0.071854 0.070447 0.065604 0.055796 0.046266 6758 0.090294 0.074640 0.072105 0.072614 0.086047 0.086903 0.071769 0.068688 0.062979 0.054262 0.048983 6859 0.094415 0.070566 0.068738 0.069138 0.086674 0.087161 0.070306 0.065281 0.060246 0.052761 0.051145 69
60 0.093709 0.065270 0.065319 0.065621 0.084543 0.083751 0.067049 0.060884 0.056921 0.051519 0.052765 7061 0.109528 0.065238 0.061384 0.063262 0.079945 0.077560 0.062728 0.056209 0.054688 0.056909 0.056387 7162 0.114977 0.070970 0.057983 0.062082 0.074284 0.070639 0.057504 0.055330 0.059044 0.062028 0.060999 7263 0.137784 0.084119 0.065740 0.061945 0.067917 0.063862 0.061103 0.066324 0.063749 0.066573 0.062977 7364 0.163086 0.092248 0.074113 0.061630 0.061527 0.065871 0.070327 0.069503 0.066788 0.077493 0.067271 74
q x[ ] t+

16
Appendix AHIV Experience 1992-96
Mortality 1992-1996This appendix presents HIV mortality experience for the DIand SSI rolls over the period 1992-96. CDC tracking showsthat AIDS incidence in the general population peaked in1993, due in part to the expansion of the AIDS surveillancecase defintion.12 The estimated number of deaths among per-sons with AIDS increased steadily through 1994, and thenbegan to decline. Since the use of HAART became wide-spread during 1996, trends in AIDS incidence have becomeless reflective of underlying trends in HIV transmission.Beginning in 1996, a substantial increase in AIDS prevalencein the general population occured as a result of declines inAIDS deaths. AIDS incidence and deaths leveled off whileAIDS prevalence continued to increase from 1998 through theperiod covered by the June 2001 CDC report.
The tables that follow are similar to those in the main sectionof this study, but show mortality experience for the preceding5-year period. Mortality for DI and SSI beneficiaries withHIV was substantially higher during 1992-96 than during1997-2001. As mentioned previously, much of the differenceappears to coincide with the advent of HAART in 1996, aswell as increased use of prophylactic drugs to prevent second-ary AIDS-opportunistic illnesses. As discussed in the mainsection, differences in the composition of the rolls may alsohave played a part in the mortality improvements seen in thelater period.
These factors had a significant impact on HIV disability withrespect to new entitlements and deaths, which in turn had asignificant impact on exposure of the DI and SSI rolls. Overthe period 1992-96, there were roughly 143,000 new HIVbeneficiaries, compared to 59,000 over the period1997-2001.13 In addition, during 1992-96, approximately145,700 HIV beneficiaries were terminated from the DI andSSI rolls as a result of death, compared to 58,400 during1997-2001. Although the rolls experienced a significantdecline in entitlements, the number of life-years of exposureactually increased by 18 percent between the two 5-year peri-ods. This is due to significant mortality improvements as ben-eficiaries remain on the rolls for a longer period of time.
The improvements in mortality between the two observationperiods is substantial for both male and female beneficiaries.Male deaths decreased by 64 percent, while exposureincreased by 12 percent. Female deaths decreased by 35 per-cent, while exposure increased by 38 percent. The sizable
increase in exposure among females is reflective of patternsseen in the overall AIDS population monitored by CDC.According to CDC reports, women accounted for an increas-ing proportion of persons living with AIDS from 1992through 199914. In 1999, 25 percent of adults and adolescentsreported as having AIDS were women. Furthermore, AIDS asa leading cause of death among women aged 25-44 haddropped from fourth in 1993 to fifth in 1999.15 As discussed,mortality improvements increase the exposure of the disabil-ity rolls by lengthening the stay of beneficiaries.
Differences in AIDS incidence and death rates between malesand females may be due in part to different methods of trans-mission, timeliness of diagnosis, and access to treatment.CDC reports indicate that about 25 percent of women withAIDS are infected through injection drug use while 75 percentare infected through heterosexual contact16. Drug use is also afactor in many of the cases attributed to heterosexual contact.Many women may have been unaware that they were at riskfor HIV infection and may have remained undiagnosed untilthe onset of AIDS or until a perinatally infected child becameill.
Tables A.1A and A.1B show select-and-ultimate probabilitiesof death for male and female HIV disabled beneficiaries, byselect age and duration since selection. Data reflect the com-bined actual experience of the DI and SSI rolls fromJanuary 1, 1992 through December 31, 1996. The methodsused in table construction and graduation are the same as thatused for 1997-2001. See appendix B for details.
For any given select age, the highest probability of deathoccurs within the first several durations. For males, at mostselect ages, mortality levels off around the third duration, thengenerally decreases thereafter; mortality may trend upward atthe extreme older attained ages. For females, death probabili-ties may level off around the third duration and then continueto decrease gradually before slightly increasing when the ben-eficiaries reach their late fifties or early sixties. For thoseentering the rolls at higher ages, death probabilities do notshow this slight increase until the later durations. As men-tioned previously, trends in the data are not always predictablesince it cannot be known with certainty how long individualshave been infected.
12 CDC Morbidity and Mortality Weekly Report (June 2001/Vol.50/No.21).13 Totals include beneficiaries concurrently entitled to DI and SSI benefits, but do not include beneficiaries entitled to SSI only.
14 CDC Factsheet: HIV/AIDS Among US Women: Minority and Young Women at Continuing Risk (May 2002).15 CDC Morbidity and Mortality Weekly Report (February 1995/Vol.44/No.5).16 CDC Factsheet: HIV/AIDS Update (contains data through 2000).

17
Tables A.2A and A.2B are survival tables showing the pro-gression of a series of cohorts—each for a given select age—reflecting the probabilities of death shown in tables A.1A andA.1B.
Tables A.3A and A.3B show the expected future lifetime ofmale and female HIV disabled beneficiaries. Females displaya higher future lifetime than males. Expected lifetimes forfemales may be nearly twice as long at early durations, dimin-ishing to roughly 25-35 percent longer at later durations. Aswith general disability mortality, HIV beneficiaries often
exhibit a shorter life expectancy in the first several years ofentitlement than in later durations. This is due to higher mor-tality in those years.
Tables A.4 and A.5 show the aggregate probability of deathand expected future lifetime, by select and attained ages.Table A.6 presents aggregated results based on duration.
Tables A.7A and A.7B show select-and-ultimate probabilitiesof death for HIV disabled workers by select age and duration.These tables are similar to tables A.1A and A.1B, with theexception that only the experience of the DI rolls is reflected.

18
Notes:1. Select age denotes age last birthday at entitlement to disability benefits. Duration measured in years since selection. Attained age calculated as sum of selectage and duration. Results do not include auxiliary beneficiaries payable under the DI program.2. The value at duration t represents the probability of death—in a multiple-decrement environment—during the (t+1) year of entitlement for thoseoriginally entitled to disability benefits at select age [x] who have attained age [x]+t.3. Select-and-ultimate table is read across the row for 0-10 years since selection, and down the last (ultimate) column for 10 or more years since selection.4. Results have been graduated using the Whittaker-Henderson Type B two-dimensional method.
Table A.1A.—Male HIV Disabled BeneficiariesProbability of Death
(1992-96 Social Security DI and SSI disability experience)
Selectage
Duration of disability
Attainedage0 1 2 3 4 5 6 7 8 9
10 ormore
18 0.076854 0.087708 0.089206 0.061027 0.055461 0.087573 0.070788 0.080378 0.065548 0.059547 0.026175 2819 0.088874 0.111011 0.105061 0.079145 0.067732 0.090831 0.076339 0.079188 0.070155 0.058508 0.035386 29
20 0.104281 0.133725 0.120939 0.095781 0.077351 0.092170 0.079426 0.078617 0.073486 0.057869 0.044016 3021 0.127002 0.156426 0.138630 0.112881 0.090422 0.089519 0.080527 0.078631 0.075761 0.060260 0.051570 3122 0.149153 0.179238 0.164257 0.129726 0.101194 0.088661 0.078652 0.078970 0.079870 0.064220 0.056535 3223 0.169807 0.203900 0.187145 0.146936 0.112418 0.095086 0.081696 0.091566 0.085960 0.061022 0.059417 3324 0.191459 0.222371 0.208194 0.161924 0.124441 0.107506 0.088324 0.099555 0.088669 0.067597 0.062410 34
25 0.211794 0.237443 0.223288 0.174746 0.135778 0.116840 0.095417 0.102310 0.085295 0.073380 0.064590 3526 0.223894 0.248470 0.231472 0.186327 0.141372 0.124218 0.105238 0.102703 0.084406 0.079017 0.066222 3627 0.234227 0.253022 0.240856 0.192747 0.147224 0.129855 0.114649 0.102039 0.092021 0.082970 0.068403 3728 0.247396 0.266549 0.241721 0.196555 0.153409 0.134009 0.118944 0.103979 0.096997 0.084305 0.070790 3829 0.255681 0.272477 0.246727 0.199476 0.158608 0.140066 0.115353 0.107825 0.101039 0.084618 0.069896 39
30 0.262582 0.273916 0.245352 0.202317 0.162491 0.143509 0.112252 0.113671 0.102428 0.084143 0.071026 4031 0.262492 0.273752 0.249462 0.203200 0.170781 0.144953 0.114585 0.117337 0.101961 0.085396 0.077454 4132 0.272588 0.277835 0.252508 0.208816 0.174610 0.143782 0.121687 0.121073 0.099009 0.087663 0.079225 4233 0.277280 0.277223 0.249079 0.209383 0.174784 0.145165 0.129459 0.123251 0.096419 0.089548 0.078623 4334 0.278042 0.273672 0.250438 0.206304 0.179656 0.143489 0.132242 0.123669 0.095400 0.089701 0.080310 44
35 0.276746 0.270405 0.251872 0.204776 0.178754 0.143763 0.127044 0.123753 0.096958 0.091050 0.084384 4536 0.279568 0.267104 0.245948 0.201826 0.176243 0.149285 0.125747 0.118037 0.097954 0.093478 0.087532 4637 0.284982 0.272810 0.242287 0.204325 0.172484 0.156178 0.125975 0.110450 0.095949 0.095096 0.088550 4738 0.290236 0.274323 0.242698 0.203122 0.166164 0.157617 0.127009 0.104626 0.094064 0.095632 0.089440 4839 0.290438 0.276575 0.238931 0.203952 0.163713 0.151476 0.131751 0.104720 0.093154 0.094968 0.090336 49
40 0.298357 0.273055 0.240921 0.200075 0.164327 0.154070 0.139893 0.107317 0.093673 0.094886 0.089957 5041 0.298605 0.275193 0.243805 0.195507 0.168595 0.157377 0.144743 0.112590 0.097034 0.096361 0.092158 5142 0.299178 0.283952 0.244801 0.196684 0.165885 0.160740 0.145978 0.118866 0.101779 0.098606 0.096097 5243 0.305512 0.285130 0.246607 0.201174 0.165428 0.160052 0.148671 0.123840 0.104544 0.103736 0.093240 5344 0.310086 0.282741 0.251835 0.206170 0.170031 0.158247 0.150182 0.127483 0.105013 0.108852 0.097761 54
45 0.312000 0.285120 0.256819 0.205690 0.170441 0.157813 0.147055 0.128224 0.103943 0.112810 0.101354 5546 0.319068 0.286988 0.263322 0.207687 0.169840 0.155792 0.142093 0.126635 0.103524 0.112463 0.103919 5647 0.325155 0.289302 0.260181 0.214868 0.169018 0.156155 0.137459 0.122303 0.103385 0.107591 0.104140 5748 0.326830 0.293370 0.261429 0.219118 0.166567 0.156682 0.131716 0.117504 0.101720 0.103935 0.102500 5849 0.333441 0.297094 0.265384 0.221851 0.167153 0.155407 0.126173 0.113150 0.102387 0.105901 0.100921 59
50 0.329299 0.302086 0.270121 0.225542 0.170018 0.153895 0.122926 0.111385 0.103936 0.112406 0.097517 6051 0.331425 0.306147 0.271023 0.228113 0.174460 0.153080 0.122289 0.112641 0.107836 0.119033 0.097252 6152 0.344114 0.308002 0.267129 0.223546 0.176198 0.154484 0.131541 0.117515 0.110114 0.121675 0.098073 6253 0.354920 0.308057 0.264875 0.216804 0.175384 0.155285 0.140352 0.122783 0.112347 0.123781 0.102190 6354 0.362036 0.300859 0.260001 0.213344 0.175294 0.154543 0.143415 0.128310 0.113044 0.123906 0.106274 64
55 0.361238 0.291687 0.256044 0.213911 0.179922 0.154113 0.147705 0.132968 0.112206 0.121308 0.109171 6556 0.360717 0.294804 0.256608 0.220779 0.188223 0.152456 0.149058 0.132703 0.113170 0.116670 0.111589 6657 0.353863 0.307232 0.260317 0.226115 0.196934 0.152235 0.147468 0.131111 0.114915 0.113411 0.111121 6758 0.353248 0.318283 0.262259 0.226929 0.202298 0.154343 0.147794 0.128216 0.115781 0.110728 0.109318 6859 0.353820 0.323809 0.266328 0.228780 0.204966 0.157499 0.149973 0.124583 0.114660 0.108632 0.108615 69
60 0.349970 0.320039 0.269343 0.230568 0.201874 0.161626 0.154043 0.130011 0.128334 0.123218 0.110874 7061 0.354594 0.316883 0.274645 0.227097 0.195777 0.165443 0.154521 0.127149 0.123095 0.121773 0.117155 7162 0.368210 0.316184 0.276578 0.222405 0.189674 0.168565 0.152420 0.124224 0.115838 0.118986 0.127465 7263 0.391356 0.313595 0.276680 0.220313 0.186713 0.170875 0.147479 0.121571 0.108120 0.115752 0.139658 7364 0.419454 0.309333 0.277131 0.221166 0.186149 0.172704 0.141317 0.117650 0.099768 0.112677 0.152286 74
q x[ ] t+

19
Notes:1. Select age denotes age last birthday at entitlement to disability benefits. Duration measured in years since selection. Attained age calculated as sum of selectage and duration. Results do not include auxiliary beneficiaries payable under the DI program.2. The value at duration t represents the probability of death—in a multiple-decrement environment—during the (t+1) year of entitlement for thoseoriginally entitled to disability benefits at select age [x] who have attained age [x]+t.3. Select-and-ultimate table is read across the row for 0-10 years since selection, and down the last (ultimate) column for 10 or more years since selection.4. Results have been graduated using the Whittaker-Henderson Type B two-dimensional method.
Table A.1B.—Female HIV Disabled BeneficiariesProbability of Death
(1992-96 Social Security DI and SSI disability experience)
Selectage
Duration of disability
Attainedage0 1 2 3 4 5 6 7 8 9
10 ormore
18 0.082751 0.090393 0.117788 0.098218 0.065597 0.065452 0.045193 0.034998 0.018385 0.026223 0.046784 2819 0.089243 0.105132 0.118067 0.092748 0.066672 0.066696 0.052358 0.036714 0.027481 0.035304 0.050400 29
20 0.098294 0.118578 0.118043 0.097977 0.074024 0.067802 0.058924 0.039017 0.035825 0.043411 0.055318 3021 0.111335 0.131341 0.125088 0.103524 0.083800 0.074263 0.065104 0.042747 0.041727 0.048743 0.059317 3122 0.123013 0.140365 0.132720 0.109097 0.093601 0.083003 0.070635 0.048154 0.047655 0.053114 0.060897 3223 0.126575 0.148496 0.141063 0.115915 0.098078 0.088565 0.076078 0.054844 0.052638 0.055654 0.062307 3324 0.128312 0.157740 0.149383 0.121854 0.100595 0.092605 0.081094 0.061663 0.055808 0.056273 0.065985 34
25 0.132162 0.162174 0.156305 0.126988 0.103041 0.096996 0.084308 0.067053 0.064554 0.057641 0.069859 3526 0.137090 0.165702 0.160990 0.133272 0.107301 0.102375 0.085222 0.069111 0.065099 0.060624 0.070921 3627 0.145245 0.170511 0.164451 0.136959 0.113191 0.108179 0.083463 0.069932 0.065549 0.060208 0.070564 3728 0.151915 0.171312 0.162917 0.140622 0.119096 0.112411 0.084716 0.070034 0.065094 0.059163 0.066912 3829 0.152792 0.175627 0.163873 0.140549 0.124344 0.114882 0.088502 0.071043 0.065400 0.063164 0.062867 39
30 0.154899 0.181945 0.164005 0.142868 0.129427 0.113452 0.092949 0.071484 0.065939 0.072689 0.060805 4031 0.157998 0.184538 0.163815 0.140379 0.130037 0.110838 0.097701 0.071726 0.067243 0.080283 0.058985 4132 0.164967 0.190119 0.164138 0.138620 0.127601 0.109060 0.099037 0.071392 0.070050 0.082036 0.059893 4233 0.168997 0.191401 0.166015 0.138382 0.122873 0.108207 0.097777 0.069680 0.074464 0.083335 0.063225 4334 0.168555 0.190670 0.171529 0.141274 0.119465 0.107679 0.095336 0.070019 0.078004 0.083155 0.065962 44
35 0.168210 0.189396 0.173929 0.146263 0.120162 0.108654 0.090670 0.072776 0.080881 0.080948 0.072005 4536 0.173444 0.190212 0.171327 0.147692 0.127014 0.111075 0.088184 0.079991 0.079968 0.080033 0.079678 4637 0.176340 0.191209 0.167844 0.151378 0.132665 0.112277 0.087326 0.081038 0.075373 0.079628 0.086972 4738 0.175712 0.193409 0.166625 0.151050 0.132877 0.110974 0.088334 0.076441 0.074649 0.075244 0.090220 4839 0.175740 0.193738 0.166777 0.150547 0.130857 0.105290 0.089679 0.074441 0.078786 0.071129 0.086236 49
40 0.176873 0.188901 0.168144 0.148431 0.125001 0.099432 0.089324 0.075778 0.082649 0.068878 0.077532 5041 0.185870 0.187432 0.170996 0.147632 0.120090 0.097194 0.086040 0.081789 0.085024 0.070429 0.073062 5142 0.192439 0.196984 0.175562 0.151154 0.116876 0.096593 0.088138 0.088114 0.083648 0.074776 0.068018 5243 0.195503 0.204968 0.178768 0.153929 0.114936 0.093009 0.089280 0.090186 0.080473 0.079503 0.068522 5344 0.204370 0.204143 0.179737 0.156918 0.113734 0.089748 0.090218 0.090629 0.080219 0.082158 0.068022 54
45 0.205202 0.198512 0.181910 0.159289 0.114914 0.087391 0.094454 0.089674 0.083071 0.083514 0.069530 5546 0.205582 0.196627 0.182222 0.159655 0.116075 0.088879 0.094894 0.087614 0.087515 0.085248 0.071537 5647 0.202576 0.193398 0.179979 0.156761 0.118945 0.092890 0.088118 0.083936 0.090681 0.085598 0.071753 5748 0.198225 0.192478 0.174098 0.151553 0.122715 0.097134 0.083270 0.078883 0.092028 0.084504 0.068220 5849 0.195191 0.192046 0.169453 0.144998 0.123607 0.099625 0.083251 0.075763 0.092708 0.084566 0.064416 59
50 0.197542 0.192152 0.165844 0.138417 0.123535 0.098844 0.081780 0.073229 0.093065 0.085928 0.059405 6051 0.207099 0.193087 0.163666 0.133214 0.124143 0.096480 0.079281 0.073821 0.094253 0.088800 0.063368 6152 0.222774 0.194415 0.162494 0.129738 0.123786 0.094349 0.084715 0.077260 0.095661 0.091889 0.065608 6253 0.237979 0.195479 0.161793 0.128942 0.118795 0.090668 0.092171 0.081818 0.095410 0.091971 0.071738 6354 0.250212 0.196691 0.162003 0.128235 0.110664 0.096921 0.097401 0.084806 0.093243 0.089819 0.074613 64
55 0.255247 0.197078 0.162178 0.126770 0.100734 0.101139 0.097856 0.086073 0.089900 0.086839 0.074290 6556 0.250240 0.198349 0.161736 0.125276 0.092908 0.102283 0.094725 0.086271 0.085671 0.082684 0.077046 6657 0.241707 0.201069 0.159419 0.123671 0.089008 0.102783 0.089910 0.085546 0.081999 0.078155 0.082438 6758 0.232849 0.200560 0.157506 0.122520 0.088587 0.102585 0.084629 0.083476 0.078903 0.073373 0.087279 6859 0.226566 0.198295 0.157165 0.122872 0.090956 0.099749 0.079169 0.080735 0.075924 0.068873 0.091130 69
60 0.224293 0.194705 0.157559 0.124162 0.094045 0.092171 0.073584 0.076556 0.072278 0.070407 0.094017 7061 0.230104 0.192230 0.156676 0.125955 0.097062 0.081513 0.069730 0.070811 0.074574 0.077603 0.100472 7162 0.241761 0.191976 0.155476 0.129517 0.099037 0.075218 0.075583 0.082784 0.081088 0.084584 0.108690 7263 0.258972 0.195656 0.153301 0.134114 0.100313 0.079535 0.081329 0.094976 0.095894 0.090782 0.112214 7364 0.278613 0.201569 0.152154 0.138303 0.101768 0.083767 0.087253 0.106816 0.110500 0.105672 0.119864 74
q x[ ] t+

20
Notes:1. Select age denotes age last birthday at entitlement to disability benefits. Duration measured in years since selection. Attained age calculated as sum of selectage and duration. Results do not include auxiliary beneficiaries payable under the DI program.2. The value at duration 0 represents the assumed number of lives originally entitled to disability benefits at select age [x]; the value at durationt > 0 represents the number of lives remaining from the original who have attained age [x]+t. Lives are decremented using probabilities from table A.1A.3. Select-and-ultimate table is read across the row for 0-10 years since selection, and down the last (ultimate) column for 10 or more years since selection.
Table A.2A.—Male HIV Disabled BeneficiariesSurvival Table
(1992-96 Social Security DI and SSI disability experience)
Selectage
Duration of disability Attainedage0 1 2 3 4 5 6 7 8 9 10 or more
18 100,000 92,315 84,218 76,705 72,024 68,029 62,072 57,678 53,042 49,565 46,614 2819 107,756 98,179 87,280 78,110 71,928 67,056 60,965 56,311 51,852 48,214 45,394 29
20 114,481 102,543 88,830 78,087 70,608 65,146 59,141 54,444 50,164 46,478 43,788 3021 122,075 106,571 89,901 77,438 68,697 62,485 56,891 52,310 48,197 44,546 41,861 3122 130,601 111,121 91,204 76,223 66,335 59,622 54,336 50,062 46,109 42,426 39,702 3223 142,127 117,993 93,934 76,355 65,136 57,814 52,317 48,043 43,644 39,892 37,457 3324 154,910 125,251 97,399 77,121 64,633 56,590 50,506 46,045 41,461 37,785 35,231 34
25 163,212 128,645 98,099 76,195 62,880 54,342 47,993 43,414 38,972 35,648 33,032 3526 166,400 129,144 97,056 74,590 60,692 52,112 45,639 40,836 36,642 33,549 30,898 3627 167,562 128,314 95,848 72,762 58,737 50,090 43,586 38,589 34,651 31,462 28,852 3728 167,003 125,687 92,185 69,902 56,162 47,546 41,174 36,277 32,505 29,352 26,878 3829 162,759 121,145 88,136 66,390 53,147 44,717 38,454 34,018 30,350 27,283 24,975 39
30 155,332 114,545 83,169 62,763 50,065 41,930 35,913 31,882 28,258 25,364 23,229 4031 148,023 109,168 79,283 59,505 47,414 39,317 33,618 29,766 26,273 23,594 21,579 4132 142,891 103,941 75,063 56,109 44,393 36,642 31,374 27,556 24,220 21,822 19,908 4233 133,448 96,446 69,709 52,346 41,386 34,152 29,194 25,415 22,283 20,134 18,331 4334 123,051 88,838 64,526 48,366 38,388 31,491 26,972 23,405 20,511 18,554 16,890 44
35 112,076 81,059 59,140 44,244 35,184 28,895 24,741 21,598 18,925 17,090 15,534 4536 101,293 72,975 53,483 40,329 32,190 26,517 22,558 19,721 17,393 15,689 14,223 4637 93,215 66,650 48,467 36,724 29,220 24,180 20,404 17,834 15,864 14,342 12,978 4738 84,602 60,047 43,575 32,999 26,296 21,927 18,471 16,125 14,438 13,080 11,829 4839 76,505 54,285 39,271 29,888 23,792 19,897 16,883 14,659 13,124 11,901 10,771 49
40 71,052 49,853 36,240 27,509 22,005 18,389 15,556 13,380 11,944 10,825 9,798 5041 66,458 46,613 33,785 25,548 20,553 17,088 14,399 12,315 10,928 9,868 8,917 5142 62,343 43,691 31,285 23,626 18,979 15,831 13,286 11,347 9,998 8,980 8,095 5243 58,357 40,528 28,972 21,827 17,436 14,552 12,223 10,406 9,117 8,164 7,317 5344 54,643 37,699 27,040 20,230 16,059 13,328 11,219 9,534 8,319 7,445 6,635 54
45 49,923 34,347 24,554 18,248 14,495 12,024 10,126 8,637 7,530 6,747 5,986 5546 45,431 30,935 22,057 16,249 12,874 10,687 9,022 7,740 6,760 6,060 5,379 5647 40,732 27,488 19,536 14,453 11,348 9,430 7,957 6,863 6,024 5,401 4,820 5748 36,308 24,441 17,271 12,756 9,961 8,302 7,001 6,079 5,365 4,819 4,318 5849 33,071 22,044 15,495 11,383 8,858 7,377 6,231 5,445 4,829 4,335 3,875 59
50 30,248 20,287 14,159 10,334 8,003 6,642 5,620 4,929 4,380 3,925 3,484 6051 28,142 18,815 13,055 9,517 7,346 6,064 5,136 4,508 4,000 3,569 3,144 6152 26,336 17,273 11,953 8,760 6,802 5,604 4,738 4,115 3,631 3,231 2,838 6253 24,383 15,729 10,884 8,001 6,266 5,167 4,365 3,752 3,291 2,921 2,560 6354 21,877 13,957 9,758 7,221 5,680 4,684 3,960 3,392 2,957 2,623 2,298 64
55 19,412 12,400 8,783 6,534 5,136 4,212 3,563 3,037 2,633 2,338 2,054 6556 17,617 11,262 7,942 5,904 4,601 3,735 3,166 2,694 2,336 2,072 1,830 6657 16,035 10,361 7,178 5,309 4,109 3,300 2,798 2,385 2,072 1,834 1,626 6758 14,582 9,431 6,429 4,743 3,667 2,925 2,474 2,108 1,838 1,625 1,445 6859 13,234 8,552 5,783 4,243 3,272 2,601 2,191 1,862 1,630 1,443 1,287 69
60 12,264 7,972 5,421 3,961 3,048 2,433 2,040 1,726 1,502 1,309 1,147 7061 10,818 6,982 4,770 3,460 2,674 2,150 1,794 1,517 1,324 1,161 1,020 7162 9,517 6,013 4,112 2,975 2,313 1,874 1,558 1,321 1,157 1,023 901 7263 8,377 5,099 3,500 2,532 1,974 1,605 1,331 1,135 997 889 786 7364 7,349 4,266 2,946 2,130 1,659 1,350 1,117 959 846 762 676 74
l x[ ] l x[ ] t+l x[ ]

21
Notes:1. Select age denotes age last birthday at entitlement to disability benefits. Duration measured in years since selection. Attained age calculated as sum of selectage and duration. Results do not include auxiliary beneficiaries payable under the DI program.2. The value at duration 0 represents the assumed number of lives originally entitled to disability benefits at select age [x]; the value at durationt > 0 represents the number of lives remaining from the original who have attained age [x]+t. Lives are decremented using probabilities from table A.1B.3. Select-and-ultimate table is read across the row for 0-10 years since selection, and down the last (ultimate) column for 10 or more years since selection.
Table A.2B.—Female HIV Disabled BeneficiariesSurvival Table
(1992-96 Social Security DI and SSI disability experience)
Selectage
Duration of disability
Attainedage0 1 2 3 4 5 6 7 8 9
10 ormore
18 100,000 91,725 83,434 73,606 66,377 62,023 57,963 55,343 53,406 52,424 51,049 2819 100,026 91,099 81,522 71,897 65,229 60,880 56,820 53,845 51,868 50,443 48,661 29
20 101,502 91,525 80,672 71,149 64,178 59,427 55,398 52,134 50,100 48,305 46,208 3021 104,198 92,597 80,435 70,374 63,089 57,802 53,509 50,025 47,887 45,889 43,652 3122 106,322 93,243 80,155 69,517 61,933 56,136 51,477 47,841 45,537 43,367 41,063 3223 106,319 92,862 79,072 67,918 60,045 54,156 49,360 45,605 43,104 40,835 38,562 3324 105,153 91,661 77,202 65,669 57,667 51,866 47,063 43,246 40,579 38,314 36,159 34
25 103,387 89,723 75,172 63,422 55,368 49,663 44,846 41,065 38,311 35,838 33,773 3526 100,131 86,404 72,087 60,482 52,421 46,796 42,005 38,425 35,769 33,440 31,414 3627 96,418 82,414 68,362 57,120 49,297 43,717 38,988 35,734 33,235 31,056 29,186 3728 91,658 77,734 64,417 53,922 46,339 40,820 36,231 33,162 30,840 28,833 27,127 3829 87,770 74,359 61,300 51,255 44,051 38,574 34,143 31,121 28,910 27,019 25,312 39
30 85,047 71,873 58,796 49,153 42,131 36,678 32,517 29,495 27,387 25,581 23,721 4031 81,215 68,383 55,764 46,629 40,083 34,871 31,006 27,977 25,970 24,224 22,279 4132 77,563 64,768 52,454 43,844 37,766 32,947 29,354 26,447 24,559 22,839 20,965 4233 73,279 60,895 49,240 41,065 35,382 31,035 27,677 24,971 23,231 21,501 19,709 4334 69,017 57,384 46,443 38,477 33,041 29,094 25,961 23,486 21,842 20,138 18,463 44
35 64,928 54,006 43,777 36,163 30,874 27,164 24,213 22,018 20,416 18,765 17,245 4536 61,437 50,781 41,122 34,077 29,044 25,355 22,539 20,551 18,907 17,395 16,003 4637 56,968 46,922 37,950 31,580 26,799 23,244 20,634 18,832 17,306 16,002 14,728 4738 51,468 42,424 34,219 28,517 24,210 20,993 18,663 17,014 15,713 14,540 13,447 4839 46,392 38,239 30,831 25,689 21,822 18,966 16,969 15,447 14,297 13,171 12,234 49
40 41,724 34,344 27,856 23,172 19,733 17,266 15,549 14,160 13,087 12,005 11,179 5041 38,905 31,674 25,737 21,336 18,186 16,002 14,447 13,204 12,124 11,093 10,312 5142 37,449 30,242 24,285 20,021 16,995 15,009 13,559 12,364 11,275 10,332 9,559 5243 35,608 28,647 22,775 18,704 15,825 14,006 12,703 11,569 10,526 9,679 8,909 5344 33,636 26,762 21,299 17,471 14,729 13,054 11,882 10,810 9,830 9,041 8,299 54
45 31,547 25,073 20,096 16,440 13,821 12,233 11,164 10,110 9,203 8,438 7,734 5546 29,555 23,479 18,862 15,425 12,962 11,457 10,439 9,448 8,620 7,866 7,196 5647 27,061 21,579 17,406 14,273 12,036 10,604 9,619 8,771 8,035 7,306 6,681 5748 24,588 19,714 15,919 13,148 11,155 9,786 8,835 8,099 7,460 6,773 6,202 5849 22,538 18,139 14,655 12,172 10,407 9,121 8,212 7,528 6,958 6,313 5,779 59
50 20,828 16,714 13,502 11,263 9,704 8,505 7,664 7,037 6,522 5,915 5,407 6051 19,689 15,611 12,597 10,535 9,132 7,998 7,226 6,653 6,162 5,581 5,086 6152 18,967 14,742 11,876 9,946 8,656 7,585 6,869 6,287 5,801 5,246 4,764 6253 18,125 13,812 11,112 9,314 8,113 7,149 6,501 5,902 5,419 4,902 4,451 6354 17,151 12,860 10,331 8,657 7,547 6,712 6,061 5,471 5,007 4,540 4,132 64
55 15,781 11,753 9,437 7,907 6,905 6,209 5,581 5,035 4,602 4,188 3,824 6556 14,218 10,660 8,546 7,164 6,267 5,685 5,104 4,621 4,222 3,860 3,540 6657 12,717 9,643 7,704 6,476 5,675 5,170 4,639 4,222 3,861 3,544 3,267 6758 11,290 8,661 6,924 5,833 5,118 4,665 4,186 3,832 3,512 3,235 2,998 6859 10,014 7,745 6,209 5,233 4,590 4,173 3,757 3,460 3,181 2,939 2,736 69
60 8,892 6,898 5,555 4,680 4,099 3,714 3,372 3,124 2,885 2,676 2,487 7061 8,032 6,184 4,995 4,212 3,681 3,324 3,053 2,840 2,639 2,442 2,253 7162 7,573 5,742 4,640 3,919 3,411 3,073 2,842 2,627 2,410 2,215 2,027 7263 7,306 5,414 4,355 3,687 3,193 2,873 2,644 2,429 2,198 1,987 1,807 7364 7,142 5,152 4,114 3,488 3,006 2,700 2,474 2,258 2,017 1,794 1,604 74
l x[ ] l x[ ] t+l x[ ]

22
Notes:1. Select age denotes age last birthday at entitlement to disability benefits. Duration measured in years since selection. Attained age calculated as sum of selectage and duration. Results do not include auxiliary beneficiaries payable under the DI program.2. The value at duration t represents the average number of years of life remaining for those originally entitled to disability benefits at select age [x] whohave attained age [x]+t. Values are based on survivorship experience from table A.2A.3. Select-and-ultimate table is read across the row for 0-10 years since selection, and down the last (ultimate) column for 10 or more years since selection.
Table A.3A.—Male HIV Disabled BeneficiariesExpected Future Lifetime
(1992-96 Social Security DI and SSI disability experience)
Selectage
Duration of disability
Attainedage0 1 2 3 4 5 6 7 8 9
10 ormore
18 13.61 13.70 13.97 14.28 14.18 13.98 14.28 14.33 14.54 14.52 14.41 2819 12.27 12.42 12.91 13.36 13.47 13.41 13.70 13.79 13.93 13.95 13.78 29
20 11.14 11.38 12.06 12.65 12.94 12.98 13.25 13.35 13.44 13.47 13.27 3021 10.05 10.44 11.29 12.02 12.49 12.68 12.88 12.96 13.02 13.05 12.86 3122 9.03 9.53 10.50 11.47 12.10 12.41 12.57 12.60 12.64 12.69 12.53 3223 8.05 8.59 9.66 10.77 11.54 11.94 12.14 12.18 12.36 12.47 12.25 3324 7.19 7.78 8.86 10.06 10.90 11.38 11.69 11.78 12.03 12.15 11.99 34
25 6.57 7.20 8.29 9.53 10.44 11.01 11.39 11.54 11.80 11.86 11.76 3526 6.16 6.79 7.88 9.10 10.07 10.64 11.08 11.32 11.56 11.58 11.53 3627 5.84 6.47 7.50 8.72 9.68 10.27 10.72 11.05 11.25 11.34 11.32 3728 5.55 6.21 7.28 8.44 9.38 9.99 10.46 10.81 11.00 11.13 11.11 3829 5.35 6.01 7.08 8.23 9.16 9.79 10.30 10.58 10.80 10.95 10.92 39
30 5.23 5.91 6.95 8.05 8.96 9.60 10.13 10.34 10.61 10.76 10.70 4031 5.13 5.77 6.76 7.84 8.72 9.41 9.92 10.14 10.42 10.54 10.48 4132 4.95 5.62 6.60 7.65 8.54 9.24 9.71 9.99 10.29 10.37 10.32 4233 4.90 5.58 6.53 7.53 8.39 9.07 9.52 9.86 10.18 10.21 10.16 4334 4.87 5.56 6.46 7.46 8.27 8.97 9.38 9.74 10.04 10.05 9.99 44
35 4.88 5.56 6.43 7.43 8.22 8.90 9.31 9.59 9.87 9.88 9.82 4536 4.90 5.61 6.47 7.41 8.16 8.80 9.26 9.52 9.72 9.73 9.68 4637 4.84 5.56 6.46 7.37 8.14 8.73 9.25 9.51 9.63 9.60 9.56 4738 4.81 5.57 6.49 7.41 8.17 8.69 9.23 9.50 9.55 9.49 9.44 4839 4.81 5.57 6.51 7.39 8.16 8.66 9.11 9.42 9.46 9.38 9.31 49
40 4.73 5.53 6.42 7.30 8.00 8.47 8.93 9.30 9.35 9.27 9.19 5041 4.66 5.43 6.30 7.17 7.79 8.26 8.71 9.10 9.19 9.13 9.05 5142 4.56 5.30 6.20 7.05 7.65 8.07 8.52 8.89 9.02 8.99 8.92 5243 4.46 5.21 6.09 6.92 7.53 7.92 8.34 8.71 8.87 8.84 8.81 5344 4.37 5.12 5.93 6.76 7.39 7.80 8.18 8.53 8.70 8.67 8.66 54
45 4.32 5.06 5.88 6.73 7.35 7.75 8.11 8.43 8.59 8.53 8.55 5546 4.25 5.01 5.83 6.74 7.37 7.78 8.12 8.38 8.52 8.45 8.46 5647 4.21 5.00 5.84 6.72 7.42 7.82 8.18 8.40 8.50 8.43 8.38 5748 4.19 4.98 5.84 6.73 7.48 7.88 8.25 8.42 8.48 8.38 8.30 5849 4.12 4.93 5.80 6.71 7.49 7.89 8.25 8.37 8.37 8.27 8.19 59
50 4.07 4.83 5.70 6.62 7.41 7.82 8.16 8.23 8.20 8.09 8.05 6051 3.99 4.73 5.59 6.48 7.25 7.68 7.97 8.02 7.97 7.87 7.87 6152 3.89 4.67 5.52 6.35 7.04 7.44 7.71 7.80 7.77 7.67 7.66 6253 3.81 4.63 5.47 6.26 6.86 7.21 7.44 7.57 7.56 7.46 7.44 6354 3.79 4.66 5.45 6.19 6.73 7.05 7.25 7.38 7.40 7.27 7.23 64
55 3.80 4.67 5.39 6.07 6.59 6.92 7.09 7.23 7.26 7.12 7.03 6556 3.74 4.57 5.28 5.92 6.46 6.84 6.98 7.12 7.13 6.98 6.83 6657 3.68 4.42 5.15 5.79 6.33 6.77 6.89 7.00 6.98 6.82 6.63 6758 3.60 4.29 5.06 5.69 6.21 6.66 6.78 6.87 6.80 6.63 6.39 6859 3.53 4.19 4.95 5.57 6.08 6.51 6.64 6.72 6.61 6.40 6.12 69
60 3.49 4.10 4.79 5.37 5.83 6.17 6.27 6.32 6.18 6.02 5.80 7061 3.45 4.07 4.73 5.33 5.75 6.02 6.12 6.15 5.97 5.74 5.46 7162 3.38 4.06 4.70 5.31 5.69 5.90 6.00 5.98 5.76 5.45 5.12 7263 3.27 4.05 4.68 5.28 5.63 5.80 5.90 5.83 5.57 5.18 4.79 7364 3.14 4.05 4.64 5.23 5.57 5.73 5.82 5.70 5.39 4.93 4.49 74
e x[ ] t+

23
Notes:1. Select age denotes age last birthday at entitlement to disability benefits. Duration measured in years since selection. Attained age calculated as sum of selectage and duration. Results do not include auxiliary beneficiaries payable under the DI program.2. The value at duration t represents the average number of years of life remaining for those originally entitled to disability benefits at select age [x] whohave attained age [x]+t. Values are based on survivorship experience from table A.2B.3. Select-and-ultimate table is read across the row for 0-10 years since selection, and down the last (ultimate) column for 10 or more years since selection.
Table A.3B.—Female HIV Disabled BeneficiariesExpected Future Lifetime
(1992-96 Social Security DI and SSI disability experience)
Selectage
Duration of disability
Attainedage0 1 2 3 4 5 6 7 8 9
10 ormore
18 14.17 14.41 14.79 15.70 16.35 16.47 16.58 16.35 15.92 15.21 14.61 2819 13.53 13.81 14.37 15.23 15.74 15.83 15.92 15.77 15.36 14.78 14.30 29
20 12.76 13.10 13.79 14.57 15.10 15.26 15.34 15.27 14.87 14.40 14.03 3021 11.89 12.32 13.10 13.91 14.45 14.73 14.87 14.87 14.51 14.12 13.82 3122 11.14 11.63 12.44 13.27 13.84 14.21 14.45 14.51 14.22 13.91 13.66 3223 10.60 11.06 11.90 12.77 13.38 13.78 14.07 14.19 13.99 13.74 13.52 3324 10.15 10.58 11.46 12.39 13.04 13.44 13.76 13.93 13.81 13.60 13.38 34
25 9.78 10.19 11.07 12.02 12.70 13.10 13.46 13.65 13.59 13.50 13.29 3526 9.49 9.91 10.78 11.76 12.49 12.93 13.35 13.54 13.51 13.42 13.25 3627 9.22 9.70 10.59 11.58 12.33 12.84 13.34 13.51 13.49 13.40 13.23 3728 9.05 9.58 10.46 11.40 12.18 12.76 13.31 13.50 13.48 13.38 13.19 3829 8.87 9.38 10.28 11.19 11.94 12.57 13.13 13.36 13.34 13.24 13.10 39
30 8.64 9.14 10.06 10.93 11.67 12.33 12.85 13.11 13.08 12.97 12.95 4031 8.51 9.01 9.93 10.78 11.46 12.10 12.54 12.85 12.80 12.69 12.75 4132 8.34 8.89 9.86 10.69 11.33 11.92 12.32 12.61 12.55 12.45 12.52 4233 8.24 8.81 9.78 10.63 11.25 11.76 12.12 12.38 12.27 12.22 12.29 4334 8.15 8.70 9.64 10.53 11.18 11.63 11.97 12.18 12.06 12.04 12.08 44
35 8.07 8.60 9.49 10.38 11.07 11.52 11.86 11.99 11.89 11.90 11.90 4536 7.93 8.49 9.36 10.20 10.88 11.38 11.74 11.83 11.82 11.80 11.78 4637 7.87 8.45 9.33 10.11 10.82 11.40 11.78 11.86 11.86 11.79 11.76 4738 7.93 8.51 9.43 10.21 10.94 11.54 11.92 12.03 11.98 11.91 11.83 4839 8.00 8.60 9.54 10.35 11.10 11.69 12.01 12.15 12.08 12.07 11.96 49
40 8.11 8.74 9.66 10.51 11.26 11.79 12.04 12.17 12.13 12.18 12.04 5041 8.03 8.74 9.65 10.53 11.27 11.74 11.95 12.03 12.06 12.13 12.01 5142 7.78 8.52 9.49 10.40 11.16 11.57 11.76 11.85 11.94 11.99 11.92 5243 7.62 8.35 9.38 10.31 11.09 11.47 11.59 11.68 11.79 11.78 11.75 5344 7.49 8.28 9.28 10.21 11.01 11.36 11.43 11.52 11.62 11.59 11.58 54
45 7.43 8.21 9.13 10.04 10.85 11.20 11.22 11.34 11.41 11.39 11.39 5546 7.36 8.14 9.00 9.90 10.69 11.02 11.05 11.16 11.18 11.20 11.20 5647 7.40 8.15 8.98 9.84 10.58 10.94 11.01 11.03 10.99 11.04 11.02 5748 7.46 8.18 9.02 9.81 10.47 10.87 10.99 10.94 10.83 10.88 10.84 5849 7.49 8.19 9.02 9.75 10.32 10.71 10.84 10.78 10.62 10.66 10.59 59
50 7.47 8.18 9.01 9.71 10.18 10.55 10.65 10.56 10.35 10.36 10.29 6051 7.33 8.11 8.93 9.58 9.98 10.32 10.37 10.22 9.99 9.98 9.91 6152 7.08 7.97 8.77 9.38 9.70 10.00 9.99 9.87 9.65 9.62 9.54 6253 6.86 7.85 8.63 9.20 9.49 9.70 9.62 9.55 9.35 9.29 9.18 6354 6.67 7.73 8.50 9.04 9.30 9.39 9.35 9.30 9.12 9.01 8.85 64
55 6.59 7.68 8.44 8.98 9.20 9.18 9.16 9.10 8.91 8.74 8.52 6556 6.60 7.64 8.41 8.93 9.14 9.03 9.00 8.89 8.68 8.45 8.16 6657 6.64 7.60 8.38 8.88 9.06 8.89 8.85 8.68 8.44 8.15 7.80 6758 6.68 7.56 8.33 8.80 8.96 8.78 8.73 8.49 8.22 7.88 7.46 6859 6.71 7.52 8.26 8.71 8.86 8.70 8.60 8.30 7.98 7.60 7.13 69
60 6.70 7.49 8.18 8.62 8.77 8.63 8.45 8.08 7.71 7.27 6.79 7061 6.60 7.43 8.07 8.48 8.63 8.51 8.22 7.80 7.35 6.90 6.44 7162 6.35 7.21 7.80 8.15 8.28 8.14 7.76 7.36 6.97 6.54 6.10 7263 5.99 6.91 7.47 7.74 7.86 7.68 7.30 6.90 6.57 6.22 5.79 7364 5.62 6.60 7.13 7.32 7.42 7.20 6.81 6.42 6.13 5.82 5.46 74
e x[ ] t+

24
Notes:1. Select age denotes age last birthday at entitlement to disability benefits.2. Probability of death at select age [x] represents the average probability of dying within one year for thoseoriginally entitled to disability benefits at that particular age. Values are exposure-weighted averages of thegraduated and blended probabilities of death across all durations from tables A.1A and A.1B.3. Future lifetime at select age [x] represents the aggregate life expectancy in years for those originally entitledto disability benefits at that particular age. Values are exposure-weighted averages of expected future lifetimeacross all durations from tables A.3A and A.3B.
Table A.4.—HIV Disabled BeneficiariesAggregate Probability of Death and Expected Future Lifetime,
by Select Age(1992-96 Social Security DI and SSI disability experience)
SelectAge
Male Female
Probabilityof death
Futurelifetime
Probabilityof death
Futurelifetime
18 0.068322 13.51 0.075990 14.8219 0.083109 12.63 0.086397 14.34
20 0.094482 12.03 0.093430 13.6921 0.111779 11.31 0.102772 12.9922 0.130359 10.64 0.113820 12.3323 0.150559 9.82 0.119461 11.8824 0.170776 9.02 0.127058 11.41
25 0.188361 8.42 0.131007 11.1126 0.200537 7.95 0.136783 10.8127 0.212855 7.47 0.142660 10.5928 0.223527 7.13 0.146474 10.4029 0.232689 6.82 0.148653 10.22
30 0.235709 6.68 0.151829 9.9631 0.238340 6.49 0.154599 9.7432 0.245431 6.28 0.157002 9.6433 0.246176 6.21 0.157643 9.5834 0.246689 6.14 0.159302 9.43
35 0.245571 6.12 0.160455 9.2936 0.244566 6.13 0.163871 9.1037 0.248019 6.08 0.164185 9.1138 0.250742 6.04 0.165421 9.1339 0.251339 6.02 0.166034 9.18
40 0.253506 5.94 0.163809 9.3441 0.255266 5.81 0.167282 9.2642 0.258822 5.68 0.172959 9.0543 0.263482 5.54 0.175812 8.9344 0.267847 5.39 0.178870 8.80
45 0.270347 5.33 0.176855 8.7646 0.273812 5.30 0.179132 8.5547 0.277050 5.28 0.175619 8.6248 0.279562 5.27 0.170919 8.6749 0.280948 5.27 0.166517 8.69
50 0.284454 5.14 0.167123 8.6451 0.286239 5.05 0.163866 8.5952 0.291586 4.93 0.170502 8.3153 0.294976 4.83 0.176643 8.0954 0.294866 4.83 0.181420 7.93
55 0.287317 4.86 0.183020 7.8156 0.289290 4.76 0.168520 7.9057 0.296924 4.55 0.170139 7.7958 0.294435 4.54 0.151816 7.8659 0.297433 4.42 0.167058 7.61
60 0.295327 4.33 0.161554 7.6261 0.294897 4.28 0.160182 7.5462 0.299634 4.24 0.162550 7.1963 0.310498 4.09 0.170110 6.8564 0.327786 4.02 0.198767 5.97

25
Notes:1. Attained age calculated as sum of select age and duration.2. Probability of death at attained age x represents the average probability of dying within one year for thoseoriginally entitled to disability benefits who have attained that particular age. Values are exposure-weightedaverages of the graduated and blended probabilities of death across all durations from tables A.1A and A.1B.3. Future lifetime at attained age x represents the aggregate life expectancy in years for those originally entitledto disability benefits who have attained that particular age. Values are exposure-weighted averages of expectedfuture lifetime across all durations from tables A.3A and A.3B.
Table A.5.—HIV Disabled BeneficiariesAggregate Probability of Death and Expected Future Lifetime,
by Attained Age(1992-96 Social Security DI and SSI disability experience)
Attained Age
Male FemaleProbability
of deathFuture
lifetimeProbability
of deathFuture
lifetime18 0.076854 13.61 0.082751 14.1719 0.088342 12.92 0.089688 13.87
20 0.102948 12.17 0.103995 13.4721 0.118910 11.28 0.113442 13.0322 0.137140 10.44 0.118955 12.5523 0.156280 9.66 0.122574 11.9824 0.175531 8.96 0.127347 11.52
25 0.193759 8.30 0.133362 11.1426 0.207338 7.79 0.137908 10.7827 0.218384 7.38 0.143873 10.5028 0.227265 7.06 0.148936 10.3129 0.235964 6.83 0.150009 10.15
30 0.240200 6.68 0.152275 10.0031 0.241238 6.58 0.155346 9.8732 0.244288 6.44 0.158269 9.7433 0.247465 6.34 0.160528 9.6834 0.247380 6.29 0.159761 9.64
35 0.246007 6.25 0.158937 9.5736 0.245855 6.24 0.160248 9.4737 0.245601 6.23 0.160870 9.4138 0.246579 6.24 0.159851 9.4039 0.245030 6.25 0.159023 9.41
40 0.246812 6.25 0.158704 9.5041 0.243427 6.26 0.159199 9.5542 0.243340 6.21 0.160162 9.5443 0.245951 6.14 0.161783 9.5244 0.245994 6.06 0.165303 9.45
45 0.246503 5.98 0.164593 9.4246 0.249341 5.91 0.163771 9.3547 0.253125 5.83 0.162498 9.3448 0.256148 5.77 0.160126 9.3549 0.259396 5.71 0.156998 9.39
50 0.260509 5.66 0.156314 9.3151 0.263741 5.59 0.156891 9.2652 0.270345 5.50 0.159361 9.1553 0.271467 5.49 0.161894 9.0254 0.272839 5.45 0.164594 8.86
55 0.271983 5.39 0.163274 8.7956 0.267767 5.34 0.159890 8.7257 0.266655 5.22 0.155705 8.6658 0.269889 5.09 0.152092 8.6059 0.271629 5.03 0.148951 8.52
60 0.273924 4.92 0.146464 8.4161 0.275834 4.83 0.147308 8.2862 0.268898 4.92 0.138408 8.3063 0.265248 4.97 0.138136 8.1664 0.254916 5.10 0.126904 8.15
65 0.205220 5.64 0.104734 8.2566 0.176337 5.93 0.089999 8.1767 0.151157 6.11 0.081504 7.9368 0.134328 6.13 0.080340 7.5969 0.121855 6.02 0.084100 7.23
70 0.115662 5.79 0.090176 6.8571 0.116126 5.49 0.097299 6.4872 0.122963 5.15 0.107303 6.1173 0.137954 4.80 0.111507 5.7974 0.152286 4.49 0.119864 5.46

26
Notes:1. Duration measured in years since selection.2. Probability of death at duration t represents the average probability of dying during the (t+1) year ofentitlement to disability benefits. Values are exposure-weighted averages of the graduated and blendedprobabilities of death across all ages from tables A.1A and A.1B.3. Future lifetime at duration t represents the aggregate life expectancy in years for those originally entitled todisability benefits who have not died after t years. Values are exposure-weighted averages of expected futurelifetime across all ages from tables A.3A and A.3B.
Table A.6.—HIV Disabled BeneficiariesAggregate Probability of Death and Expected Future Lifetime,
by Duration(1992-96 Social Security DI and SSI disability experience)
Duration
Male Female
Probabilityof death
Futurelifetime
Probabilityof death
Futurelifetime
0 0.283541 4.92 0.169336 8.421 0.273071 5.70 0.183222 9.052 0.244393 6.68 0.164897 9.973 0.199685 7.72 0.140544 10.854 0.163293 8.56 0.118649 11.55
5 0.142987 9.19 0.103270 12.026 0.122155 9.71 0.087680 12.327 0.111233 10.06 0.072185 12.428 0.095347 10.35 0.071452 12.299 0.086784 10.50 0.071003 12.15
10 0.074625 10.60 0.068964 12.0311 0.075340 10.55 0.069579 12.0212 0.076890 10.43 0.069796 11.9813 0.077042 10.45 0.069784 12.0114 0.077695 10.42 0.070278 12.08
15 0.077865 10.39 0.070932 12.1516 0.079182 10.27 0.071142 12.1417 0.080104 10.16 0.071624 12.0518 0.082945 9.94 0.070367 12.0919 0.084987 9.79 0.070967 11.93
20 0.087629 9.60 0.071820 11.8121 0.089931 9.43 0.073790 11.6322 0.091907 9.28 0.075381 11.5423 0.092693 8.99 0.079757 10.6324 0.094067 8.86 0.074262 11.57
25 0.096564 8.74 0.070594 11.0826 0.100894 8.29 0.068309 10.6627 0.101452 7.92 0.065571 9.7328 0.104630 7.60 0.068990 9.3829 0.106346 7.60 0.068502 9.20
30 0.102299 7.98 0.071738 9.18
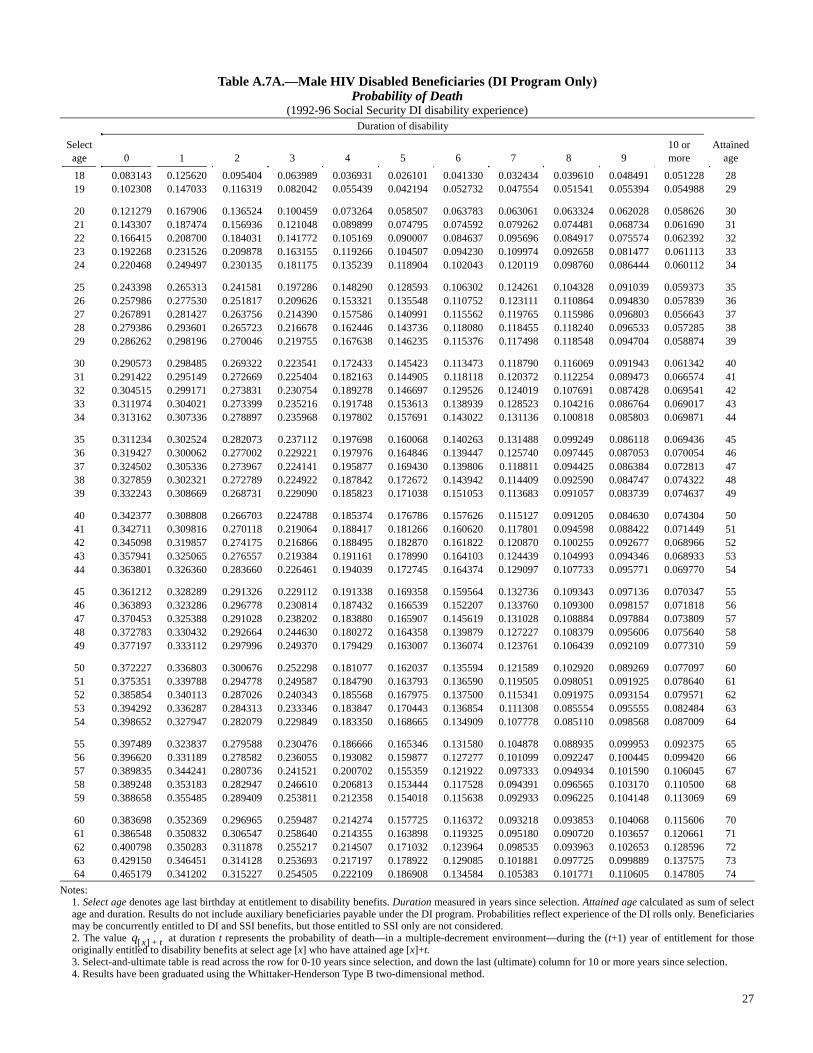
27
Notes:1. Select age denotes age last birthday at entitlement to disability benefits. Duration measured in years since selection. Attained age calculated as sum of selectage and duration. Results do not include auxiliary beneficiaries payable under the DI program. Probabilities reflect experience of the DI rolls only. Beneficiariesmay be concurrently entitled to DI and SSI benefits, but those entitled to SSI only are not considered.2. The value at duration t represents the probability of death—in a multiple-decrement environment—during the (t+1) year of entitlement for thoseoriginally entitled to disability benefits at select age [x] who have attained age [x]+t.3. Select-and-ultimate table is read across the row for 0-10 years since selection, and down the last (ultimate) column for 10 or more years since selection.4. Results have been graduated using the Whittaker-Henderson Type B two-dimensional method.
Table A.7A.—Male HIV Disabled Beneficiaries (DI Program Only)Probability of Death
(1992-96 Social Security DI disability experience)
Selectage
Duration of disability
Attainedage0 1 2 3 4 5 6 7 8 9
10 ormore
18 0.083143 0.125620 0.095404 0.063989 0.036931 0.026101 0.041330 0.032434 0.039610 0.048491 0.051228 2819 0.102308 0.147033 0.116319 0.082042 0.055439 0.042194 0.052732 0.047554 0.051541 0.055394 0.054988 29
20 0.121279 0.167906 0.136524 0.100459 0.073264 0.058507 0.063783 0.063061 0.063324 0.062028 0.058626 3021 0.143307 0.187474 0.156936 0.121048 0.089899 0.074795 0.074592 0.079262 0.074481 0.068734 0.061690 3122 0.166415 0.208700 0.184031 0.141772 0.105169 0.090007 0.084637 0.095696 0.084917 0.075574 0.062392 3223 0.192268 0.231526 0.209878 0.163155 0.119266 0.104507 0.094230 0.109974 0.092658 0.081477 0.061113 3324 0.220468 0.249497 0.230135 0.181175 0.135239 0.118904 0.102043 0.120119 0.098760 0.086444 0.060112 34
25 0.243398 0.265313 0.241581 0.197286 0.148290 0.128593 0.106302 0.124261 0.104328 0.091039 0.059373 3526 0.257986 0.277530 0.251817 0.209626 0.153321 0.135548 0.110752 0.123111 0.110864 0.094830 0.057839 3627 0.267891 0.281427 0.263756 0.214390 0.157586 0.140991 0.115562 0.119765 0.115986 0.096803 0.056643 3728 0.279386 0.293601 0.265723 0.216678 0.162446 0.143736 0.118080 0.118455 0.118240 0.096533 0.057285 3829 0.286262 0.298196 0.270046 0.219755 0.167638 0.146235 0.115376 0.117498 0.118548 0.094704 0.058874 39
30 0.290573 0.298485 0.269322 0.223541 0.172433 0.145423 0.113473 0.118790 0.116069 0.091943 0.061342 4031 0.291422 0.295149 0.272669 0.225404 0.182163 0.144905 0.118118 0.120372 0.112254 0.089473 0.066574 4132 0.304515 0.299171 0.273831 0.230754 0.189278 0.146697 0.129526 0.124019 0.107691 0.087428 0.069541 4233 0.311974 0.304021 0.273399 0.235216 0.191748 0.153613 0.138939 0.128523 0.104216 0.086764 0.069017 4334 0.313162 0.307336 0.278897 0.235968 0.197802 0.157691 0.143022 0.131136 0.100818 0.085803 0.069871 44
35 0.311234 0.302524 0.282073 0.237112 0.197698 0.160068 0.140263 0.131488 0.099249 0.086118 0.069436 4536 0.319427 0.300062 0.277002 0.229221 0.197976 0.164846 0.139447 0.125740 0.097445 0.087053 0.070054 4637 0.324502 0.305336 0.273967 0.224141 0.195877 0.169430 0.139806 0.118811 0.094425 0.086384 0.072813 4738 0.327859 0.302321 0.272789 0.224922 0.187842 0.172672 0.143942 0.114409 0.092590 0.084747 0.074322 4839 0.332243 0.308669 0.268731 0.229090 0.185823 0.171038 0.151053 0.113683 0.091057 0.083739 0.074637 49
40 0.342377 0.308808 0.266703 0.224788 0.185374 0.176786 0.157626 0.115127 0.091205 0.084630 0.074304 5041 0.342711 0.309816 0.270118 0.219064 0.188417 0.181266 0.160620 0.117801 0.094598 0.088422 0.071449 5142 0.345098 0.319857 0.274175 0.216866 0.188495 0.182870 0.161822 0.120870 0.100255 0.092677 0.068966 5243 0.357941 0.325065 0.276557 0.219384 0.191161 0.178990 0.164103 0.124439 0.104993 0.094346 0.068933 5344 0.363801 0.326360 0.283660 0.226461 0.194039 0.172745 0.164374 0.129097 0.107733 0.095771 0.069770 54
45 0.361212 0.328289 0.291326 0.229112 0.191338 0.169358 0.159564 0.132736 0.109343 0.097136 0.070347 5546 0.363893 0.323286 0.296778 0.230814 0.187432 0.166539 0.152207 0.133760 0.109300 0.098157 0.071818 5647 0.370453 0.325388 0.291028 0.238202 0.183880 0.165907 0.145619 0.131028 0.108884 0.097884 0.073809 5748 0.372783 0.330432 0.292664 0.244630 0.180272 0.164358 0.139879 0.127227 0.108379 0.095606 0.075640 5849 0.377197 0.333112 0.297996 0.249370 0.179429 0.163007 0.136074 0.123761 0.106439 0.092109 0.077310 59
50 0.372227 0.336803 0.300676 0.252298 0.181077 0.162037 0.135594 0.121589 0.102920 0.089269 0.077097 6051 0.375351 0.339788 0.294778 0.249587 0.184790 0.163793 0.136590 0.119505 0.098051 0.091925 0.078640 6152 0.385854 0.340113 0.287026 0.240343 0.185568 0.167975 0.137500 0.115341 0.091975 0.093154 0.079571 6253 0.394292 0.336287 0.284313 0.233346 0.183847 0.170443 0.136854 0.111308 0.085554 0.095555 0.082484 6354 0.398652 0.327947 0.282079 0.229849 0.183350 0.168665 0.134909 0.107778 0.085110 0.098568 0.087009 64
55 0.397489 0.323837 0.279588 0.230476 0.186666 0.165346 0.131580 0.104878 0.088935 0.099953 0.092375 6556 0.396620 0.331189 0.278582 0.236055 0.193082 0.159877 0.127277 0.101099 0.092247 0.100445 0.099420 6657 0.389835 0.344241 0.280736 0.241521 0.200702 0.155359 0.121922 0.097333 0.094934 0.101590 0.106045 6758 0.389248 0.353183 0.282947 0.246610 0.206813 0.153444 0.117528 0.094391 0.096565 0.103170 0.110500 6859 0.388658 0.355485 0.289409 0.253811 0.212358 0.154018 0.115638 0.092933 0.096225 0.104148 0.113069 69
60 0.383698 0.352369 0.296965 0.259487 0.214274 0.157725 0.116372 0.093218 0.093853 0.104068 0.115606 7061 0.386548 0.350832 0.306547 0.258640 0.214355 0.163898 0.119325 0.095180 0.090720 0.103657 0.120661 7162 0.400798 0.350283 0.311878 0.255217 0.214507 0.171032 0.123964 0.098535 0.093963 0.102653 0.128596 7263 0.429150 0.346451 0.314128 0.253693 0.217197 0.178922 0.129085 0.101881 0.097725 0.099889 0.137575 7364 0.465179 0.341202 0.315227 0.254505 0.222109 0.186908 0.134584 0.105383 0.101771 0.110605 0.147805 74
q x[ ] t+

28
Notes:1. Select age denotes age last birthday at entitlement to disability benefits. Duration measured in years since selection. Attained age calculated as sum of selectage and duration. Results do not include auxiliary beneficiaries payable under the DI program. Probabilities reflect experience of the DI rolls only. Beneficiariesmay be concurrently entitled to DI and SSI benefits, but those entitled to SSI only are not considered.2. The value at duration t represents the probability of death—in a multiple-decrement environment—during the (t+1) year of entitlement for thoseoriginally entitled to disability benefits at select age [x] who have attained age [x]+t.3. Select-and-ultimate table is read across the row for 0-10 years since selection, and down the last (ultimate) column for 10 or more years since selection.4. Results have been graduated using the Whittaker-Henderson Type B two-dimensional method.
Table A.7B.—Female HIV Disabled Beneficiaries (DI Program Only)Probability of Death
(1992-96 Social Security DI disability experience)
Selectage
Duration of disability
Attainedage0 1 2 3 4 5 6 7 8 9
10 ormore
18 0.079026 0.114213 0.138578 0.123934 0.091646 0.072268 0.052822 0.038317 0.035101 0.039890 0.047312 2819 0.097538 0.135342 0.145327 0.125573 0.092228 0.076082 0.058458 0.043874 0.041652 0.043447 0.046805 29
20 0.116184 0.156284 0.152323 0.127900 0.093513 0.080368 0.063940 0.049413 0.048174 0.046938 0.046180 3021 0.135438 0.176292 0.160768 0.132327 0.096113 0.084998 0.068925 0.055025 0.054499 0.050205 0.045181 3122 0.154913 0.191922 0.169393 0.139520 0.100614 0.089130 0.073272 0.060662 0.060063 0.052938 0.043320 3223 0.169330 0.201566 0.180081 0.147580 0.105926 0.091704 0.076825 0.065972 0.064765 0.054720 0.050912 3324 0.178069 0.207922 0.192609 0.154425 0.112470 0.094513 0.079749 0.070487 0.067896 0.054872 0.053195 34
25 0.183582 0.210439 0.202868 0.159948 0.119576 0.098598 0.081119 0.073378 0.069391 0.053143 0.057533 3526 0.185818 0.210603 0.207652 0.164713 0.127558 0.103194 0.082253 0.073179 0.068364 0.060616 0.060870 3627 0.186906 0.209077 0.205132 0.168508 0.134411 0.106905 0.083430 0.071718 0.065579 0.063655 0.062134 3728 0.190539 0.210526 0.198987 0.171664 0.140192 0.107861 0.086407 0.070346 0.061443 0.065485 0.063555 3829 0.196869 0.219549 0.197110 0.172484 0.143504 0.106551 0.089859 0.069628 0.064008 0.069184 0.064475 39
30 0.207891 0.230446 0.199513 0.173059 0.143768 0.103922 0.092597 0.068784 0.067130 0.074369 0.062048 4031 0.225123 0.236764 0.205855 0.169213 0.142432 0.103383 0.095343 0.067818 0.069380 0.078362 0.054429 4132 0.243163 0.238084 0.209423 0.163308 0.141715 0.105583 0.096095 0.067157 0.072537 0.078262 0.047784 4233 0.253629 0.237106 0.208117 0.159128 0.139577 0.107540 0.094466 0.065585 0.077078 0.076399 0.045773 4334 0.258253 0.237884 0.205982 0.158736 0.135544 0.107134 0.091559 0.062701 0.081677 0.071939 0.045101 44
35 0.252717 0.238934 0.203287 0.159897 0.129743 0.103242 0.087786 0.064369 0.083958 0.067896 0.046517 4536 0.247372 0.241603 0.199467 0.157574 0.126425 0.098399 0.083574 0.068471 0.083856 0.067087 0.050616 4637 0.244826 0.242575 0.195985 0.154614 0.124098 0.094370 0.079644 0.069637 0.083251 0.066912 0.053930 4738 0.243154 0.240779 0.193150 0.152812 0.119172 0.091325 0.076862 0.069421 0.082194 0.063706 0.055467 4839 0.244224 0.236722 0.193704 0.152439 0.113498 0.086491 0.072196 0.070486 0.079836 0.060716 0.055766 49
40 0.245567 0.229702 0.197210 0.151862 0.108376 0.080183 0.070730 0.070704 0.076366 0.060552 0.055758 5041 0.249439 0.227962 0.201205 0.150573 0.104525 0.074667 0.070888 0.072317 0.072897 0.063236 0.055926 5142 0.252011 0.234987 0.206778 0.150880 0.102631 0.069499 0.072891 0.075391 0.069565 0.068201 0.054926 5243 0.257186 0.239285 0.207500 0.149957 0.101901 0.071739 0.075065 0.075245 0.067946 0.074458 0.051677 5344 0.268059 0.235922 0.202809 0.149774 0.101875 0.075933 0.076168 0.074440 0.069686 0.079164 0.048998 54
45 0.275026 0.230493 0.196181 0.151860 0.101210 0.080398 0.077399 0.074139 0.074007 0.081020 0.046827 5546 0.280487 0.230282 0.189600 0.153471 0.099110 0.081100 0.074255 0.073228 0.079097 0.082592 0.046086 5647 0.283300 0.229393 0.184919 0.151989 0.098986 0.078284 0.067835 0.070976 0.084318 0.084560 0.046155 5748 0.280516 0.230267 0.181096 0.148422 0.100710 0.073271 0.062066 0.068949 0.088185 0.086610 0.047682 5849 0.277422 0.229939 0.179738 0.143144 0.102695 0.067194 0.058133 0.068681 0.091203 0.089696 0.052834 59
50 0.279904 0.227908 0.180224 0.138041 0.104230 0.060883 0.057450 0.069952 0.094497 0.093248 0.055628 6051 0.287003 0.227813 0.181145 0.134154 0.104819 0.057856 0.060239 0.073067 0.097770 0.097218 0.056873 6152 0.296224 0.228173 0.182075 0.131358 0.105012 0.060044 0.066430 0.077255 0.100703 0.099068 0.057057 6253 0.305687 0.229954 0.183024 0.130205 0.103133 0.066663 0.075574 0.082218 0.101587 0.095887 0.056236 6354 0.313424 0.232727 0.183418 0.128766 0.099692 0.076279 0.084093 0.087199 0.100503 0.091167 0.055919 64
55 0.314705 0.235461 0.182556 0.127397 0.095179 0.086855 0.089272 0.091386 0.098230 0.086448 0.056311 6556 0.307646 0.238446 0.180756 0.126512 0.090974 0.096670 0.092086 0.094279 0.095217 0.082985 0.057718 6657 0.295924 0.241963 0.178151 0.126292 0.088220 0.104305 0.093410 0.095103 0.091846 0.080904 0.060442 6758 0.284262 0.241986 0.176371 0.127102 0.087459 0.108629 0.093300 0.092729 0.088171 0.078680 0.064619 6859 0.276877 0.240431 0.176336 0.128641 0.088944 0.108951 0.091398 0.088129 0.084344 0.076503 0.069879 69
60 0.274923 0.238823 0.178520 0.130850 0.091297 0.104689 0.087164 0.082193 0.079689 0.073062 0.075151 7061 0.280447 0.237663 0.180692 0.132958 0.094039 0.096950 0.081546 0.083692 0.083678 0.082768 0.081228 7162 0.289534 0.236894 0.182276 0.135860 0.096426 0.088299 0.079752 0.095372 0.097375 0.092966 0.088267 7263 0.302195 0.237619 0.183492 0.139993 0.098635 0.078422 0.085829 0.107164 0.112011 0.103652 0.095885 7364 0.316224 0.238856 0.185197 0.144398 0.101031 0.083658 0.092126 0.118599 0.126426 0.114562 0.104047 74
q x[ ] t+

29
Appendix BStudy Population and Methods
A. OverviewFor this study, we analyzed over 538,000 records of disabledbeneficiaries from two separate 5-year periods: January 1,1997-December 31, 2001 and January 1, 1992-December 31,1996. The primary variables of interest include the reason fordecrement from the disability rolls, and duration since entitle-ment. However, factors other than time since selection affectsurvival. These include the standard concomitant variables ofselect age and sex of the beneficiary. The analysis reflectsexposure counts of roughly 1,088,000 life-years for males and327,000 life-years for females. A 10-year select period waschosen for this study, implying that decrement for participants10 or more years beyond selection is no longer a function ofselect age, but a function of attained age only.
As it relates to the HIV cohorts under observation, the maincause of termination of DI or SSI benefits is death of the ben-eficiary. Termination may also occur for non-death reasonssuch as returning to work, conversion to old-age benefitsunder the DI program, or 12 consecutive months of non-paystatus under the SSI program. However, due to the sparsity ofsuch terminations among HIV beneficiaries, separate decre-ment tables are not developed for categories other than death.The table below provides a breakdown of the termination datacollected from the MBR and SSR.
Source: HIV database as of June 2004. Results do not include auxiliarybeneficiaries payable under the DI program.
B. Data ConsiderationsBeneficiaries observed for this study are categorized underone of several HIV disability impairment codes. A code of042, 043, or 044 was listed as either the primary or secondaryreason for impairment during the observation period.17 Notethat HIV is not necessarily the primary reason for impair-
ment—for example, if an individual is incapacitated bydepression brought on by HIV, then depression might be theprimary diagnosis, with HIV coded as secondary. We alsoconsider beneficiaries who have had an HIV impairment inthe past, but appeared on the rolls during the observationperiod under another impairment category. There areinstances where HIV is present, but the applicant is either(1) denied benefits, or (2) initially allowed benefits withoutHIV being listed as the primary or secondary reason for dis-ability. These cases are not captured in the study.
The mortality experience is affected by several unique cir-cumstances. It is recognized that a claimant may die duringthe 5-month waiting period required under the DI program—and therefore never becomes entitled; or the claimant may diebefore final disposition of the disability claim—in which caseonly retroactive disability benefits may be payable. Withregard to the DI program, participation in this study is contin-gent upon entitlement to benefits. Therefore, death prior toentitlement is not a “countable” death. As a result, the proba-bility of death during the first year of entitlement may be arti-ficially lower than expected. Note that the SSI program doesnot have a waiting period and SSI-only recipients come underobservation as soon as eligibility is determined.
In general, observation ends with the period in which benefitsare terminated. As previously mentioned, non-death termina-tion of benefits can occur when a beneficiary returns to work,or remains in non-pay status for 12 consecutive months underthe SSI program—for example, due to excess income orresources. Under the DI program, disabled workers may con-vert to old-age benefits at anytime beginning with age 62,with mandatory conversion taking place at normal retirementage. Such conversion is considered a termination of disabilitybenefits as old-age benefits become payable from the OASITrust Fund. However, disabled beneficiaries continue underobservation in this study beyond the time of the switch. Con-sequently, deaths for attained ages 62 and older may comefrom the OASI rolls. The SSI program has an aged categoryfor non-disabled individuals whose eligibility requires them,in part, to be age 65 or older. However, there is no automaticconversion to this category for disabled recipients—who gen-erally continue to be considered disabled beyond this age, andalso continue under observation in this study.
Other exceptional cases exist where observation continuesbeyond non-death termination of benefits. This occurs forsome SSI-only cases in which the SSR is automatically anno-tated upon reporting of death. Instances where death isrecorded after non-death termination may result in additionalexposure credited to an otherwise terminated recipient. How-ever, this anomaly does not materially impact results.
Number of HIV Disabled Beneficiaries on the DI and SSI Rolls with Benefits Terminated, by Reason
Male Female Total
(January 1997-December 2001)
Death 44,747 13,643 58,390Non-Death 11,440 3,657 15,097
Total 56,187 17,300 73,487(January 1992-December 1996)
Death 124,553 21,136 145,689Non-Death 7,259 2,450 9,709
Total 131,812 23,586 155,398
17 Code 042 is used primarily for cases involving AIDS and AIDS-Related Complex; 043 may be used as the primary or secondary diagnosis code where symptomatic HIV infection is accompanied by symptoms reasonably assumed to be related to the infection; 044 is used when asymptomatic HIV is involved either as the primary or secondary reason for allowance.

30
This study integrates a special longitudinal file constructedfrom the SSR. However, due to the nature of the data, severalproblems were encountered in combining MBR records withSSR records relating to individuals who receive both DI andSSI benefits during a period of disability. As they appear onthe MBR, entitlement and cessation dates are utilized for pro-cessing concurrent cases while accounting for overlappingperiods of DI entitlement and SSI eligibility. Under this con-vention, observation begins from the date of DI entitlement.As a result, up to 5 months of exposure may not be capturedfor beneficiaries who receive an SSI benefit during the DI5-month waiting period. Also some exposure may not be cap-tured for beneficiaries who transition from concurrent statusto SSI-only eligibility, due to SGA earnings after the36-month DI extended period of eligibility. In such cases,observation ends upon termination of DI benefits as a result ofwork activity. However, SSI eligibility may continue if earn-ings are such that countable income does not exceed the appli-cable Federal SSI benefit rate. It should be noted, however,that the above omissions do not materially impact results.Refer to appendix C for details on SSI considerations.
Another problem involves beneficiaries having multiplerecords on the SSR. It is possible that different records arerelated to different impairments. For example, an SSI benefi-ciary might have several records of eligibility; at least one ofwhich, but not necessarily all, are related to HIV impairments.Given the structure of the longitudinal file, it is not possible todistinguish which records in multiple-record cases are rele-vant to the study and which are not. In such instances, allrecords of eligibility are processed.
C. MethodsThe availability of complete data on each participant in thestudy (including date of birth, date of entitlement, and causeof decrement) allows for direct estimation of the multiple-dec-rement probabilities , where represents the cause of dec-rement. The ordered pair is determined for each ageinterval for which a participant is under observa-tion. The concept is that each participant enters the interval atage , and is scheduled to exit the interval atage . Numerically, is the amount of time(measured in life-years) that the participant is exposed to therisk of decrement. Summing over all participants, we can cal-culate the scheduled exposure contributed to an interval.18
A participant may survive to the end of an interval, or mayexit the study prior to the end of the interval in the event of:
• Death,• Recovery or other non-death decrement, or• The end of the observation period—termed an observed
ender.
Based on these criteria, a scheduled ending age, , isestablished for an age interval in which the participant isexpected to either survive to the end , or become anobserved ender .19 Scheduled exposure is then creditedto the appropriate interval (or duration since selection) usingthe following conditions: if the participant survives to the endof the interval, then exposure is credited from to ;if the participant dies or is an observed ender within the inter-val, then exposure is credited from to ; if the partic-ipant withdraws from the study during the interval (forexample, recovers), then exposure is credited from age to . Death probabilities are found by dividing theobserved number of deaths in an interval by the aggregatescheduled exposure for that interval.
D. Select Age, Duration, and GraduationEntitlement to disability benefits usually occurs at some frac-tional age of the beneficiary. To facilitate exposure calcula-tions, the insuring age of the participant and correspondinginsuring date of birth are substituted for the actual age at enti-tlement and actual date of birth. In this study, the insuring ageis calculated to be the beneficiary’s age last birthday as ofentitlement. For example, consider the following beneficiarydata:
Date of entitlement: 1-February-1992Date of birth: 10-July-1960Actual age at entitlement: 31 years, 206 daysInsuring (select) age: 31 yearsInsuring date of birth: 1-February-1961
Use of insuring age results in an integral select age at entitle-ment ensuring that subsequent durations begin on the entitle-ment anniversary. This is true whether the participant entersthe study during the observation period, or is already part ofthe entitlement group when the observation period opens.
The intervals for which a participant is under observation—measured from the select age—are called durations. For eachselect age and duration , the ordered pair repre-sents the amount of exposure contributed to the observationinterval . For durations extending beyondthe 10-year select period, exposure is credited to the appropri-ate attained age interval. For details on the crediting of expo-sure, the reader is referred to Actuarial Study No. 118.
The select-and-ultimate multiple-decrement probabilities aregraduated using the two-dimensional Whittaker-HendersonType B method.20 The horizontal and vertical smoothingcoefficients were chosen to obtain some degree of smoothness
18 For a complete discussion, refer to chapter 6 of Survival Models and Their Estimation (London 1988, second edition).
q i( ) ir s,( )
x( x 1 ]+,
x r 0 r 1<≤( )+x s 0 s< 1≤( )+ s r–
19 A participant who dies during the interval does so at age ; a participant observed to withdraw from the study during the interval also does so at age less than .20 For details, refer to chapter 8 of Graduation: The Revision of Estimates (London 1985).
x s+
s 1=( )s 1<( )
x t x s+≤+
x s+
x r+ x 1+
x r+ x s+
x r+x s+
x[ ] n r s, )(
x[ ] n+ x[ ], n 1 ]+ +(

31
within individual durations (columns) as well as within selectages (rows). The erratic nature of the data at various attainedages results in some deviation from the original estimates.
Although HIV disability beneficiaries may live to older ages,current administrative records show very little evidence ofsurvival beyond age 74. Therefore, no results are presentedbeyond this attained age.
E. Survival TablesSurvival tables 2A-2B (and A.2A-A.2B) are constructed fromthe select-and-ultimate death probabilities. The functions
are first calculated for select age ,using a radix of 100,000. This step determines values for theultimate period of the table. Functions for select ages are then derived retrospectively from the ultimate values. Forexample, is determined from using the survivalprobabilities of the select period for the given select age. Thenumber represents the number alive at the beginning ofduration from those originally entitled at select age .Note that the number alive at various select ages are not actualcounts of disability beneficiaries. Rather, the number living atthe beginning of any duration are for illustrative purposes,chosen to represent the probability of survival based on valuesshown in tables 1A-1B (and A.1A-A.1B).
The survival tables are read across the row, or select period,for 0-10 years since selection, then down the last column, orultimate period for 10 or more years since selection. Numbersfor the following example can be found in table 2A. Of themale beneficiaries disabled at select age 30, the followingtable shows the number surviving (that is, still on the disabil-ity rolls) after the stated number of years:
F. Expected Future LifetimeFuture lifetime tables are produced from the survival func-tions described above using basic actuarial principles found inany standard actuarial text on life contingencies. Tables 4-5(and A.4-A.5) show the results of aggregating over durationby select or attained age.
Aggregate lifetime for a specific select age is an exposure-weighted average of the expected future lifetime at each dura-tion of that age. This differs from aggregate lifetime for a spe-cific attained age, which is an exposure-weighted average ofthe expected future lifetime of those durations representing aparticular attained age.
For example, aggregate lifetime for select age 40 is aweighted average of the expected lifetimes shown for eachduration 0 through 34—where each duration represents a dif-ferent attained age. In contrast, aggregate lifetime for attainedage 40 is the average of the expected lifetimes for a select40-year-old at duration 0, select 39-year-old at duration 1,...select 20-year-old at duration 20—all of whom are attainedage 40.
G. Probabilities and Absolute RatesThe data for this study were collected in a multiple-decrementenvironment, however, we explicitly consider only two majordecrement classes—death and non-death. The symbol represents the probability of death in the presence of otherdecrements. Mathematically, this is represented by:
where is the probability of surviving under all decre-ments; and is the force of mortality.
For each of the causes of decrement in a multiple-decrementmodel, it is possible to define a single-decrement model thatdepends only on a particular cause of decrement. The symbol
represents the single-decrement (absolute) rate of death.Mathematically, this is represented by:
where is the probability of not dying. In this representa-tion, observation stops at the point of non-death decrement,and scheduled exposure (as previously discussed) is replacedby the smaller quantity of exact exposure. The result is lowerexposure totals relative to those used in formulating deathprobabilities.
Although not presented in this study, absolute rates may beobtained from the death probabilities shown in tables 1A-1Band HIV non-death decrement probabilities. Assuming a con-stant force of mortality over the age interval , abso-lute rates may be derived using the following:
where (all other symbols are as describedabove).21
Years sinceentitlement
Numberliving
Probability ofsurvival Attained age
0 71,589 1.000 301 64,568 .902 315 47,251 .660 35
10 35,426 .495 4015 26,071 .364 45
l x[ ] l x[ ] 1+ … l74,, , x[ ] 18=
x[ ] 18>
l x[ ] lx 10+
l x[ ] t+
t x[ ]
=
=
21 For a complete discussion on multiple-decrement probabilities, the associ-ated single-decrement rates, and construction of the select-and-ultimate mul-tiple-decrement tables found in this study, the reader is referred to chapter 10 of Actuarial Mathematics (Bowers et al. 1997).
q d( )
qxd( ) pt x
τ( ) µx t+d( ) td
0
1
∫p τ( )
µ d( )
q′ d( )
qx′ d( ) p′t x
d( )µx t+
d( ) td0
1
∫p′ d( )
x( x 1 )+,
q′ d( ) 1 1 q τ( )–[ ]q d( ) q τ( )⁄–=
q τ( ) 1 p τ( )–=

32
Appendix CDisability Program Overview
A. Definition of DisabilityFor purposes of entitlement to disability benefits under the DIprogram, disability is defined as the inability to engage in anysubstantial gainful activity (SGA) by reason of any medicallydeterminable physical or mental impairment. The impairmentmust be expected to result in death or to last for a continuousperiod of at least 12 months.
The formal determination of disability is based on a sequen-tial process defined in regulations. The first step comparesactual earnings to a specified level to determine ability toengage in SGA. Absent such actual earnings evidence, thesequential process continues with an evaluation of the natureand severity of the alleged impairment, followed by consider-ation of age, education, and work experience.
The same definition of disability applies when determiningeligibility of adults under the Supplemental Security Income(SSI) program as described under title XVI of the SocialSecurity Act. This means-tested cash benefits program is alsoadministered by the Social Security Administration.
Special provisions exist for the evaluation of insured statusand disability in cases of statutory blindness.
B. Disability Insured Status and Waiting PeriodTo be insured for DI benefits, a worker must earn a requisitenumber of quarters of coverage (QCs) in employment cov-ered by Social Security.22 In addition to earning sufficientQCs to be deemed fully insured23, the worker must also fulfilla recency-of-work requirement to be deemed disabilityinsured. The number of required recent QCs varies by age,and ranges from 6 out of the last 12 quarters immediately pre-ceding the onset of disability, to 20 out of the last 40. There isno insured status requirement for disability benefits under theSSI program.
There is a required waiting period for DI benefits, which con-sists of 5 consecutive calendar months beginning with the ear-liest calendar month throughout which the worker satisfiedboth the definition of disability and the disability insuredrequirements. Benefits are not payable during this period. Bylaw, the waiting period is waived for individuals who had aprior period of disability which ended within 5 years of thecurrent period of disability. There is no waiting period for dis-ability benefits under the SSI program.
C. Substantial Gainful Activity (SGA)Substantial work activity involves the performance of signifi-cant physical or mental duties that are productive in nature.Gainful work activity is work performed for pay or profit. Thedegree to which an impairment limits an individual’s ability toperform basic work activities is essential in determining theseverity of the disability.
Certain earnings criteria have been established as reasonableindications of whether an individual is engaging in SGA. Thedollar amount associated with defining SGA was originallyset at $100 at the inception of the DI program. This amountreceived ad hoc increases from time-to-time, including a 1990increase to $500 from $300, and a 1999 increase to $700 from$500. Beginning in 2001, the amount has been indexed eachyear by increases in average wages. As of 2005, an employeeearning over $830 per month will ordinarily demonstrateSGA; less than that amount will ordinarily demonstrate lackof SGA.
D. ImpairmentsTo establish the presence of an impairment, an individualmust provide a claim with supporting medical evidence of thealleged disability. To determine the severity of the disability,SSA consults the Listing of Impairments, which sets forth thecriteria needed to be met by various impairments in order forthe claimant to be judged incapable of performing SGA.However, a diagnosis of a listed impairment alone may not besufficient to establish disability; associated symptoms, clini-cal signs, and laboratory findings must accompany it.
Many individuals are found to be disabled even thoughimpairments fail to meet the level of severity required in themedical listings. In these instances, vocational factors havebeen considered along with an individual’s medical condition.Age, education, and job skills are given increasing weightwith advancing age and are particularly significant in deter-mining disability among workers age 50 or older.
E. Determination ProcessAt the initial stage of a claimant’s request for disability bene-fits, the State Disability Determination Services (DDS) willmake a decision to allow or deny the claim. A claimant who isdissatisfied with the initial decision may pursue an appealsprocess:
• The claimant may request the reconsideration of an ini-tial decision. This entails re-examination of administra-tive records—in the same DDS—with the opportunityto submit new material evidence supporting the claim.
• If disagreement persists after the reconsideration, theclaimant may request a hearing before an administrative
22 As of 2005, a worker receives one QC (up to a maximum of four) for each $920 of annual covered earnings. This amount is indexed each year by increases in average wages.23 Fully insured status is obtained by earning one QC for each year after attainment of age 21 and before the earliest of (1) attainment of age 62, (2) onset of disability, or (3) death.

33
law judge (ALJ) of the Office of Hearings and Appeals(OHA).
• If disagreement persists after the ALJ decision, theclaimant may request a review by the Appeals Councilof OHA, and then may pursue civil action in a Federaldistrict court.
Many factors exist that affect the number of disability claimsfiled as well as the frequency of subsequent decisions to eitherallow or deny benefits. However, the impact of any one factoris difficult to gauge. In general, they may be administrative,economic, or demographic in nature.24
The subjectivity inherent in assessing disability leaves consid-erable room for interpretation of evidence. As a result, over-turned decisions at the OHA level and beyond remainrelatively high. Factors that contribute to the high reversalrate include:
• A group of decision-makers different from those used atthe initial and reconsideration stages,
• Use of legal representation and further opportunity tosubmit new material evidence supporting the claim.
F. SSI ConsiderationsThe SSI program provides assistance to individuals who areeither ineligible for various types of Social Security benefits,or whose benefits could not provide a basic level of income.This “last resort” type of assistance is available to aged, blind,or disabled individuals whose income and resources arebelow specified levels. The program takes into account allincome and resources that an individual has and applies uni-form standards and objective eligibility criteria to measure theneed for assistance. These include:
• Medical determination of disability and blindnessequivalent to that used by the DI program.25
• 65 as the minimum age requirement for assistance basedon age.
• A limitation on the amount of income—including anySocial Security benefits—and resources that an individ-ual can have and still qualify for SSI benefits.26
24 Some of the determinants which may have a significant impact on both the number of claims filed and the rate of favorable determinations are discussed in detail in Actuarial Study No. 118: Social Security Disability Insurance Pro-gram Worker Experience (Zayatz, June 2005).
25 Note that under SSI, there are no requirements relating to disability insured status or waiting period as set forth by the DI program.26 The countable income limits for individuals and couples are equal to their respective Federal benefit rates and are increased annually according to changes in the cost of living. Effective January 1, 2005, the Federal benefit rate is $579 a month for individuals and $869 a month for couples. The resource limit is $2,000 in countable resources for individuals and $3,000 for couples. For further details in areas such as income and resource exclusions and interaction with benefits from Social Security and other Federal or State-sponsored programs, refer to the Annual Report of the Supplemental Security Income Program (May 2005).