activity 7: topographic maps ii maine geological survey - maine.gov
TRANSCRIPT

Activity 7: Topographic Maps II
Maine Geological Survey
Objectives:
To have the students develop and be able to manipulate a grid coordinate system on
their 7.5 minute series local topographic maps. To use the grid coordinate protractor
(GCP) to plot azimuth values as a means of indicating direction on these maps; to be
able to perform simple map traverses.
Time:
Grid mapping will take 30 minutes and the traverse will take 35 minutes to perform.
Background:
Once the domain solely of military analysts and professional cartographers, the ability to
pinpoint an exact location on the earth’s surface is now useful in a great many fields
including mineral exploration, pollution analysis and control, development and zoning
activities, construction, and communications.
While a number of grid coordinate systems exist, all of them use some type of projected
lines off a globe representation of the earth. On the 7.5-minute maps, Universal
Transverse Mercator (UTM) lines are used. UTM numbers are printed in the margins of
the map with usually a larger central pair of numbers surrounded by 4 or 5 smaller ones,
0012000, for example. At this point a general discussion of longitude lines (which
measure east-west position) and latitude lines (which measure north-south position)

Maine Geological Survey | 2
may be useful. Many atlases and even road maps use a simplified version of this grid
system. See the DeLorme Atlas City Maps for example.
The concept of azimuths or degree bearings may be familiar to students who have had
geometry. Again a simple discussion of the compass points and the number of degrees
in the circle is useful (See Figure 1).
Students with experience in scouting and similar organizations may have considerable
expertise in this type of activity and should be encouraged to help their peers.
Materials:
Students, ideally, should each have their own map for this activity. You may wish to
have all students purchase their own maps if you are going to do an entire unit or
section on mapping. Each student will also need a meter stick.
Procedure:
PROTRACTOR: Using the sample enclosed, duplicate one copy per student onto clear
plastic (Figure 2).
GRIDDING MAP: (Some of the newer quadrangles already have the grid lines on them.)
To grid the map, lay the map on a flat surface and, using the meter stick, draw a thin but
distinct line between corresponding UTM numbers on opposite sides (or ends) of the
map. Repeat this process until the entire map is covered by a grid of parallel lines. The
two larger print digits in each UTM number will be the base number for each line drawn
on the map. For example, the bottom most UTM number in the Turner Center
Quadrangle is 4901000 in its entirety (See Figure 3). This line will be the 01 line for this
map. Notice that the UTM numbers are written just below or just to the end of faint
blue lines that extend into the margins of the map. The lines will always be there on the
margins even if the numbers are not. When the map has been completely ruled off,
neatly label all the horizontal lines up the middle of the map and label all of the vertical
lines across the middle of the map. See sample of Rome provisional quadrangle map in
front binder pocket.

Maine Geological Survey | 3
The coordinates for any point on the map can now be expressed as an 8 digit number
such as 09360215. The general expression in reference to reading these coordinates is
RIGHT-UP. The first four numbers (read left to right) will locate the east-west position on
a horizontal grid line. The last four numbers (read bottom to top) locate the north -
south position. The intersection of these lines marks the exact location of your point -
which can be any geographic or man-made feature. In each eight digit number the first
and third pairs of numbers come off the map, while the second and fourth pairs are
obtained by using the coordinate protractor. The protractor is placed with the zero
degree mark at the top so the square lines up with the bottom and right hand side of
one of the grid squares. The second pair of digits comes off the bottom scale (RIGHT)
and the fourth pair of digits comes off the side scale (UP) (See discussion on student
sheet). Thus the coordinates for the highest point on Mosher Hill (see attached map
portion) are 32543582. It should be noted when reading the bottom scale that the
numbers decrease from left to right. Thus the following point:
A map traverse consists of the following steps. Locate a point, using the GCP to define
its coordinates. Determine a direction to follow, which is called an azimuth, in degrees.
Follow this azimuth a specified distance using the map scale and arriving at a new point.
Use the GCP to identify the coordinates of the new point. As students gain expertise, the
traverses can become more complex employing multiple steps, back azimuths (180
degrees from the given direction), and triangulation. A very challenging exercise is to let
the students make up each-others test traverse.
Follow-Up:
Invite a professional cartographer or draftsman to explain to the group how he/she
locates objects. Take the group to see a computer assisted mapping facility.
Add adjacent quadrangles to your already gridded one extend the grid lines and add
those that are missing. Now plot traverses over much larger distances. Students will
have to be very careful in determining their azimuths to maintain accuracy.

Maine Geological Survey | 4
If the terrain is appropriate locally, have students convert map azimuths to magnetic
(compass) azimuths and do some actual land traverses using the map. See U.S. Army
Field Manual 21-26 for a discussion of the necessary techniques.
References:
Activity developed by Duane Leavitt with materials and concepts modified from U.S.
Army Field Manual FM 21-26, Map Reading (Department of the Army, 1969).

Maine Geological Survey | 5
Figure 1. Comparison of selected compass points with corresponding degree values.
Figure 2. Grid coordinate protractor (GCP). (Provided by Major Logan, US Army National
Guard, Camp Keyes, Augusta, Maine)

Maine Geological Survey | 6
Figure 3. Turner Center quadrangle.

Activity 7: Topographic Maps II
Maine Geological Survey
Student Sheet
Purpose:
In this activity you will learn how to read and plot map coordinates, read and plot
azimuths, and you will use both these skills to learn how to plot and follow a map
traverse.
Materials:
A Grid Coordinate Protractor (GCP), 7.5-minute series topographic map, meter sticks,
pens, pencils, and notebooks.
Part I:
Lay your map on a flat surface and locate the Universal Transverse Mercator (UTM)
projection lines and numbers; these are located in the margins on all four sides of the
map. The UTM numbers will have the following form although the actual numbers will
vary from quadrangle to quadrangle. Here is a typical UTM number and mark: 4902000
m N.
Notice that a UTM number on one side of the map will ALWAYS have either a
corresponding mark or mark and number on the opposite side of the map. Once you
have located all the UTM numbers, connect corresponding numbers by drawing a
straight line in pencil on the map. Continue this process until all UTM numbers of the
same value have been connected. When you are done you will have a graph or grid
Name________________________________

Maine Geological Survey | 2
drawn on your map; each square in the grid will measure exactly 13/8 by 13/8 inches.
All your vertical lines should be roughly parallel to the sides of the map; all horizontal
lines should be roughly parallel to the top and bottom of the map. Have your instructor
check your map. Change any lines that your teacher indicates. Label the lines on your
map as indicated by your instructor; all lines should be labeled with a two digit number
such as 58 or 03. (See Sample Map 1).
Part II:
You now have the tools, a gridded map and a GCP, to locate any point on the map to
within 100 square feet. Look at the location on Sample Map 1 marked with a big arrow,
the highest point on Mosher Hill. Notice that the hilltop lies between the 32 and 33
vertical lines and between the 35 and 36 horizontal lines. Orient the GCP so that the
numbers around the outside edge read clockwise. Place the protractor so that the two
coordinate scale zeros are at the lower left corner of the grid square bounded by the
above lines. Keeping the scale on the lower horizontal grid line, slide the GCP to the
right until the point for which coordinates are desired (the top of Mosher Hill) touches
the edge of the scale. Coordinates are read where the starting grid line crosses the
bottom scale and the point touches the side scale. Notice that the UTM line marked 32
crosses the bottom scale of the GCP at the second black mark beyond the 5.
Location of UTM line with reference to bottom GCP scale:
Each division is equal to two units; there are no decimal points. You now have the first
four digits in an 8 digit grid coordinate number. These numbers are 3254 and give the
east-west position of the hilltop on the map; these numbers are read from left to the
right.
Now look at the side or vertical scale of the GCP; notice that the "x" which represents
the hilltop is near the top of the scale at the 82 position. Using the same process as

Maine Geological Survey | 3
above, the last four numbers are 3582. These give the vertical position of the feature
and are read bottom to top or up. The full location of the top of Mosher Hill is,
therefore, 32543582. Remember that the first four numbers are read RIGHT and the last
four numbers are read UP. Also notice that the first and third pairs of numbers, 32 and
35, come from the lines drawn on the map and the second and fourth pairs of numbers,
54 and 82, come from the GCP.
Now use YOUR local quadrangle map and GCP to find the coordinates of the following.
1. Highest point _________________________
2. Location of your school _________________________
3. Lowest point _________________________
4. Approximate center of largest body of water _________________________
5. Largest swamp _________________________
6. Church/hilltop closest to school _________________________
7. Other (as directed by instructor) _________________________
Check these coordinates against the values your instructor has and resolve any
differences.
Part III:
Now that you can locate points on the map, you are ready to travel between them.
Place the large cross in the center of your GCP over the center of the highest point. The
0 degree reading should be at the top of the GCP and the numbers, 0 to 359, should
read clockwise around the edge. Make sure the edges of the GCP are lined up parallel
with the grid lines. Place a ruler or meter stick so that it connects the center cross of the
GCP and your school. The number that the ruler passes through on the edge of the GCP
is the direction or azimuth to your school. It is measured in degrees.
Record this azimuth here: _________________________.
Maine Geological Survey | 4
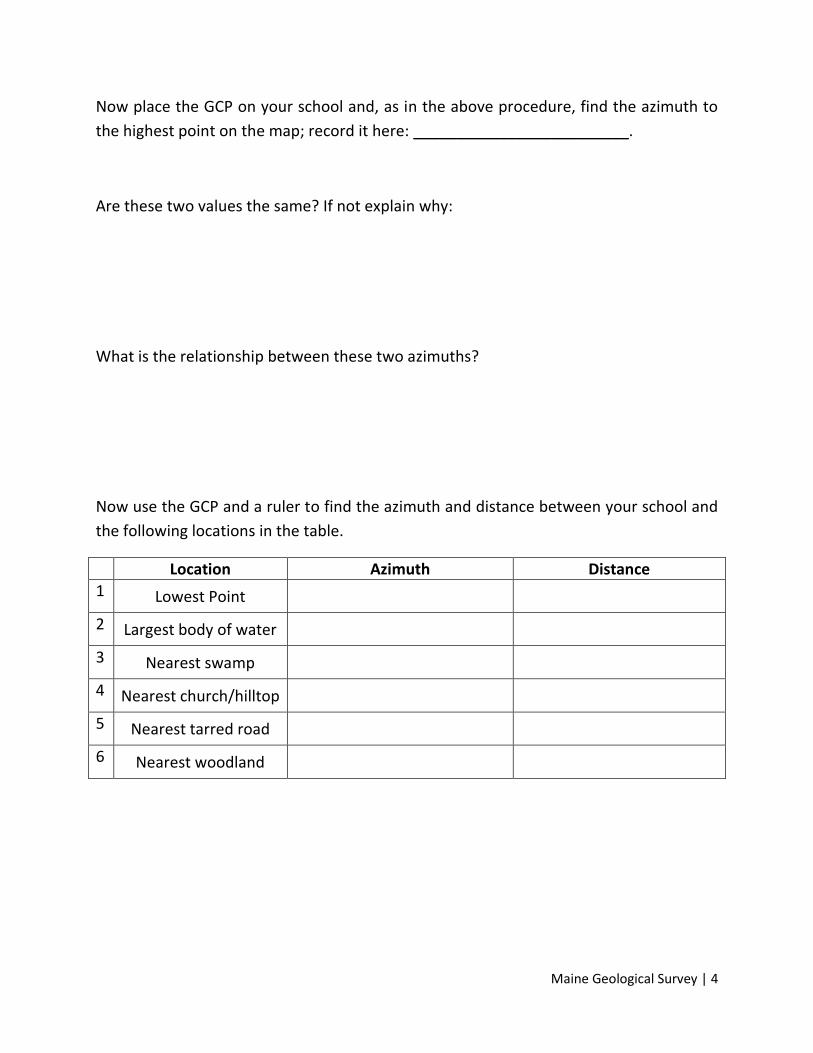
Now place the GCP on your school and, as in the above procedure, find the azimuth to
the highest point on the map; record it here: _________________________.
Are these two values the same? If not explain why:
What is the relationship between these two azimuths?
Now use the GCP and a ruler to find the azimuth and distance between your school and
the following locations in the table.
Location Azimuth Distance
1 Lowest Point
2 Largest body of water
3 Nearest swamp
4 Nearest church/hilltop
5 Nearest tarred road
6 Nearest woodland

Maine Geological Survey | 5
Questions and Discussion:
1. What would be the actual difference in distance between coordinates of 06290494
and 06300495?
2. Could one use a GCP and 7.5-minute series map and still allow for minor errors or
differences? Explain.
3. Construct a traverse consisting of grid coordinate values, azimuths and distances;
have another team of students follow this traverse and see if they come out at your
predetermined point.

Maine Geological Survey | 6
Sample Map 1 Shows clear plastic GCP superimposed on topographic map and gives
example of a vertical reading of 62 and a horizontal reading of 54.