activeversusexpectantmanagementforwomeninthethird...
TRANSCRIPT

Cochrane Database of Systematic Reviews
Active versus expectant management for women in the third
stage of labour (Review)
Begley CM, Gyte GML, Devane D, McGuire W, Weeks A, Biesty LM
Begley CM, Gyte GML, Devane D, McGuire W, Weeks A, Biesty LM.
Active versus expectant management for women in the third stage of labour.
Cochrane Database of Systematic Reviews 2019, Issue 2. Art. No.: CD007412.
DOI: 10.1002/14651858.CD007412.pub5.
www.cochranelibrary.com
Active versus expectant management for women in the third stage of labour (Review)
Copyright © 2019 The Cochrane Collaboration. Published by John Wiley & Sons, Ltd.
T A B L E O F C O N T E N T S
1HEADER . . . . . . . . . . . . . . . . . . . . . . . . . . . . . . . . . . . . . . .1ABSTRACT . . . . . . . . . . . . . . . . . . . . . . . . . . . . . . . . . . . . . .2PLAIN LANGUAGE SUMMARY . . . . . . . . . . . . . . . . . . . . . . . . . . . . . .4SUMMARY OF FINDINGS FOR THE MAIN COMPARISON . . . . . . . . . . . . . . . . . . .7BACKGROUND . . . . . . . . . . . . . . . . . . . . . . . . . . . . . . . . . . . .
10OBJECTIVES . . . . . . . . . . . . . . . . . . . . . . . . . . . . . . . . . . . . .10METHODS . . . . . . . . . . . . . . . . . . . . . . . . . . . . . . . . . . . . . .15RESULTS . . . . . . . . . . . . . . . . . . . . . . . . . . . . . . . . . . . . . . .
Figure 1. . . . . . . . . . . . . . . . . . . . . . . . . . . . . . . . . . . . . . 16Figure 2. . . . . . . . . . . . . . . . . . . . . . . . . . . . . . . . . . . . . . 19Figure 3. . . . . . . . . . . . . . . . . . . . . . . . . . . . . . . . . . . . . . 20
27DISCUSSION . . . . . . . . . . . . . . . . . . . . . . . . . . . . . . . . . . . . .32AUTHORS’ CONCLUSIONS . . . . . . . . . . . . . . . . . . . . . . . . . . . . . . .34ACKNOWLEDGEMENTS . . . . . . . . . . . . . . . . . . . . . . . . . . . . . . . .34REFERENCES . . . . . . . . . . . . . . . . . . . . . . . . . . . . . . . . . . . . .40CHARACTERISTICS OF STUDIES . . . . . . . . . . . . . . . . . . . . . . . . . . . . .63DATA AND ANALYSES . . . . . . . . . . . . . . . . . . . . . . . . . . . . . . . . . .
Analysis 1.1. Comparison 1 Active versus expectant management of 3rd stage of labour (all women), Outcome 1 Severeprimary postpartum haemorrhage (PPH) at time of birth (clinically estimated or measured blood loss ≥ 1000 mL). 90
Analysis 1.4. Comparison 1 Active versus expectant management of 3rd stage of labour (all women), Outcome 4 MaternalHb < 9 g/dL 24-72 hours postpartum. . . . . . . . . . . . . . . . . . . . . . . . . . 91
Analysis 1.5. Comparison 1 Active versus expectant management of 3rd stage of labour (all women), Outcome 5 Admissionto neonatal special/intensive care. . . . . . . . . . . . . . . . . . . . . . . . . . . . 92
Analysis 1.6. Comparison 1 Active versus expectant management of 3rd stage of labour (all women), Outcome 6 Neonataljaundice requiring phototherapy or exchange transfusion. . . . . . . . . . . . . . . . . . . . 93
Analysis 1.10. Comparison 1 Active versus expectant management of 3rd stage of labour (all women), Outcome 10 Primaryblood loss ≥ 500 mL at time of birth (clinically estimated or measured). . . . . . . . . . . . . . 94
Analysis 1.13. Comparison 1 Active versus expectant management of 3rd stage of labour (all women), Outcome 13 Meanmaternal blood loss (mL) at time of birth (clinically estimated or measured). . . . . . . . . . . . . 95
Analysis 1.16. Comparison 1 Active versus expectant management of 3rd stage of labour (all women), Outcome 16Maternal blood transfusion. . . . . . . . . . . . . . . . . . . . . . . . . . . . . . 96
Analysis 1.18. Comparison 1 Active versus expectant management of 3rd stage of labour (all women), Outcome 18Therapeutic uterotonics during third stage and/or within 24 hours. . . . . . . . . . . . . . . . 97
Analysis 1.19. Comparison 1 Active versus expectant management of 3rd stage of labour (all women), Outcome 19 Meanlength of third stage. . . . . . . . . . . . . . . . . . . . . . . . . . . . . . . . 98
Analysis 1.20. Comparison 1 Active versus expectant management of 3rd stage of labour (all women), Outcome 20 Manualremoval of placenta as defined by study authors. . . . . . . . . . . . . . . . . . . . . . . 99
Analysis 1.21. Comparison 1 Active versus expectant management of 3rd stage of labour (all women), Outcome 21Postnatal diastolic blood pressure > 90 mmHg between birth of baby and discharge from the labour ward. . . 100
Analysis 1.22. Comparison 1 Active versus expectant management of 3rd stage of labour (all women), Outcome 22Postnatal vomiting between birth of baby and discharge from the labour ward. . . . . . . . . . . . 101
Analysis 1.23. Comparison 1 Active versus expectant management of 3rd stage of labour (all women), Outcome 23 Anyanalgesia between birth of the baby and discharge from labour ward. . . . . . . . . . . . . . . . 102
Analysis 1.25. Comparison 1 Active versus expectant management of 3rd stage of labour (all women), Outcome 25Secondary blood loss/any vaginal bleeding needing treatment (after 24 hours and up to 6 weeks). . . . . . 103
Analysis 1.27. Comparison 1 Active versus expectant management of 3rd stage of labour (all women), Outcome 27 Surgicalevacuation of retained products of conception. . . . . . . . . . . . . . . . . . . . . . . 104
Analysis 1.28. Comparison 1 Active versus expectant management of 3rd stage of labour (all women), Outcome 28Afterpains - abdominal pain associated with the contracting uterus in the postpartum period. . . . . . . 105
Analysis 1.29. Comparison 1 Active versus expectant management of 3rd stage of labour (all women), Outcome 29 Apgarscore < 7 at 5 minutes. . . . . . . . . . . . . . . . . . . . . . . . . . . . . . . . 106
iActive versus expectant management for women in the third stage of labour (Review)
Copyright © 2019 The Cochrane Collaboration. Published by John Wiley & Sons, Ltd.

Analysis 1.30. Comparison 1 Active versus expectant management of 3rd stage of labour (all women), Outcome 30Birthweight. . . . . . . . . . . . . . . . . . . . . . . . . . . . . . . . . . . 107
Analysis 1.38. Comparison 1 Active versus expectant management of 3rd stage of labour (all women), Outcome 38Exclusive breastfeeding at discharge from hospital. . . . . . . . . . . . . . . . . . . . . . 108
Analysis 1.40. Comparison 1 Active versus expectant management of 3rd stage of labour (all women), Outcome 40 Returnto hospital as in- or outpatient because of bleeding (not pre-specified). . . . . . . . . . . . . . . 109
Analysis 1.41. Comparison 1 Active versus expectant management of 3rd stage of labour (all women), Outcome 41Postnatal maternal mean Hb (outcome not pre-specified). . . . . . . . . . . . . . . . . . . 110
Analysis 2.1. Comparison 2 Active versus expectant management of 3rd stage of labour (women at low risk), Outcome 1Severe primary PPH at time of birth (clinically estimated or measured blood loss ≥ 1000 mL). . . . . . . 111
Analysis 2.4. Comparison 2 Active versus expectant management of 3rd stage of labour (women at low risk), Outcome 4Maternal Hb < 9 g/dL at 24-72 hr. . . . . . . . . . . . . . . . . . . . . . . . . . . 112
Analysis 2.5. Comparison 2 Active versus expectant management of 3rd stage of labour (women at low risk), Outcome 5Admission to neonatal special/intensive care. . . . . . . . . . . . . . . . . . . . . . . . 113
Analysis 2.6. Comparison 2 Active versus expectant management of 3rd stage of labour (women at low risk), Outcome 6Neonatal jaundice requiring phototherapy or exchange transfusion. . . . . . . . . . . . . . . . 114
Analysis 2.10. Comparison 2 Active versus expectant management of 3rd stage of labour (women at low risk), Outcome 10Primary blood loss ≥ 500 mL at time of birth (clinically estimated or measured). . . . . . . . . . . 115
Analysis 2.13. Comparison 2 Active versus expectant management of 3rd stage of labour (women at low risk), Outcome 13Mean maternal blood loss (mL at the time of birth, clinically estimated or measured. . . . . . . . . . 116
Analysis 2.16. Comparison 2 Active versus expectant management of 3rd stage of labour (women at low risk), Outcome 16Maternal blood transfusion. . . . . . . . . . . . . . . . . . . . . . . . . . . . . . 117
Analysis 2.18. Comparison 2 Active versus expectant management of 3rd stage of labour (women at low risk), Outcome 18Therapeutic uterotonics during third stage and/or within 24 hours. . . . . . . . . . . . . . . . 118
Analysis 2.19. Comparison 2 Active versus expectant management of 3rd stage of labour (women at low risk), Outcome 19Mean length of third stage. . . . . . . . . . . . . . . . . . . . . . . . . . . . . . 119
Analysis 2.20. Comparison 2 Active versus expectant management of 3rd stage of labour (women at low risk), Outcome 20Manual removal of placenta as defined by study authors. . . . . . . . . . . . . . . . . . . . 120
Analysis 2.21. Comparison 2 Active versus expectant management of 3rd stage of labour (women at low risk), Outcome 21Postnatal diastolic blood pressure > 90 mmHg between birth of baby and discharge from the labour ward. . . 121
Analysis 2.22. Comparison 2 Active versus expectant management of 3rd stage of labour (women at low risk), Outcome 22Postnatal vomiting between birth of baby and discharge from the labour ward.. . . . . . . . . . . . 122
Analysis 2.23. Comparison 2 Active versus expectant management of 3rd stage of labour (women at low risk), Outcome 23Any analgesia between birth of the baby and up to discharge from labour ward. . . . . . . . . . . . 123
Analysis 2.25. Comparison 2 Active versus expectant management of 3rd stage of labour (women at low risk), Outcome 25Secondary blood loss/any vaginal bleeding needing treatment (after 24 hours and up to 6 weeks). . . . . . 124
Analysis 2.27. Comparison 2 Active versus expectant management of 3rd stage of labour (women at low risk), Outcome 27Surgical evacuation of retained products of conception. . . . . . . . . . . . . . . . . . . . 125
Analysis 2.28. Comparison 2 Active versus expectant management of 3rd stage of labour (women at low risk), Outcome 28Afterpains - abdominal pain associated with the contracting uterus in the postpartum period. . . . . . . 126
Analysis 2.30. Comparison 2 Active versus expectant management of 3rd stage of labour (women at low risk), Outcome 30Birthweight. . . . . . . . . . . . . . . . . . . . . . . . . . . . . . . . . . . 127
Analysis 2.40. Comparison 2 Active versus expectant management of 3rd stage of labour (women at low risk), Outcome 40Return to hospital as in- or outpatient because of bleeding (not pre-specified). . . . . . . . . . . . . 128
Analysis 2.41. Comparison 2 Active versus expectant management of 3rd stage of labour (women at low risk), Outcome 41Postnatal maternal mean Hb (outcome not pre-specified). . . . . . . . . . . . . . . . . . . 129
Analysis 5.8. Comparison 5 Active versus mixed management of 3rd stage (delayed uterotonic, delayed cord clamping, nocontrolled cord traction), Outcome 8 Maternal blood transfusion. . . . . . . . . . . . . . . . . 130
Analysis 5.9. Comparison 5 Active versus mixed management of 3rd stage (delayed uterotonic, delayed cord clamping, nocontrolled cord traction), Outcome 9 Therapeutic uterotonics during third stage and/or within 24 hours. . . 131
Analysis 5.10. Comparison 5 Active versus mixed management of 3rd stage (delayed uterotonic, delayed cord clamping, nocontrolled cord traction), Outcome 10 Mean length of third stage. . . . . . . . . . . . . . . . 132
iiActive versus expectant management for women in the third stage of labour (Review)
Copyright © 2019 The Cochrane Collaboration. Published by John Wiley & Sons, Ltd.

Analysis 5.11. Comparison 5 Active versus mixed management of 3rd stage (delayed uterotonic, delayed cord clamping, nocontrolled cord traction), Outcome 11 Manual removal of placenta as defined by study authors. . . . . . 133
Analysis 5.12. Comparison 5 Active versus mixed management of 3rd stage (delayed uterotonic, delayed cord clamping, nocontrolled cord traction), Outcome 12 Surgical evacuation of retained products of conception. . . . . . . 134
Analysis 5.13. Comparison 5 Active versus mixed management of 3rd stage (delayed uterotonic, delayed cord clamping, nocontrolled cord traction), Outcome 13 Birthweight. . . . . . . . . . . . . . . . . . . . . . 135
Analysis 5.14. Comparison 5 Active versus mixed management of 3rd stage (delayed uterotonic, delayed cord clamping, nocontrolled cord traction), Outcome 14 Postnatal maternal mean Hb. . . . . . . . . . . . . . . . 136
Analysis 9.1. Comparison 9 Active versus mixed management (uterotonic after placental delivery, immediate cord clampingand no controlled cord traction) , Outcome 1 Severe primary PPH at time of birth (clinically estimated or measuredblood loss ≥ 1000 mL). . . . . . . . . . . . . . . . . . . . . . . . . . . . . . . 137
Analysis 9.10. Comparison 9 Active versus mixed management (uterotonic after placental delivery, immediate cordclamping and no controlled cord traction) , Outcome 10 Primary blood loss ≥ 500 mL at time of birth (clinicallyestimated or measured). . . . . . . . . . . . . . . . . . . . . . . . . . . . . . . 138
Analysis 9.16. Comparison 9 Active versus mixed management (uterotonic after placental delivery, immediate cordclamping and no controlled cord traction) , Outcome 16 Maternal blood transfusion. . . . . . . . . . 139
Analysis 9.17. Comparison 9 Active versus mixed management (uterotonic after placental delivery, immediate cordclamping and no controlled cord traction) , Outcome 17 Clinical signs of severe blood loss. . . . . . . . 140
Analysis 9.18. Comparison 9 Active versus mixed management (uterotonic after placental delivery, immediate cordclamping and no controlled cord traction) , Outcome 18 Therapeutic uterotonics during third stage and/or within24 hours. . . . . . . . . . . . . . . . . . . . . . . . . . . . . . . . . . . . 141
Analysis 9.19. Comparison 9 Active versus mixed management (uterotonic after placental delivery, immediate cordclamping and no controlled cord traction) , Outcome 19 Mean length of third stage. . . . . . . . . . 142
Analysis 10.1. Comparison 10 Active versus mixed management (no routine uterotonic, early cord clamping, no controlledcord traction), Outcome 1 Severe primary PPH at time of birth (clinically estimated or measured blood loss ≥ 1000mL). . . . . . . . . . . . . . . . . . . . . . . . . . . . . . . . . . . . . . 143
Analysis 10.4. Comparison 10 Active versus mixed management (no routine uterotonic, early cord clamping, no controlledcord traction), Outcome 4 Maternal Hb < 9 g/dL at 24-72 hr. . . . . . . . . . . . . . . . . . 144
Analysis 10.10. Comparison 10 Active versus mixed management (no routine uterotonic, early cord clamping, no controlledcord traction), Outcome 10 Primary blood loss ≥ 500 mL at time of birth (clinically estimated or measured). . 145
Analysis 10.13. Comparison 10 Active versus mixed management (no routine uterotonic, early cord clamping, no controlledcord traction), Outcome 13 Mean maternal blood loss (mL) at time of birth (clinically estimated or measured). 146
Analysis 10.16. Comparison 10 Active versus mixed management (no routine uterotonic, early cord clamping, no controlledcord traction), Outcome 16 Maternal blood transfusion. . . . . . . . . . . . . . . . . . . . 147
Analysis 10.18. Comparison 10 Active versus mixed management (no routine uterotonic, early cord clamping, no controlledcord traction), Outcome 18 Therapeutic uterotonics during third stage and/or within 24 hours. . . . . . 148
Analysis 10.19. Comparison 10 Active versus mixed management (no routine uterotonic, early cord clamping, no controlledcord traction), Outcome 19 Mean length of third stage. . . . . . . . . . . . . . . . . . . . 149
Analysis 10.20. Comparison 10 Active versus mixed management (no routine uterotonic, early cord clamping, no controlledcord traction), Outcome 20 Manual removal of placenta as defined by study authors. . . . . . . . . . 150
Analysis 10.28. Comparison 10 Active versus mixed management (no routine uterotonic, early cord clamping, no controlledcord traction), Outcome 28 Not prespecified: afterpains at 2 hours after birth (id 20458). . . . . . . . 151
Analysis 10.29. Comparison 10 Active versus mixed management (no routine uterotonic, early cord clamping, no controlledcord traction), Outcome 29 Not pre-specified: afterpains the day after birth (id 20458). . . . . . . . . 152
Analysis 10.31. Comparison 10 Active versus mixed management (no routine uterotonic, early cord clamping, no controlledcord traction), Outcome 31 Birthweight. . . . . . . . . . . . . . . . . . . . . . . . . 153
Analysis 10.42. Comparison 10 Active versus mixed management (no routine uterotonic, early cord clamping, no controlledcord traction), Outcome 42 Postnatal maternal mean Hb (outcome not pre-specified). . . . . . . . . . 154
Analysis 10.43. Comparison 10 Active versus mixed management (no routine uterotonic, early cord clamping, no controlledcord traction), Outcome 43 Severe primary PPH after placental delivery and up to 2 hours (clinically estimated ormeasured blood loss ≥ 1000 mL) - not pre-specified. . . . . . . . . . . . . . . . . . . . . 155
iiiActive versus expectant management for women in the third stage of labour (Review)
Copyright © 2019 The Cochrane Collaboration. Published by John Wiley & Sons, Ltd.

Analysis 10.44. Comparison 10 Active versus mixed management (no routine uterotonic, early cord clamping, no controlledcord traction), Outcome 44 Severe primary PPH at time of birth and up to 2 hours (clinically estimated or measuredblood loss ≥1000 mL) - not pre-specified. . . . . . . . . . . . . . . . . . . . . . . . . 156
Analysis 10.45. Comparison 10 Active versus mixed management (no routine uterotonic, early cord clamping, no controlledcord traction), Outcome 45 Mean blood loss (mL) (clinically estimated or measured at birth and up to 2 hours (notpre-specified). . . . . . . . . . . . . . . . . . . . . . . . . . . . . . . . . . . 157
Analysis 11.4. Comparison 11 Active versus mixed management (no routine uterotonic, early cord clamping, controlledcord traction), Outcome 4 Maternal Hb < 9 g/dL at 24-72 hr. . . . . . . . . . . . . . . . . . 158
Analysis 11.19. Comparison 11 Active versus mixed management (no routine uterotonic, early cord clamping, controlledcord traction), Outcome 19 Mean length of third stage. . . . . . . . . . . . . . . . . . . . 159
Analysis 11.20. Comparison 11 Active versus mixed management (no routine uterotonic, early cord clamping, controlledcord traction), Outcome 20 Manual removal of placenta as defined by study authors. . . . . . . . . . 160
160ADDITIONAL TABLES . . . . . . . . . . . . . . . . . . . . . . . . . . . . . . . . . .163APPENDICES . . . . . . . . . . . . . . . . . . . . . . . . . . . . . . . . . . . . .163FEEDBACK . . . . . . . . . . . . . . . . . . . . . . . . . . . . . . . . . . . . . .165WHAT’S NEW . . . . . . . . . . . . . . . . . . . . . . . . . . . . . . . . . . . . .165HISTORY . . . . . . . . . . . . . . . . . . . . . . . . . . . . . . . . . . . . . . .166CONTRIBUTIONS OF AUTHORS . . . . . . . . . . . . . . . . . . . . . . . . . . . . .166DECLARATIONS OF INTEREST . . . . . . . . . . . . . . . . . . . . . . . . . . . . . .167SOURCES OF SUPPORT . . . . . . . . . . . . . . . . . . . . . . . . . . . . . . . . .167DIFFERENCES BETWEEN PROTOCOL AND REVIEW . . . . . . . . . . . . . . . . . . . . .169INDEX TERMS . . . . . . . . . . . . . . . . . . . . . . . . . . . . . . . . . . . .
ivActive versus expectant management for women in the third stage of labour (Review)
Copyright © 2019 The Cochrane Collaboration. Published by John Wiley & Sons, Ltd.

[Intervention Review]
Active versus expectant management for women in the thirdstage of labour
Cecily M Begley1, Gillian ML Gyte2, Declan Devane3, William McGuire4, Andrew Weeks5, Linda M Biesty3
1School of Nursing and Midwifery, Trinity College Dublin, Dublin, Ireland. 2Cochrane Pregnancy and Childbirth Group, Departmentof Women’s and Children’s Health, University of Liverpool, Liverpool, UK. 3School of Nursing and Midwifery, National Universityof Ireland Galway, Galway, Ireland. 4Centre for Reviews and Dissemination, University of York, York, UK. 5Department of Women’sand Children’s Health, The University of Liverpool, Liverpool, UK
Contact address: Cecily M Begley, School of Nursing and Midwifery, Trinity College Dublin, 24 D’Olier Street, Dublin, [email protected].
Editorial group: Cochrane Pregnancy and Childbirth Group.Publication status and date: New search for studies and content updated (no change to conclusions), published in Issue 2, 2019.
Citation: Begley CM, Gyte GML, Devane D, McGuire W, Weeks A, Biesty LM. Active versus expectant management forwomen in the third stage of labour. Cochrane Database of Systematic Reviews 2019, Issue 2. Art. No.: CD007412. DOI:10.1002/14651858.CD007412.pub5.
Copyright © 2019 The Cochrane Collaboration. Published by John Wiley & Sons, Ltd.
A B S T R A C T
Background
Active management of the third stage of labour involves giving a prophylactic uterotonic, early cord clamping and controlled cordtraction to deliver the placenta. With expectant management, signs of placental separation are awaited and the placenta is deliveredspontaneously. Active management was introduced to try to reduce haemorrhage, a major contributor to maternal mortality in low-income countries. This is an update of a review last published in 2015.
Objectives
To compare the effects of active versus expectant management of the third stage of labour on severe primary postpartum haemorrhage(PPH) and other maternal and infant outcomes.
To compare the effects of variations in the packages of active and expectant management of the third stage of labour on severe primaryPPH and other maternal and infant outcomes.
Search methods
For this update, we searched Cochrane Pregnancy and Childbirth’s Trials Register, ClinicalTrials.gov and the World health OrganizationInternational Clinical Trials Registry Platform (ICTRP), on 22 January 2018, and reference lists of retrieved studies.
Selection criteria
Randomised and quasi-randomised controlled trials comparing active versus expectant management of the third stage of labour. Cluster-randomised trials were eligible for inclusion, but none were identified.
Data collection and analysis
Two review authors independently assessed the studies for inclusion, assessed risk of bias, carried out data extraction and assessed thequality of the evidence using the GRADE approach.
1Active versus expectant management for women in the third stage of labour (Review)
Copyright © 2019 The Cochrane Collaboration. Published by John Wiley & Sons, Ltd.

Main results
We included eight studies, involving analysis of data from 8892 women. The studies were all undertaken in hospitals, seven in higher-income countries and one in a lower-income country. Four studies compared active versus expectant management, and four comparedactive versus a mixture of managements. We used a random-effects model in the analyses because of clinical heterogeneity. Of theeight studies included, we considered three studies as having low risk of bias in the main aspects of sequence generation, allocationconcealment and completeness of data collection. There was an absence of high-quality evidence according to GRADE assessments forour primary outcomes, which is reflected in the cautious language below.
The evidence suggested that, for women at mixed levels of risk of bleeding, it is uncertain whether active management reduces theaverage risk of maternal severe primary PPH (more than 1000 mL) at time of birth (average risk ratio (RR) 0.34, 95% confidenceinterval (CI) 0.14 to 0.87, 3 studies, 4636 women, I2 = 60%; GRADE: very low quality). For incidence of maternal haemoglobin(Hb) less than 9 g/dL following birth, active management of the third stage may reduce the number of women with anaemia after birth(average RR 0.50, 95% CI 0.30 to 0.83, 2 studies, 1572 women; GRADE: low quality). We also found that active management ofthe third stage may make little or no difference to the number of babies admitted to neonatal units (average RR 0.81, 95% CI 0.60 to1.11, 2 studies, 3207 infants; GRADE: low quality). It is uncertain whether active management of the third stage reduces the numberof babies with jaundice requiring treatment (RR 0.96, 95% CI 0.55 to 1.68, 2 studies, 3142 infants, I2 = 66%; GRADE: very lowquality). There were no data on our other primary outcomes of very severe PPH at the time of birth (more than 2500 mL), maternalmortality, or neonatal polycythaemia needing treatment.
Active management reduces mean maternal blood loss at birth and probably reduces the rate of primary blood loss greater than 500mL, and the use of therapeutic uterotonics. Active management also probably reduces the mean birthweight of the baby, reflecting thelower blood volume from interference with placental transfusion. In addition, it may reduce the need for maternal blood transfusion.However, active management may increase maternal diastolic blood pressure, vomiting after birth, afterpains, use of analgesia frombirth up to discharge from the labour ward, and more women returning to hospital with bleeding (outcome not pre-specified).
In the comparison of women at low risk of excessive bleeding, there were similar findings, except it was uncertain whether there wasa difference identified between groups for severe primary PPH (average RR 0.31, 95% CI 0.05 to 2.17; 2 studies, 2941 women, I2 =71%), maternal Hb less than 9 g/dL at 24 to 72 hours (average RR 0.17, 95% CI 0.02 to 1.47; 1 study, 193 women) or the need forneonatal admission (average RR 1.02, 95% CI 0.55 to 1.88; 1 study, 1512 women). In this group, active management may make littledifference to the rate of neonatal jaundice requiring phototherapy (average RR 1.31, 95% CI 0.78 to 2.18; 1 study, 1447 women).
Hypertension and interference with placental transfusion might be avoided by using modifications to the active management package,for example, omitting ergot and deferring cord clamping, but we have no direct evidence of this here.
Authors’ conclusions
Although the data appeared to show that active management reduced the risk of severe primary PPH greater than 1000 mL at the timeof birth, we are uncertain of this finding because of the very low-quality evidence. Active management may reduce the incidence ofmaternal anaemia (Hb less than 9 g/dL) following birth, but harms such as postnatal hypertension, pain and return to hospital due tobleeding were identified.
In women at low risk of excessive bleeding, it is uncertain whether there was a difference between active and expectant managementfor severe PPH or maternal Hb less than 9 g/dL (at 24 to 72 hours). Women could be given information on the benefits and harmsof both methods to support informed choice. Given the concerns about early cord clamping and the potential adverse effects of someuterotonics, it is critical now to look at the individual components of third-stage management. Data are also required from low-incomecountries.
It must be emphasised that this review includes only a small number of studies with relatively small numbers of participants, and thequality of evidence for primary outcomes is low or very low.
P L A I N L A N G U A G E S U M M A R Y
Delivering the placenta in the third stage of labour
What is the issue?
2Active versus expectant management for women in the third stage of labour (Review)
Copyright © 2019 The Cochrane Collaboration. Published by John Wiley & Sons, Ltd.

The aim of this Cochrane Review was to look at different ways of delivering the placenta after the birth of the baby; expectant, active ormixed management. We asked, what are the benefits and harms for all women, but specifically for women at low risk of severe bleeding(haemorrhage)? We collected and analysed all relevant studies to answer this question (22 January 2018).
Why is this important?
Once a baby is born, the womb (uterus) continues to contract, causing the placenta to separate from the wall of the uterus. The motherthen delivers the placenta, or ’after-birth’. This is called expectant management of third stage of labour. Active management of thirdstage involves three components: 1) giving a drug (a uterotonic) to help contract the uterus; 2) clamping the cord early (usually before,alongside, or immediately after giving the uterotonic); 3) traction is applied to the cord with counter-pressure on the uterus to deliverthe placenta (controlled cord traction). Mixed management uses some, but not all, of the three components. Active management wasintroduced to try to reduce severe blood loss at birth. This is a major cause of women dying in low-income countries where women aremore likely to be poorly nourished, anaemic and have infectious diseases. In high-income countries, severe bleeding occurs much lessoften, yet active management has become standard practice in many countries.
What evidence did we find?
We found eight studies that contributed data and involved 8892 women and their babies. All studies were undertaken in hospitalsettings, seven in higher-income countries and one in a lower-income country. Four studies compared active with expectant managementand four compared active with mixed management.
Overall, the quality of the evidence was generally low or very low and we need more data to be confident in the findings. For allwomen, irrespective of their risk of severe bleeding, active management may reduce severe bleeding and anaemia. However, it also mayreduce the baby’s birthweight and increase the mother’s blood pressure, afterpains, vomiting, and the number of women returning tohospital with bleeding. Findings were similar for women at low risk of bleeding, though it was unclear if there was any difference inthe incidence of severe bleeding or anaemia.
What does this mean?
Women should be given information before they give birth to help them make informed choices. Some adverse effects experienced bymothers may possibly be avoided by using specific drugs. Delaying cord clamping may benefit the baby by preventing the reduction inbirthweight from early cord clamping, but more research is needed. Also, it may be that just giving a uterotonic might reduce severebleeding, without using the other parts of active management. More research is needed, particularly in low-income countries.
3Active versus expectant management for women in the third stage of labour (Review)
Copyright © 2019 The Cochrane Collaboration. Published by John Wiley & Sons, Ltd.

S U M M A R Y O F F I N D I N G S F O R T H E M A I N C O M P A R I S O N [Explanation]
Active versus expectant management of the third stage of labour (all women)
Population: all women who expected a vaginal birth at 24 weeks’ gestat ion or later and their babies
Setting: UK and Ireland, hospital sett ing. The countries were classif ied as ’higher-income’ and ’lower-income’, with the border between lower-m iddle-income and upper-m iddle-
income being the cut-of f . All studies included in this main analysis were undertaken in higher-income countries (def ined according to World Bank def init ions 2018).
Intervention: act ive management of the third stage of labour
Comparison: expectant management of the third stage of labour
Outcomes Illustrative comparative risks* (95% CI) Relative effect
(95% CI)
No of participants
(studies)
Quality of the evidence
(GRADE)
Comments
Assumed risk Corresponding risk
Expectant manage-
ment of the third stage
of labour
Active management of
the third stage of
labour
Severe primary PPH
(clinically est imated or
measured blood loss ≥
1000 mL at t ime of
birth)
24 per 1000 8 per 1000
(3 to 21)
RR 0.34
(0.14 to 0.87)
4636
(3 studies)
⊕©©©
Very lowa
Very severe primary
PPH
(clinically est imated or
measured blood loss ≥
2500 mL at t ime of
birth)
See comment See comment Not est imable 0
(0 studies)
See comment No data
Maternal mortality See comment See comment Not est imable 0
(0 studies)
See comment No data
Maternal Hb < 9 g/dL
24-72 hours postpar-
tum
71 per 1000 36 per 1000
(21 to 59)
RR 0.50
(0.3 to 0.83)
1572
(2 studies)
⊕⊕©©
Lowb
4A
ctiv
eversu
sexp
ecta
nt
man
agem
en
tfo
rw
om
en
inth
eth
irdsta
ge
of
lab
ou
r(R
evie
w)
Co
pyrig
ht
©2019
Th
eC
och
ran
eC
olla
bo
ratio
n.P
ub
lished
by
Joh
nW
iley
&S
on
s,L
td.

Admission to SCBU/
NICU
52 per 1000 42 per 1000
(31 to 58)
RR 0.81
(0.60 to 1.11)
3207
(2 studies)
⊕⊕©©
Lowc
Neonatal jaundice re-
quiring phototherapy
or exchange transfu-
sion
49 per 1000 47 per 1000
(27 to 83)
RR 0.96
(0.55 to 1.68)
3142
(2 studies)
⊕©©©
Very lowd
Neonatal
polycythaemia treated
with dilutional ex-
change transfusion
See comment See comment Not est imable 0
(0 studies)
See comment No data
* The basis for the assumed risk (e.g. the median control group risk across studies) is provided in footnotes. The corresponding risk (and its 95% conf idence interval) is
based on the assumed risk in the comparison group and the relative effect of the intervent ion (and its 95%CI).
CI: conf idence interval; Hb: haemoglobin; NICU: neonatal intensive care unit ; PPH: primary postpartum haemorrhage; RR: risk rat io; SCBU: special care baby unit
GRADE Working Group grades of evidence
High quality: we are very conf ident that the true ef fect lies close to that of the est imate of the ef fect.
Moderate quality: we are moderately conf ident in the ef fect est imate: the true ef fect is likely to be close to the est imate of the ef fect, but there is a possibility that it is
substant ially dif f erent.
Low quality: our conf idence in the ef fect est imate is lim ited: the true ef fect may be substant ially dif f erent f rom the est imate of the ef fect.
Very low quality: we have very lit t le conf idence in the ef fect est imate: the true ef fect is likely to be substant ially dif f erent f rom the est imate of ef fect
aRisk of bias: of the three studies providing data for this outcome, all are at low risk of bias for sequence generat ion (select ion
bias) and allocat ion concealment (select ion bias). All are at high risk of bias for lack of blinding for clinicians and women
and all are unclear for blinding of outcome assessment. Two studies are at low risk of bias for incomplete outcome data
(attrit ion bias), and one is unclear. Two are at high risk of select ive report ing (report ing bias) and one is unclear. One study
is at high risk of other bias and two are unclear (see ’Risk of bias’ tables and Figure 2). Downgraded 1.
Inconsistency: there is some overlap of conf idence intervals of the three studies, however, Tau² = 0.38, the P value for the
Chi² test of heterogeneity is 0.08 and I² = 60%. These suggest the presence of heterogeneity, which cannot be explained by
any of the subgroups or sensit ivity analyses performed. Downgraded 1.
Indirectness: direct ly answers the quest ion.
Imprecision: total (cumulat ive) sample size 4636 is less than the opt imal information size of 18,590 (assuming α = 0.05, 1-β
= 0.80, relat ive risk reduct ion (RRR) of 25% f rom control event rate). Events = 88, Downgraded 1.
Publication bias: assessment of funnel plot asymmetry not performed due to fewer than 10 studies included for this outcome.
5A
ctiv
eversu
sexp
ecta
nt
man
agem
en
tfo
rw
om
en
inth
eth
irdsta
ge
of
lab
ou
r(R
evie
w)
Co
pyrig
ht
©2019
Th
eC
och
ran
eC
olla
bo
ratio
n.P
ub
lished
by
Joh
nW
iley
&S
on
s,L
td.

bRisk of bias: of the two studies providing data for this outcome, both are at low risk of bias for sequence generat ion
(select ion bias) and one is at low risk of bias for allocat ion concealment (select ion bias) and the other is unclear. Both are at
high risk of bias for lack of blinding of clinicians and women, both are unclear for blinding of outcome assessment (although
unlikely to af fect Hb measurements). One is at high risk of bias for incomplete outcome data (attrit ion bias) while the other is
unclear. One is high risk of bias for select ive report ing (report ing bias), the other is unclear. Both studies are at high risk of
other bias (see ’Risk of bias’ tables and Figure 2). Downgraded 1.
Inconsistency: the conf idence intervals of the two studies overlap. Tau² = 0.02, the P value for the Chi² test of heterogeneity
is 0.31 and I² = 3%. Although Tau² is non-zero, tests suggest an absence of unexplained heterogeneity.
Indirectness: direct ly answers the quest ion.
Imprecision: total (cumulat ive) sample size 1572 is less than the opt imal information size of 5804 (assuming α = 0.05, 1-β =
0.80, RRR of 25% f rom control event rate). Events = 94. Downgraded 1.
Publication bias: assessment of funnel plot asymmetry not performed due to fewer than 10 studies included for this outcome.cRisk of bias: of the two studies providing data for this outcome, both are at low risk of bias for sequence generat ion
(select ion bias) and allocat ion concealment (select ion bias). Both are at high risk of bias for lack of blinding of clinicians
and women, both are unclear for blinding of outcome assessment. One is at low risk of bias for incomplete outcome data
(attrit ion bias), the other is unclear. Both are at high risk of bias for select ive report ing (report ing bias) and both are at high
risk for other biases (see ’Risk of bias’ tables and Figure 2). Downgraded 1.
Inconsistency: the conf idence intervals of the two studies overlap. Heterogeneity: Tau² = 0.00; Chi² P value = 0.40, I² = 0%.
This suggests an absence of unexplained heterogeneity.
Indirectness: direct ly answers the quest ion.
Imprecision: total (cumulat ive) sample size 3207 is less than the opt imal information size of 8066 (assuming α = 0.05, 1-β =
0.80, RRR of 25% f rom control event rate). Events = 152. Downgrade 1
Publication bias: assessment of funnel plot asymmetry not performed due to fewer than 10 studies included for this outcome.dRisk of bias: of the two studies providing data for this outcome, both are at low risk of bias for sequence generat ion
(select ion bias) and allocat ion concealment (select ion bias). Both are at high risk of bias for lack of blinding of clinicians and
women, both are unclear for blinding of outcome assessment. One is low risk of bias for incomplete outcome data (attrit ion
bias), the other is unclear. Both are at high risk of bias for select ive report ing (report ing bias) and both are at high risk of
other biases (see ’Risk of bias’ tables and Figure 2). Downgraded 1.
Inconsistency: there is some overlap of conf idence intervals of the two studies. However, Tau² = 0.11, P value for heterogeneity
= 0.09 and I² = 66%, which suggest the presence of heterogeneity that cannot be explained by any of the subgroups or
sensit ivity analyses performed. Downgraded 1.
Indirectness: direct ly answers the quest ion.
Imprecision: total (cumulat ive) sample size 3142 is less than the opt imal information size of 8584 (assuming α = 0.05, 1-β =
0.80, RRR of 25% f rom control event rate). Events = 149. Downgraded 1.
Publication bias: assessment of funnel plot asymmetry not performed due to fewer than 10 studies included for this outcome.
6A
ctiv
eversu
sexp
ecta
nt
man
agem
en
tfo
rw
om
en
inth
eth
irdsta
ge
of
lab
ou
r(R
evie
w)
Co
pyrig
ht
©2019
Th
eC
och
ran
eC
olla
bo
ratio
n.P
ub
lished
by
Joh
nW
iley
&S
on
s,L
td.

B A C K G R O U N D
Description of the condition
The third stage of labour is the time from the birth of the baby tothe expulsion of the placenta and membranes. Once the baby isborn, the uterus continues to contract and reduce in size. There isa lack of full understanding of the physiology of the third stage oflabour, but recent work using ultrasonography has demonstratedthat the process of placental separation has three distinct phases(Herman 2002). The first, or latent phase, consists of strong uter-ine contractions, which lead to thickening of the uterine muscle,thus causing a shearing force to occur between the elastic uter-ine wall and the more rigid placenta (Herman 2002). Continuedcontractions lead to gradual separation of the placenta, commenc-ing at one of the poles (most commonly the lower) and spread-ing slowly during the contraction or detachment phase until fullseparation occurs. This is followed by delivery of the placenta inthe expulsion phase (Herman 2002). Muscle fibres surroundingthe maternal vessels contract to prevent excessive bleeding (Inch1985), and the mother’s coagulation system is activated temporar-ily (Bonnar 1970).There is always some blood loss during the third stage of labouras the placenta separates and is delivered, but what might be con-sidered a normal amount of loss is the subject of debate (Gyte1992). Nevertheless, some women can suffer from considerableblood loss during or after the third stage of labour. This can bea primary haemorrhage (within the first 24 hours; Mousa 2014),or a secondary haemorrhage (between 24 hours and six weeks;McDonald 2003). Postpartum haemorrhage (PPH) is commonlydefined as a blood loss in excess of 500 mL (WHO 2003), with se-vere haemorrhage being a loss of 1000 mL or more and very severehaemorrhage being a loss of 2500 mL or more (Bloomfield 1990;Greer 1998; Penney 2005). However, the impact of blood loss atbirth on an individual woman can vary considerably and will de-pend not only on the volume of blood lost, but also on her generalstate of health, the speed of the loss, her haemoglobin (Hb) levelsat the time and her coagulation system. It is well documented thatblood loss is consistently under- or over-estimated by clinicians(Razvi 2008), although many centres do try to measure and recordblood loss accurately. In well-nourished women, some considerthat, in general, there is little impact from a blood loss of 500 mL(Bloomfield 1990), this being equivalent to a routine blood dona-tion (Burnley 2006), but in women in low-income countries whomay be poorly nourished and anaemic, this loss can cause consider-able morbidity or mortality. It has been estimated that at least 25%of maternal deaths in a number of countries are due to haemor-rhage; most due to PPH (Abouzaher 1998; Khan 2006). The vastmajority of these happen in the developing world, and PPH is theleading cause of maternal mortality in sub-Saharan Africa (Lazarus2005). However, a study in Mexico (Romero-Gutierrez 2007), re-ported that while the leading cause of maternal death was haemor-
rhage, two-thirds of bleeding-related deaths resulted from placen-tal abruption, placenta accreta, placenta praevia, and peripartumhysterectomy, rather than uterine atony (poor contraction of themuscles in the uterus). Significant morbidity does occur, though,from major bleeding due to uterine atony, which is far more com-mon than the other causes of bleeding listed above. The serious-ness with which PPH is viewed by professionals is evidenced injoint policy statements between the International Confederationof Midwives (ICM) and the International Federation of Gynae-cology and Obstetrics (FIGO) (ICM-FIGO 2003; ICM-FIGO2006), and the World Health Organization (WHO 2003), all ofwhich have recommended active management of the third stageof labour. Debate continues among women and practitioners onthe optimum method of management of the third stage of labourto balance the benefits and harms.There are two distinct approaches to the clinical management ofthe third stage of labour: expectant and active management. How-ever, a third approach is sometimes used that consists of a combi-nation of components of both expectant and active management:this has been referred to as ’mixed management’ or the ’piecemealapproach’ (Prendiville 1989). Expectant, active and mixed man-agement approaches, and comparisons of different types of activemanagement, have been the subject of a number of critical reviews(Elbourne 1995; Gyte 1994; Maughan 2006; McDonald 2007a;Prendiville 1989; Prendiville 1996; Soltani 2008).
Description of the intervention
(a) Expectant management of the third stage of
labour
Expectant management is also known as conservative or physio-logical management and is popular in some northern Europeancountries (Nordstrom 1997), and in New Zealand (Dixon 2013).It is also practised on occasion in midwife-led units and in homebirths in the UK and Ireland (Begley 2009; Blackburn 2008; Fry2007; Kanikosmay 2007), and is the usual practice when birthingat home or in the community in some low-income countries. Themain principle of expectant management is a ’hands off ’ approach,where signs of placental separation are awaited and the placenta isbirthed spontaneously or with the aid of gravity, maternal pushing(Begley 2012; Inch 1985) or, sometimes, nipple stimulation (Inch1985) hence:
1. a prophylactic uterotonic agent is not administered;2. ideally, the umbilical cord is neither clamped nor cut until
the placenta has been delivered but, at a minimum, caregivershave waited until cord pulsation has ceased; and
3. the placenta is delivered spontaneously with the aid ofgravity and sometimes by maternal effort (Begley 2012; Rogers1998).
7Active versus expectant management for women in the third stage of labour (Review)
Copyright © 2019 The Cochrane Collaboration. Published by John Wiley & Sons, Ltd.

There can be variations within expectant management. For exam-ple, some caregivers will wait for the placenta to be delivered beforeclamping and cutting the cord whilst others, for convenience, justwait until pulsation has finished. Breastfeeding or other means ofstimulating the physiological release of oxytocin, such as nipplestimulation, is sometimes also used (Bullough 1989), but is notan essential component of expectant management. Some ’expert’midwives will use gentle traction on the cord once the placenta isseen to be in the vagina (Begley 2012), with good results.
(b) Active management of the third stage of labour
In active management of the third stage of labour, the clini-cian intervenes by using the following package of interventions(Prendiville 1989):
1. the routine administration of a prophylactic uterotonicdrug just before, with, or immediately after, the birth of the baby;
2. early cord clamping and cutting* (i.e. prior to, alongside, orimmediately after administration of an oxytocic, which is beforecord pulsation ceases); and
3. controlled cord traction to deliver the placenta.*current WHO recommendations (WHO 2014), are to delay cordclamping, and the National Institute for Health and Clinical Excel-lence (NICE) now recommends “deferred” cord clamping (NICE2014).These interventions are implemented routinely and prophylacti-cally in an attempt to reduce the blood loss associated with thethird stage of labour and to reduce the risk of PPH. There aremany possible variations with this package of interventions.
1. There are different uterotonic drugs that can be used, forexample, oxytocin (intravenous (IV) or intramuscular (IM));syntometrine (IM); ergometrine (IV or IM); misoprostol (IM;Liabsuetrakul 2018; McDonald 2007b; Su 2012; Tunçalp 2012;Westhoff 2013), carbetocin, or paired combinations of thesedrugs (Gallos 2018). There is also debate over the route ofadministration and dosage of the drugs used. Recent guidelinesfrom WHO, FIGO, ICM and NICE all recommend the use of10 IU (international units) of oxytocin IM ((ICM-FIGO 2003;NICE 2014; WHO 2012). Misoprostol is potentially the mostimportant uterotonic for use in some low-income countriesbecause it is stable at ambient temperatures and is inexpensive(Parsons 2007). However, it does have adverse side effects(Mousa 2014), such as shivering, nausea and headaches, and ithas been shown to be less effective than other agents (Tunçalp2012). A recent network analysis, however, suggests that thethree most effective drugs for preventing PPH of 500 mL ormore are ergometrine and oxytocin, carbetocin, and misoprostolcombined with oxytocin (Gallos 2018).
2. There are differing timings for giving the prophylacticuterotonic drug, for example, with the crowning of the baby’shead; with the birth of the anterior shoulder; immediately afterthe birth of the baby; after the birth of the baby but before theplacenta is delivered (Harris 2004), and after the placenta is
delivered (Winter 2007). The timing of administration ofuterotonic drugs is the subject of another Cochrane Review(Soltani 2010).
3. There can be variation in the time when the cord isclamped and cut; this can be immediately the baby is born;within a set time after the birth, for example, within 30 secondsor a minute; or anytime before umbilical cord pulsation ceases(McDonald 2013; Rabe 2012; Van Rheenan 2007).
4. There are also different timings for the initiation ofcontrolled cord traction, such as waiting for signs of placentalseparation or not (McDonald 2003).
5. There can also be a delay in using the whole package ofactive management until after cord pulsation ceases, which hasbeen described as ‘delayed active management’ (Gyte 2006).
6. Some guidelines (e.g. ICM-FIGO 2003), add uterinemassage to the active management package although there islittle evidence to support this (Abdel-Aleem 2010).Placental cord drainage is sometimes used with active managementof the third stage. This involves releasing the clamp on the maternalend of the umbilical cord to allow the blood from the placentalside to drain, thus reducing the size of the placenta and therebyhoping to help separation and reduce the chance of a retainedplacenta (Prendiville 1989; Soltani 2011).Some of these variations in the components of active managementof the third stage of labour may no longer be considered goodpractice (e.g. early cord clamping), but may, nonetheless, be usedin included studies identified for this review.
(c) Mixed management of the third stage of labour
Mixed management of the third stage of labour, (or ’combined’or ’piecemeal’ management), which consists of a mixture of someof the components of both active and expectant management ofthe third stage, but without exclusively containing all the com-ponents of either. Although active management of the third stageis usually recommended (ICM-FIGO 2006; NICE 2014; WHO2003), there are many variations, and in practice some women mayactually receive mixed management (Harris 2006; Mercer 2000).Mixed management of the third stage might include, for example:(1) early uterotonic administration, cord clamping after pulsationceases and controlled cord traction; or (2) delayed uterotonic ad-ministration until cord pulsation ceases, then cord clamping andcontrolled cord traction. These forms of mixed management ofthe third stage are of interest because of the evidence of bene-fits from delayed cord clamping for the baby (McDonald 2013;Mercer 2008; Rabe 2012).
How the intervention might work
Expectant management
8Active versus expectant management for women in the third stage of labour (Review)
Copyright © 2019 The Cochrane Collaboration. Published by John Wiley & Sons, Ltd.

Expectant management of the third stage relies on the naturalcontractions of the uterus, stimulated by a surge of physiologicaloxytocin at birth, and anything that interferes with this oxytocinrelease may reduce the effectiveness of the physiological process inthe third stage (Inch 1985). Release of oxytocin can, for example,be inhibited by anxiety through the excess release of adrenaline(Buckley 2004).Hence, expectant management of the third stage of labour is com-monly only considered appropriate following a labour where therehas been no interference with the natural release of oxytocin, forexample, where oxytocin augmentation, induction, epidural ornarcotic analgesia, or both, have not been used (Buckley 2004;Fry 2007); but some will consider that these aspects still need tobe assessed in well-designed studies. This type of labour is morelikely when the woman has positive psychological support fromher midwife, or other trained supporter, who encourages her tolisten to her body’s messages about movement, positioning, hydra-tion and nutrition (Bohren 2017; Buckley 2004; Sandall 2016).
Active management
In active management of the third stage of labour, it is sug-gested that the prophylactic administration of a uterotonic willreduce bleeding and the risk of severe haemorrhage (Greer 1998;Prendiville 1989). The role of early cord clamping and controlledcord traction in the reduction of bleeding is less clear, but it isthought that once the uterotonic drug has been administered, itis important to deliver the placenta quickly to prevent it beingretained. Applying a clamp to the cord thus gives the caregiversomething to grasp in order to deliver the placenta quickly by ap-plying controlled cord traction. Active management of the thirdstage has been standard practice in many parts of the world formany years (Prendiville 1989). Recently, however, arguments havebeen put forward for a delay in cord clamping, pointing out that itis not an evidence-based part of the package of active management(Weeks 2007). A Cochrane Review found that neither early norlate cord clamping showed any significant difference in PPH rates(McDonald 2013).A number of Cochrane Reviews have been conducted examin-ing different aspects of active management of the third stage oflabour. These include reviews on prophylactic oxytocin in thethird stage of labour (Westhoff 2013); prophylactic ergometrine-oxytocin versus oxytocin for the third stage of labour (McDonald2007b); prophylactic use of ergot alkaloids in the third stage oflabour (Liabsuetrakul 2018); prostaglandins for preventing PPH(Tunçalp 2012); oxytocin agonists for preventing PPH (Su 2012);timing of cord clamping in term infants (McDonald 2013) andtiming of cord clamping in preterm infants (Rabe 2012).
Potential adverse effects
Interventions used in active management of the third stage havesome adverse effects, due mainly to the uterotonic drugs used andto the common practice of early clamping of the cord.Uterotonic drugs can increase the risk of hypertension, nausea andvomiting for women (Maughan 2006), and which appear to berelated to the use of ergometrine-based drugs. Active managementin many countries has moved away from ergometrine-based utero-tonics, for this reason, and possibly also due to clinicians’ fear ofretained placenta, although a review of ergometrine-based drugscompared with other uterotonics showed no difference in rates ofmanual removal of placentae (McDonald 2007b).The potential consequences for the newborn infant of active man-agement of the third stage of labour relate mainly to the timingof cord clamping. The effects on the neonate of early versus de-ferred cord clamping have been explored in Cochrane and othersystematic reviews (Hutton 2007; McDonald 2013; Rabe 2012).Early cord clamping reduces the volume of placental blood trans-fusion and thus reduces the baby’s blood volume at birth by about20% for term infants (RCOG 2009; Werner 2005). This resultsin lower blood haematocrit (HCT) levels and Hb concentrationsafter birth in term infants but the long-term importance of thiseffect is unknown (Hutton 2007; McDonald 2013; Prendiville1989; Van Rheenan 2007). Potentially, placental transfusion maybe more important for infants born in low- and middle-incomesettings where iron-deficiency anaemia exacerbated by nutritionaland infectious insults may have substantial and long-term adverseeffects on growth and development (Van Rheenan 2007). Forpreterm infants, another specific concern is the effect of postnatalplacental transfusion on neonatal haemodynamic transition pro-cesses. The Cochrane Review of early versus delayed cord clamp-ing for preterm infants found some evidence that infants who hadearly cord clamping had a higher risk of hypotension treated withvolume-transfusion and of intraventricular haemorrhage (Rabe2012).In contrast, early cord clamping also results in lower postnatal lev-els of plasma bilirubin and a lower incidence of neonatal jaun-dice that requires phototherapy (McDonald 2013; Rabe 2012).Treatment of neonatal jaundice may result in mother-infant sepa-ration that delays the initiation and establishment of breastfeedingand disrupts early neonatal metabolic adaptation (Mercer 2001).For infants born in low- or middle-income settings, or in ruralor remote settings distant from healthcare facilities, the need forphototherapy (or its lack of availability) may be of greater clinicalimportance.If uterotonic drugs are administered before delivery of the infant,for example, inadvertently prior to the birth of an undiagnosedtwin, then disruption of the placental-uterine wall interface andinterruption of placental-umbilical blood flow may cause acuteperinatal asphyxia compromising neonatal cardio-respiratory tran-sition. Newborn infants compromised at birth are more likely toneed transition support (cardio-respiratory resuscitation). If an as-phyxial insult has been severe or prolonged (for example, if ex-
9Active versus expectant management for women in the third stage of labour (Review)
Copyright © 2019 The Cochrane Collaboration. Published by John Wiley & Sons, Ltd.

acerbated by obstructed labour such as shoulder dystocia) thenother potential consequences may include neonatal encephalopa-thy, with its associated risk of mortality and long-term neurode-velopmental morbidity.
Why it is important to do this review
We undertook this review because of the need to determine ifactive, expectant management, or a mixed management package,was most likely to be of overall benefit. It is important to assess theimpact of all these forms of care on both the mother and baby. Webelieve that this review is highly relevant to families and clinicians,as women frequently enquire about the differences in third-stagemanagement during the antenatal period. This is an update ofreview last published in 2015 (Begley 2015).
O B J E C T I V E S
1. To compare the effects of active versus expectantmanagement of the third stage of labour on severe primarypostpartum haemorrhage (PPH) and other maternal and infantoutcomes.
2. To compare the effects of variations in the packages ofactive and expectant management of the third stage of labour onsevere primary PPH and other maternal and infant outcomes.
M E T H O D S
Criteria for considering studies for this review
Types of studies
We included all randomised, and quasi-randomised, controlledtrials of active versus expectant management of the third stage oflabour. Cluster-randomised trials were eligible for inclusion, butnone were identified.
Types of participants
All women who expected a vaginal birth at 24 weeks’ gestation orlater. We looked at women in higher-income settings separatelyfrom women in lower-income settings.
Types of interventions
(a) Active management of the third stage of labour, which is heredefined as the package of interventions comprising:
1. the administration of a prophylactic uterotonic just before,with, or immediately after the birth of the baby;
2. early cord clamping and cutting (from immediately afterthe birth of the baby’s head in the case of a nuchal cord, orimmediately after the birth of the baby to, usually, within aminute of birth);
3. controlled cord traction to aid the delivery of the placenta.(b) Expectant management of the third stage of labour, which ishere defined as:
1. no prophylactic administration of a uterotonic;2. the umbilical cord is neither clamped nor cut until the
placenta has been delivered or until cord pulsation has ceased;and
3. the placenta is delivered spontaneously with the aid ofgravity and sometimes by maternal effort.
4. None of the components of active management, describedabove, are employed routinely.(c) Mixed management of the third stage of labour consists of amixture of some of the components of both active and expectantmanagement of the third stage, but without exclusively containingall the components of either (Table 1).
Comparisons
1. Active versus expectant management of the third stage oflabour: all women
2. Active versus expectant management of the third stage oflabour: women at low risk of bleeding
3. Active versus mixed management of the third stage oflabour, with early prophylactic uterotonic administration,delayed cord clamping and controlled cord traction
4. Active versus mixed management of the third stage oflabour, with delayed prophylactic uterotonic administration,delayed cord clamping and controlled cord traction
5. Active versus mixed management of the third stage oflabour, with delayed prophylactic uterotonic administration,delayed cord clamping, no controlled cord traction
6. Expectant versus mixed management of the third stage oflabour, with early prophylactic uterotonic administration,delayed cord clamping and controlled cord traction
7. Expectant versus mixed management of the third stage oflabour, with delayed prophylactic uterotonic administration,delayed cord clamping and controlled cord traction
8. Expectant versus mixed management of the third stage oflabour, with delayed prophylactic uterotonic administration,delayed cord clamping, no controlled cord traction
9. Active versus mixed management of the third stage oflabour with uterotonic after placental delivery, immediate cordclamping, no controlled cord traction
10Active versus expectant management for women in the third stage of labour (Review)
Copyright © 2019 The Cochrane Collaboration. Published by John Wiley & Sons, Ltd.

10. Active versus mixed management of the third stage oflabour with no routine uterotonic, early cord clamping, nocontrolled cord traction11. Active versus mixed management of the third stage oflabour with no routine uterotonic, early cord clamping, andcontrolled cord tractionWe included comparisons three to eight because of the reviewteam’s awareness of these different forms of clinical managementof the third stage of labour and following the results of two reviewsthat indicated the benefits of delaying cord clamping for the baby(McDonald 2013; Rabe 2012). There are other variations of mixedmanagement that could also be considered, for example, variationsin controlled cord traction (Hofmeyr 2015), but we consideredthe above to be the most commonly used and thus important toreview. We included comparisons nine to 11 because we addedstudies that had used these comparisons to this review update.
Types of outcome measures
We selected outcome measures in order of importance with duerecognition of the core data set of outcome measures identified byDevane 2007.
Primary outcomes
Maternal
1. *Severe primary postpartum haemorrhage (PPH) at time ofbirth (clinically estimated or measured blood loss greater than orequal to 1000 mL)
2. *Very severe primary PPH at time of birth (clinicallyestimated or measured blood loss greater than or equal to 2500mL)
3. Maternal mortality4. Maternal Hb concentration less than 9 g/dL 24 to 72 hours
postpartum
Infant
1. Admission to neonatal special care or intensive care unit2. Neonatal jaundice requiring phototherapy or exchange
transfusion3. Neonatal polycythaemia treated with dilutional exchange
transfusion
Secondary outcomes
Maternal
1. *Severe primary PPH after delivery of placenta and up to24 hours (clinically estimated or measured blood loss greaterthan or equal to 1000 mL)
2. *Severe primary PPH at time of birth and up to 24 hours(clinically estimated or measured blood loss greater than or equalto 1000 mL)
3. *Primary blood loss equal to or greater than 500 mL at timeof birth (clinically estimated or measured)
4. *Primary blood loss equal to or greater than 500 mL afterdelivery of placenta and up to 24 hours (clinically estimated ormeasured)
5. *Primary blood loss equal to or greater than 500 mL at timeof birth and up to 24 hours (clinically estimated or measured)
6. *Mean blood loss (mL) at time of birth (clinically estimatedor measured)
7. *Mean blood loss (mL) after delivery of placenta and up to24 hours (clinically estimated or measured).
8. *Mean blood loss (mL) at time of birth and up to 24 hours(clinically estimated or measured)
9. Maternal blood transfusion10. Clinical signs of severe blood loss at the time of birth, forexample, woman feeling breathless, weak, faint, pale, exhausted11. Therapeutic uterotonics during the third stage or within thefirst 24 hours, or both12. Mean length of the third stage (minutes)13. Manual removal of the placenta as defined by study authors14. Diastolic blood pressure greater than 90 mmHg betweenbirth of baby and discharge from the labour ward15. Vomiting between birth of baby and discharge from thelabour ward16. Any analgesia between birth of the baby and discharge fromthe labour ward17. Women’s assessment of pain during the third stage asreported by study authors18. Secondary blood loss/any vaginal bleeding needingtreatment (after 24 hours and before six weeks)19. Amount of lochia either estimated or measured after 24hours and up to discharge from hospital20. Surgical evacuation of retained products of conception21. Afterpains - abdominal pain associated with the contractinguterus in the postpartum period
Infant
1. Apgar score less than 7 at five minutes2. Birthweight3. Neonatal encephalopathy assessed using Sarnat staging
(Sarnat 1976; Table 1)4. Neonatal mortality (not pre-specified)5. Intraventricular haemorrhage - papillae grade III/IV (for
infants born before 34 weeks’ gestation only)6. Number of infants who received a red blood cell transfusion7. Infant Hb level at 24 to 72 hours8. Infant Hb level at three to six months9. Infant iron indices (ferritin) at three to six months
10. Exclusive breastfeeding at discharge
11Active versus expectant management for women in the third stage of labour (Review)
Copyright © 2019 The Cochrane Collaboration. Published by John Wiley & Sons, Ltd.

11. Neurodevelopmental, cognitive or developmental outcomesassessed after age 18 months*All PPH amounts and mean blood losses are now expressed atthree time periods, ’at the time of the birth’, ’after delivery of theplacenta and up to 24 hours’, and ’at the time of birth and up to24 hours’.
Search methods for identification of studies
The following search methods section of this review is based on astandard template used by Cochrane Pregnancy and Childbirth.
Electronic searches
For this update, we searched Cochrane Pregnancy and Childbirth’sTrials Register by contacting their Information Specialist (22 Jan-uary 2018).The Register is a database containing over 24,000 reports of con-trolled trials in the field of pregnancy and childbirth. It representsover 30 years of searching. For full current search methods usedto populate Pregnancy and Childbirth’s Trials Register includingthe detailed search strategies for CENTRAL, MEDLINE, Em-base and CINAHL; the list of handsearched journals and confer-ence proceedings, and the list of journals reviewed via the currentawareness service, please follow this link to the editorial informa-tion about the Cochrane Pregnancy and Childbirth.Briefly, Cochrane Pregnancy and Childbirth’s Trials Register ismaintained by their Information Specialist and contains studiesidentified from:
1. monthly searches of the Cochrane Central Register ofControlled Trials (CENTRAL);
2. weekly searches of MEDLINE (Ovid);3. weekly searches of Embase (Ovid);4. monthly searches of CINAHL (EBSCO);5. handsearches of 30 journals and the proceedings of major
conferences;6. weekly current awareness alerts for a further 44 journals
plus monthly BioMed Central email alerts.Two people screen search results and review the full text of allrelevant study reports identified through the searching activitiesdescribed above. Based on the intervention described, the Infor-mation Specialist assigns each study report a number that corre-sponds to a specific Pregnancy and Childbirth review topic (or top-ics), and then adds it to the Register. The Information Specialistsearches the Register for each review using this topic number ratherthan keywords. This results in a more specific search set that hasbeen fully accounted for in the relevant review sections (Includedstudies; Excluded studies; Studies awaiting classification).In addition, we searched ClinicalTrials.gov and the WHO Inter-national Clinical Trials Registry Platform ( ICTRP) for unpub-lished, planned and ongoing study reports (22 January 2018) us-ing the search methods described in Appendix 1.
Searching other resources
We retrieved additional relevant references cited in papers identi-fied through the above search strategy and assessed their suitabilityfor inclusion in the review.We did not apply any language or date restrictions.
Data collection and analysis
For methods used in the previous version of this review, see Begley2015.For this update, we used the following methods for assessing thefive reports that we identified as a result of the updated search.The following methods section of this review is based on a standardtemplate used by Cochrane Pregnancy and Childbirth.
Selection of studies
We obtained all potentially eligible studies identified by the searchstrategy as full-text papers and two review authors assessed eachstudy for potential inclusion. We resolved any disagreementsthrough discussion with at least one additional review author.None of the potentially eligible studies required translation. Wesought and received additional information from Yildirim 2016.
Data extraction and management
We used the data extraction form designed for the previous versionof this review (Begley 2015), to extract data. Two review authorsextracted the data independently from the included study using theform. We resolved discrepancies through discussion with at leastone additional review author. In the previous version of this review,two review authors (Gillian Gyte (GG), Declan Devane (DD)),and a member of the Cochrane Pregnancy and Childbirth Group’sstaff independently reviewed Begley’s paper (Begley 1990), andthe lead author of this review was not involved in any discussionsof the paper’s inclusion, or assessment of its risk of bias status. Weused the Review Manager software (Review Manager 2014), toenter all data, which were checked independently.
Assessment of risk of bias in included studies
Two review authors (GG and LB) independently assessed risk ofbias as a measure of methodological quality of included studiesusing the criteria outlined in the Cochrane Handbook for SystematicReviews of Interventions (Higgins 2017). We resolved discrepan-cies through discussion with at least one additional review author.When information regarding any of the criteria was unclear, wecontacted the authors of the original reports to provide furtherdetails. Where these data were unobtainable, and the missing datawere thought to introduce serious bias, we explored the impact ofincluding such studies in the overall assessment of results by sen-sitivity analysis. We used the following criteria in the assessmentof bias.
12Active versus expectant management for women in the third stage of labour (Review)
Copyright © 2019 The Cochrane Collaboration. Published by John Wiley & Sons, Ltd.

(1) Random sequence generation (checking for possible
selection bias)
We described for each included study the method used to generatethe allocation sequence in sufficient detail to allow an assessmentof whether it should produce comparable groups.We assessed the method as:
• low risk of bias (any truly random process, e.g. randomnumber table; computer random number generator);
• high risk of bias (any non-random process, e.g. odd or evendate of birth; hospital or clinic record number);
• unclear risk of bias.
(2) Allocation concealment (checking for possible selection
bias)
We described for each included study the method used to con-ceal allocation to interventions prior to assignment and assessedwhether intervention allocation could have been foreseen in ad-vance of, or during recruitment, or changed after assignment.We assessed the methods as:
• low risk of bias (e.g. telephone or central randomisation;consecutively numbered sealed opaque envelopes);
• high risk of bias (open random allocation; unsealed or non-opaque envelopes, alternation; date of birth);
• unclear risk of bias.
(3.1) Blinding of participants and personnel (checking for
possible performance bias)
It is not possible to blind participants or personnel in these trials,as the fact that a uterotonic has been given (rather than a placebo,or nothing) is usually apparent to both women (who feel a strongcontraction or pain) and clinicians (who can see or feel a stronglycontracted uterus) following injection of a uterotonic. In addition,it is clear, in many cases, to both women and clinicians if earlyversus late cord clamping is practised or if cord traction versusmaternal effort is used. It is usually possible to blind technicianswho conduct laboratory tests, but this does not always happen socannot be presumed to be so.We assessed the methods as:
• high risk of bias for participants;• high risk of bias for personnel.
(3.2) Blinding of outcome assessment (checking for possible
detection bias)
We described for each included study the methods used, if any, toblind outcome assessors from knowledge of which intervention aparticipant received. We assessed blinding separately for differentoutcomes or classes of outcomes. It is usually possible to blindtechnicians who conduct laboratory tests, but this does not alwayshappen so cannot be presumed to be so.We assessed methods used to blind outcome assessment as:
• low, high or unclear risk of bias.
(4) Incomplete data collection (checking for possible
attrition bias due to the amount, nature and handling of
incomplete outcome data)
We describe for each included study and for each outcome thecompleteness of data, including attrition and exclusions from theanalysis. We state whether attrition and exclusions were reported,the numbers included in the analysis at each stage (comparedwith the total randomised participants), reasons for attrition orexclusion where reported, and whether missing data were balancedacross groups or were related to outcomes. Where sufficient in-formation was reported or was sought and supplied by the trialauthors, we re-included missing data in the analyses. No studiesrequired re-analysis with the original allocated treatment groupsbeing restored to their correct groups. Following these steps, stud-ies were assessed as:
• low risk of bias - less than 10% attrition at any stage, or10% to 15% attrition in small sections of data, equal in bothgroups and due to natural fall-out of long-term follow-up;
• high risk of bias - more than 20% attrition, or more than15% exclusion at any stage when the reason for missing data waslikely to be related to true outcomes;
• unclear risk of bias.
Acknowledging that with long-term follow-up, complete data aredifficult to attain, we discussed whether missing data greater than20% might (a) be reasonably expected, and (b) impact on out-comes; if the latter, we excluded such studies. We subjected studieswhere attrition levels were unclear, or missing data greater than15% occurred, to sensitivity analysis.
(5) Selective reporting bias
We describe for each included study how we examined the possi-bility of selective outcome reporting bias and we assessed reportingmethods as:
• low risk of bias (where it is clear that all of the study’s pre-specified outcomes and all expected outcomes of interest to thereview have been reported);
• high risk of bias (where not all the study’s pre-specifiedoutcomes have been reported; one or more reported primaryoutcomes were not pre-specified; outcomes of interest werereported incompletely and so could not be used; study failed toinclude results of a key outcome that would be expected to havebeen reported);
• unclear risk of bias.
(6) Other sources of bias
We also assessed and describe for each included study any impor-tant concerns we had about other possible sources of bias (e.g.
13Active versus expectant management for women in the third stage of labour (Review)
Copyright © 2019 The Cochrane Collaboration. Published by John Wiley & Sons, Ltd.

specific study design, trial stopped early; extreme baseline imbal-ances). We thus assessed studies as being:
• low risk of bias;• high risk of bias (problems detailed);• unclear risk of bias.
(7) Overall risk of bias
We made explicit judgements about whether or not studies were,overall, at high risk of bias, according to the criteria given in theCochrane Handbook for Systematic Reviews of Interventions with ref-erence to (1) to (6) above (Higgins 2017). As necessary, we ex-plored the impact of the level of bias through undertaking sensi-tivity analyses.
Assessment of the quality of the evidence using
GRADE
We assessed the quality of the evidence using the GRADE ap-proach as outlined in the GRADE Handbook in order to assess thequality of the body of evidence relating to the following outcomesfor the main comparison (GRADE 2013).
1. Maternal *severe primary PPH at time of birth (clinicallyestimated or measured blood loss greater than or equal to 1000mL)
2. *Very severe primary PPH at time of birth (clinicallyestimated or measured blood loss greater than or equal to 2500mL)
3. Maternal mortality4. Maternal Hb concentration less than 9 g/dL 24 to 72 hours
postpartum5. Infant admission to neonatal special care or intensive care
unit6. Neonatal jaundice requiring phototherapy or exchange
transfusion7. Neonatal polycythaemia treated with dilutional exchange
transfusionWe used the GRADEpro Guideline Development Tool (GRADEpro GDT 2015), to import data from Review Manager5 (Review Manager 2014), in order to create ’Summary of find-ings’ tables. We produced a summary of the intervention effectand a measure of quality for each of the above outcomes usingthe GRADE approach. The GRADE approach uses five consid-erations (study limitations, consistency of effect, imprecision, in-directness and publication bias) to assess the quality of the bodyof evidence for each outcome. The evidence can be downgradedfrom ’high quality’ by one level for serious (or by two levels for veryserious) limitations, depending on assessments for risk of bias, in-directness of evidence, serious inconsistency, imprecision of effectestimates or potential publication bias.
Measures of treatment effect
Dichotomous data
For dichotomous data, we presented results as summary risk ratio(RR) with 95% confidence intervals (CIs).
Continuous data
For continuous data, we used the mean difference (MD) as out-comes were measured in the same way between studies. Weplanned to use the standardised mean difference (SMD) to com-bine studies that measured the same outcome, but used differentscales, but this was not required.
Unit of analysis issues
Cluster-randomised trials
We identified no cluster-randomised trials in this review.In future updates, we will include cluster-randomised trials in theanalyses along with individually-randomised studies. We will ad-just their sample sizes using the methods described in the CochraneHandbook for Systematic Reviews of Interventions (section 16.3.4or 16.3.6), using an estimate of the intracluster correlation co-efficient (ICC) derived from the study (if possible), from a similarstudy or from a study of a similar population (Higgins 2011). Ifwe use ICCs from other sources, we will report this and conductsensitivity analyses to investigate the effect of variation in the ICC.If we identify both cluster-randomised trials and individually-ran-domised studys, we plan to synthesise the relevant information.We will consider it reasonable to combine the results from bothif there is little heterogeneity between the study designs and theinteraction between the effect of intervention and the choice ofrandomisation unit is considered to be unlikely.We will also acknowledge heterogeneity in the randomisation unitand perform a sensitivity analysis to investigate the effects of therandomisation unit.
Cross-over trials
This is not an eligible study design for this review.
Dealing with missing data
We analysed data on all participants with available data in thegroup to which they were allocated, regardless of whether or notthey received the allocated intervention. If, in the original reports,participants were not analysed in the group to which they were ran-domised, and there was sufficient information in the study reportor in information obtained from the study authors, we plannedto restore them to the correct group and analyse accordingly (i.e.
14Active versus expectant management for women in the third stage of labour (Review)
Copyright © 2019 The Cochrane Collaboration. Published by John Wiley & Sons, Ltd.

intention-to-treat (ITT) analysis). No studies required re-analy-sis with the original allocated treatment groups being restored totheir correct groups. We used the number of women randomisedminus the number of participants known to have missing data asthe denominators. Where loss to follow-up was greater than 20%,or where study authors had excluded participants at a level greaterthan 15% and for reasons that were deemed to impact on out-comes, we excluded that study.
Assessment of heterogeneity
We assessed statistical heterogeneity in each meta-analysis usingthe Tau², I² (Higgins 2003), and Chi² statistics. We regarded het-erogeneity as substantial if the Tau² was greater than zero and ei-ther an I² statistic was greater than 30% or there was a low P value(< 0.10) in the Chi² test for heterogeneity (Deeks 2017).
Assessment of reporting biases
If there had been 10 or more studies in the meta-analysis, wewould have investigated reporting biases (such as publication bias)using funnel plots. We would have assessed funnel plot asymmetryvisually. If asymmetry was suggested by a visual assessment, wewould have performed exploratory analyses to investigate it (Sterne2017).Where we suspected reporting bias (see ’Selective reporting bias’above), we contacted study authors asking them to provide missingoutcome data. If this had not been possible, and the missing datawere thought to introduce serious bias, we would have exploredthe impact of including such studies in the overall assessment ofresults by conducting a sensitivity analysis.
Data synthesis
We carried out statistical analysis using the Review Manager 5software (Review Manager 2014). We used random-effects meta-analyses for combining data because we considered that there wasclinical heterogeneity sufficient to expect that the underlying treat-ment effects would differ between studies. We treated the ran-dom-effects summary as the average of the range of possible treat-ment effects and we have discussed the clinical implications oftreatment effects differing between studies. If we had consideredthat the average treatment effect was not clinically meaningful, wewould not have combined studies. We have presented the resultsas the average treatment effect with its 95% CI, and the estimatesof Tau², P value for the Chi² test and I² statistic (Deeks 2017).
We found significant clinical and methodological heterogeneitybetween studies sufficient to suggest that treatment effects mightdiffer between studies, which supported our choice of random-effects meta-analysis.
Subgroup analysis and investigation of heterogeneity
We did not undertake any interaction tests (Deeks 2001), as wewere unable to conduct subgroup analyses as planned, due to lackof usable data. We had planned the following subgroup analyses:
1. spontaneous versus operative vaginal birth;2. nulliparous versus multiparous women;3. lower-income versus higher-income setting;4. full-term versus preterm birth (including outcomes specific
to preterm babies).For this update, we deleted the fifth subgroup analysis, ‘low riskof PPH versus high risk of PPH’, as we realised that the analysiswe had undertaken of the low-risk group was in fact a separatecomparison rather than a subgroup analysis. We decided to splitthe countries into ’higher-income’ and ’lower-income’, based onthe World Bank definitions, with the border between lower-mid-dle-income and upper-middle-income being the cut-off. All theincluded studies in the main analysis were undertaken in higher-income countries (defined according to World Bank definitions2018).
Sensitivity analysis
We performed sensitivity analysis based on study quality, sepa-rating high-quality studies from studies of lower quality. ’Highquality’ was, for the purposes of this sensitivity analysis, definedas a study having adequate sequence generation, allocation con-cealment and an attrition rate of less than 20%, given the statedimportance of attrition as a quality measure (Tierney 2005).
R E S U L T S
Description of studies
Results of the search
See: Figure 1.
15Active versus expectant management for women in the third stage of labour (Review)
Copyright © 2019 The Cochrane Collaboration. Published by John Wiley & Sons, Ltd.

Figure 1. Study flow diagram
16Active versus expectant management for women in the third stage of labour (Review)
Copyright © 2019 The Cochrane Collaboration. Published by John Wiley & Sons, Ltd.
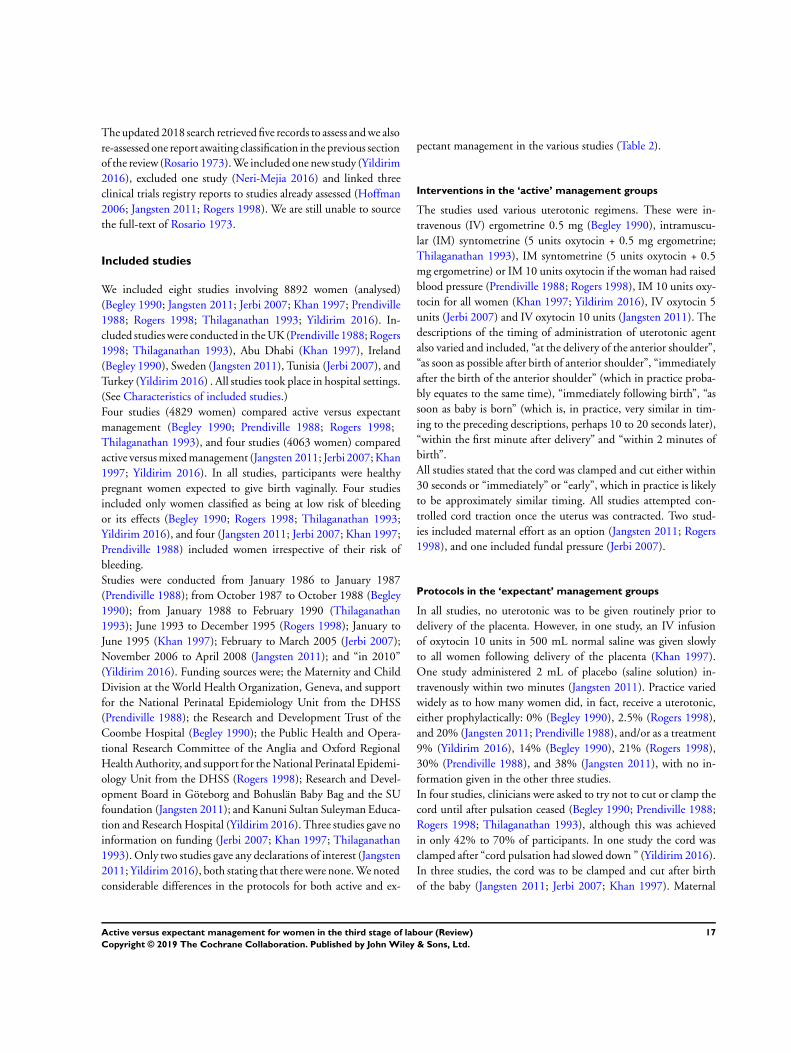
The updated 2018 search retrieved five records to assess and we alsore-assessed one report awaiting classification in the previous sectionof the review (Rosario 1973). We included one new study (Yildirim2016), excluded one study (Neri-Mejia 2016) and linked threeclinical trials registry reports to studies already assessed (Hoffman2006; Jangsten 2011; Rogers 1998). We are still unable to sourcethe full-text of Rosario 1973.
Included studies
We included eight studies involving 8892 women (analysed)(Begley 1990; Jangsten 2011; Jerbi 2007; Khan 1997; Prendiville1988; Rogers 1998; Thilaganathan 1993; Yildirim 2016). In-cluded studies were conducted in the UK (Prendiville 1988; Rogers1998; Thilaganathan 1993), Abu Dhabi (Khan 1997), Ireland(Begley 1990), Sweden (Jangsten 2011), Tunisia (Jerbi 2007), andTurkey (Yildirim 2016) . All studies took place in hospital settings.(See Characteristics of included studies.)Four studies (4829 women) compared active versus expectantmanagement (Begley 1990; Prendiville 1988; Rogers 1998;Thilaganathan 1993), and four studies (4063 women) comparedactive versus mixed management (Jangsten 2011; Jerbi 2007; Khan1997; Yildirim 2016). In all studies, participants were healthypregnant women expected to give birth vaginally. Four studiesincluded only women classified as being at low risk of bleedingor its effects (Begley 1990; Rogers 1998; Thilaganathan 1993;Yildirim 2016), and four (Jangsten 2011; Jerbi 2007; Khan 1997;Prendiville 1988) included women irrespective of their risk ofbleeding.Studies were conducted from January 1986 to January 1987(Prendiville 1988); from October 1987 to October 1988 (Begley1990); from January 1988 to February 1990 (Thilaganathan1993); June 1993 to December 1995 (Rogers 1998); January toJune 1995 (Khan 1997); February to March 2005 (Jerbi 2007);November 2006 to April 2008 (Jangsten 2011); and “in 2010”(Yildirim 2016). Funding sources were; the Maternity and ChildDivision at the World Health Organization, Geneva, and supportfor the National Perinatal Epidemiology Unit from the DHSS(Prendiville 1988); the Research and Development Trust of theCoombe Hospital (Begley 1990); the Public Health and Opera-tional Research Committee of the Anglia and Oxford RegionalHealth Authority, and support for the National Perinatal Epidemi-ology Unit from the DHSS (Rogers 1998); Research and Devel-opment Board in Göteborg and Bohuslän Baby Bag and the SUfoundation (Jangsten 2011); and Kanuni Sultan Suleyman Educa-tion and Research Hospital (Yildirim 2016). Three studies gave noinformation on funding (Jerbi 2007; Khan 1997; Thilaganathan1993). Only two studies gave any declarations of interest (Jangsten2011; Yildirim 2016), both stating that there were none. We notedconsiderable differences in the protocols for both active and ex-
pectant management in the various studies (Table 2).
Interventions in the ‘active’ management groups
The studies used various uterotonic regimens. These were in-travenous (IV) ergometrine 0.5 mg (Begley 1990), intramuscu-lar (IM) syntometrine (5 units oxytocin + 0.5 mg ergometrine;Thilaganathan 1993), IM syntometrine (5 units oxytocin + 0.5mg ergometrine) or IM 10 units oxytocin if the woman had raisedblood pressure (Prendiville 1988; Rogers 1998), IM 10 units oxy-tocin for all women (Khan 1997; Yildirim 2016), IV oxytocin 5units (Jerbi 2007) and IV oxytocin 10 units (Jangsten 2011). Thedescriptions of the timing of administration of uterotonic agentalso varied and included, “at the delivery of the anterior shoulder”,“as soon as possible after birth of anterior shoulder”, “immediatelyafter the birth of the anterior shoulder” (which in practice proba-bly equates to the same time), “immediately following birth”, “assoon as baby is born” (which is, in practice, very similar in tim-ing to the preceding descriptions, perhaps 10 to 20 seconds later),“within the first minute after delivery” and “within 2 minutes ofbirth”.All studies stated that the cord was clamped and cut either within30 seconds or “immediately” or “early”, which in practice is likelyto be approximately similar timing. All studies attempted con-trolled cord traction once the uterus was contracted. Two stud-ies included maternal effort as an option (Jangsten 2011; Rogers1998), and one included fundal pressure (Jerbi 2007).
Protocols in the ‘expectant’ management groups
In all studies, no uterotonic was to be given routinely prior todelivery of the placenta. However, in one study, an IV infusionof oxytocin 10 units in 500 mL normal saline was given slowlyto all women following delivery of the placenta (Khan 1997).One study administered 2 mL of placebo (saline solution) in-travenously within two minutes (Jangsten 2011). Practice variedwidely as to how many women did, in fact, receive a uterotonic,either prophylactically: 0% (Begley 1990), 2.5% (Rogers 1998),and 20% (Jangsten 2011; Prendiville 1988), and/or as a treatment9% (Yildirim 2016), 14% (Begley 1990), 21% (Rogers 1998),30% (Prendiville 1988), and 38% (Jangsten 2011), with no in-formation given in the other three studies.In four studies, clinicians were asked to try not to cut or clamp thecord until after pulsation ceased (Begley 1990; Prendiville 1988;Rogers 1998; Thilaganathan 1993), although this was achievedin only 42% to 70% of participants. In one study the cord wasclamped after “cord pulsation had slowed down ” (Yildirim 2016).In three studies, the cord was to be clamped and cut after birthof the baby (Jangsten 2011; Jerbi 2007; Khan 1997). Maternal
17Active versus expectant management for women in the third stage of labour (Review)
Copyright © 2019 The Cochrane Collaboration. Published by John Wiley & Sons, Ltd.

effort was to be used in six studies (Begley 1990; Jangsten 2011;Prendiville 1988; Rogers 1998; Thilaganathan 1993, Yildirim2016), with the option in some of gentle controlled cord tractiononce the placenta had separated (Begley 1990), or assisting theplacenta out once it was felt in the vagina (Thilaganathan 1993).Maternal effort was used by 32% to 88% of participants, acrossthe six studies. One study used controlled cord traction with gentlefundal pressure (Jerbi 2007), and another used uterine massageafter placental delivery (Jangsten 2011).Given the differences in uterotonics used in the active groups andthe wide variation in the proportion of women in expectant man-agement groups who actually received a uterotonic, it was decidedto use a random-effects model due to the degree of clinical het-erogeneity.
Excluded studies
We excluded 10 studies (Abdel-Aleem 2010; Deneux-Tharaux2013; Gulmezoglu 2012; Hoffman 2006; Kashanian 2010;Magann 2006; Muller 1996; Ramirez 2001; Vasegh 2005 Neri-Mejia 2016 (see Characteristics of excluded studies)). One studywas only available as a conference abstract with no informationon the number of women randomised to each group, and the au-thors of the previous version of the review had been unable toobtain further information from the study authors (Muller 1996).Although we were able to contact one of the authors, we obtainedno further useful information. One study assessed the timing formanual removal of the placenta, so did not fit the criteria for in-clusion (Magann 2006). We excluded the third study because ofthe high number of women excluded after randomisation (48%)(Kashanian 2010). We excluded the fourth study (Hoffman 2006),due to concerns regarding the number of women withdrawn, af-ter randomisation, due to caesarean section. Only a conferenceabstract was available, but we obtained further information onmethodology from the authors. We excluded the fifth study dueto insufficient information on the numbers included in each of
the three arms, and the method of management for the expectantarm (Ramirez 2001). We excluded Vasegh 2005 due to insuffi-cient information in the published study and inability to elicit aresponse from the authors. One study (Neri-Mejia 2016), eval-uated three different types of oxytocin administration (IM, IVand infusion) and two studies that looked at active managementwith or without controlled cord traction (Deneux-Tharaux 2013;Gulmezoglu 2012), were excluded as we deemed them more ap-propriate for inclusion in the Cochrane Review on controlled cordtraction (Hofmeyr 2015).
Risk of bias in included studies
Other than for the medication, it is not possible to blind personneland participants to active or expectant management of the thirdstage. None of the studies used a placebo, and so we assessed allstudies as high risk of bias for blinding. Of the eight studies in-cluded, we considered three studies as having low risk of bias inthe main aspects of sequence generation, allocation concealmentand completeness of data collection (Begley 1990; Jangsten 2011;Rogers 1998), these being our criteria for overall quality for sensi-tivity analyses. We assessed one study as having low risk of bias insequence generation and allocation concealment, and high risk ofbias for lack of blinding and other biases (Prendiville 1988). Weconsidered one study at high risk of bias for completeness of datacollection, lack of blinding and other biases and ’unclear’ for allo-cation concealment and selective reporting (Thilaganathan 1993),and assessed one study as unclear on five of the assessment crite-ria (Khan 1997). We assessed one study as unclear for sequencegeneration and blinding of outcome assessment, at high risk ofbias for allocation concealment, blinding of participants, selectivereporting and other biases, but acceptable for completeness of data(Jerbi 2007), and the final study was unclear on four of the assess-ment criteria, at high risk of bias for blinding of participants buthad a low risk of bias for sequence generation and completenessof data collection (Yildirim 2016). See Figure 2 and Figure 3 fora summary of risk of bias assessments.
18Active versus expectant management for women in the third stage of labour (Review)
Copyright © 2019 The Cochrane Collaboration. Published by John Wiley & Sons, Ltd.

Figure 2. Risk of bias graph: review authors’ judgements about each risk of bias item presented as
percentages across all included studies.
19Active versus expectant management for women in the third stage of labour (Review)
Copyright © 2019 The Cochrane Collaboration. Published by John Wiley & Sons, Ltd.

Figure 3. Risk of bias summary: review authors’ judgements about each risk of bias item for each included
study.
20Active versus expectant management for women in the third stage of labour (Review)
Copyright © 2019 The Cochrane Collaboration. Published by John Wiley & Sons, Ltd.

Allocation
Six studies used adequate sequence generation using ran-dom-number tables or computer random-number generators(Begley 1990; Jangsten 2011; Prendiville 1988; Rogers 1998;Thilaganathan 1993; Yildirim 2016) and in two the method wasunclear (Jerbi 2007; Khan 1997). We judged allocation conceal-ment as low risk of bias in four studies (Begley 1990; Jangsten2011; Prendiville 1988; Rogers 1998), and as unclear risk in three(Khan 1997; Thilaganathan 1993; Yildirim 2016). One study didnot conceal allocation and so we assessed it as high risk of bias(Jerbi 2007).
Blinding
Blinding was not possible when assessing the management of thirdstage of labour, for either women or clinicians (Characteristics ofincluded studies). The assessment of many outcomes, particularlyblood loss, could, therefore, have been unconsciously affected bypeople’s beliefs. Having chosen maternal Hb less than 9 g/dL as ahard outcome relating to blood loss at the protocol stage, we havenow also included the mean postnatal Hb values to help in un-derstanding the blood loss estimations. Haemoglobin assessmentwould usually be performed by a technician who would be blindedto the study allocation.Begley 1990 and Jangsten 2011, the Dublin and Swedish studiesrespectively, measured blood loss, but all the other studies esti-mated it, and are therefore open to subjective inaccuracies, whichshould, however, have been the same across both groups; in ad-dition, both blood loss estimation and measurement were opento bias. For certain outcomes such as Hb concentration, whichcould be measured by a blinded outcome assessor, we attemptedto assess how such blinding had occurred. In practice, we foundthat almost all studies did not mention how they blinded suchassessors.
Incomplete outcome data
Five studies presented complete outcome data (Begley 1990;Jangsten 2011; Jerbi 2007; Rogers 1998; Yildirim 2016), with ac-ceptable levels of attrition except for some follow-up measures,such as postnatal Hb levels. However, one of these studies excludedwomen post randomisation (2.2%) who had a postpartum haem-orrhage (PPH) due to deep vaginal lacerations and so we assessed itas being at unclear risk of bias (Yildirim 2016). We considered onestudy at high risk of bias for complete data in that it was not clearhow many women were randomised, and an unknown numberof women were withdrawn following randomisation, due to cae-sarean section, operative delivery and cervical tears (Thilaganathan1993). One study had high levels of missing data for some out-comes, for example, 19% of Hb results missing in the active arm
and 18% in the expectant, but for other outcomes data were morecomplete and so we assessed this study as being at unclear risk ofbias (Prendiville 1988). In the remaining study, it was also unclearhow many data were missing (Khan 1997). In all three of thesestudies (Khan 1997; Prendiville 1988; Thilaganathan 1993), andin the study that excluded women with deep vaginal lacerations(Yildirim 2016), the denominator used was the number given bystudy authors as taking part in the study after withdrawals hadbeen made.
Selective reporting
We did not assess any studies as free of selective reporting bias. Wecategorised five as ’unclear’ (Begley 1990; Jangsten 2011; Khan1997; Thilaganathan 1993; Yildirim 2016), as it was not apparentfrom the published papers that they had reported all outcomes,and we were unable to check study protocols. We judged threestudies as high risk of reporting bias due to some outcomes beingreported which were not listed in the methods section (Jerbi 2007;Prendiville 1988; Rogers 1998).
Other potential sources of bias
We judged one study as free of other apparent sources of bias(Begley 1990). One of the remaining studies (Prendiville 1988),included women at increased risk of PPH (high parity, all agegroups, previous PPH, epidural, long labour, operative delivery).This was also a problem with another study (Khan 1997). Womenat increased risk of PPH will have a higher blood loss, by defi-nition, using expectant management; clinicians experiencing thismay respond by anxiety in subsequent births, even of low-riskwomen, which may result in higher intervention (mixed manage-ment) rates. In Prendiville 1988, 50% of the expectant manage-ment group received an oxytocic, a proportion of intervention in-compatible with the philosophy of expectant management. In onestudy, although 11,000 women were available, of whom at leasthalf would usually be considered potentially eligible, only 1802were entered into the study (Jangsten 2011). The majority were ex-cluded due to “excessive workload”. This has the potential to havebiased the study, as midwives would have had the choice of notasking the women to participate and may unconsciously have notoffered participation to some women who they felt were not suit-able for expectant management. Jerbi 2007 reported that womenwere allocated to the two groups after placental delivery, yet theydescribed the active management group as having had oxytocinwith the anterior shoulder. One other study had no power calcu-lation, did not use a null hypothesis, and the study groups werequite different sizes (103 and 90). In addition, they described thevariables age, birthweight and parity as equal between the groupsbut did not give any details (Thilaganathan 1993).
21Active versus expectant management for women in the third stage of labour (Review)
Copyright © 2019 The Cochrane Collaboration. Published by John Wiley & Sons, Ltd.

Midwives in all studies, (except Yildirim 2016), were more used tousing active than expectant management, which is likely to havehad an influence on results in the expectant arm. This influencemay have been that they a) reverted to a type of active manage-ment, potentially reducing blood loss and narrowing the differ-ence between study arms in terms of blood loss outcomes or b)used mixed management, which, from the data, was more likely toincrease blood loss or c) would have conducted a type of expectantmanagement that was not ideal and resulted in increased blood lossin the expectant arm. Rogers 1998 administered a questionnaireto 92 of the 153 midwives prior to the study commencement,which showed that 84% felt “very confident” of active manage-ment, whilst only 41% were “very confident” of expectant man-agement. Similarly, Prendiville 1988 states that, before the studycommenced, the midwives were trained in the use of expectantmanagement. Only six (13%), however, said that they were veryconfident in using expectant management before the study startedand 22 (46%) afterwards. In addition, of 49 midwives respond-ing to a questionnaire regarding this study, 30 (61%) had nevermanaged a third stage expectantly. Among the remaining 19, onlyone had practised expectant management as defined in the report(Harding 1989). In Begley 1990, the PPH rate in the expectantarm fell during the study from 21% in the pilot study and 12%over the first four months, to 7% in the last six months, as mid-wives developed their skill (Begley 1990). In contrast to trainingin the use of expectant management, additional information pro-vided by the lead author of one study (Yildirim 2016), noted thatthey had to train practitioners for “the active management pro-tocol (especially for controlled cord traction)”. The other studiesdid not provide any information on skill levels, nor on whetherpractitioners had training in both expectant and active manage-ment of third stage of labour.Finally, Prendiville 1988 changed the protocol after 425 births,but included all births in the results, which may have affected thefindings.
Effects of interventions
See: Summary of findings for the main comparison Activeversus expectant management of the third stage of labour (allwomen)The review includes eight studies involving 8892 women. Weused a random-effects model for pooling data because of clinicalheterogeneity seen in the included studies. In the forest plots, forsix of the outcomes the “Favours expectant” label is on the leftrather than the right. This was dictated by whether we are reportingnegative (e.g. PPH) or positive (e.g. breastfeeding) outcomes.
1. Active versus expectant management of third stage
of labour: all women (four studies, 4829 women)
This comparison included four studies (Begley 1990; Prendiville1988; Rogers 1998; Thilaganathan 1993). Three studies included
only women at low risk of bleeding (Begley 1990; Rogers 1998;Thilaganathan 1993) and one study included women irrespectiveof risk of bleeding (Prendiville 1988). We assessed two studies asbeing of high quality (Begley 1990; Rogers 1998); one raised con-cerns regarding high risk of bias in terms of midwives’ comfortwith expectant management, and other possible biases (Prendiville1988); and we considered one study to have high risk of bias interms of incomplete outcome data and selective reporting bias(Thilaganathan 1993). We used random-effects meta-analyses dueto the clinical heterogeneity involved. The random-effects sum-mary gives an average for ’active’ methods versus ’expectant’ meth-ods, and it is important to note that the treatment effect found bycomparing any two specific techniques may differ from this. For anumber of outcomes, there was very little statistical heterogeneityfound (Tau² = 0 and I² = 0%), so there appears to be a singlecommon treatment effect for these outcomes. We have assessedthe overall quality of the evidence using GRADE (GRADE 2013;Summary of findings for the main comparison).
Primary outcomes
For women
Compared with expectant management, it is uncertain whetheractive management reduces the incidence of severe PPH:
• severe primary PPH, 1000 mL or more at time of birth(average risk ratio (RR) 0.34, 95% confidence interval (CI) 0.14to 0.87, 3 studies, 4636 women, random-effects (Tau² = 0.38,Chi² P = 0.08, I² = 60%) very low-quality evidence; Analysis1.1).
However, active management may reduce the number of womenwho are anaemic after birth:
• maternal Hb less than 9 g/dL at 24 to 72 hours (average RR0.50, 95% CI 0.30 to 0.83, 2 studies, 1572 women, random-effects (Tau² = 0.02, Chi² P = 0.31, I² = 3%) low-qualityevidence; Analysis 1.4).
None of the studies reported on the other primary maternal out-comes of very severe primary PPH (≥ 2500 mL), except Begley1990, who found no instances of such extreme blood loss in eithergroup, or maternal mortality.
For babies
Compared with expectant management, active management maymake little or no difference to:
• admission to neonatal special care or intensive care unit(average RR 0.81, 95% CI 0.60 to 1.11, 2 studies, 3207 infants,random-effects (Tau² = 0.00, Chi² P = 0.40, I² = 0%) low-quality evidence; Analysis 1.5);
and it is uncertain whether active management reduces or increasesthe number of babies with jaundice requiring treatment:
22Active versus expectant management for women in the third stage of labour (Review)
Copyright © 2019 The Cochrane Collaboration. Published by John Wiley & Sons, Ltd.

• neonatal jaundice requiring phototherapy or exchangetransfusion (average RR 0.96, 95% CI 0.55 to 1.68, 2 studies,3142 infants, random-effects (Tau² = 0.11, Chi² P = 0.09, I² =66%) very low-quality evidence; Analysis 1.6).
None of the studies reported on the other primary neonatal out-come of neonatal polycythaemia treated with dilutional exchangetransfusion.It should be noted that the evidence presented on the primary out-comes selected is based on results of a small number of studies withrelatively small numbers of participants. The lack of consistentquality of evidence for these outcomes should be borne in mindwhen considering the overall results (see Summary of findings forthe main comparison).
Secondary outcomes
Compared with expectant management, active management (withhigh-quality evidence) reduces:
• mean maternal blood loss (mean difference (MD) in mL−78.80, 95% CI −95.96 to −61.64, 2 studies, 2941 women,random-effects (Tau² = 34.93, Chi² P = 0.26, I² = 22%) Analysis1.13).
Also, active management (with moderate-quality evidence) prob-ably reduces:
• primary blood loss 500 mL or more, clinically estimated ormeasured at birth (average RR 0.34, 95% CI 0.27 to 0.44, 3studies, 4636 women, random-effects (Tau² = 0.02, Chi² P =0.23, I² = 32%) Analysis 1.10);
• therapeutic uterotonics during the third stage and/or withinthe first 24 hours (average RR 0.19, 95% CI 0.15 to 0.23, 4studies, 4829 women, random-effects (Tau² = 0.00, Chi² P =0.47, I² = 0%) Analysis 1.18);
• mean birthweight (MD in g −76.90, 95% CI −108.51 to−45.30, 2 studies, 3207 infants, random-effects (Tau² = 0.00,Chi² P = 0.58, I² = 0%) Analysis 1.30).
In addition, active management (with low-quality evidence) mayreduce:
• maternal blood transfusion (average RR 0.35, 95% CI 0.22to 0.55, 4 studies, 4829 women, random-effects (Tau² = 0.00,Chi² P = 0.46, I² = 0%) Analysis 1.16).
Compared with expectant management, active management (withlow-quality evidence) may increase:
• postnatal diastolic blood pressure more than 90 mmHg upto discharge from labour ward (average RR 4.10, 95% CI 1.63to 10.30, 3 studies, 4636 women, random-effects (Tau² = 0.32,Chi² P = 0.14, I² = 49%) Analysis 1.21);
• vomiting from birth of baby to discharge from labour ward(average RR 2.47, 95% CI 1.36 to 4.48, 3 studies, 4636 women,random-effects (Tau² = 0.14, Chi² P = 0.09, I² = 59%) Analysis1.22);
• administration of any analgesia from birth up to dischargefrom labour ward (RR 2.53, 95% CI 1.34 to 4.78, 1 study, 1429women; Analysis 1.23);
• afterpains (RR 2.53, 95% CI 1.34 to 4.78, 1 study, 1429women; Analysis 1.28);
• return to hospital as an in- or outpatient because ofbleeding (outcome not pre-specified) (average RR 2.21, 95% CI1.29 to 3.79, 2 studies, 2941 women, random-effects (Tau² =0.00, Chi² P = 0.82, I² = 0%) Analysis 1.40);
• postnatal maternal Hb (outcome not pre-specified) (MD0.52, 95% CI 0.44 to 0.60, 3 studies, 4062 women, random-effects (Tau² = 0.00, Chi² P = 0.66, I² = 0%) Analysis 1.41).
Compared with expectant management, active management (withmoderate-quality evidence) probably makes little or no differenceto:
• exclusive breastfeeding at discharge (RR 1.01, 95% CI 0.96to 1.07, 1 study, 1695 women; Analysis 1.38).
Also, active management (with low-quality evidence) may makelittle or no difference to:
• mean length of the third stage in minutes (MD −0.30,95% CI −1.87 to 1.27, 1 study, 1429 women; Analysis 1.19);
• secondary blood loss/any vaginal bleeding needingtreatment after 24 hours and before six weeks (average RR 1.10,95% CI 0.40 to 2.99, 3 studies, 4636 women, random-effects(Tau² = 0.67, Chi² P = 0.0005, I² = 87%) Analysis 1.25);
• surgical evacuation of retained products of conception(average RR 0.74, 95% CI 0.32 to 1.71, 3 studies, 4636 women,random-effects (Tau² = 0.26, Chi² P = 0.15, I² = 47%) Analysis1.27).
In addition, we are uncertain if active management (with very low-quality evidence) improves the incidence of:
• manual removal of placenta (average RR 1.78, 95% CI0.57 to 5.56, 4 studies, 4829 women, random-effects (Tau² =0.82, Chi² P = 0.01, I² = 73%) Analysis 1.20);
• Apgar scores less than 7 at five minutes (RR 1.00, 95% CI0.38 to 2.66, 1 study, 1695 infants; Analysis 1.29).
Authors of the included studies did not assess any of the review’sother secondary outcomes.
2. Active versus expectant management of third stage
of labour: women at low risk of bleeding (three
studies, 3134 women)
This comparison included three studies (Begley 1990; Rogers1998; Thilaganathan 1993). We considered two studies to be ofhigh methodological quality (Begley 1990; Rogers 1998) and onestudy to have high risk of bias in terms of incomplete outcomedata and selective reporting bias (Thilaganathan 1993). All meta-analyses used random-effects meta-analyses due to the clinical het-erogeneity involved. For a number of outcomes, there was very
23Active versus expectant management for women in the third stage of labour (Review)
Copyright © 2019 The Cochrane Collaboration. Published by John Wiley & Sons, Ltd.
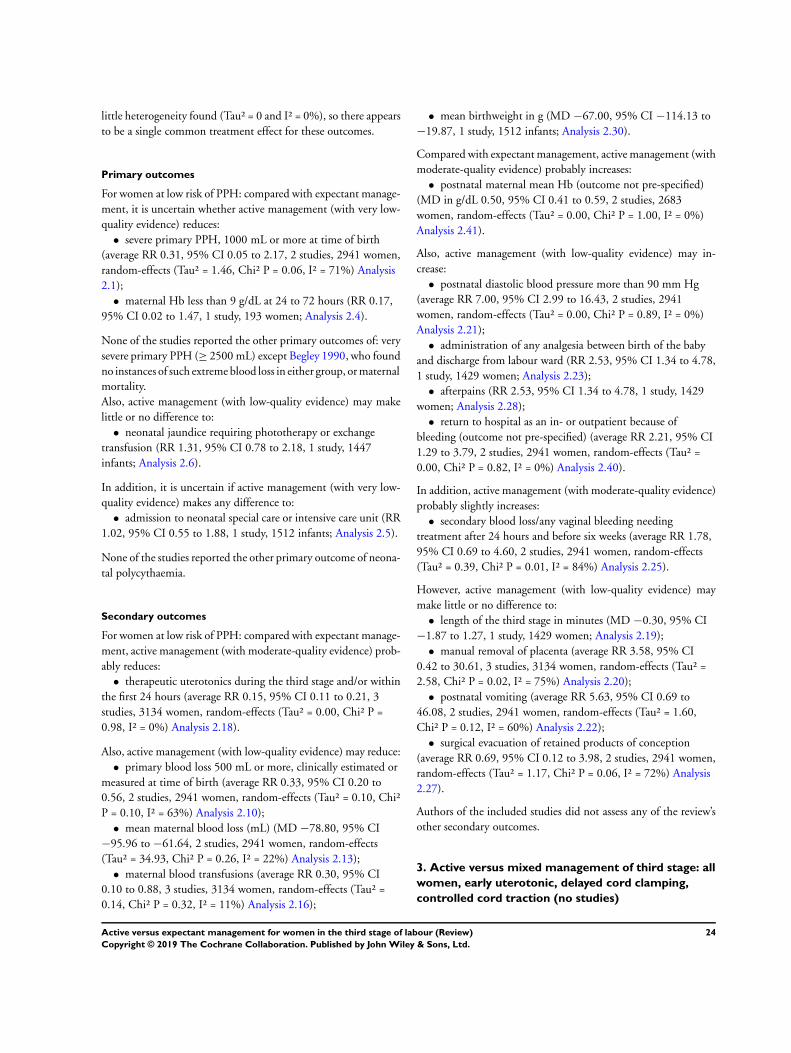
little heterogeneity found (Tau² = 0 and I² = 0%), so there appearsto be a single common treatment effect for these outcomes.
Primary outcomes
For women at low risk of PPH: compared with expectant manage-ment, it is uncertain whether active management (with very low-quality evidence) reduces:
• severe primary PPH, 1000 mL or more at time of birth(average RR 0.31, 95% CI 0.05 to 2.17, 2 studies, 2941 women,random-effects (Tau² = 1.46, Chi² P = 0.06, I² = 71%) Analysis2.1);
• maternal Hb less than 9 g/dL at 24 to 72 hours (RR 0.17,95% CI 0.02 to 1.47, 1 study, 193 women; Analysis 2.4).
None of the studies reported the other primary outcomes of: verysevere primary PPH (≥ 2500 mL) except Begley 1990, who foundno instances of such extreme blood loss in either group, or maternalmortality.Also, active management (with low-quality evidence) may makelittle or no difference to:
• neonatal jaundice requiring phototherapy or exchangetransfusion (RR 1.31, 95% CI 0.78 to 2.18, 1 study, 1447infants; Analysis 2.6).
In addition, it is uncertain if active management (with very low-quality evidence) makes any difference to:
• admission to neonatal special care or intensive care unit (RR1.02, 95% CI 0.55 to 1.88, 1 study, 1512 infants; Analysis 2.5).
None of the studies reported the other primary outcome of neona-tal polycythaemia.
Secondary outcomes
For women at low risk of PPH: compared with expectant manage-ment, active management (with moderate-quality evidence) prob-ably reduces:
• therapeutic uterotonics during the third stage and/or withinthe first 24 hours (average RR 0.15, 95% CI 0.11 to 0.21, 3studies, 3134 women, random-effects (Tau² = 0.00, Chi² P =0.98, I² = 0%) Analysis 2.18).
Also, active management (with low-quality evidence) may reduce:• primary blood loss 500 mL or more, clinically estimated or
measured at time of birth (average RR 0.33, 95% CI 0.20 to0.56, 2 studies, 2941 women, random-effects (Tau² = 0.10, Chi²P = 0.10, I² = 63%) Analysis 2.10);
• mean maternal blood loss (mL) (MD −78.80, 95% CI−95.96 to −61.64, 2 studies, 2941 women, random-effects(Tau² = 34.93, Chi² P = 0.26, I² = 22%) Analysis 2.13);
• maternal blood transfusions (average RR 0.30, 95% CI0.10 to 0.88, 3 studies, 3134 women, random-effects (Tau² =0.14, Chi² P = 0.32, I² = 11%) Analysis 2.16);
• mean birthweight in g (MD −67.00, 95% CI −114.13 to−19.87, 1 study, 1512 infants; Analysis 2.30).
Compared with expectant management, active management (withmoderate-quality evidence) probably increases:
• postnatal maternal mean Hb (outcome not pre-specified)(MD in g/dL 0.50, 95% CI 0.41 to 0.59, 2 studies, 2683women, random-effects (Tau² = 0.00, Chi² P = 1.00, I² = 0%)Analysis 2.41).
Also, active management (with low-quality evidence) may in-crease:
• postnatal diastolic blood pressure more than 90 mm Hg(average RR 7.00, 95% CI 2.99 to 16.43, 2 studies, 2941women, random-effects (Tau² = 0.00, Chi² P = 0.89, I² = 0%)Analysis 2.21);
• administration of any analgesia between birth of the babyand discharge from labour ward (RR 2.53, 95% CI 1.34 to 4.78,1 study, 1429 women; Analysis 2.23);
• afterpains (RR 2.53, 95% CI 1.34 to 4.78, 1 study, 1429women; Analysis 2.28);
• return to hospital as an in- or outpatient because ofbleeding (outcome not pre-specified) (average RR 2.21, 95% CI1.29 to 3.79, 2 studies, 2941 women, random-effects (Tau² =0.00, Chi² P = 0.82, I² = 0%) Analysis 2.40).
In addition, active management (with moderate-quality evidence)probably slightly increases:
• secondary blood loss/any vaginal bleeding needingtreatment after 24 hours and before six weeks (average RR 1.78,95% CI 0.69 to 4.60, 2 studies, 2941 women, random-effects(Tau² = 0.39, Chi² P = 0.01, I² = 84%) Analysis 2.25).
However, active management (with low-quality evidence) maymake little or no difference to:
• length of the third stage in minutes (MD −0.30, 95% CI−1.87 to 1.27, 1 study, 1429 women; Analysis 2.19);
• manual removal of placenta (average RR 3.58, 95% CI0.42 to 30.61, 3 studies, 3134 women, random-effects (Tau² =2.58, Chi² P = 0.02, I² = 75%) Analysis 2.20);
• postnatal vomiting (average RR 5.63, 95% CI 0.69 to46.08, 2 studies, 2941 women, random-effects (Tau² = 1.60,Chi² P = 0.12, I² = 60%) Analysis 2.22);
• surgical evacuation of retained products of conception(average RR 0.69, 95% CI 0.12 to 3.98, 2 studies, 2941 women,random-effects (Tau² = 1.17, Chi² P = 0.06, I² = 72%) Analysis2.27).
Authors of the included studies did not assess any of the review’sother secondary outcomes.
3. Active versus mixed management of third stage: all
women, early uterotonic, delayed cord clamping,
controlled cord traction (no studies)
24Active versus expectant management for women in the third stage of labour (Review)
Copyright © 2019 The Cochrane Collaboration. Published by John Wiley & Sons, Ltd.

There were no studies that assessed this comparison.
4. Active versus mixed management of third stage of
labour: all women, delayed uterotonic, delayed cord
clamping, controlled cord traction (no studies)
There were no studies that assessed this comparison.
5. Active versus mixed management of third stage of
labour: all women, delayed uterotonic, delayed cord
clamping, no controlled cord traction (one study, 654
women)
This comparison included one study (Yildirim 2016).
Primary outcomes
The study did not report any of the review’s primary outcomes:severe primary PPH (≥ 1000 mL time of birth); very severe pri-mary PPH (≥ 2500 mL); maternal mortality; maternal Hb lessthan 9 g/dL at 24 to 72 hours; admission to neonatal special careor intensive care unit; neonatal jaundice requiring phototherapyor exchange transfusion; neonatal polycythaemia treated with di-lutional exchange transfusion. The study authors’ own primaryoutcome was one of this review’s secondary outcomes.
Secondary outcomes
Compared with mixed management, active management (withlow-quality evidence) may slightly reduce:
• mean length of the third stage in minutes (MD −5.15,95% CI −5.71 to −4.59, 1 study, 654 women; Analysis 5.10);
• postnatal maternal mean Hb (MD in g/dL 0.69, 95% CI0.58 to 0.80, 1 study, 654 women; Analysis 5.14).
Also, active management (with low-quality evidence) - may slightlyincrease:
• birthweight in g (MD 68, 95% CI 23.87 to 112.13, 1study, 654 infants; Analysis 5.13).
Compared with mixed management, it is uncertain if active man-agement (with very low-quality evidence) makes any difference,improves, or reduces:
• maternal blood transfusions (RR 0.75, 95% CI 0.17, 3.32,1 study, 654 women; Analysis 5.8);
• therapeutic uterotonics during the third stage and/or withinthe first 24 hours (RR 0.90, 95% CI 0.55 to 1.48, 1 study, 654women; Analysis 5.9);
• manual removal of placenta (RR 0.67, 95% CI 0.11 to3.96, 1 study, 654 women; Analysis 5.11);
• surgical evacuation of retained products of conception (RR7.00, 95% CI 0.36 to 134.98, 1 study, 654 women; Analysis5.12).
The authors of this study did not assess any of the review’s othersecondary outcomes.
6. Expectant versus mixed management of third stage
of labour: all women, early uterotonic, delayed cord
clamping, controlled cord traction (no studies)
There were no studies that assessed this comparison.
7. Expectant versus mixed management of third stage
of labour: all women, delayed uterotonic, delayed
cord clamping, controlled cord traction (no studies)
There were no studies that assessed this comparison.
8. Expectant versus mixed management of third stage
of labour: all women, delayed uterotonic, delayed
cord clamping, no controlled cord traction (no
studies)
There were no studies that assessed this comparison.
9. Active versus mixed management of third stage of
labour: all women, immediate cord clamping, no
controlled cord traction, uterotonic after placental
delivery (one study, 1648 women; comparison not
pre-specified)
This comparison included one study with 1648 women (Khan1997). We had not pre-specified this comparison.
Primary outcomes
Compared with mixed management, it is uncertain whether activemanagement (with very low-quality evidence) reduces:
• severe primary PPH, blood loss1000 mL or more at time ofbirth (RR 0.23, 95% CI 0.09 to 0.55, 1 study, 1648 women;Analysis 9.1).
The study did not report the other primary outcomes of: verysevere primary PPH (≥ 2500 mL); maternal Hb less than 9 g/dLat 24 to 72 hours; maternal mortality, neonatal jaundice requiringphototherapy or exchange transfusion; or neonatal polycythaemiatreated with dilutional exchange transfusion.
Secondary outcomes
Compared with mixed management, it is uncertain whether activemanagement (wit−h very low-quality evidence) reduces:
• primary blood loss of 500 mL or more, clinically estimatedor measured at time of birth (RR 0.53, 95% CI 0.38 to 0.74, 1study, 1648 women; Analysis 9.10);
25Active versus expectant management for women in the third stage of labour (Review)
Copyright © 2019 The Cochrane Collaboration. Published by John Wiley & Sons, Ltd.

• therapeutic uterotonics during the third stage and/or withinthe first 24 hours (RR 0.45, 95% CI 0.26 to 0.77, 1 study, 1648women; Analysis 9.18);
• length of the third stage in minutes (MD −10.00, 95% CI−10.24 to −9.76, 1 study, 1648 women; Analysis 9.19).
Also, it is uncertain if active management (with very low-qualityevidence) reduces or improves:
• maternal blood transfusions (RR 0.25, 95% CI 0.03 to2.22, 1 study, 1648 women; Analysis 9.16);
• clinical signs of severe blood loss (RR 0.25, 95% CI 0.05 to1.17, 1 study, 1648 women; Analysis 9.17).
Authors of the included study did not assess any of the review’sother secondary outcomes.
10. Active versus mixed management of third stage of
labour: all women, no routine uterotonic, immediate
cord clamping, no controlled cord traction (one
study, 1631 women, comparison not pre-specified)
This comparison included one study (Jangsten 2011). We judgedthis study to be at low risk of bias for sequence generation, al-location concealment and incomplete outcome data, unclear forselective reporting bias, but high risk of bias for other biases (seeCharacteristics of included studies).
Primary outcomes
Compared with mixed management, it is uncertain if active man-agement (with very low-quality evidence) reduces:
• severe primary PPH at time of birth of 1000 mL or more(RR 0.78, 95% CI 0.48 to 1.24, 1 study, 1621 women; Analysis10.1).
Also, active management (with very low-quality evidence) mayslightly improve:
• maternal Hb less than 9 g/dL at 24 to 72 hours (RR 1.23,95% CI 0.75 to 2.01, 1 study, 1631 women; Analysis 10.4).
The study did not report the other primary outcomes of: verysevere primary PPH (≥ 2500 mL); maternal mortality; neonataljaundice requiring phototherapy or exchange transfusion; neonatalpolycythaemia treated with dilutional exchange transfusion.
Secondary outcomes
Compared with mixed management, active management (withmoderate-quality evidence) probably reduces:
• therapeutic uterotonics during the third stage and/or withinthe first 24 hours (RR 0.39, 95% CI 0.33 to 0.48, 1 study, 1631women; Analysis 10.18);
• severe primary PPH at time of birth and up to two hoursafter, clinically estimated or measured blood loss of 1000 mL or
more (RR 0.60, 95% CI 0.47 to 0.78, 1 study, 1621 women,Analysis 10.44); we had not pre-specified this outcome);
• mean maternal blood loss after delivery of the placenta andup to two hours (outcome not pre-specified) (MD in mL−49.00, 95% CI −75.52 to −22.48, 1 study, 1621 women;Analysis 10.45).
Also, active management (with low-quality evidence) may reduce:• primary blood loss of 500 mL or more at time of birth,
clinically estimated or measured at birth (RR 0.51, 95% CI 0.40to 0.66, 1 study, 1621 women; Analysis 10.10);
• mean maternal blood loss at time of birth (MD in mL−94.00, 95% CI −126.57 to −61.43, 1 study, 1621 women;Analysis 10.13);
• mean length of third stage in minutes (MD −1.60, 95% CI−3.08 to −0.12; Analysis 10.19);
• severe primary PPH after delivery of placenta and up to twohours, clinically estimated or measured blood loss of 1000 mL ormore (RR 0.54, 95% CI 0.39 to 0.74, 1 study, 1621 women;Analysis 10.43); we had not pre-specified this outcome.
Compared with mixed management, active management (withlow-quality evidence) may increase:
• postnatal maternal mean Hb (MD in g/dL 0.28, 95% CI0.14 to 0.42, 1 study, 1631 women; Analysis 10.42); we had notpre-specified this outcome.
Compared with mixed management, active management (withlow-quality evidence) may make little or no difference to:
• mean birthweight (MD in g 15.00, 95% CI -28.88 to58.88; Analysis 10.31).
Also, it is uncertain whether active management (with very low-quality evidence) improves or reduces:
• maternal blood transfusion (RR 0.79, 95% CI 0.43 to1.46; Analysis 10.16);
• manual removal of placenta (RR 1.25, 95% CI 0.71 to2.21; Analysis 10.20).
The study did not assess any of the review’s other secondary out-comes, including, afterpains - abdominal pain associated with thecontracting uterus in the postpartum period. However, we assessedtwo similar, non-prespecified outcomes (Jangsten 2011), and ac-tive management (with low-quality evidence) may reduce:
• afterpains at two hours after birth (RR −2.80, 95% CI−4.62 to −0.98, 1 study, 1425 women; Analysis 10.28);
• afterpains the day after birth (RR −3.00, 95% CI −5.33 to−0.67, 1 study, 1336 women; Analysis 10.29).
11. Active versus mixed management of third stage of
labour: all women, no routine uterotonic, immediate
cord clamping, controlled cord traction (one study,
130 women, comparison not pre-specified)
This comparison included one study (Jerbi 2007).
26Active versus expectant management for women in the third stage of labour (Review)
Copyright © 2019 The Cochrane Collaboration. Published by John Wiley & Sons, Ltd.

Primary outcomes
Compared with mixed management, it is uncertain whether activemanagement (with very low-quality evidence) reduces:
• maternal Hb less than 9 g/dL at 24 to 72 hours (RR 0.80,95% CI 0.34 to 1.90; Analysis 11.4).
The study did not report on the other primary outcomes of: se-vere primary PPH (≥ 1000 mL time of birth); very severe pri-mary PPH (≥ 2500 mL); maternal mortality; neonatal jaundicerequiring phototherapy or exchange transfusion; neonatal poly-cythaemia treated with dilutional exchange transfusion.
Secondary outcomes
Compared with mixed management, it is uncertain if active man-agement (with very low-quality evidence) reduces:
• mean length of the third stage in minutes (MD −8.12 95%CI −9.72 to −6.52; Analysis 11.19).
Also, it is uncertain if active management (with very low qualityevidence) makes any difference to the incidence of:
• manual removal of placenta (RR 1.00, 95% CI 0.06 to15.65; Analysis 11.20).
The study did not assess any of the review’s other secondary out-comes.
Sensitivity analysis
We undertook sensitivity analyses including only the four stud-ies with adequate sequence generation, allocation concealmentand complete outcome reporting (Begley 1990; Jangsten 2011;Prendiville 1988; Rogers 1998). Removing the studies at high riskof bias did not change the overall findings.
D I S C U S S I O N
This review includes eight studies conducted in hospital settingsin five countries involving 8892 women. None of the includedstudies reported any maternal deaths, nor any very severe (greaterthan 2500 mL) postpartum haemorrhages (PPH), and also noneonatal mortality. It should be noted that the random-effectssummaries presented are the average effects found for ’active’ versus’expectant’ management. Thus, it may not necessarily be true thatall methods of active management will have the reported size ofadvantage in terms of PPH, or other outcomes, over all methodsof expectant management.
Summary of main results
Active versus expectant management of the third
stage of labour in women, irrespective of their risk of
bleeding
It is uncertain whether active management in hospitals in higher-income settings leads to a reduction in severe primary PPH of1000 mL or more, and it may reduce the number of women withmaternal Hb less than 9 g/dL at 24 to 72 hours postnatal. Indicesof maternal blood loss may be improved; for example, mean Hbmay be higher by 0.5 g/dL in the active group. However, the av-erage difference may not be clinically important, as routine blooddonation reduces Hb levels by approximately 0.6 g/dL (Burnley2006), without ill effects, and postnatal women undergo a diure-sis postnatally that reverses the haemodilution of pregnancy, thusincreasing their Hb levels within a few days after birth (Hytten2001; Taylor 1981). The more clinically important effects are thepossible reduction in severe PPH rate, need for transfusion anduterotonic therapy, which suggests (with very low-quality) its ef-fectiveness in lessening the severe bleeding that can prove life-threatening if left untreated.However, active management (with moderate-quality evidence)probably reduces average birthweight for the baby (possibly dueto decreased placental transfusion at birth arising from the earlycord clamping component, Farrar 2009a), and (with low-qualityevidence) may increase the incidence of maternal postpartum di-astolic blood pressure greater than 90 mmHg (possibly due to theuse of ergometrine-based uterotonics), afterpains, need for post-partum analgesia in the labour ward, and women having to returnto hospital because of bleeding. Using data from only the high-quality studies showed similar results.The main findings may also be presented using the ’numberneeded to treat for an additional harmful outcome’. There wouldbe one fewer severe PPH for every 66 women who had active man-agement (95% CI 44 to 127) and one woman fewer with a post-natal Hb under 9 g/dL for every 28 women who had active man-agement (95% CI 17 to 73). Conversely, there would be one morewoman with a diastolic blood pressure greater than 90 mmHg forevery 52 women who had active management (95% CI 38 to 83)and one more woman who had to return to hospital because ofbleeding for every 65 women who had active management (95%CI 39 to 192).Although this analysis considers women irrespective of risk ofbleeding, the studies mainly included women at low risk of bleed-ing, with just one out of the four studies specifically includingwomen of any risk. There were no specific data on women con-sidered to be at high risk of bleeding.Overall, active management may reduce the risk of severe bleed-ing, and it would be important to investigate if this benefit arosefrom the uterotonic component of the active management alone.The negative effects of active management appear, in the main, to
27Active versus expectant management for women in the third stage of labour (Review)
Copyright © 2019 The Cochrane Collaboration. Published by John Wiley & Sons, Ltd.

be due either to 1) the administration of a specific uterotonic (e.g.hypertension due to ergometrine-containing preparations and hy-potension due to intravenous oxytocin boluses (Lewis 2007)), or2) possibly to controlled cord traction leading to retained shredsof membrane or placenta, thus causing the increased incidenceof return to hospital due to bleeding, or 3) early cord clampingleading to a 20% reduction in the baby’s blood volume. Differentuterotonics will have differing effects, and clinicians will need toassess the optimum one to use according to the circumstances.Recent international guidelines have turned to intramuscular oxy-tocin as a uterotonic that provides effective prophylaxis but with-out the associated side effects (ICM-FIGO 2003; NICE 2014;WHO 2012) and a recent network meta-analysis has suggestedthat the most effective drugs for preventing PPH of 500 mL ofmore could be ergometrine and oxytocin, carbetocin, or misopros-tol combined with oxytocin (Gallos 2018). However, most of thesestudies group together intramuscular and intravenous oxytocin,and a recent randomised study suggests that the intravenous routemay be more effective (Adnan 2018). In this Cochrane Review, ofthe eight studies, three administered the drug intravenously andfive intramuscularly. Thus some of the oxytocics may have beenless effective and so reduced the overall efficacy of the prophylaxis.The possible increased incidence of women in the active man-agement group having to return to hospital due to bleeding is ofconcern, as such bleeding takes place away from immediate accessto medical assistance. This would, again, be of greater significancefor women in low-income countries.The probable reduction in the average birthweight of babies fol-lowing active management is possibly due to a reduction in placen-tal transfusion following early cord clamping (McDonald 2013;Rabe 2012; RCOG 2009). The evidence from the studies we iden-tified is that the average volume of transfused blood was 77 mL(45 to 108 mL) based on differences in the birthweight betweenthe groups. This estimate is consistent with historical data (Yao1974), and also with more recent data (Farrar 2009a). Farrar’ssmall study (n = 26) weighing babies at birth on accurate scalesto calculate placental transfusion showed that 79 mL (interquar-tile range 50 to 163 mL) of extra blood was transfused to babiesfollowing vaginal births and 84 mL (interquartile range 59 to 165mL) following caesarean births. Placental transfusion for most ofthese babies was completed by about three minutes after birth,but transfusion continued for up to five minutes for some babies(Farrar 2009a). As all babies in this study breathed normally atbirth, further studies are necessary to ascertain whether or not thecord remains pulsating for longer if the baby has not commencedrespiration.With expectant management, term infants receive about 80 mLmore blood from placental transfusion than with active manage-ment, with its early cord clamping - thus adding about 20% moreto the infant’s blood volume (Werner 2005). This may be asso-ciated with a lower incidence of anaemia in infancy (Cernadas2006; Chaparro 2006; McDonald 2013; Van Rheenan 2007). It
is possible that anaemia in early infancy may have adverse effectsfor the infant’s longer-term growth and development, particu-larly for infants born in low-income countries. Although it is alsoplausible that placental transfusion with expectant managementmay increase the risk of neonatal jaundice requiring photother-apy (McDonald 2013), there was no evidence for this in the twostudies that assessed this outcome. Finally, it needs to be consid-ered that in the context of the administration of a powerful utero-tonic, early cord clamping may protect the baby by preventing asudden increase of blood volume into the transitional circulation,that might disrupt physiological processes such as duct closure,lung fluid reabsorption and cerebral haemodynamic autoregula-tion. This may be particularly important to infants who are slowto breathe (Mercer 2008). This problem can be avoided by giv-ing the uterotonic drug immediately following the deferred cordclamping. The included studies did not report on these specificneonatal adverse outcomes, but this review did not find evidencethat admission rates to special care baby units (SCBU) or neonatalintensive care units (NICU) were affected by the types of third-stage management included (average RR 0.81, 95% CI 0.60 to1.11, 2 studies, 3207 babies).In the three studies that documented both severe PPH (≥ 1000mL) and number of blood transfusions (Begley 1990; Prendiville1988; Rogers 1998), it is noted that a total of 78 out of the 4636women had a severe PPH, whereas 94 received a blood transfu-sion, perhaps indicating an over-use of this treatment in a healthypopulation, under-estimation of blood loss, or undetected low an-tenatal haemoglobins in some women. Given that a woman’s bodyis well prepared for normal blood loss at birth by the haemodilu-tion of pregnancy (Mims 2005), and that 600 mL to 750 mL ofdiluted blood is equivalent to a routine blood donation, it is possi-ble that the impact of blood losses less than 750 mL are not severein normal, healthy women, but this needs investigation. In addi-tion, the decrease in plasma volume in the early days after birthincreases postnatal Hb concentration in a reversal of haemodilu-tion (Hytten 2001; Mims 2005; Taylor 1981).
Active versus expectant management of the third
stage of labour in women at low risk of bleeding
In hospitals in higher-income settings, we found that it was uncer-tain whether active management (with very low-quality evidence)reduced maternal primary PPH greater than 1000 mL, althoughthe number of women was insufficient to assess this outcome withconfidence (two studies, 2941 women) and further studies wouldbe needed to study this association.One small study (n = 193) compared the number of women withHb levels less than 9 g/dL postnatally (Thilaganathan 1993) butthe high risk of bias identified means that we cannot rely on thefindings. None of the studies assessed Apgar scores less than 7 atfive minutes. Other indices of maternal blood loss (with low-qual-ity evidence) may be reduced with the use of active management
28Active versus expectant management for women in the third stage of labour (Review)
Copyright © 2019 The Cochrane Collaboration. Published by John Wiley & Sons, Ltd.

in this population. Active management again resulted (with mod-erate-quality evidence) in a probable lower birthweight (possiblydue to reduced placental transfusion), and (with low-quality evi-dence) might result in an increase in the incidence of postpartumdiastolic blood pressure greater than 90 mmHg, afterpains, needfor postpartum analgesia in the labour ward, and having to returnto hospital as an in- or outpatient because of bleeding.
Mixed managements around the timing of cord
clamping in combination with the timing of
uterotonic drug
Active versus mixed management of third stage of labour:
all women, delayed prophylactic uterotonic administration,
delayed cord clamping, no controlled cord traction (one
study, 654 women)
The one study included (Yildirim 2016), was of low quality (un-clear on four of the assessment criteria, and at high risk of biasfor lack of blinding). The women were all at low risk of bleeding.The results indicated that, compared with mixed management, ac-tive management (with low-quality evidence) may slightly reducemean length of the third stage, and slightly increase birthweight.It is uncertain if active management (with very low-quality evi-dence) makes any difference, improves, or reduces rates of mater-nal blood transfusions, therapeutic uterotonics during the thirdstage or within the first 24 hours, manual removal of placenta, orsurgical evacuation of retained products of conception.
Active versus mixed management of the third stage of
labour: all women, immediate cord clamping, no controlled
cord traction and uterotonic after placental delivery (one
study, 1648 women, comparison not pre-specified)
The one study (Khan 1997), assessing this comparison was ofuncertain quality (sequence generation was unclear). The resultsindicated that it is uncertain whether active management (withvery low-quality evidence) showed a reduction in severe primaryPPH. It is also uncertain whether active management (with verylow-quality evidence) showed a reduction in the rate of blood lossgreater than 500 mL, use of therapeutic uterotonics postpartumand length of the third stage, and it is uncertain if active man-agement (with very low-quality evidence) reduces or improves thenumber of blood transfusions (Figure 2).
Active versus mixed management of third stage of labour:
all women, no routine uterotonic, immediate cord clamping,
no controlled cord traction (one study, 1631 women,
comparison not pre-specified)
The one study included was of high quality (Jangsten 2011). Com-pared with mixed management, it is uncertain if active manage-ment (with very low-quality evidence) reduces severe primary PPHor rates of maternal Hb less than 9 g/dL at 24 to 72 hours. Activemanagement (with low-quality evidence) may reduce the rate ofblood loss greater than 500 mL and mean length of the third stage,may make little or no difference to mean birthweight, and (withmoderate-quality evidence) probably reduces the use of therapeu-tic uterotonics during the third stage. It is uncertain whether activemanagement (with very low-quality evidence) improves or reducesthe number of maternal blood transfusions or rate of manual re-moval of placenta.
Active versus mixed management of third stage of labour:
all women, no routine uterotonic, immediate cord clamping,
controlled cord traction (one study, 130 women, comparison
not pre-specified)
The one study included was of moderate quality (Jerbi 2007). Theresults indicated that it is uncertain whether active management(with very low-quality evidence) reduces maternal Hb less than9 g/dL at 24 to 72 hours, compared to mixed management. It isuncertain if active management (with very low-quality evidence)showed a reduction in mean length of the third stage, or makes anydifference to the incidence of rates of manual removal of placenta.
Overall completeness and applicability ofevidence
Four studies compared active versus expectant management of thethird stage of labour and four compared active versus mixed man-agement. All were conducted in hospitals, seven in higher-incomesettings, and one in a lower-income setting (n = 130). Four studiesinvolved women at low risk of bleeding and four included womenirrespective of their risk of bleeding. Given these factors, the resultsof the meta-analysis can only be applied to care given in higher-income settings. As only four studies (two of uncertain quality),compared active versus mixed management, and all mixed man-agements differed, we are unable to draw firm conclusions on anyapparent differences between these two managements. Also, formany of the outcomes there is heterogeneity in the treatment ef-fects, so there is no information as to the specific factors that mightaffect the difference between active and expectant management.
Quality of the evidence
The evidence presented on the primary outcomes selected is basedon results of a small number of studies with relatively small num-bers of participants. The lack of consistent high-quality evidencefor these outcomes should be borne in mind when considering theoverall results (see Summary of findings for the main comparison).
29Active versus expectant management for women in the third stage of labour (Review)
Copyright © 2019 The Cochrane Collaboration. Published by John Wiley & Sons, Ltd.

We assessed the methodological quality of the included studies as‘high quality’ in terms of sequence generation, allocation conceal-ment and complete outcome data for three studies (Begley 1990;Jangsten 2011; Rogers 1998). We undertook sensitivity analysisby study quality to assess for any substantial difference in the mainresults. This made little difference to the overall findings except toindicate that there was no high-quality evidence for the results ofcomparisons between active management and mixed managementof the third stage of labour.In all studies, there is the problem of assessment of blood loss byclinicians where no blinding is possible. However, studies usedother indices of blood loss, such as postnatal Hb, which may havebeen assessed by technicians blinded to treatment allocation. Forthis reason, we included an outcome that had not been pre-speci-fied, mean postnatal Hb, in addition to comparing the number ofwomen with Hb levels less than 9 g/dL at 24 to 72 hours, whichnot all studies had measured.Adherence to intervention protocols and, in particular, to the man-agement proposed for the two study arms was mixed (Table 2).In the three high-quality studies (Begley 1990; Jangsten 2011;Rogers 1998), the majority of women in the active managementarm (93% to 100%) received a uterotonic as directed. In the ex-pectant management arm, however, practice varied widely, with86% receiving “no uterotonic” in one study (Begley 1990), 76.5%in another (Rogers 1998), and 62% in the third (Jangsten 2011).Only 50% of women in the expectant management arm in onestudy (Prendiville 1988), received “no uterotonic”, with no infor-mation given in the other three studies. The intervention protocolfor the expectant arm of Prendiville 1988 did allow for adminis-tration of a uterotonic if necessary, as it stated, “Try not to givea uterotonic”; however, the actual proportion that received thedrug appears incompatible with a philosophy of expectant man-agement. In addition, the fact that the administration of the sameuterotonic that constituted the main treatment in active manage-ment to half of the ’expectant’ management group as well, doesraise questions as to the usefulness of the findings. The resulting’mixed’ management may also increase levels of blood loss andother complications, as changing the study protocol after the first425 births to exclude participants when mixed management hadto be used (due to cutting the cord early because of nuchal cord,concerns about meconium or baby needing resuscitation) resultedin a decrease in PPH rate.In addition, Prendiville 1988 included women at increased risk ofbleeding. The total numbers involved are not clear, but 84 (5%)had previous third-stage problems, 212 (13%) had an epidural inlabour, and 230 (14%) had assisted births. As these women arelikely to have a higher blood loss when expectant management isused, clinicians experiencing this may respond by anxiety in subse-quent births using expectant management, even for women at lowrisk of bleeding, and be more likely to give a uterotonic early; thismay have increased the intervention or ’mixed management’ ratesin women allocated to expectant management in this study (30%
received uterotonic for treatment, and 20% prophylactically), andwould also have decreased the opportunity for those midwives tokeep up their skill level in expectant management.A second study, comparing active with mixed management, alsoincluded women at increased risk of bleeding (Jangsten 2011),with similar possible results as above: 7% (n = 131) had a caesareansection, 714 (40%) had an epidural in labour, and 148 (8%) hada ventouse birth.The skill of the midwives in both forms of care in all studies isof interest. The midwives in Rogers 1998 were said to be “sim-ilarly confident” in active and expectant management. However,the questionnaire administered to 92 of the 153 midwives priorto the study commencement showed that, whereas 84% felt “veryconfident” of active management, only 41% were “very confident”of expectant management. Similarly, Prendiville 1988 states that,before the study commenced, the researchers sought the advice ofmidwives in the UK who were “known to practise physiologicalmanagement” and then used this advice to train the midwives.Only six (13%) of the midwives in this study, however, said thatthey were very confident of physiological management before thestudy started and 22 (46%) afterwards. Harding 1989 found that,of 49 midwives responding to a questionnaire regarding this study,30 (61%) had never managed a third stage physiologically. Amongthe remaining 19, only one had practised physiological manage-ment as defined in the study. Those in Begley 1990 were also moreused to active management and the PPH rate in the expectant armfell during the study from 21% in the pilot study to 7% in thelast six months, as they developed their skills. Yildirim 2016 wasunique in that the authors had to train clinicians for the activemanagement protocol, particularly in how to perform controlledcord traction, as it was not common practice in the hospital at thetime.Midwives’ skill and the accurate measurement of blood loss obvi-ously has an impact on documented blood loss in the third stageof labour. For example, the mean (estimated) blood loss in the ac-tive arm of Rogers 1998 (269 mL, standard deviation (SD) 246),was actually greater than the mean (measured) blood loss in theexpectant arm of Begley 1990 (235 mL, SD 224). This indicatesthat results of all these studies need to be examined in conjunctionwith local practice, to ascertain whether or not similar results willbe found in different settings.Finally, Prendiville 1988 changed the protocol after 425 births,but included all births in the results, which may have affected thefindings.We examined the quality of the body of evidence for our fourprimary outcomes for which we found data (severe primary PPH(≥ to 1000 mL at time of birth), maternal Hb < 9 g/dL 24 to72 hours postpartum, admission to SCBU or NICU, neonataljaundice requiring phototherapy or exchange transfusion) usingGRADE. The GRADE assessments were of either low or very lowquality. Downgrading decisions were based on inconsistency intwo of the outcomes, and risk of bias and imprecision in all four
30Active versus expectant management for women in the third stage of labour (Review)
Copyright © 2019 The Cochrane Collaboration. Published by John Wiley & Sons, Ltd.

- see Summary of findings for the main comparison.
Potential biases in the review process
All the authors of this review have an interest in third-stage man-agement, and each brings different views on the methods thatmight be used. C Begley conducted one of the studies included inthe review, and is a member of a team who conducted a systematicreview for the International Confederation of Midwives (ICM)on expectant management of the third stage of labour. G Gyte haswritten on the third stage and is a involved in a study on timingof cord clamping in preterm birth, and other members have writ-ten on third-stage management. W McGuire is also involved infurther studies on timing of cord clamping. A Weeks is involvedin running clinical studies of the timing of cord clamping andmisoprostol for third-stage prophylaxis in low-resource settings.However, the review authors’ views differed and, during the reviewprocess, discussion and consensus was necessary to reach a finalconclusion acceptable to all. Although all humans bring potentialbiases to any endeavour, we did try to ensure that our eventualconclusion arose solely from the data. Feedback from an interna-tional audience will serve to improve the next review update.
Agreements and disagreements with otherstudies or reviews
Previous version of this review
Our assessment of the evidence differs from the first publishedversion of this review (Prendiville 2000), which concluded thatactive management was “superior” to expectant management. Forthe main comparison, we have no additional studies but we anal-ysed four studies (Jangsten 2011; Jerbi 2007; Yildirim 2016; Khan1997), in different categories of ’active compared with mixed man-agement’, which were not included in the main analysis. We have,however, used the recent methodology introduced for CochraneReviews, which assesses risk of bias in the individual studies morecarefully than in the past (Higgins 2017). We also chose to use arandom-effects model for analysis due to the clear variations in thespecific forms of both active and expectant management used inthe included studies (clinical heterogeneity). Our findings, there-fore, differ for some outcomes because of this decision (particu-larly for the group of women at low risk of bleeding) but we havereported Tau² and I² statistic, regardless of level of heterogeneity.We believe the evidence shows both benefits and harms for activemanagement, and believe it is now critical to look at the advan-tages and disadvantages of the individual components of third-stage management to see if the benefits can be achieved with fewerharms.The previous authors of this review recommended active man-agement of the third stage due to the benefit identified in terms
of reduced incidence of severe bleeding. We agree that bleedingis a very important component when balancing the benefits andharms of active compared to expectant management of the thirdstage of labour. However, we consider that the number of harmscaused by active management also deserve consideration. In par-ticular, the increased rate of hypertension, increased numbers ofmothers returning to hospital due to bleeding, and the possibledecrease in average blood volume of newborns reflected in thelower birthweight for babies where the mother has received activemanagement of the third stage, are of concern. In the populationof women at low risk of bleeding, such harms are of more con-cern, as there was no statistical evidence that severe bleeding wasreduced by active management. Further studies would be neededto confirm if there is a difference or not. Our analysis of women atlow risk of bleeding differs from the previous version of the reviewin that we excluded the Prendiville data (Prendiville 1988), as weconsidered there to be a high risk of bias because the randomisa-tion was not stratified by high and low risk of bleeding and therewere no specific data in the published study to enable us to usethe data had we chosen to do so.
Other systematic reviews on active versus expectant
management of the third stage of labour
Active management in the included studies involved, in general,clamping and cutting the cord soon after the baby’s birth. A num-ber of women in the expectant management groups also had theirbaby’s cord clamped and cut before pulsation had ceased. AnotherCochrane Review has recommended that, in future, the umbili-cal cord should not be clamped and cut until after pulsation hasceased, regardless of the type of management used (McDonald2013); if this change in practice is implemented it may negate theharms of active management due to early cord clamping. How-ever, the optimum timing of the administration of the uterotonicstill needs to be determined clearly. Despite the evidence from theCochrane Review regarding timing of cord clamping (McDonald2013), a survey of 1176 members of the Royal College of Obste-tricians and Gynaecologists (RCOG) and 1445 members of theRoyal College of Midwives (RCM) in the UK found that the ma-jority (94% and 71%, respectively) ’always’ or ’usually’ use activemanagement, and 73% and 40% clamp the cord within 20 sec-onds (Farrar 2009b). It would thus appear that there is consider-able variation in practice and not all practitioners use the completepackage of ‘active’ or ‘expectant’ management as described in thesestudies.Drawing on evidence from the Cochrane Review on ’Prophylac-tic ergometrine-oxytocin versus oxytocin for the third stage oflabour’ (McDonald 2007b), and other research on ergot com-pounds (Maughan 2006), we would expect that omitting the er-got component of the prophylactic uterotonic drug used as partof active management of the third stage should reduce the adverseeffects of hypertension identified for active management.
31Active versus expectant management for women in the third stage of labour (Review)
Copyright © 2019 The Cochrane Collaboration. Published by John Wiley & Sons, Ltd.
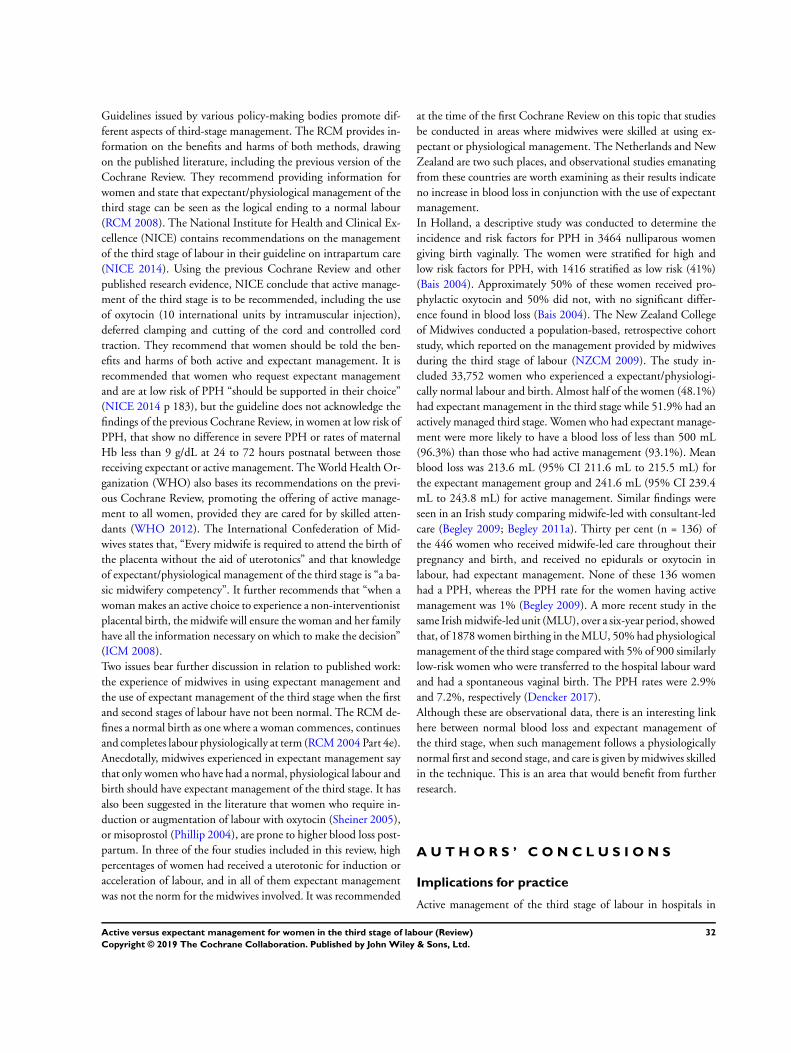
Guidelines issued by various policy-making bodies promote dif-ferent aspects of third-stage management. The RCM provides in-formation on the benefits and harms of both methods, drawingon the published literature, including the previous version of theCochrane Review. They recommend providing information forwomen and state that expectant/physiological management of thethird stage can be seen as the logical ending to a normal labour(RCM 2008). The National Institute for Health and Clinical Ex-cellence (NICE) contains recommendations on the managementof the third stage of labour in their guideline on intrapartum care(NICE 2014). Using the previous Cochrane Review and otherpublished research evidence, NICE conclude that active manage-ment of the third stage is to be recommended, including the useof oxytocin (10 international units by intramuscular injection),deferred clamping and cutting of the cord and controlled cordtraction. They recommend that women should be told the ben-efits and harms of both active and expectant management. It isrecommended that women who request expectant managementand are at low risk of PPH “should be supported in their choice”(NICE 2014 p 183), but the guideline does not acknowledge thefindings of the previous Cochrane Review, in women at low risk ofPPH, that show no difference in severe PPH or rates of maternalHb less than 9 g/dL at 24 to 72 hours postnatal between thosereceiving expectant or active management. The World Health Or-ganization (WHO) also bases its recommendations on the previ-ous Cochrane Review, promoting the offering of active manage-ment to all women, provided they are cared for by skilled atten-dants (WHO 2012). The International Confederation of Mid-wives states that, “Every midwife is required to attend the birth ofthe placenta without the aid of uterotonics” and that knowledgeof expectant/physiological management of the third stage is “a ba-sic midwifery competency”. It further recommends that “when awoman makes an active choice to experience a non-interventionistplacental birth, the midwife will ensure the woman and her familyhave all the information necessary on which to make the decision”(ICM 2008).Two issues bear further discussion in relation to published work:the experience of midwives in using expectant management andthe use of expectant management of the third stage when the firstand second stages of labour have not been normal. The RCM de-fines a normal birth as one where a woman commences, continuesand completes labour physiologically at term (RCM 2004 Part 4e).Anecdotally, midwives experienced in expectant management saythat only women who have had a normal, physiological labour andbirth should have expectant management of the third stage. It hasalso been suggested in the literature that women who require in-duction or augmentation of labour with oxytocin (Sheiner 2005),or misoprostol (Phillip 2004), are prone to higher blood loss post-partum. In three of the four studies included in this review, highpercentages of women had received a uterotonic for induction oracceleration of labour, and in all of them expectant managementwas not the norm for the midwives involved. It was recommended
at the time of the first Cochrane Review on this topic that studiesbe conducted in areas where midwives were skilled at using ex-pectant or physiological management. The Netherlands and NewZealand are two such places, and observational studies emanatingfrom these countries are worth examining as their results indicateno increase in blood loss in conjunction with the use of expectantmanagement.In Holland, a descriptive study was conducted to determine theincidence and risk factors for PPH in 3464 nulliparous womengiving birth vaginally. The women were stratified for high andlow risk factors for PPH, with 1416 stratified as low risk (41%)(Bais 2004). Approximately 50% of these women received pro-phylactic oxytocin and 50% did not, with no significant differ-ence found in blood loss (Bais 2004). The New Zealand Collegeof Midwives conducted a population-based, retrospective cohortstudy, which reported on the management provided by midwivesduring the third stage of labour (NZCM 2009). The study in-cluded 33,752 women who experienced a expectant/physiologi-cally normal labour and birth. Almost half of the women (48.1%)had expectant management in the third stage while 51.9% had anactively managed third stage. Women who had expectant manage-ment were more likely to have a blood loss of less than 500 mL(96.3%) than those who had active management (93.1%). Meanblood loss was 213.6 mL (95% CI 211.6 mL to 215.5 mL) forthe expectant management group and 241.6 mL (95% CI 239.4mL to 243.8 mL) for active management. Similar findings wereseen in an Irish study comparing midwife-led with consultant-ledcare (Begley 2009; Begley 2011a). Thirty per cent (n = 136) ofthe 446 women who received midwife-led care throughout theirpregnancy and birth, and received no epidurals or oxytocin inlabour, had expectant management. None of these 136 womenhad a PPH, whereas the PPH rate for the women having activemanagement was 1% (Begley 2009). A more recent study in thesame Irish midwife-led unit (MLU), over a six-year period, showedthat, of 1878 women birthing in the MLU, 50% had physiologicalmanagement of the third stage compared with 5% of 900 similarlylow-risk women who were transferred to the hospital labour wardand had a spontaneous vaginal birth. The PPH rates were 2.9%and 7.2%, respectively (Dencker 2017).Although these are observational data, there is an interesting linkhere between normal blood loss and expectant management ofthe third stage, when such management follows a physiologicallynormal first and second stage, and care is given by midwives skilledin the technique. This is an area that would benefit from furtherresearch.
A U T H O R S ’ C O N C L U S I O N S
Implications for practice
Active management of the third stage of labour in hospitals in
32Active versus expectant management for women in the third stage of labour (Review)
Copyright © 2019 The Cochrane Collaboration. Published by John Wiley & Sons, Ltd.

higher-income settings may bring benefits to women of mixed lev-els of risk of bleeding in terms of reducing mean maternal bloodloss and probably reducing blood loss (greater than 500 mL) al-though it is uncertain if it reduces severe blood loss (greater than1000 mL). It probably reduces the use of therapeutic uterotonics,but it may also cause harm, such as postnatal hypertension, painand return to hospital due to bleeding. In addition, active man-agement is probably associated with a reduction in birthweightpossibly reflecting a reduction in neonatal blood volume due toearly cord clamping.
In women at low risk of bleeding, we found that it was uncer-tain whether active management reduced severe blood loss (greaterthan 1000 mL) although there was still a reduction in other in-dices of maternal blood loss (low-quality evidence). Active man-agement again resulted in a probable lower birthweight (moderate-quality evidence) and an increase in the incidence of postpartumdiastolic blood pressure greater than 90 mmHg (with low-qualityevidence), afterpains, need for postpartum analgesia in the labourward, and having to return to hospital as an in- or outpatient be-cause of bleeding. It must be emphasised that this review includesonly a small number of studies with relatively small numbers ofparticipants, and the quality of evidence for primary outcomes islow or very low.
In the context of these studies, in higher-income settings with highlevels of clinician expertise and adequate access to emergency care,healthy women do not appear to suffer unduly from the resultsof above average blood loss (about 500 mL) that does not reachthe level of severe (greater than 1000 mL) primary postpartumhaemorrhage (PPH; Bloomfield 1990). There are both benefitsand harms from active management of the third stage and it is alsounclear whether all three components of the active managementpackage are required to gain the benefit of reduced PPH.
Healthcare providers could, therefore, present information to allwomen in the antenatal period on the advantages and disadvan-tages of both methods of third-stage management to facilitate theirdiscussion and informed choice of care. This information couldinclude not only the benefits of active management (reduces therisk of severe blood loss and postnatal anaemia in women at mixedrisk of bleeding) but also the harms to the mother (increases therisk of hypertension if using ergot compounds, increases after-pains, need for analgesia, and bleeding following discharge). Inaddition, information regarding the effects on the baby of earlyversus deferred cord clamping could be provided whilst acknowl-edging the uncertainty deferred cord clamping brings due to thelack of evidence around optimal timing of the prophylactic utero-tonic.
Although the studies in the review did not assess women atincreased risk of bleeding specifically, it can be deduced fromPrendiville 1988 that for these women the benefit of reduced bloodloss is likely to outweigh the harms. This may lead clinicians to
suggest active management of the third stage with a prophylacticuterotonic that contains no ergot, and also deferred cord clamp-ing, though women’s choice should always be respected.
Women at low risk of bleeding could be informed of the potentialbenefits and adverse effects of both expectant and active manage-ment of the third stage of labour, and how adverse effects can beminimised. When expectant management is used, it is importantthat the option of using a uterotonic (non-ergot based initially) astreatment at any time is available if excess bleeding occurs. Theseresults cannot, and should not, be extrapolated to other contextssuch as low-income countries where access to care is often severelyrestricted, or those countries with insufficient trained clinicians orinadequate emergency care
Implications for research
In the next update of this review we will assess the use of theagreed core outcome set on PPH (Meher 2019). Future studiescould consider the results of the Cochrane Review on timing ofcord clamping (McDonald 2013), and consider inclusion of theelement of leaving the cord unclamped until it has stopped pulsat-ing (or has gone ’white’, indicating the vein has emptied) in theirprotocols for both active and expectant management. Individualcomponents of both types of management could be examined infurther studies. All future studies could aim to include maternal,fetal and infant outcomes, as listed in this review, or in the coreoutcome set on PPH, or both (Meher 2019), as far as is practicable.Studies are needed in low-income or resource-constrained coun-tries. Studies could establish whether, in order to reduce bleedingfor the mother, a uterotonic drug is what is needed rather than allthree components of active management of the third stage. Stud-ies similar to two recent studies that looked at active managementwith or without controlled cord traction (Deneux-Tharaux 2013;Gulmezoglu 2012), will assist in answering this question.
It is also critical to establish whether or not a routine uterotonicis really necessary for healthy women at low risk of bleeding, andwhat is the optimum time for administration (i.e. before or aftercord clamping). The concept of ’secondary prophylaxis’ used whennecessary in conjunction with expectant management, where theuterotonic is given at the first sign of excessive blood loss (e.g. 350mL), deserves further exploration as a way of reducing the rateof side effects for healthy women. In addition, it is important toconsider the adverse effects on the mother’s blood pressure, pain,and returning to hospital after the birth because of bleeding.
Future studies may compare different types of expectant manage-ment; for example, comparing expectant management with ex-pectant management followed by uterotonic, or expectant man-agement using maternal effort only with expectant managementusing maternal effort and gentle cord traction. Given the possibil-ity that women who require induction or augmentation of labourwith a uterotonic are prone to higher postpartum blood loss, re-
33Active versus expectant management for women in the third stage of labour (Review)
Copyright © 2019 The Cochrane Collaboration. Published by John Wiley & Sons, Ltd.

searchers could consider if such women should be excluded fromfuture studies including an expectant management arm, as thenatural release of oxytocin may be inhibited by the administrationof exogenous oxytocics or other uterotonics.
A C K N O W L E D G E M E N T S
We acknowledge the work of the previous review team, uponwhich the protocol was based (Prendiville 2000), and also the con-tribution of Deirdre Murphy and Sue McDonald in the previousversions of this review. We thank the study authors who provided
additional information on request: Beck (on behalf of Muller),Begley, Hoffman, Rogers/Elbourne, Thilaganathan, Yildirim.
Particular thanks to Therese Dowswell, who contributed greatlyto data extraction and tables on a previous version.
Thanks to Nazie AmirAnsari and Alireza Karbalaei who translatedVasegh 2005 and Emily Lemon who translated Muller 1996.
This project was supported by the National Institute for HealthResearch, via Cochrane Infrastructure funding to Cochrane Preg-nancy and Childbirth. The views and opinions expressed thereinare those of the authors and do not necessarily reflect those of theSystematic Reviews Programme, NIHR, NHS or the Departmentof Health.
R E F E R E N C E S
References to studies included in this review
Begley 1990 {published and unpublished data}
Begley CM. Comparative Studies in the Third Stage of Labour
[thesis]. Dublin: Trinity College, University of Dublin,Ireland, 1989.∗ Begley CM. A comparison of ’active’ and ’physiological’management of the third stage of labour. Midwifery 1990;6:3–17.Begley CM. A comparison of physiological andpharmacological methods of managing the third stage oflabour. Personal communication 1987.Begley CM. The effect of ergometrine on breast feeding.Midwifery 1990;6:60–72.
Jangsten 2011 {published and unpublished data}
Jangsten E, Bergh I, Mattsson LA, Hellstrom AL, Berg M.Afterpains: a comparison between active and expectantmanagement of the third stage of labor. Birth 2011;38(4):294–301.∗ Jangsten E, Mattsson LA, Lyckestam I, Hellstrom AL,Berg M. A comparison of active management and expectantmanagement of the third stage of labour: a Swedishrandomised controlled trial. BJOG 2011;118(3):362–9.NCT01221051. A comparison of active and expectantmanagement of the third stage of labor. clinicaltrials.gov/ct2/show/NCT01221051 (first received 14 October 2010).
Jerbi 2007 {published data only}
Jerbi M, Hidar S, Elmoueddeb S, Chaieb A, Khairi H.Oxytocin in the third stage of labor. International Journal ofGynecology & Obstetrics 2007;96(3):198–9.
Khan 1997 {published data only}
Khan GQ, John IS, Wani S, Doherty T, Sibai BM.Controlled cord traction versus minimal interventiontechniques in delivery of the placenta: a randomisedcontrolled trial. American Journal of Obstetrics and
Gynecology 1997;177(4):770–4.
Prendiville 1988 {published data only}
Elbourne DR, Harding J. The Bristol third stage trial.Proceedings of Research and the Midwives Conference;1989; Manchester, UK. 1989:19–31.Harding JE, Elbourne DR, Prendiville WJ. Viewsof mothers and midwives participating in the Bristolrandomized, controlled trial of active management of thethird stage of labor. Birth 1989;16:1–6.∗ Prendiville WJ, Harding JE, Elbourne DR, Stirrat GM.The Bristol third stage trial: active versus physiologicalmanagement of third stage of labour. BMJ 1988;297:1295–300.
Rogers 1998 {published data only}
ISRCTN63422923. Active versus expectant managementof third stage of labour: the Hinchingbrooke randomisedcontrolled trial. isrctn.com/ISRCTN63422923 (firstreceived 23 January 2014).∗ Rogers J, Wood J, McCandlish R, Ayers S, Truesdale A,Elbourne D. Active versus expectant management of thirdstage of labour: the Hinchingbrooke randomised controlledtrial [see comments]. Lancet 1998;351(9104):693–9.Wood J, Rogers J, Elbourne D, McCandlish R, TruesdaleA. The Hinchingbrooke third stage trial. InternationalConfederation of Midwives 24th Triennial Congress; 1996May 26-31; Oslo, Norway. 1996:140.
Thilaganathan 1993 {published data only}
Thilaganathan B, Cutner A, Latimer J, Beard R.Management of the third stage of labour in women atlow risk of postpartum haemorrhage. European Journal of
Obstetrics & Gynecology and Reproductive Biology 1993;48:19–22.
Yildirim 2016 {published data only}
Yildirim D, Ozyurek SE, Ekiz A, Eren EC, HendemDU, Bafali O, et al. Comparison of active vs. expectantmanagement of the third stage of labor in women with lowrisk of postpartum hemorrhage: a randomized controlledtrial. Ginekologia Polska 2016;87(5):399–404.
34Active versus expectant management for women in the third stage of labour (Review)
Copyright © 2019 The Cochrane Collaboration. Published by John Wiley & Sons, Ltd.

References to studies excluded from this review
Abdel-Aleem 2010 {published data only}
Abdel-Aleem H, Singata M, Abdel-Aleem M, MshweshweN, Williams X, Hofmeyr GJ. Uterine massage to reducepostpartum hemorrhage after vaginal delivery. InternationalJournal of Gynecology & Obstetrics 2010;111(1):32–6.
Deneux-Tharaux 2013 {published data only}
Deneux-Tharaux C, Sentilhes L, Maillard F, Closset E,Vardon D, Lepercq J, et al. Effect of routine controlledcord traction as part of the active management of the thirdstage of labour on postpartum haemorrhage: multicentrerandomised controlled trial (TRACOR). BMJ (ClinicalResearch Ed.) 2013;346:f1541.
Gulmezoglu 2012 {published data only}∗ Gulmezoglu AM, Lumbiganon P, Landoulsi S, WidmerM, Abdel-Aleem H, Festin M, et al. Active management ofthe third stage of labour with and without controlled cordtraction: a randomised, controlled, non-inferiority trial.[Erratum appears in Lancet. 2012 May 5;379(9827):1704].Lancet 2012;379(9827):1721–7.Gulmezoglu AM, Widmer M, Merialdi M, Qureshi Z,Piaggio G, Elbourne D, et al. Active management of thethird stage of labour without controlled cord traction: arandomized non-inferiority controlled trial. Reproductive
Health 2009;6:2.
Hoffman 2006 {published data only}∗ Hoffman M, Castagnola D, Naqvi F. A randomized trialof active versus expectant management of the third stageof labor [abstract]. American Journal of Obstetrics and
Gynecology 2006;195(6 Suppl 1):S107.Hoffman M, Naqvi F, Sciscione A. A randomized trialof active versus expectant management of the third stageof labor [abstract]. American Journal of Obstetrics and
Gynecology 2004;191(6 Suppl 1):S82.NCT00473707. A randomized trial of active versusexpectant management of the third stage of labor.clinicaltrials.gov/show/NCT00473707 (first received 15May 2007).
Kashanian 2010 {published data only}
Kashanian M, Fekrat M, Masoomi Z, Ansari NS.Comparison of active and expectant management on theduration of the third stage of labour and the amount ofblood loss during the third and fourth stage of labour: arandomised controlled trial. Midwifery 2010;26(2):241–5.
Magann 2006 {published data only}
Magann EF, Doherty DA, Briery CM, Niederhauser A,Chauhan SP, Morrison JC. Obstetric characteristics fora prolonged third stage of labor and risk for postpartumhemorrhage. Gynecologic and Obstetric Investigation 2008;65(3):201–5.∗ Magann EF, Doherty DA, Briery CM, Niederhauser A,Morrison JC. Timing of placental delivery to prevent post-partum haemorrhage: lessons learned from an abandonedrandomised clinical trial. Australian and New Zealand
Journal of Obstetrics and Gynaecology 2006;46(6):549–51.
Muller 1996 {published data only}
Muller R, Beck G. Active management of the third stageof labour. 19th Swiss Congress of the Swiss Societyof Gynecology and Obstetrics; 1996 June; Interlaken,Switzerland. 1996.
Neri-Mejia 2016 {published data only}
Neri-Mejia M, Pedraza-Aviles AG. Active managementof the third stage of labor: three schemes of oxytocin:randomised clinical trial. Ginecologia y Obstetricia DeMexico 2016;84(5):306–13.
Ramirez 2001 {published data only}
Ramirez O, Benito V, Jimenez R, Valido C, HernandezC, Garcia JA. Third stage of labour: active or expectantmanagement? preliminary results [abstract]. Journal of
Perinatal Medicine 2001;Suppl 1(Pt 2):364.
Vasegh 2005 {published data only}
Vasegh FR, Bahiraie A, Mahmoudi M, Salehi L. Comparisonof active and physiologic management of third stage oflabor. HAYAT: The Journal of Tehran Faculty of Nursing &Midwifery 2005;10(23):102.
References to studies awaiting assessment
Rosario 1973 {published data only}
Rosario YP Do, Jain CK. Active management of third stageof labour. Journal of Obstetrics and Gynaecology of India1973;23(1):66–9.
Additional references
Abouzaher 1998
Abouzaher C. Antepartum and postpartum haemorrhage.In: Murray CJL, Lopez AD editor(s). Health Dimensions ofSex and Reproduction. Boston: Harvard University Press,1998:172–4.
Adnan 2018
Adnan N, Conlan-Trant R, McCormick C, Boland F,Murphy DJ. Intramuscular versus intravenous oxytocinto prevent postpartum haemorrhage at vaginal delivery:randomised controlled trial. BMJ 2018;362:k3546.
Bais 2004
Bais J, Eskes M, Pel M, Bonsel G, Bleker O. Postpartumhaemorrhage in nulliparous women: incidence and riskfactors in low and high risk women. European Journal of
Obstetrics & Gynecology and Reproductive Biology 2004;115
(2):166–72.
Begley 2009
Begley C, Devane D, Clarke M. An Evaluation of Midwifery-
Led Care in the Health Service Executive North Eastern area:the Report of the MidU Study . Dublin: Health ServiceExecutive, December 2009.
Begley 2011a
Begley C, Devane D, Clarke M, McCann C, Hughes P,Reilly M, et al. Comparison of midwife-led and consultant-led care of healthy women at low risk of childbirthcomplications in the Republic of Ireland: a randomised
35Active versus expectant management for women in the third stage of labour (Review)
Copyright © 2019 The Cochrane Collaboration. Published by John Wiley & Sons, Ltd.

trial. BMC Pregnancy and Childbirth 2011;11:85–94. DOI:10.1186/1471-2393-11-85
Begley 2012
Begley C, Guilliland K, Dixon L, Reilly M, Keegan C.Irish and New Zealand midwives’ expertise in expectantmanagement of the third stage of labour: the ’MEET’study. Midwifery 2012;28:733–9. DOI: 10.1016/j.midw.2011.08.008
Blackburn 2008
Blackburn S. Physiological third stage of labour and birthat home. In: Edwins J editor(s). Community MidwiferyPractice. Oxford: Blackwell Publishing, 2008.
Bloomfield 1990
Bloomfield TH, Gordon H. Reaction to blood loss atdelivery. Journal of Obstetrics and Gynaecology 1990;10
(Suppl 2):S13–S16.
Bohren 2017
Bohren MA, Hofmeyr GJ, Sakala C, Fukuzawa RK,Cuthbert A. Continuous support for women duringchildbirth. Cochrane Database of Systematic Reviews 2017,Issue 7. DOI: 10.1002/14651858.CD003766.pub6
Bonnar 1970
Bonnar J, McNicol GP, Douglas AS. Coagulation andfibrinolysis mechanisms during and after normal childbirth.British Medical Journal 1970;2(103):200–3.
Buckley 2004
Buckley SJ. Undisturbed birth - nature’s hormone blueprintfor safety, ease and ecstasy. MIDIRS Midwifery Digest 2004;14(2):203–9.
Bullough 1989
Bullough CH, Msuku RS, Karonde L. Early suckling andpostpartum haemorrhage: controlled trial in deliveries bytraditional birth attendants. Lancet 1989;2(8662):522–5.
Burnley 2006
Burnley M, Roberts CL, Thatcher R, Doust JH, Jones AM.Influence of blood donation on O2 uptake on-kinetics,peak O2 uptake and time to exhaustion during severe-intensity cycle exercise in humans. Experimental Physiology
2006;91:499–509.
Cernadas 2006
Cernadas JM, Carroli G, Pellegrini L, Otano L, Ferreira M,Ricci C, et al. The effect of timing of cord clamping onneonatal venous hematocrit values and clinical outcome atterm: a randomized, controlled trial. Pediatrics 2006;117
(4):e779–e786.
Chaparro 2006
Chaparro CM, Neufeld LM, Tena Alavez G, Eguia-LízCedillo R, Dewey KG. Effect of timing of umbilical cordclamping on iron status in Mexican infants: a randomisedcontrolled trial. Lancet 2006;367(9527):1997–2004.
Deeks 2001
Deeks JJ, Altman DG, Bradburn MJ. Statistical methodsfor examining heterogeneity and combining results fromseveral studies in meta-analysis. In: Egger M, Davey Smith
G, Altman DG editor(s). Systematic Reviews in Health Care:
Meta-analysis in Context. London: BMJ Books, 2001.
Deeks 2017
Deeks JJ, Higgins JP, Altman DG (editors) on behalf of theCochrane Statistical Methods Group. Chapter 9: Analysingdata and undertaking meta-analyses. In: Higgins JPT,Churchill R, Chandler J, Cumpston MS (editors), CochraneHandbook for Systematic Reviews of Interventions version5.2.0 (updated June 2017), Cochrane, 2017. Available fromwww.training.cochrane.org/handbook.
Dencker 2017
Dencker A, Smith V, McCann C, Begley C. Midwife-ledmaternity care in Ireland - a cohort study. BMC Pregnancyand Childbirth 2017;17:101–8.
Devane 2007
Devane D, Begley C, Clarke M, Horey D, OBoyle C.Evaluating maternity care: a core set of outcome measures.Birth 2007;34(2):164–72.
Dixon 2013
Dixon L, Tracy S, Guilliland K, Fletcher L, Hendry C,Pairman S. Outcomes of physiological and active third stagelabour care amongst women in New Zealand. Midwifery
2013;29:67-74. DOI: 10.1016/j.midw.2011.11.003
Elbourne 1995
Elbourne D. Care in the third stage of labour. In: RobinsonS, Thomson AM editor(s). Midwives, Research and
Childbirth. Vol. 4, London: Chapman & Hall, 1995:192–207.
Farrar 2009a
Farrar D, Airey R, Tuffnell D, Law G, Cattle B, Duley L.Measuring placental transfusion for term births: weighingbabies with the cord intact. Archives of Disease in Childhood.Fetal and Neonatal Edition 2009;94(Suppl 1):Fa7.
Farrar 2009b
Farrar D, Airey R, Tuffnell D, Duley L. Care during thethird stage of labour: a postal survey of obstetricians andmidwives. Archives of Disease in Childhood. Fetal and
Neonatal Edition 2009;94(Suppl 1):Fa40.
Fleiss 1981
Fleiss JL. Statistical Methods for Rates and Proportions. 2ndEdition. New York: John Wiley & Sons, 1981.
Fry 2007
Fry J. Physiological third stage of labour: support it or loseit. British Journal of Midwifery 2007;15(11):693–5.
Gallos 2018
Gallos ID, Papadopoulou A, Man R, Athanasopoulos N,Tobias A, Price MJ, et al. Uterotonic agents for preventingpostpartum haemorrhage: a network meta-analysis.Cochrane Database of Systematic Reviews 2018, Issue 12.DOI: 10.1002/14651858.CD011689.pub3
GRADE 2013
Schünemann H, Bro ek J, Guyatt G, Oxman A (Editors).Handbook for grading the quality of evidence and thestrength of recommendations using the GRADE approach.
36Active versus expectant management for women in the third stage of labour (Review)
Copyright © 2019 The Cochrane Collaboration. Published by John Wiley & Sons, Ltd.

Updated October 2013. gdt.gradepro.org/app/handbook/handbook.html.
GRADEpro GDT 2015 [Computer program]
McMaster University (developed by Evidence Prime).GRADEpro GDT. Hamilton (ON): McMaster University(developed by Evidence Prime), 2015.
Greer 1998
Greer I, Lang G, Patel N. The management of postpartumhaemorrhage: a clinical practice guideline for professionalsinvolved in maternity care in Scotland. SPCERHpublication 6. www.abdn.ac.uk/spcerh/pubs.shtml#20021998 (accessed 2008).
Gyte 1992
Gyte G. The significance of blood loss at delivery. MIDIRSMidwifery Digest 1992;2(1):88–92.
Gyte 1994
Gyte GM. Evaluation of the meta-analyses on the effects,on both mother and baby, of the various components of’active’ management of the third stage of labour. Midwifery1994;10(4):183–99.
Gyte 2006
Gyte G. The third stage of labour. Part 2: activemanagement of third stage. National Childbirth Trust New
Digest 2006;36:22–8.
Harding 1989
Harding JE, Elbourne DR, Prendiville WJ. Viewsof mothers and midwives participating in the Bristolrandomized, controlled trial of active management of thethird stage of labor. Birth 1989;16:1–6.
Harris 2004
Harris T. Care in the third stage of labour. In: HendersonC, MacDonald S editor(s). Mayes Midwifery. Edinburgh:Bailliere Tindall, 2004:507–23.
Harris 2006
Harris T. An explanation for third stage practice variation:the theory of contingent decision making. Normal Labourand Birth: 3rd Research Conference; 2006 June 7-9;Grange-over-Sands, England, UK. 2006.
Herman 2002
Herman A, Zimerman A, Arieli S, Tovbin Y, Bezer M,Bukovsky I, et al. Down-up sequential separation of theplacenta. Ultrasound in Obstetrics & Gynecology 2002;19:278–81.
Higgins 2003
Higgins JP, Thompson SG, Deeks JJ, Altman DG.Measuring inconsistency in meta-analyses. BMJ 2003;327:557–60.
Higgins 2011
Higgins JP, Deeks JJ, Altman DG (editors). Chapter 16:Special topics in statistics. In: Higgins JPT, Green S(editors), Cochrane Handbook for Systematic Reviewsof Interventions Version 5.1.0 (updated March 2011).The Cochrane Collaboration, 2011. Available fromwww.handbook.cochrane.org.
Higgins 2017
Higgins JP, Altman DG, Sterne JA (editors). Chapter 8:Assessing risk of bias in included studies. In: Higgins JPT,Churchill R, Chandler J, Cumpston MS (editors), CochraneHandbook for Systematic Reviews of Interventions version5.2.0 (updated June 2017), Cochrane, 2017. Available fromwww.training.cochrane.org/handbook. London: Cochrane.
Hofmeyr 2015
Hofmeyr GJ, Mshweshwe NT, Gülmezoglu AM. Controlledcord traction for the third stage of labour. Cochrane
Database of Systematic Reviews 2015, Issue 1. DOI:10.1002/14651858.CD008020.pub2
Hutton 2007
Hutton EK, Hassan ES. Late vs early clamping of theumbilical cord in full-term neonates: systematic reviewand meta-analysis of controlled trials. JAMA 2007;297:1241–52.
Hytten 2001
Hytten F. The physiology of the puerperium. In:Chamberlain G, Steer P editor(s). Turnbull’s Obstetrics. 3rdEdition. Edinburgh: Churchill Livingstone, 2001:635–46.
ICM 2008
International Confederation of Midwives. Role of the
Midwife in Physiological Third Stage Labour: PositionStatement. The Hague: International Confederation ofMidwives, 2008.
ICM-FIGO 2003
International Confederation of Midwives (ICM) andInternational Federation of Gynaecology and Obstetrics(FIGO). Management of the third stage of labour toprevent post-partum haemorrhage. Joint statement.internationalmidwives.org/assets/uploads/documents/FIGO/PPH%20Joint%20Statement.pdf 2008 (accessed 26January 2018).
ICM-FIGO 2006
International Confederation of Midwives (ICM) andInternational Federation of Gynaecology and Obstetrics(FIGO). Prevention and treatment of post-partumhaemorrhage: new advances for low resource settings.Joint statement. www.figo.org/docs/PPH%20Joint%20Statement%202%20English.pdf 2006 (accessed 26 January2018).
Inch 1985
Inch S. Management of third stage of labour - anothercascade of intervention?. Midwifery 1985;1(2):114–22.
Kanikosmay 2007
Kanikosmay F. Third stage: the why of physiologicalpractice. Midwives, the official journal of the Royal College ofMidwives 2007;10(9):422–5.
Khan 2006
Khan KS, Wojdyla D, Say L, Gülmezoglu AM, Van LookPF. WHO analysis of causes of maternal death: a systematicreview. Lancet 2006;367(9516):1066–74.
37Active versus expectant management for women in the third stage of labour (Review)
Copyright © 2019 The Cochrane Collaboration. Published by John Wiley & Sons, Ltd.

Lazarus 2005
Lazarus JV, Lalonde A. Reducing postpartum haemorrhagein Africa. International Journal of Gynecology & Obstetrics
2005;88(1):89–90.
Lewis 2007
Lewis G. The Confidential Enquiry into Maternal andChild Health (CEMACH). Saving Mothers’ Lives: reviewing
maternal deaths to make motherhood safer- 2003-2005. TheSeventh Report on Confidential Enquiries into Maternal
Deaths in the United Kingdom. London: CEMACH, 2007.
Liabsuetrakul 2018
Liabsuetrakul T, Choobun T, Peeyananjarassri K, IslamQM. Prophylactic use of ergot alkaloids in the third stage oflabour. Cochrane Database of Systematic Reviews 2018, Issue6. DOI: 10.1002/14651858.CD005456.pub3
Maughan 2006
Maughan KL, Heim SW, Galazka SS. Preventingpostpartum hemorrhage: managing the third stage of labor.American Family Physician 2006;73(6):1025–8.
McDonald 2003
McDonald S. Physiology and management of the thirdstage of labour. In: Fraser DM, Cooper MA editor(s). MylesTextbook for Midwives. Edinburgh: Churchill Livingstone,2003:507–30.
McDonald 2007a
McDonald S. Management of the third stage of labour.Journal of Midwifery and Women’s Health 2007;52(3):254–61.
McDonald 2007b
McDonald SJ, Abbott JM, Higgins SP. Prophylacticergometrine-oxytocin versus oxytocin for the third stage oflabour. Cochrane Database of Systematic Reviews 2004, Issue1. DOI: 10.1002/14651858.CD000201.pub2
McDonald 2013
McDonald SJ, Middleton P, Dowswell T, Morris PS. Effectof timing of umbilical cord clamping of term infants onmaternal and neonatal outcomes. Cochrane Databaseof Systematic Reviews 2013, Issue 7. DOI: 10.1002/14651858.CD004074.pub2
Meher 2019
Meher S, Cuthbert A, Kirkham JJ, Williamson P, AbalosE, Aflaifel N, et al. Core outcome sets for prevention andtreatment of postpartum haemorrhage: an internationalDelphi consensus study. BJOG 2019;126(1):83–93. DOI:0.1111/1471-0528.15335
Mercer 2000
Mercer JS, Nelson CC, Skovgaard RL. Umbilical cordclamping: beliefs and practices of American nurse-midwives.Journal of Midwifery & Women’s Health 2000;45(1):58–66.
Mercer 2001
Mercer JS. Current best evidence: a review of the literatureon umbilical cord clamping. Journal of Midwifery &Women’s Health 2001;46(6):402–14.
Mercer 2008
Mercer J, Skovgaard R, Erickson-Owens D. Fetal toneonatal transition: first do no harm. In: Downe S editor
(s). Normal Childbirth: Evidence and Debate. 2nd Edition.Edinburgh: Churchill Livingstone, 2008:149–74.
Mims 2005
Mims MP, Prchal JT. Hematology during pregnancy .In: Lichtman MA, Williams WJ, Beutler E, KaushanskyK, Kipps TJ, Seligsohn U, et al. editor(s). Williams
Haematology. 7th Edition. New York: McGraw HillMedical, 2005:101–10.
Mousa 2014
Mousa HA, Blum J, Abou El Senoun G, Shakur H, AlfirevicZ. Treatment for primary postpartum haemorrhage.Cochrane Database of Systematic Reviews 2014, Issue 2.DOI: 10.1002/14651858.CD003249.pub3
NICE 2014
National Institute for Health and Care Excellence.Intrapartum care for healthy women and babies.Intrapartum Care for Healthy Women and Babies, GuidelineCG190. London: National Institute for Health and CareExcellence, 2014.
Nordstrom 1997
Nordstrom L, Fogelstam K, Fridman G, Larsson A,Rydhstroem H. Routine oxytocin in the third stage oflabour: a placebo controlled randomised trial. BritishJournal of Obstetrics and Gynaecology 1997;104(7):781–6.
NZCM 2009
New Zealand College of Midwives. Third stage management
practices of midwife lead maternity carers: an analysis ofthe New Zealand College of Midwives Midwifery Database
Information 2004-2008. Christchurch: New ZealandCollege of Midwives, 2009.
Parsons 2007
Parsons SM, Walley RL, Crane JM, Matthews K, HutchensD. Rectal misoprostol versus oxytocin in the managementof the third stage of labour. Journal of Obstetrics andGynaecology 2007;29(9):711–8.
Penney 2005
Penney G, Adamson L, Kernaghan D. Scottish confidentialaudit of severe maternal morbidity. Second AnnualReport 2004. Aberdeen. Scottish Programme for ClinicalEffectiveness in Reproductive Health. www.abdn.ac.uk/spcerh/pubs.htm#2005 2005 (accessed 2005).
Phillip 2004
Phillip H, Fletcher H, Reid M. The impact of inducedlabour on postpartum blood loss. Journal of Obstetrics andGynaecology 2004;24(1):12–5.
Prendiville 1989
Prendiville WJ, Elbourne DR. Care during the third stageof labour. In: Chalmers I, Enkin M, Keirse MJNC editor(s). Effective Care in Pregnancy and Childbirth. Oxford:Oxford University Press, 1989:1145–69.
Prendiville 1996
Prendiville WJ. The prevention of post partumhaemorrhage: optimising routine management of the thirdstage of labour. European Journal of Obstetrics & Gynecology
and Reproductive Biology 1996;69:19–24.
38Active versus expectant management for women in the third stage of labour (Review)
Copyright © 2019 The Cochrane Collaboration. Published by John Wiley & Sons, Ltd.

Rabe 2012
Rabe H, Diaz-Rossello JL, Duley L, Dowswell T. Effectof timing of umbilical cord clamping and other strategiesto influence placental transfusion at preterm birth onmaternal and infant outcomes. Cochrane Database
of Systematic Reviews 2012, Issue 8. DOI: 10.1002/14651858.CD003248.pub3
Razvi 2008
Razvi K, Chua S, Arulkumaran S, Ratnam SS. A comparisonbetween visual estimation and laboratory determination ofblood loss during the third stage of labour. Australian and
New Zealand Journal of Obstetrics and Gynaecology 2008;36
(2):152–4.
RCM 2004
Royal College of Midwives. Normal Childbirth: Position
Statement. London: Royal College of Midwives, 2004.
RCM 2008
Royal College of Midwives. Third Stage of Labour:Midwifery Practice Guideline. London: RCM, 2008.
RCOG 2009
Duley LMM, Weeks AD, Hey EN, Drife JO. Clampingof the umbilical cord and placental transfusion. RCOGScientific Advisory Committee, Opinion Paper 14 May2009, issue www.rcog.org.uk/clamping–umbilical–cord–and–placental–transfusion.
Review Manager 2014 [Computer program]
Nordic Cochrane Centre, The Cochrane Collaboration.Review Manager 5 (RevMan 5). Version 5.3. Copenhagen:Nordic Cochrane Centre, The Cochrane Collaboration,2014.
Romero-Gutierrez 2007
Romero-Gutierrez G, Espitia-Vera A, Ponce-Ponce de LeonAL, Huerta-Vargas LF. Risk factors of maternal death inMexico. Birth 2007;34(1):21–5.
Sandall 2016
Sandall J, Soltani H, Gates S, Shennan A, Devane D.Midwife-led continuity models versus other modelsof care for childbearing women. Cochrane Databaseof Systematic Reviews 2016, Issue 4. DOI: 10.1002/14651858.CD004667.pub5
Sarnat 1976
Sarnat HB, Sarnat MS. Neonatal encephalopathy followingfetal distress: a clinical and electrographic study. Archives ofNeurology 1976;33:696.
Sheiner 2005
Sheiner E, Sarid L, Levy A, Seidman DS, HallakM. Obstetric risk factors and outcome of pregnanciescomplicated with early postpartum hemorrhage: apopulation-based study. Journal of Maternal-Fetal &
Neonatal Medicine 2005;18(3):149–54.
Soltani 2008
Soltani H. Global implications of evidence based practice:management of the third stage of labour. Midwifery 2008;24:138–42. DOI: 10.1016/j.midw.2008.03.002
Soltani 2010
Soltani H, Hutchon DR, Poulose TA. Timing ofprophylactic uterotonics for the third stage of labour aftervaginal birth. Cochrane Database of Systematic Reviews 2010,Issue 8. DOI: 10.1002/14651858.CD006173
Soltani 2011
Soltani H, Poulose TA, Hutchon DR. Placental corddrainage after vaginal delivery as part of the managementof the third stage of labour. Cochrane Database of
Systematic Reviews 2011, Issue 9. DOI: 10.1002/14651858.CD004665.pub3
Sterne 2017
Sterne JAC, Egger M, Moher D, Boutron I (editors).Chapter 10: Addressing reporting biases. In: Higgins JPT,Churchill R, Chandler J, Cumpston MS (editors), CochraneHandbook for Systematic Reviews of Interventions version5.2.0 (updated June 2017), Cochrane, 2017. Available fromwww.training.cochrane.org/handbook.
Su 2012
Su LL, Chong YS, Samuel M. Carbetocin for preventingpostpartum haemorrhage. Cochrane Database ofSystematic Reviews 2012, Issue 4. DOI: 10.1002/14651858.CD005457.pub4
Taylor 1981
Taylor DJ, Phillips P, Lind T. Puerperal haematologicalindices. British Journal of Obstetrics and Gynaecology 1981;88(6):601–6.
Tierney 2005
Tierney JF, Stewart LA. Investigating patient exclusion biasin meta-analysis. International Journal of Epidemiology
2005;34:79–87.
Tunçalp 2012
Tunçalp Ö, Hofmeyr GJ, Gülmezoglu AM. Prostaglandinsfor preventing postpartum haemorrhage. Cochrane Databaseof Systematic Reviews 2012, Issue 8. DOI: 10.1002/14651858.CD000494.pub4
Van Rheenan 2007
Van Rheenen P, De Moor L, Eschbach S, De Grooth H,Brabin B. Delayed cord clamping and haemoglobin levelsin infancy: a randomised controlled trial in term babies.Tropical Medicine & International Health 2007;12(5):603–16.
Weeks 2007
Weeks A. Umbilical cord clamping after birth. BMJ 2007;335:312–3.
Werner 2005
Werner EJ. Disorders of the fetomaternal unit. In: deAlarcon PA, Werner EJ editor(s). Neonatal Hematology.Cambridge: Cambridge University Press, 2005:10–39.
Westhoff 2013
Westhoff G, Cotter AM, Tolosa JE. Prophylactic oxytocinfor the third stage of labour to prevent postpartumhaemorrhage. Cochrane Database of Systematic Reviews
2013, Issue 10. DOI: 10.1002/14651858.CD001808.pub2
39Active versus expectant management for women in the third stage of labour (Review)
Copyright © 2019 The Cochrane Collaboration. Published by John Wiley & Sons, Ltd.

WHO 2003
World Health Organization. Managing Complicationsin Pregnancy and Childbirth: A Guide for Midwives and
Doctors. Geneva: World Health Organization, 2003.
WHO 2007
World Health Organization. Reducing the global burden:postpartum hemorrhage. Making Pregnancy Safer. WorldHealth Organization. Geneva: World Helath Organization,2007.
WHO 2012
World Health Organization. WHO Recommendations forthe Prevention and Treatment of Postpartum Haemorrhage.Geneva: World Health Organization, 2012.
WHO 2014
World Health Organization. Guideline: Delayed umbilicalcord clamping for improved maternal and infant health and
nutrition outcomes. Geneva: World Health Organization,2014.
Winter 2007
Winter C, Macfarlane A, Deneux-Tharaux C, Zhang W-H,Alexander S, Brocklehurst P, et al. Variations in policies formanagement of the third stage of labour and the immediatemanagement of postpartum haemorrhage in Europe. BJOG
2007;114:845–54.
Yao 1974
Yao AC, Lind J. Placental transfusion. American Journal ofDiseases of Children 1974;127:128–41.
References to other published versions of this review
Begley 2010
Begley CM, Gyte GML, Murphy DJ, Devane D, McDonaldSJ, McGuire W. Active versus expectant management forwomen in the third stage of labour. Cochrane Databaseof Systematic Reviews 2010, Issue 7. DOI: 10.1002/14651858.CD007412.pub2
Begley 2011b
Begley CM, Gyte GML, Devane D, McGuire W, Weeks A.Active versus expectant management for women in the thirdstage of labour. Cochrane Database of Systematic Reviews2011, Issue 11. DOI: 10.1002/14651858.CD007412.pub3
Begley 2015
Begley CM, Gyte GML, Devane D, McGuire W, Weeks A.Active versus expectant management for women in the thirdstage of labour. Cochrane Database of Systematic Reviews2015, Issue 3. DOI: 10.1002/14651858.CD007412.pub4
Prendiville 2000
Prendiville WJ, Elbourne D, McDonald S. Active versusexpectant management in the third stage of labour.Cochrane Database of Systematic Reviews 2000, Issue 3.DOI: 10.1002/14651858.CD000007
∗ Indicates the major publication for the study
40Active versus expectant management for women in the third stage of labour (Review)
Copyright © 2019 The Cochrane Collaboration. Published by John Wiley & Sons, Ltd.

C H A R A C T E R I S T I C S O F S T U D I E S
Characteristics of included studies [ordered by study ID]
Begley 1990
Methods RCT with randomisation of individual women
Participants Irish hospital setting. High-income countryInclusion criteria: all women at low risk of haemorrhage (< 35 years; parity < 5; 1ststage of labour < 15 hours; no previous history of PPH; Hb > 11 g/dL (or 10.6 g/dL forcapillary sample)) with singleton, cephalic presentation, 35 to 36 weeks at recruitment;no medical complications that would contraindicate ergometrine or would increase therisk of bleeding (cardiac disease, use of heparin, hypertension), and expected to give birthvaginally1429 women randomised out of 2901 eligibleExclusion criteria: women with hypertension in pregnancy or 1st or 2nd stage; epiduralanaesthesia (included in separate study); APH; 1st stage > 15 hours; OVB; womenattending private careClinician responsible for third stage: midwives
Interventions Intervention: active management of third stage (N = 705)• prophylactic ergometrine 0.5 mg IV immediately following birth (once 2nd twin
excluded)• try to clamp cord within 30 s• delivery of the placenta by CCT when uterus contracted• try not to give any special instructions re posture
For retained placenta: 1 h after birth:• ensure empty bladder• attempt delivery again using CCT• manual removal of placenta under GA
Comparison: expectant management of 3rd stage (N = 724)• no oxytocic drug to be given routinely• try to leave cord attached to baby until pulsation has ceased. When cord is cut
milk any placental blood into bowl and discard• encourage mother to breastfeed• watch for signs of placental separation and ask women to tell you when she feels a
contraction or urge to push. DO NOT touch the abdomen or manipulate the uterus atthis stage
• placenta may be delivered by maternal effort or gentle CCT• if mother does not experience a contraction within 8 min, place hand gently on
fundus to determine intrauterine bleeding and await separationSpecial circumstances: if baby’s cord is clamped and cut before pulsation ceases (due tocord round neck, asphyxia, etc) do not give ergometrine. Milk any placental blood intobowl and discard it. Watch for signs of placental separation and deliver placenta by CCTRetained placenta > 1 h after birth:
• ensure empty bladder• attempt delivery again using CCT• give ergometrine 0.5 mg IV and re-attempt delivery• manual removal under GA
41Active versus expectant management for women in the third stage of labour (Review)
Copyright © 2019 The Cochrane Collaboration. Published by John Wiley & Sons, Ltd.

Begley 1990 (Continued)
Data entered into comparisons 1 and 2
Outcomes Pre-specified outcomes: manual removal of placenta; PPH (> 500 mL); mean bloodloss; length 3rd stage; Hb < 10 g/dL at 48-72 h; and difference between 32 weeks and48-72 h PP: PP blood transfusions; side effects 1-2 h post birth; PP complications;breastfeeding; serum prolactin; women’s views. No neonatal outcomes(Information from Oxford Database of Perinatal Trials registration sheet) and fromBegley 1990): morbidity; blood loss during 3rd stage; method of placental delivery;complications occurring in first 1-2 h post birth (haemorrhage, nausea, vomiting, raisedBP, pain); Hb on 3rd postnatal day; prolactin levels on 3rd postnatal day, duration ofbreastfeeding
Notes Between 1 October 1987 and 31 October 1988, 2901 women were deemed eligible forinitial inclusion, 2650 agreed to take part. 1221 of these were excluded prior to randomi-sation because of epidural (399); OVB (354); CS (132); rapid birth (95); hypertension(77); missed (53); low Hb (40); woman’s request (28); miscellaneous (23); breech (20)Actual management used in the active arm: all given IV ergometrine 0.5 mg beforedelivery of placenta; 89% cord clamped and cut; 93% CCT and 5% maternal effort;7% upright and 93% recumbentActual management used in the expectant arm: 14% got ergometrine for treatment,not prophylactically, 6 (0.83%) before placenta delivered; cord left unclamped till pul-sation ceased 42%; placenta delivered by maternal effort 32% and CCT 66%; 11%uprightDates of study: 1 October 1987-31 October 1988Funding sources: “This study was funded by the Research and Development Trust ofthe Coombe Hospital”Declarations of interest: not reported
Risk of bias
Bias Authors’ judgement Support for judgement
Random sequence generation (selectionbias)
Low risk Unpublished information from study au-thor: random number tables were used(Fleiss 1981). The 1st number was selectedfrom the table by a disinterested observerand the numbers were allocated in blocksof 100 following in sequence
Allocation concealment (selection bias) Low risk Quote: “...a numbered, sealed envelopecontaining the randomly allocated groupwas stapled to the woman’s chart in readi-ness for admission... The envelope re-mained sealed until the women was in sec-ond stage of labour and the midwife wascertain a normal delivery would ensue. Theenvelope was then opened...”Quote: “When a woman was excludedfrom the study, her envelope was returned,
42Active versus expectant management for women in the third stage of labour (Review)
Copyright © 2019 The Cochrane Collaboration. Published by John Wiley & Sons, Ltd.

Begley 1990 (Continued)
unopened, to the researcher. All returnedenvelopes were re-allocated in numericalorder prior to starting the next batch of 100envelopes.”
Blinding of participants and personnel(performance bias)All outcomes
High risk It was not possible to blind women or clin-icians in this study. The outcome assessorwas often the caregiver for many importantoutcomes, e.g. blood loss and PPH. Eventhough blood loss was measured and notestimated, there may have been bias in mea-suring
Blinding of outcome assessment (detectionbias)All outcomes
Unclear risk Describes the differences in measuringblood loss in non-blinded staff and at-tempts to standardise methods. Hb mea-surement was conducted by assessorsblinded to allocation (personal communi-cation) thus some outcomes were blindedbut for some it was not possible
Incomplete outcome data (attrition bias)All outcomes
Low risk Some missing data for some postnatal Hbmeasurements (618 out of 705 in the activegroup (12% attrition) and 645 out of 724in the expectant (11% attrition)ITT not mentioned but no loss to follow-up for outcomes measured during labour.Some outcome data are taken from the un-published thesis
Selective reporting (reporting bias) Unclear risk All outcomes listed in the methods are re-ported, but no protocol for the study isavailable
Other bias Low risk No significant difference in baseline char-acteristics, but more women in the physio-logical arm had pethidine in labour (46%compared with 52%, P = 0.05). This mayimpact on outcomes in the physiologicalarm where the sight and sound of the babymay be the stimulus for the hormonal re-lease needed for natural 3rd stage and pethi-dine may impact here1st and 2nd stage management similar andno obvious differences overall
43Active versus expectant management for women in the third stage of labour (Review)
Copyright © 2019 The Cochrane Collaboration. Published by John Wiley & Sons, Ltd.

Jangsten 2011
Methods RCT with randomisation of individual women
Participants Setting: university hospital, Sweden. High-income countryInclusion criteria: healthy women with normal pregnancies, a gestational age of 34-43weeks, singleton, cephalic presentation and expected vaginal birth (included ventousedeliveries)Exclusion criteria: non-Swedish speaking, previous PPH, elective CS, pre-eclampsia,grand multiparity (> 5) or IUFDSubgroups: high-income, not low-riskClinician responsible for third stage: midwives
Interventions Experimental intervention: active management of third stage (N = 903, but analysed810)
• Uterotonic drug/dose/route/timing: oxytocin 10 U, IV, within 2 min of birth• Cord clamping timing: immediate• CCT: yes, and encouragement to push• Uterine massage: after expulsion of placenta
Control/comparison intervention: mixed management of 3rd stage (N = 899, butanalysed 821)Description: mixed: (no routine uterotonic; early cord clamping, no CCT)
• clamping the cord immediately after birth• administration of 2 mL saline solution, IV within 2 min• waiting for signs of placental detachment and encouraging the mother to push
out the placenta without cord traction• uterine massage after placenta delivered
Data used in comparison 11
Outcomes Pre-specified outcomes: primary outcome was the incidence of blood loss > 1000 mLduring the 3rd stage of labour. Other outcomes: Hb at 24 h and women’s viewsReported outcomes: blood loss > 1000 mL and > 500 mL during the 3rd stage oflabour, blood loss > 1000 mL and > 500 mL in first 2 h PP, Hb at 24 h, changein Hb from antenatal to 24 h postnatal, retained placenta/retained part of placentaor membranes, additional uterotonics, duration of 3rd stage. Blood transfusion, unitstransfused, experience of mothers, afterpainsOutcomes obtained by email response 28 April 2011: manual removal of placenta alone,cross-over in additional uterotonics, Hb < 9 g/dL at 24-48 h, length of 3rd stage > 60minOutcomes obtained by email response 26 May 2011 clarification of cross-over in ad-ditional uterotonics, blood loss > 500 mL and > 1000 mL during 3rd stage of labourseparated from blood loss > 500 mL and > 1000 mL in first 2 h PP
Notes We wrote to the study author for additional information which was provided as follows:“In the active group, 41 women had extra Synt, therapeutically, before the placenta(some went on to have a second dose, and/or Methergin) = 41
767 had no extra Synt before the placenta. Of these, 26 had a second dose after theplacenta was delivered, 6 had a second dose of Synt and a dose of Methergin and 48 hadMethergin but no Synt = 80IN TOTAL, IN THE ACTIVE GROUP, 121 WOMEN HAD THERAPEUTIC
44Active versus expectant management for women in the third stage of labour (Review)
Copyright © 2019 The Cochrane Collaboration. Published by John Wiley & Sons, Ltd.

Jangsten 2011 (Continued)
UTEROTONICS.
In the expectant group, 160 women had a dose of Synt, therapeutically, before theplacenta (some went on to have a second dose, and/or Methergin) = 160655 had no Synt before the placenta. Of these, 102 had a dose of Synt after the placentawas delivered, 32 had a dose of Synt and a dose of Methergin and 17 had Methergin butno Synt. = 151
IN TOTAL, IN THE EXPECTANT GROUP, 311 WOMEN HAD THERAPEUTICUTEROTONICS.”In further correspondence, the author replied:“Blood loss before and during placenta delivery: IN ACTIVE GROUP: 0 to 500 mL= 86.57% (n = 696) > 500 mL = 13.43% (n = 108) and 0 to 1000 mL = 96.39% (n =775) > 1000 mL = 3.61% (n = 29)Blood loss before and during placenta delivery: IN EXPECTANT GROUP: 0 to 500mL = 76.25% (n = 623) > 500 mL = 23.75% (n = 194) and 0 to 1000 mL = 95.3% (n= 779) > 1000 mL = 4.65% (n = 38)”And also:Question: Number of women having retained placenta and manual removal of placenta(excluding those who had retained pieces of membrane, etc, if possible)Answer: “in total 47 manual removal of the placenta were performed. In active group26 in expectant group 21.”Question: Number of maternal haemoglobin <9gm/dl at 24-48 hrsAnswer: “In total there were 62 women with Hb < 90. In active group 34 women, andin expectant group 28 women”Question: Number of lengths of third stage > 60 minutes.Answer: “In total there were 54 women with third stge that exceede 60 min. In activegroup 31 women and in expectant group 23 women.”Question: Was ’mean blood loss before placenta’ actually ’blood loss up to and includingexpulsion of placenta’?Answer: “mean bloodloss before placenta was expelled is refered to as before and duringexpulsion.”Dates of study: November 2006-April 2008Funding sources: “The study was supported by grants from the Research and Develop-ment Board in Göteborg and Bohuslän Baby Bag and the SU foundation”Declarations of interest: “The authors have no conflicts of interest and are independentfrom industrial funding”
Risk of bias
Bias Authors’ judgement Support for judgement
Random sequence generation (selectionbias)
Low risk Computer-generated randomisation
Allocation concealment (selection bias) Low risk Sealed envelopes containing the computer-generated randomisation group were pre-pared in consecutive order and kept inanother unit. At randomisation, midwives
45Active versus expectant management for women in the third stage of labour (Review)
Copyright © 2019 The Cochrane Collaboration. Published by John Wiley & Sons, Ltd.

Jangsten 2011 (Continued)
phoned the staff at the other unit whoopened the sealed envelopes and disclosedthe assigned intervention and study num-ber
Blinding of participants and personnel(performance bias)All outcomes
High risk Received an injection in both groups to“blind”, but expectant group were asked topush and did not have CCT, active grouphad CCTClinicians not blinded
Blinding of outcome assessment (detectionbias)All outcomes
Unclear risk Clinicians not blinded and clinicians in-volved in many important outcomes de-cisions/assessments, e.g. blood loss, ther-apeutics uterotonics, blood transfusions.Other outcomes could have been blinded,e.g. Hb
Incomplete outcome data (attrition bias)All outcomes
Low risk Of the 903 women randomised to the ac-tive group and 899 women randomised tothe mixed management group:
• 4 women withdrew from the activegroup and 2 from the mixed managementgroup
• 75 women had CS in active groupand 56 in the mixed management group,so were excluded
• A further14 women in the activegroup and 20 in the mixed managementgroup were lost to follow-upOverall 10% and 9%The analysis was ITT, apart from above ex-clusions
Selective reporting (reporting bias) Unclear risk All outcomes listed in the methods are re-ported, but no protocol for the study isavailable.
Other bias High risk There were more inductions in the activegroup (10% versus 7%).Describe any differential diagnosis: noneAlthough 11,000 women were potentiallyeligible, of whom at least half would usuallybe considered eligible, only 1802 were en-tered into the study. Numbers excluded dueto ineligibility are not recorded, and otherreasons given are “excessive workload” or“admission in advanced labour”Email response from Jangsten 28 April
46Active versus expectant management for women in the third stage of labour (Review)
Copyright © 2019 The Cochrane Collaboration. Published by John Wiley & Sons, Ltd.

Jangsten 2011 (Continued)
2001: “the hard workload was one reasonthat the women were not included and thatall eligible women were not asked to partic-ipate. Few women refused in participatingbut I don’t have the number”This has the potential to have biased thestudy, as midwives would have had thechoice of not asking the women to par-ticipate and may unconsciously have notoffered participation to some women whothey felt were not suitable for physiologicalmanagement
Jerbi 2007
Methods RCT of individual women in low-income setting
Participants Setting: Sousse, Tunisia. Low-income countryWomen with singleton pregnancies expecting to give birth vaginallyExclusion criteria: placenta praevia, APH, non-cephalic presentation, intrauterinedeath, parity > 5, uterine fibroids, anticoagulation therapy, history of PPH, history ofCS
Interventions Intervention: active management of 3rd stage (N = 65)• IV flash injection of 5 IU oxytocin at time of delivery of anterior shoulder• immediate cord clamping and cutting• CCT with gentle fundal pressure when signs of separation appeared• manual removal if not delivered by 30 min or if haemorrhaging
Comparison: mixed management of 3rd stage (N = 65)• no routine uterotonic (not stated in publication, but study author provided
information on 19 March 2011)• immediate cord clamping and cutting• CCT plus gentle fundal pressure when signs of separation appeared• manual removal if not delivered by 30 min or if haemorrhaging
Data included in comparison 12
Outcomes Pre-specified: reduction in HCT and Hb
Notes We contacted the study authors again on 14 March 2011, for further information onthe management in the comparison arm, the methodology they used and data obtained.Reply received 19 March 2011. No publication has emanated, no further data wereprovided, but methodology was clarifiedDates of study: February-March 2005Funding sources: not reportedDeclarations of interest: not reported
Risk of bias
47Active versus expectant management for women in the third stage of labour (Review)
Copyright © 2019 The Cochrane Collaboration. Published by John Wiley & Sons, Ltd.

Jerbi 2007 (Continued)
Bias Authors’ judgement Support for judgement
Random sequence generation (selectionbias)
Unclear risk As per www.randomization.com (notstated in publication but information pro-vided by study author on 19 March 2011)
Allocation concealment (selection bias) High risk Not concealed in any way (not stated inpublication, but in information providedby study author on 19 March 2011)
Blinding of participants and personnel(performance bias)All outcomes
High risk None. Unblinded assessment made
Blinding of outcome assessment (detectionbias)All outcomes
Unclear risk No information provided
Incomplete outcome data (attrition bias)All outcomes
Low risk No loss described in publication and con-firmed by information from study authoron 19 March 2011. Study authors also pro-vided information that the analysis was by“intention to treat”
Selective reporting (reporting bias) High risk No study protocol found. Some outcomesreported but not noted in methods of paper
Other bias High risk Women reported to have been allocated togroups after placental delivery yet activemanagement group supposedly had oxy-tocin with the anterior shoulder
Khan 1997
Methods RCT with randomisation of individual women
Participants Abu Dhabi hospital setting. High-income countryInclusion criteria: all women expected to give birth vaginally. 1657 women randomisedout of a possible 4239Exclusion criteria: refusal or CS in second stage (9 excluded, final sample 1648)
Interventions Intervention: active management of 3rd stage (N = 827)• prophylactic oxytocin 10 units IM at birth of anterior shoulder (or if breech, soon
after delivery of baby)• cord clamped and cut immediately• CCT as soon as the uterus was contracted firmly. Repeated every 2-3 min.
Comparison: mixed management of 3rd stage (N = 821)• no IM/IV oxytocic
48Active versus expectant management for women in the third stage of labour (Review)
Copyright © 2019 The Cochrane Collaboration. Published by John Wiley & Sons, Ltd.

Khan 1997 (Continued)
• cord clamped and cut after delivery• no cord traction. No fundal massage or pressure. Signs of separation awaited, then
maternal expulsion of placenta• IV infusion of oxytocin 10 units in 500 mL normal saline given slowly after
deliveryIn both groups, if placenta not delivered after 30 min, CCT or digital removal attempted,with IV oxytocin infusion if bleeding presentData included in comparison 10
Outcomes Primary: PPHSecondary: duration of 3rd stage, retained placenta, shock, blood transfusion, methy-lergonovine or 15-methyl-a-prostaglandin to control haemorrhage
Notes Not readily comparable to other studies as IV oxytocin infusion given to all women inexpectant management group after delivery of placenta. This is the practice in the USAbut not elsewhereDates of study: January-June 1995Funding sources: not reportedDeclarations of interest: not reported
Risk of bias
Bias Authors’ judgement Support for judgement
Random sequence generation (selectionbias)
Unclear risk No detail
Allocation concealment (selection bias) Unclear risk Numbered, sealed, opaque envelopes.However, if sequence generation is not ran-dom then allocation cannot be concealed
Blinding of participants and personnel(performance bias)All outcomes
High risk Attempted with 2nd MW recording bloodloss - however, no guarantee that the 1stMW could/would not have altered theamount of blood in the receptacle, so notany better than just 1 clinician measuring
Blinding of outcome assessment (detectionbias)All outcomes
Unclear risk No information providedPresumed blinded, but unclear
Incomplete outcome data (attrition bias)All outcomes
Unclear risk 2582 excluded prior to randomisation dueto refusal9 excluded after randomisation due toemergency CS
Selective reporting (reporting bias) Unclear risk All outcomes listed in the methods are re-ported, but there is no protocol for thestudy available
49Active versus expectant management for women in the third stage of labour (Review)
Copyright © 2019 The Cochrane Collaboration. Published by John Wiley & Sons, Ltd.

Khan 1997 (Continued)
Other bias High risk 2582 out of 4239 refused to participate.Those that did agree may have been biasedIt is unknown whether or not the midwiveshad sufficient training in physiological 3rdstage before the study startedThis study has been criticised for includ-ing all women (including high parity, allage groups, previous PPH, epidural, longlabour, operative delivery) and not con-fining inclusion criteria to women whowere low risk. Women at high risk of PPHwill have a higher blood loss using expec-tant management; clinicians experiencingthis may respond by anxiety in subsequentbirths, even of low-risk women, which mayresult in higher intervention (mixed man-agement) ratesAlso, the minimal intervention (control)group had the cord clamped and cut im-mediately after delivery, which is suspectedto lead to an increase in blood loss
Prendiville 1988
Methods RCT with randomisation of individual women
Participants UK hospital setting. High-income countryInclusion criteria: all women expected to give birth vaginally. 1695 women randomisedout of a possible 4709Exclusion criteria: refusal, cardiac disease, APH, non-cephalic presentation, multiplepregnancy, IUFD, if clinician had good reason not to include womenAfter the first 5 months, exclusions included women with ritodrine given 2 h beforebirth; anticoagulant treatment; any condition needing a particular management of 3rdstage (e.g. meconium-stained liquor, dural tap)
Interventions Intervention: active management of 3rd stage (N = 846)• prophylactic syntometrine (5 units oxytocin + 0.5 mg ergometrine) (or 10 units
syntocinon if mother had raised BP), administered immediately after birth of anteriorshoulder
• cord clamping and cutting within 30 s of birth• delivery of the placenta by CCT when uterus contracted
Comparison: expectant management of 3rd stage (N = 849)• try not to give oxytocic• try to leave cord attached to baby until placenta delivered• try not to use CCT or any manual interference with uterus at the fundus.
Following signs of separation encourage posture aiding delivery by gravity, andmaternal effortData included in comparison 1
50Active versus expectant management for women in the third stage of labour (Review)
Copyright © 2019 The Cochrane Collaboration. Published by John Wiley & Sons, Ltd.

Prendiville 1988 (Continued)
Outcomes Pre-specified outcomes: PPH (and “more objective measures of blood loss”, presumablyHb); length 3rd stage; need for therapeutic oxytocics; manual removal placenta; ERPC;side effects of oxytocics (nausea, vomiting, headaches, hypertension); Apgar scores; PCV;SCBU; jaundice; breastfeeding. Views of a subsample of women
Notes Actual management used in the active arm: 99% given prophylactic uterotonic beforedelivery of placenta; 99% cord clamped and cut before delivery of placenta; 99% CCT;26% uprightActual management used in the expectant arm: 30% received uterotonic for treat-ment, and 20% prophylactically; cord left unclamped till pulsation ceased 48%; placentadelivered by maternal effort 60% and CCT 40%; 49% uprightDates of study: 1 January 1986-31 January 1987Funding sources: “The maternity and child division at the World Health Organisation,Geneva, provided some additional funds. The national perinatal epidemiology unit issupported by the DHSS”Declarations of interest: not reported
Risk of bias
Bias Authors’ judgement Support for judgement
Random sequence generation (selectionbias)
Low risk No description of the randomisation given.However, verbal assurances from study au-thors that sequence generation was random
Allocation concealment (selection bias) Low risk Quote: “On admission to the labourward... Correspondingly numbered, sealedopaque envelopes were placed in thewoman’s notes...”
Blinding of participants and personnel(performance bias)All outcomes
High risk Not possible to blind the women or theclinicians in any of the studiesQuote: “We were concerned that clinicalestimates of blood loss might also be subjectto systematic bias between the two studygroups as the observer could not be blindedto the management allocated. We there-fore studied three maternal haematologi-cal variables - namely, postpartum (24-48hrs) haemoglobin concentration ≤ 90g/L,mean postpartum packed cell volume andmean change in haemoglobin concentra-tion between about 34 weeks gestation andpost partum”Primary outcome though is still PPH > 500mL which is subject to systematic bias
51Active versus expectant management for women in the third stage of labour (Review)
Copyright © 2019 The Cochrane Collaboration. Published by John Wiley & Sons, Ltd.

Prendiville 1988 (Continued)
Blinding of outcome assessment (detectionbias)All outcomes
Unclear risk See above
Incomplete outcome data (attrition bias)All outcomes
Unclear risk Missing data for some outcomes, e.g. 19%of Hb results missing in active arm and18% in the physiologicalApparently no women were excluded af-ter randomisation but 182 are describedas having not entered in the study due tothe cord being cut early for fetal safety rea-sons. The allocation details, however, statethat when the clinician was ready to pre-pare for delivery, the envelope was openedand “all women for whom an envelope wasopened were deemed to have entered thestudy and were followed up”. The envelopewould have been opened before any neona-tal need for attention became apparent
Selective reporting (reporting bias) High risk No study protocol found. A large num-ber of outcomes reported but not noted inmethods of paper
Other bias High risk Protocol was modified after 5 months (425births), due to high blood loss in expec-tant management group, to allow womenin the control arm who needed some activemanagement to be switched to fully activemanagement. However, data for the first 5months were still included in analysisStudy was stopped early because of poten-tial harm. Sample size was meant to be 3900but stopped after 169530 women in the control group gave a latematernal refusal, whereas only 1 in the ex-perimental group did so. The outcomes ofthese women are included in analysisIt is questioned whether the midwiveshad sufficient training in physiological 3rdstage before the study started. Harding etal found that, of 49 midwives respond-ing to a questionnaire, only 1 had prac-tised physiological management as definedin the study. Only 6 (13%) of the mid-wives said that they were very confident ofphysiological management before the studyand 22 (46%) afterwards (Harding 1989;
52Active versus expectant management for women in the third stage of labour (Review)
Copyright © 2019 The Cochrane Collaboration. Published by John Wiley & Sons, Ltd.

Prendiville 1988 (Continued)
Prendiville 1988 paper).This study has been criticised for includ-ing all women (including high parity, allage groups, previous PPH, epidural, longlabour, operative delivery) and not con-fining inclusion criteria to women whowere low risk. Women at high risk of PPHwill have a higher blood loss using expec-tant management; clinicians experiencingthis may respond by anxiety in subsequentbirths, even of low-risk women, which mayresult in higher intervention (mixed man-agement) ratesOnly 47% (403/849) of women in phys-iological arm received the full physiologi-cal package (a problem with other studiesalso). But, in particular, 168/849 = 20%had prophylactic oxytocic, which is a largenumber for a “prophylactic” treatment asopposed to one in response to clinical need.In addition, 252 (30%) had a uterotonic asa treatment, so in total, 50% of the expec-tant management group received an oxyto-cicHowever, 99% (838/846) of women in ac-tive management group received allocatedmanagement
Rogers 1998
Methods RCT with randomisation of individual women in balanced blocks, with allocation to 1of 2 delivery postures within each arm
Participants UK hospital setting. High-income countryInclusion criteria: 1512 women at low risk of PPH giving birth at study hospital(including water births)Exclusion criteria: placenta praevia, previous PPH, APH after 20 weeks’ gestation, Hb< 10 g/dL or MCV < 75 fL, non-cephalic presentation, multiple pregnancy, intrauterinedeath, epidural anaesthesia, parity > 5, uterine fibroid, oxytocin augmentation infusion,anticoagulation therapy, intended instrumental or OVB, duration of gestation < 32weeks, (plus any other contraindication, in clinician’s view)
Interventions Intervention: active management of 3rd stage (N = 748)2 arms: active management - upright position (N = 374); active management - supineposition (N = 374)
• prophylactic oxytocin (19.5%) or “oxytocin + ergometrine” (75%) as soon aspossible after birth of anterior shoulder (within 2 min of birth). Number of units/mLnot given, nor reason for the difference
53Active versus expectant management for women in the third stage of labour (Review)
Copyright © 2019 The Cochrane Collaboration. Published by John Wiley & Sons, Ltd.

Rogers 1998 (Continued)
• immediate cord clamping and cutting• delivery of the placenta by CCT or maternal effort
Control: expectant management of 3rd stage (N = 764)2 arms: expectant management - upright position (N = 381); expectant management -supine position (N = 383)
• no prophylactic administration of uterotonic drug• no cord clamping until after pulsation ceased• delivery of placenta within 1 h by maternal effort
Data included in comparisons 1 and 2
Outcomes Pre-specified outcomes: PPH (> 500 mL) as assessed/estimated by the attending MW(used for power calculation); severe PPH 1000 mL), blood transfusion, iron tabletspostnatally, Hb at 24-48 h P/N, self-completed questionnaire on maternal fatigue anddepression at 6 weeks P/N, nausea, vomiting, headache, hypertension, manual removalof placenta, ERPC, neonatal outcomes, views of mothers and staff
Notes Actual management used in the active arm: 699 (93.4%) had full active management;95% given prophylactic uterotonic before delivery of placenta; 93% cord clamped beforepulsation ceased; 46% CCT; 44% uprightActual management used in the expectant arm: 488 (63.9%) had full expectant man-agement; 21% received oxytocic for treatment, and 2.5% prophylactically; cord left un-clamped till pulsation ceased 70%; placenta delivered by CCT 12%; 43% uprightThe setting is described as one where the midwives were “similarly confident” in activeand expectant management. However, the questionnaire administered to 92 of the 153midwives prior to the study commencement showed that, whereas 84% felt “very confi-dent” of active management, only 41% were “very confident” of expectant managementMaternal mean Hb levels were reported with SEs and so we calculated SDsDates of study: June 1993-December 1995Funding sources: “The study was supported by a grant from the Public Health andOperational Research Committee of the Anglia and Oxford Regional Health Authority.The NPEU is supported by the Department of Health”Declarations of interest: not reported
Risk of bias
Bias Authors’ judgement Support for judgement
Random sequence generation (selectionbias)
Low risk Variable sized balanced blocks “...randomi-sation envelopes were prepared in advance..” in an external academic unit - NationalPerinatal Epidemiology Unit, Oxford
Allocation concealment (selection bias) Low risk Sequentially numbered, opaque, sealed en-velopes stored on the ward. Entry to thestudy occurred when an envelope wasopened
54Active versus expectant management for women in the third stage of labour (Review)
Copyright © 2019 The Cochrane Collaboration. Published by John Wiley & Sons, Ltd.

Rogers 1998 (Continued)
Blinding of participants and personnel(performance bias)All outcomes
High risk Not possible to blind participants and per-sonnel
Blinding of outcome assessment (detectionbias)All outcomes
Unclear risk Partly blinded. The technicians who didantenatal and postnatal blood tests wereunaware of allocation
Incomplete outcome data (attrition bias)All outcomes
Low risk Data available on 1507 out of 1512 atdischarge (< 0.5% attrition, approximatelyequal losses in both groups)At 6 weeks’ follow-up < 5% attrition
Selective reporting (reporting bias) High risk No study protocol found. A large num-ber of outcomes reported but not noted inmethods of paper
Other bias High risk • Initial power calculation suggested asample size of 2000. Interim analysisshowed a higher PPH rate than expected,so sample size was revised to 1500 and thestudy stopped earlier than expected
• Similar at baseline• 93.4% of active management group
received active management. Only 63.9%of women in expectant managementgroup received expectant managementAlso:
• MWs not confident re 1 arm, soobserver bias
• the hypothesis was phrased in favourof active management lowering PPH rateand other complications, rather thanbeing a null hypothesis
• setting is described as one where themidwives were “similarly confident” inactive and expectant management.However, the questionnaire administeredto 92 of the 153 midwives prior to thestudy commencement showed that,whereas 84% felt “very confident” ofactive management, only 41% were “veryconfident” of expectant management
55Active versus expectant management for women in the third stage of labour (Review)
Copyright © 2019 The Cochrane Collaboration. Published by John Wiley & Sons, Ltd.

Thilaganathan 1993
Methods RCT with randomisation of individual women
Participants UK hospital setting. High-income countryInclusion criteria: women at ”low risk of PPH” (defined only by the exclusion criteriafor study) and at term (37-42 weeks). 193 women randomised, from an unknownpopulationExclusion criteria: grand multiparity; malpresentation, multiple pregnancy; previousCS or PPH; APH; pregnancy-induced hypertension and IUFDThen after randomisation: women who had had augmentation, instrumental or OVB,3rd degree tear and cervical laceration
Interventions Intervention: active management of 3rd stage (N = 103):• 1 mL syntometrine (not stated whether IM or IV) as soon as baby born• cord “was immediately clamped”• placenta delivered by CCT
Comparison: expectant management of 3rd stage (N = 90):presumed no oxytocic, though not stated in the published paperAuthors’ information by letter states:
• “No oxytocics or placebos were given to the physiological group”• cord not cut or clamped until after pulsation ceased (unless there were
contraindications, e.g. cord round neck, after clamping, maternal end clamp removedas soon as possible to allow drainage)
• once there were signs of placental separation mother was encouraged to adopt anupright position and bear down, “when the placenta could be felt in the vagina, themidwife could then assist delivery of the placenta”Both groups: if placenta not delivered in 30 min, bladder emptied and medical assistancesought. If delivery not imminent manual removal performed. Medical assistance soughtfor any excessive blood lossData included in comparisons 1 and 2
Outcomes Pre-specified outcomes: estimated blood loss; Hb in labour and 3rd postnatal day;length of 3rd stage; complicationsReported outcomes: as above plus therapeutic uterotonics, blood transfusion
Notes Drop in Hb is not calculated correctly.Maternal mean postnatal Hb reported as median and range. Active: 11.7 g/dL (10.7-12.6 g/dL) and expectant 11.7 g/dL (10.9-12.6 g/dL)Worrying problems with methodology and analysisDates of study: January 1988-February 1990Funding sources: not reportedDeclarations of interest: not reported
Risk of bias
Bias Authors’ judgement Support for judgement
Random sequence generation (selectionbias)
Low risk Quote: “...randomly allocated using stan-dard randomisation tables...”
56Active versus expectant management for women in the third stage of labour (Review)
Copyright © 2019 The Cochrane Collaboration. Published by John Wiley & Sons, Ltd.

Thilaganathan 1993 (Continued)
Allocation concealment (selection bias) Unclear risk Not described. Not clear when randomisa-tion occurredQuote: “...the midwife responsible for themanagement of her patient was not awareof the proposed allocation until her patientwas entered into the study” (authors’ infor-mation states: “randomised in the late 1st
stage of labour when it was apparent thatthey were likely to delivery normally”)
Blinding of participants and personnel(performance bias)All outcomes
High risk Not possible to blind participants and per-sonnel
Blinding of outcome assessment (detectionbias)All outcomes
Unclear risk Unknown
Incomplete outcome data (attrition bias)All outcomes
High risk It is not clear how many were randomised.P. 20 states “A total of 193 women com-pleted the study AND had all results avail-able for complete analysis”. This couldmean that a larger number were includedbut that some of their results were miss-ing, and they were therefore excluded. Thiscould lead to significant bias. It is very un-likely that all participants received the al-located management, yet this is not pre-sented. The study groups were also very dif-ferent sizes (103 and 93), which sounds un-likelyWomen withdrawn after randomisationfor operative delivery, third-degree tearsand cervical lacerations. Numbers were notgiven; there is a significant risk of bias hereIt is not stated in the published paperwhether or not ITT analysis was used, butthe response to Diana Elbourne’s letter ofApril 1991 states that they did not analyseon “intention to treat” as it would not an-swer the aims of this preliminary study
Selective reporting (reporting bias) Unclear risk All outcomes listed in the methods are re-ported, but there is no protocol availablefor the study
Other bias High risk Variables age, birthweight and parity said tobe equal between the groups but no detailsgiven. No power calculation done
57Active versus expectant management for women in the third stage of labour (Review)
Copyright © 2019 The Cochrane Collaboration. Published by John Wiley & Sons, Ltd.
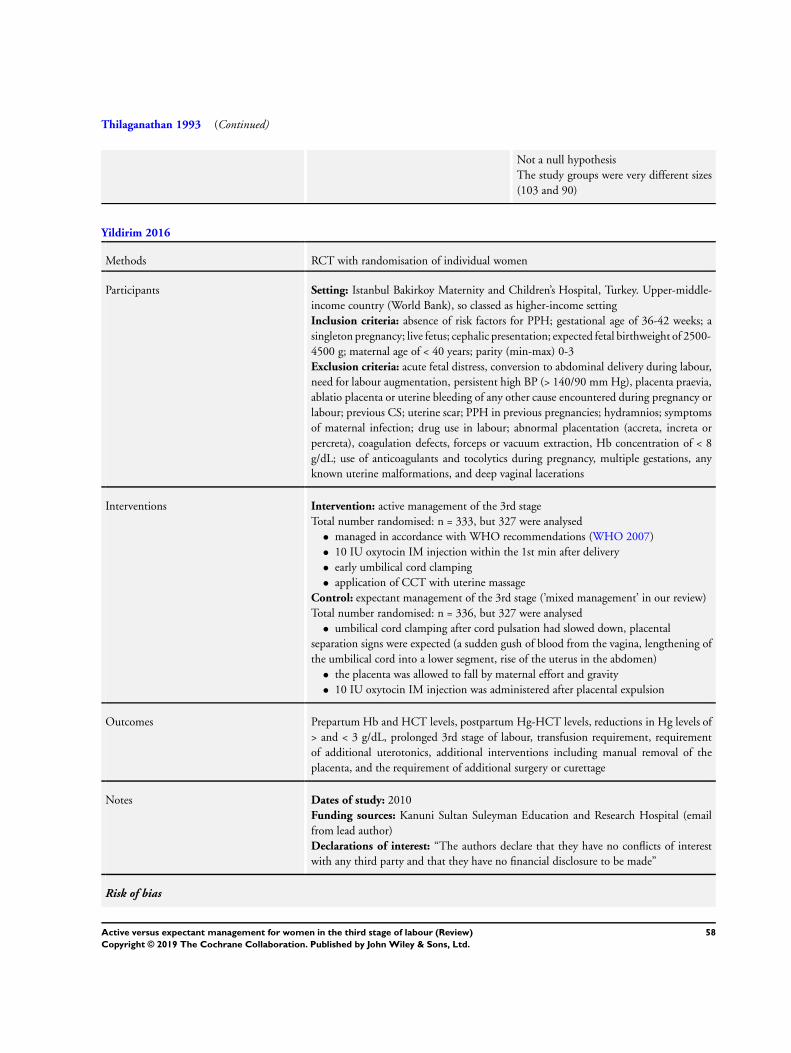
Thilaganathan 1993 (Continued)
Not a null hypothesisThe study groups were very different sizes(103 and 90)
Yildirim 2016
Methods RCT with randomisation of individual women
Participants Setting: Istanbul Bakirkoy Maternity and Children’s Hospital, Turkey. Upper-middle-income country (World Bank), so classed as higher-income settingInclusion criteria: absence of risk factors for PPH; gestational age of 36-42 weeks; asingleton pregnancy; live fetus; cephalic presentation; expected fetal birthweight of 2500-4500 g; maternal age of < 40 years; parity (min-max) 0-3Exclusion criteria: acute fetal distress, conversion to abdominal delivery during labour,need for labour augmentation, persistent high BP (> 140/90 mm Hg), placenta praevia,ablatio placenta or uterine bleeding of any other cause encountered during pregnancy orlabour; previous CS; uterine scar; PPH in previous pregnancies; hydramnios; symptomsof maternal infection; drug use in labour; abnormal placentation (accreta, increta orpercreta), coagulation defects, forceps or vacuum extraction, Hb concentration of < 8g/dL; use of anticoagulants and tocolytics during pregnancy, multiple gestations, anyknown uterine malformations, and deep vaginal lacerations
Interventions Intervention: active management of the 3rd stageTotal number randomised: n = 333, but 327 were analysed
• managed in accordance with WHO recommendations (WHO 2007)• 10 IU oxytocin IM injection within the 1st min after delivery• early umbilical cord clamping• application of CCT with uterine massage
Control: expectant management of the 3rd stage (’mixed management’ in our review)Total number randomised: n = 336, but 327 were analysed
• umbilical cord clamping after cord pulsation had slowed down, placentalseparation signs were expected (a sudden gush of blood from the vagina, lengthening ofthe umbilical cord into a lower segment, rise of the uterus in the abdomen)
• the placenta was allowed to fall by maternal effort and gravity• 10 IU oxytocin IM injection was administered after placental expulsion
Outcomes Prepartum Hb and HCT levels, postpartum Hg-HCT levels, reductions in Hg levels of> and < 3 g/dL, prolonged 3rd stage of labour, transfusion requirement, requirementof additional uterotonics, additional interventions including manual removal of theplacenta, and the requirement of additional surgery or curettage
Notes Dates of study: 2010Funding sources: Kanuni Sultan Suleyman Education and Research Hospital (emailfrom lead author)Declarations of interest: “The authors declare that they have no conflicts of interestwith any third party and that they have no financial disclosure to be made”
Risk of bias
58Active versus expectant management for women in the third stage of labour (Review)
Copyright © 2019 The Cochrane Collaboration. Published by John Wiley & Sons, Ltd.

Yildirim 2016 (Continued)
Bias Authors’ judgement Support for judgement
Random sequence generation (selectionbias)
Low risk The abstract reports “women were ran-domly assigned” however, no description isgiven in relation to this process. We con-tacted the lead author who responded: “Weprepared 1000 sealed opaque envelopes as-signed for each group; 500 were tagged with‘active management’, and the other 500 with‘expectant management’. We shuffled the en-velopes and put them in a box… Allocationtook place when vaginal delivery was immi-nent, at the end of the second stage of laborby pulling out one of the envelopes out of thebox randomly.”
Allocation concealment (selection bias) Unclear risk Quote: “Allocation concealment was madeusing sealed opaque envelopes and tookplace when vaginal delivery was imminent,at the end of the second stage of labor.”Additional information from the lead au-thor stated, quote: “We shuffled the en-velopes and put them in a box. Allocationtook place when vaginal delivery was im-minent, at the end of the second stage oflabor by pulling out one of the envelopesout of the box randomly….We tagged pa-pers with active or expectant management.Then we put them in to the envelopes (withnothing written on the outside). Thus, theperformer was not able to see which proto-col was written inside the envelope.”Although the sequence generated was ran-dom, the envelopes were not sequentiallynumbered and so the random sequencecould not be guaranteed as per the CochraneHandbook of Systematic Reviews of Interven-tions, which says, “If investigators use en-velopes, they should develop and moni-tor the allocation process to preserve con-cealment. In addition to use of sequen-tially numbered, opaque, sealed envelopes,they should ensure that the envelopes areopened sequentially, and only after the en-velope has been irreversibly assigned to theparticipant.” (Higgins 2017)
59Active versus expectant management for women in the third stage of labour (Review)
Copyright © 2019 The Cochrane Collaboration. Published by John Wiley & Sons, Ltd.

Yildirim 2016 (Continued)
Blinding of participants and personnel(performance bias)All outcomes
High risk Women and clinicians cannot be blinded tothe different management of care associatedwith active and expectant management
Blinding of outcome assessment (detectionbias)All outcomes
Unclear risk Quote: “only the analyser of the outcomedata was blinded to the study groups be-cause the performer could not be blinded tothe allocated management protocol”. How-ever, we deemed this domain to be of un-clear risk of bias as non-blinded clinicianswere involved in many important outcomedecisions
Incomplete outcome data (attrition bias)All outcomes
Low risk 15 women out of 669 women (2.2%) wereexcluded after randomisation due to deepvaginal lacerations
Selective reporting (reporting bias) Unclear risk No protocol for the study is available. Alloutcomes reported in the methods are re-ported plus one outcome (atony) reportedbut not mentioned in methods
Other bias Unclear risk Baseline characteristics were similar (age,gestational week, body mass index, parity,episiotomy, and mean length of labour).However, there is little methodological in-formation in the publication on which tojudge potential for bias - mostly the infor-mation is about clinical careThe study authors do not identify the pro-fession of the clinicians, nor is it clear ifthe healthcare practitioners received anyeducation/training in relation to expectantand active management of the 3rd stage oflabour before this published study. How-ever, the lead author provided clarificationon this reporting: “We had to train the per-formers for the active management proto-col (especially for the controlled cord trac-tion) which was not a common practice inour hospital then.”Exclusion of women with PPH due todeep vaginal lacerations (6/333 in activemanagement group and 9/336 in expec-tant management group), although num-bers are low, this could contribute to bias
60Active versus expectant management for women in the third stage of labour (Review)
Copyright © 2019 The Cochrane Collaboration. Published by John Wiley & Sons, Ltd.

APH: antepartum haemorrhage; BP: blood pressure; CCT: controlled cord traction; CS: caesarean section; ERPC: evacuation ofretained products of conception; fL: femtolitre; GA: general anaesthesia; g/dL: grams/decilitre; Hb: haemoglobin; HCT: haematocrit(= packed cell volume); IM: intramuscular; ITT: intention-to-treat; IU: international units; IUFD: intrauterine fetal death; IV:
intravenous; MCV: mean corpuscular volume; mL: millilitre; MW: midwife; OVB: operative vaginal birth; PCV: packed cell volume(= haematocrit); P/N: postnatal; PPH: postpartum haemorrhage; PP: postpartum; RCT: randomised controlled trial; SCBU: specialcare baby unit; SD: standard deviation; SE: standard error; WHO: World Health Organization
Characteristics of excluded studies [ordered by study ID]
Study Reason for exclusion
Abdel-Aleem 2010 This study looked at uterine massage vs active management vs active management plus uterine massage, soit was not a comparison of active and expectant management within the definitions used in the review
Deneux-Tharaux 2013 This study was an RCT of active management with and without CCT, so it was not a comparison of activeand expectant management within the definitions used in the review
Gulmezoglu 2012 This study was an RCT of active management with and without CCT, so it was not a comparison of activeand expectant management within the definitions used in the review
Hoffman 2006 Conference abstract available only, but further information on methodology obtained from study authors.Concerns re number of women withdrawn, after randomisation, due to CS
Kashanian 2010 48% of participants excluded in both arms following randomisation
Magann 2006 This study looked at different times of undertaking manual removal of placenta to try to reduce PPH, soit was not a comparison of active and expectant management within the definitions used in the review
Muller 1996 French conference abstract only, no full publication identified. The translation provided no informationon the number of women randomised to each group and so it was not possible to use these data. Previousreview authors wrote for further information but had no response. We wrote and received a response fromthe co-author, but no further details to add to the published information
Neri-Mejia 2016 An RCT of 3 different types of oxytocin administration (IM, IV and infusion)
Ramirez 2001 Insufficient information on the numbers included in each of the 3 arms, and the method of managementfor the expectant arm
Vasegh 2005 Insufficient information
CCT: controlled cord traction; CS: caesarean section; IM: intramuscular;IV: intravenous; PPH: postpartum haemorrhage; RCT:
randomised controlled trial
61Active versus expectant management for women in the third stage of labour (Review)
Copyright © 2019 The Cochrane Collaboration. Published by John Wiley & Sons, Ltd.

Characteristics of studies awaiting assessment [ordered by study ID]
Rosario 1973
Methods
Participants
Interventions
Outcomes
Notes Awaiting a copy of the paper
62Active versus expectant management for women in the third stage of labour (Review)
Copyright © 2019 The Cochrane Collaboration. Published by John Wiley & Sons, Ltd.

D A T A A N D A N A L Y S E S
Comparison 1. Active versus expectant management of 3rd stage of labour (all women)
Outcome or subgroup titleNo. of
studies
No. of
participants Statistical method Effect size
1 Severe primary postpartumhaemorrhage (PPH) at time ofbirth (clinically estimated ormeasured blood loss ≥ 1000mL)
3 4636 Risk Ratio (M-H, Random, 95% CI) 0.34 [0.14, 0.87]
1.1 Higher-income setting 3 4636 Risk Ratio (M-H, Random, 95% CI) 0.34 [0.14, 0.87]1.2 Lower-income setting 0 0 Risk Ratio (M-H, Random, 95% CI) 0.0 [0.0, 0.0]
2 Very severe primary PPH at timeof birth (clinically estimated ormeasured blood loss ≥ 2500mL)
0 0 Risk Ratio (M-H, Random, 95% CI) 0.0 [0.0, 0.0]
2.1 Higher-income setting 0 0 Risk Ratio (M-H, Random, 95% CI) 0.0 [0.0, 0.0]2.2 Lower-income setting 0 0 Risk Ratio (M-H, Random, 95% CI) 0.0 [0.0, 0.0]
3 Maternal mortality 0 0 Risk Ratio (M-H, Random, 95% CI) 0.0 [0.0, 0.0]3.1 Higher-income setting 0 0 Risk Ratio (M-H, Random, 95% CI) 0.0 [0.0, 0.0]3.2 Lower-income setting 0 0 Risk Ratio (M-H, Random, 95% CI) 0.0 [0.0, 0.0]
4 Maternal Hb < 9 g/dL 24-72hours postpartum
2 1572 Risk Ratio (M-H, Random, 95% CI) 0.50 [0.30, 0.83]
4.1 Higher-income setting 2 1572 Risk Ratio (M-H, Random, 95% CI) 0.50 [0.30, 0.83]4.2 Lower-income setting 0 0 Risk Ratio (M-H, Random, 95% CI) 0.0 [0.0, 0.0]
5 Admission to neonatalspecial/intensive care
2 3207 Risk Ratio (M-H, Random, 95% CI) 0.81 [0.60, 1.11]
5.1 Higher-income setting 2 3207 Risk Ratio (M-H, Random, 95% CI) 0.81 [0.60, 1.11]5.2 Lower-income setting 0 0 Risk Ratio (M-H, Random, 95% CI) 0.0 [0.0, 0.0]
6 Neonatal jaundice requiringphototherapy or exchangetransfusion
2 3142 Risk Ratio (M-H, Random, 95% CI) 0.96 [0.55, 1.68]
6.1 Higher-income setting 2 3142 Risk Ratio (M-H, Random, 95% CI) 0.96 [0.55, 1.68]6.2 Lower-income setting 0 0 Risk Ratio (M-H, Random, 95% CI) 0.0 [0.0, 0.0]
7 Neonatal polycythaemia treatedwith dilutional exchangetransfusion
0 0 Risk Ratio (M-H, Random, 95% CI) 0.0 [0.0, 0.0]
7.1 Higher-income setting 0 0 Risk Ratio (M-H, Random, 95% CI) 0.0 [0.0, 0.0]7.2 Lower-income setting 0 0 Risk Ratio (M-H, Random, 95% CI) 0.0 [0.0, 0.0]
8 Severe primary PPH afterplacental delivery and up to 24hours (clinically estimated ormeasured blood loss ≥ 1000mL)
0 0 Risk Ratio (M-H, Random, 95% CI) 0.0 [0.0, 0.0]
8.1 Higher-income setting 0 0 Risk Ratio (M-H, Random, 95% CI) 0.0 [0.0, 0.0]8.2 Lower-income setting 0 0 Risk Ratio (M-H, Random, 95% CI) 0.0 [0.0, 0.0]
63Active versus expectant management for women in the third stage of labour (Review)
Copyright © 2019 The Cochrane Collaboration. Published by John Wiley & Sons, Ltd.

9 Severe primary PPH at timeof birth and up to 24 hours(clinically estimated ormeasured blood loss ≥ 1000mL)
0 0 Risk Ratio (M-H, Random, 95% CI) 0.0 [0.0, 0.0]
9.1 Higher-income setting 0 0 Risk Ratio (M-H, Random, 95% CI) 0.0 [0.0, 0.0]9.2 Lower-income setting 0 0 Risk Ratio (M-H, Random, 95% CI) 0.0 [0.0, 0.0]
10 Primary blood loss ≥ 500mL at time of birth (clinicallyestimated or measured)
3 4636 Risk Ratio (M-H, Random, 95% CI) 0.34 [0.27, 0.44]
10.1 Higher-income setting 3 4636 Risk Ratio (M-H, Random, 95% CI) 0.34 [0.27, 0.44]10.2 Lower-income setting 0 0 Risk Ratio (M-H, Random, 95% CI) 0.0 [0.0, 0.0]
11 Primary blood loss ≥ 500mL after delivery of placentaand up to 24 hours (clinicallyestimated or measured)
0 0 Risk Ratio (M-H, Random, 95% CI) 0.0 [0.0, 0.0]
11.1 Higher-income setting 0 0 Risk Ratio (M-H, Random, 95% CI) 0.0 [0.0, 0.0]11.2 Lower-income setting 0 0 Risk Ratio (M-H, Random, 95% CI) 0.0 [0.0, 0.0]
12 Primary blood loss ≥ 500 mLat time of birth and up to 24hours (clinically estimated ormeasured)
0 0 Risk Ratio (M-H, Random, 95% CI) 0.0 [0.0, 0.0]
12.1 Higher-income setting 0 0 Risk Ratio (M-H, Random, 95% CI) 0.0 [0.0, 0.0]12.2 Lower-income setting 0 0 Risk Ratio (M-H, Random, 95% CI) 0.0 [0.0, 0.0]
13 Mean maternal blood loss(mL) at time of birth (clinicallyestimated or measured)
2 2941 Mean Difference (IV, Random, 95% CI) -78.80 [-95.96, -61.64]
13.1 Higher-income setting 2 2941 Mean Difference (IV, Random, 95% CI) -78.80 [-95.96, -61.64]
13.2 Lower-income setting 0 0 Mean Difference (IV, Random, 95% CI) 0.0 [0.0, 0.0]
14 Mean maternal blood loss(mL) after delivery of placentaand up to 24 hours (clinicallyestimated or measured)
0 0 Mean Difference (IV, Random, 95% CI) 0.0 [0.0, 0.0]
14.1 Higher-income setting 0 0 Mean Difference (IV, Random, 95% CI) 0.0 [0.0, 0.0]14.2 Lower-income setting 0 0 Mean Difference (IV, Random, 95% CI) 0.0 [0.0, 0.0]
15 Mean maternal blood loss (mLat time of birth and up to 24hours (clinically estimated ormeasured)
0 0 Mean Difference (IV, Random, 95% CI) 0.0 [0.0, 0.0]
15.1 Higher-income setting 0 0 Mean Difference (IV, Random, 95% CI) 0.0 [0.0, 0.0]15.2 Lower-income setting 0 0 Mean Difference (IV, Random, 95% CI) 0.0 [0.0, 0.0]
16 Maternal blood transfusion 4 4829 Risk Ratio (M-H, Random, 95% CI) 0.35 [0.22, 0.55]16.1 Higher-income setting 4 4829 Risk Ratio (M-H, Random, 95% CI) 0.35 [0.22, 0.55]16.2 Lower-income setting 0 0 Risk Ratio (M-H, Random, 95% CI) 0.0 [0.0, 0.0]
17 Clinical signs of severe bloodloss
0 0 Risk Ratio (M-H, Random, 95% CI) 0.0 [0.0, 0.0]
17.1 Higher-income setting 0 0 Risk Ratio (M-H, Random, 95% CI) 0.0 [0.0, 0.0]17.2 Lower-income setting 0 0 Risk Ratio (M-H, Random, 95% CI) 0.0 [0.0, 0.0]
18 Therapeutic uterotonics duringthird stage and/or within 24hours
4 4829 Risk Ratio (M-H, Random, 95% CI) 0.19 [0.15, 0.23]
64Active versus expectant management for women in the third stage of labour (Review)
Copyright © 2019 The Cochrane Collaboration. Published by John Wiley & Sons, Ltd.

18.1 Higher-income setting 4 4829 Risk Ratio (M-H, Random, 95% CI) 0.19 [0.15, 0.23]18.2 Lower-income setting 0 0 Risk Ratio (M-H, Random, 95% CI) 0.0 [0.0, 0.0]
19 Mean length of third stage 1 1429 Mean Difference (IV, Random, 95% CI) -0.30 [-1.87, 1.27]19.1 Higher-income setting 1 1429 Mean Difference (IV, Random, 95% CI) -0.30 [-1.87, 1.27]19.2 Lower-income setting 0 0 Mean Difference (IV, Random, 95% CI) 0.0 [0.0, 0.0]
20 Manual removal of placenta asdefined by study authors
4 4829 Risk Ratio (M-H, Random, 95% CI) 1.78 [0.57, 5.56]
20.1 Higher-income setting 4 4829 Risk Ratio (M-H, Random, 95% CI) 1.78 [0.57, 5.56]20.2 Lower-income setting 0 0 Risk Ratio (M-H, Random, 95% CI) 0.0 [0.0, 0.0]
21 Postnatal diastolic bloodpressure > 90 mmHg betweenbirth of baby and dischargefrom the labour ward
3 4636 Risk Ratio (M-H, Random, 95% CI) 4.10 [1.63, 10.30]
21.1 Higher-income setting 3 4636 Risk Ratio (M-H, Random, 95% CI) 4.10 [1.63, 10.30]21.2 Lower-income setting 0 0 Risk Ratio (M-H, Random, 95% CI) 0.0 [0.0, 0.0]
22 Postnatal vomiting betweenbirth of baby and dischargefrom the labour ward
3 4636 Risk Ratio (M-H, Random, 95% CI) 2.47 [1.36, 4.48]
22.1 Higher-income setting 3 4636 Risk Ratio (M-H, Random, 95% CI) 2.47 [1.36, 4.48]22.2 Lower-income setting 0 0 Risk Ratio (M-H, Random, 95% CI) 0.0 [0.0, 0.0]
23 Any analgesia between birth ofthe baby and discharge fromlabour ward
1 1429 Risk Ratio (M-H, Random, 95% CI) 2.53 [1.34, 4.78]
23.1 Higher-income setting 1 1429 Risk Ratio (M-H, Random, 95% CI) 2.53 [1.34, 4.78]23.2 Lower-income setting 0 0 Risk Ratio (M-H, Random, 95% CI) 0.0 [0.0, 0.0]
24 Women’s assessment of painduring third stage as reportedby study authors
0 0 Risk Ratio (M-H, Random, 95% CI) 0.0 [0.0, 0.0]
24.1 Higher-income setting 0 0 Risk Ratio (M-H, Random, 95% CI) 0.0 [0.0, 0.0]24.2 Lower-income setting 0 0 Risk Ratio (M-H, Random, 95% CI) 0.0 [0.0, 0.0]
25 Secondary blood loss/anyvaginal bleeding needingtreatment (after 24 hours andup to 6 weeks)
3 4636 Risk Ratio (M-H, Random, 95% CI) 1.10 [0.40, 2.99]
25.1 Higher-income setting 3 4636 Risk Ratio (M-H, Random, 95% CI) 1.10 [0.40, 2.99]25.2 Lower-income setting 0 0 Risk Ratio (M-H, Random, 95% CI) 0.0 [0.0, 0.0]
26 Amount of lochia eitherestimated or measured after 24hours and up to discharge fromhospital
0 0 Mean Difference (IV, Random, 95% CI) 0.0 [0.0, 0.0]
26.1 Higher-income setting 0 0 Mean Difference (IV, Random, 95% CI) 0.0 [0.0, 0.0]26.2 Lower-income setting 0 0 Mean Difference (IV, Random, 95% CI) 0.0 [0.0, 0.0]
27 Surgical evacuation of retainedproducts of conception
3 4636 Risk Ratio (M-H, Random, 95% CI) 0.74 [0.32, 1.71]
27.1 Higher-income setting 3 4636 Risk Ratio (M-H, Random, 95% CI) 0.74 [0.32, 1.71]27.2 Lower-income setting 0 0 Risk Ratio (M-H, Random, 95% CI) 0.0 [0.0, 0.0]
28 Afterpains - abdominal painassociated with the contractinguterus in the postpartumperiod
1 1429 Risk Ratio (M-H, Random, 95% CI) 2.53 [1.34, 4.78]
28.1 Higher-income setting 1 1429 Risk Ratio (M-H, Random, 95% CI) 2.53 [1.34, 4.78]28.2 Lower-income setting 0 0 Risk Ratio (M-H, Random, 95% CI) 0.0 [0.0, 0.0]
65Active versus expectant management for women in the third stage of labour (Review)
Copyright © 2019 The Cochrane Collaboration. Published by John Wiley & Sons, Ltd.

29 Apgar score < 7 at 5 minutes 1 1695 Risk Ratio (M-H, Random, 95% CI) 1.00 [0.38, 2.66]29.1 Higher-income setting 1 1695 Risk Ratio (M-H, Random, 95% CI) 1.00 [0.38, 2.66]29.2 Lower-income setting 0 0 Risk Ratio (M-H, Random, 95% CI) 0.0 [0.0, 0.0]
30 Birthweight 2 3207 Mean Difference (IV, Random, 95% CI) -76.90 [-108.51, -45.30]
30.1 Higher-income setting 2 3207 Mean Difference (IV, Random, 95% CI) -76.90 [-108.51, -45.30]
30.2 Lower-income setting 0 0 Mean Difference (IV, Random, 95% CI) 0.0 [0.0, 0.0]
31 Neonatal encephalopathyassessed using Sarnat staging(Sarnat 1976; Table 1)
0 0 Risk Ratio (M-H, Random, 95% CI) 0.0 [0.0, 0.0]
31.1 Higher-income setting 0 0 Risk Ratio (M-H, Random, 95% CI) 0.0 [0.0, 0.0]31.2 Lower-income setting 0 0 Risk Ratio (M-H, Random, 95% CI) 0.0 [0.0, 0.0]
32 Neonatal mortality 0 0 Risk Ratio (M-H, Random, 95% CI) 0.0 [0.0, 0.0]32.1 Higher-income setting 0 0 Risk Ratio (M-H, Random, 95% CI) 0.0 [0.0, 0.0]32.2 Lower-income setting 0 0 Risk Ratio (M-H, Random, 95% CI) 0.0 [0.0, 0.0]
33 Intraventricular haemorrhage- Papille grade III/IV - (forinfants born before 34 weeks’gestation only)
0 0 Risk Ratio (M-H, Random, 95% CI) 0.0 [0.0, 0.0]
33.1 Higher-income setting 0 0 Risk Ratio (M-H, Random, 95% CI) 0.0 [0.0, 0.0]33.2 Lower-income setting 0 0 Risk Ratio (M-H, Random, 95% CI) 0.0 [0.0, 0.0]
34 Number of infants whoreceived a red blood celltransfusion
0 0 Risk Ratio (M-H, Random, 95% CI) 0.0 [0.0, 0.0]
34.1 Higher-income setting 0 0 Risk Ratio (M-H, Random, 95% CI) 0.0 [0.0, 0.0]34.2 Lower-income setting 0 0 Risk Ratio (M-H, Random, 95% CI) 0.0 [0.0, 0.0]
35 Infant Hb level at 24 to 72hours
0 0 Mean Difference (IV, Random, 95% CI) 0.0 [0.0, 0.0]
35.1 Higher-income setting 0 0 Mean Difference (IV, Random, 95% CI) 0.0 [0.0, 0.0]35.2 Lower-income setting 0 0 Mean Difference (IV, Random, 95% CI) 0.0 [0.0, 0.0]
36 Infant Hb level at 3-6 months 0 0 Mean Difference (IV, Random, 95% CI) 0.0 [0.0, 0.0]36.1 Higher-income setting 0 0 Mean Difference (IV, Random, 95% CI) 0.0 [0.0, 0.0]36.2 Lower-income setting 0 0 Mean Difference (IV, Random, 95% CI) 0.0 [0.0, 0.0]
37 Infant iron indices (ferritin) at3 to 6 months.
0 0 Risk Ratio (M-H, Random, 95% CI) 0.0 [0.0, 0.0]
37.1 Higher-income setting 0 0 Risk Ratio (M-H, Random, 95% CI) 0.0 [0.0, 0.0]37.2 Lower-income setting 0 0 Risk Ratio (M-H, Random, 95% CI) 0.0 [0.0, 0.0]
38 Exclusive breastfeeding atdischarge from hospital
1 1695 Risk Ratio (M-H, Random, 95% CI) 1.01 [0.96, 1.07]
38.1 Higher-income setting 1 1695 Risk Ratio (M-H, Random, 95% CI) 1.01 [0.96, 1.07]38.2 Lower-income setting 0 0 Risk Ratio (M-H, Random, 95% CI) 0.0 [0.0, 0.0]
39 Neurodevelopmental, cognitiveor developmental outcomesassessed after age 18 months
0 0 Risk Ratio (M-H, Random, 95% CI) 0.0 [0.0, 0.0]
39.1 Higher-income setting 0 0 Risk Ratio (M-H, Random, 95% CI) 0.0 [0.0, 0.0]39.2 Lower-income setting 0 0 Risk Ratio (M-H, Random, 95% CI) 0.0 [0.0, 0.0]
40 Return to hospital as in- oroutpatient because of bleeding(not pre-specified)
2 2941 Risk Ratio (M-H, Random, 95% CI) 2.21 [1.29, 3.79]
40.1 Higher-income setting 2 2941 Risk Ratio (M-H, Random, 95% CI) 2.21 [1.29, 3.79]40.2 Lower-income setting 0 0 Risk Ratio (M-H, Random, 95% CI) 0.0 [0.0, 0.0]
66Active versus expectant management for women in the third stage of labour (Review)
Copyright © 2019 The Cochrane Collaboration. Published by John Wiley & Sons, Ltd.

41 Postnatal maternal mean Hb(outcome not pre-specified)
3 4062 Mean Difference (IV, Random, 95% CI) 0.52 [0.44, 0.60]
41.1 Higher-income setting 3 4062 Mean Difference (IV, Random, 95% CI) 0.52 [0.44, 0.60]41.2 Lower-income setting 0 0 Mean Difference (IV, Random, 95% CI) 0.0 [0.0, 0.0]
Comparison 2. Active versus expectant management of 3rd stage of labour (women at low risk)
Outcome or subgroup titleNo. of
studies
No. of
participants Statistical method Effect size
1 Severe primary PPH at time ofbirth (clinically estimated ormeasured blood loss ≥ 1000mL)
2 2941 Risk Ratio (M-H, Random, 95% CI) 0.31 [0.05, 2.17]
1.1 Higher-income setting 2 2941 Risk Ratio (M-H, Random, 95% CI) 0.31 [0.05, 2.17]1.2 Lower-income setting 0 0 Risk Ratio (M-H, Random, 95% CI) 0.0 [0.0, 0.0]
2 Very severe primary PPH at timeof birth (clinically estimated ormeasured blood loss ≥ 2500mL)
0 0 Risk Ratio (M-H, Random, 95% CI) 0.0 [0.0, 0.0]
2.1 Higher-income setting 0 0 Risk Ratio (M-H, Random, 95% CI) 0.0 [0.0, 0.0]2.2 Lower-income setting 0 0 Risk Ratio (M-H, Random, 95% CI) 0.0 [0.0, 0.0]
3 Maternal mortality 0 0 Risk Ratio (M-H, Random, 95% CI) 0.0 [0.0, 0.0]3.1 Higher-income setting 0 0 Risk Ratio (M-H, Random, 95% CI) 0.0 [0.0, 0.0]3.2 Lower-income setting 0 0 Risk Ratio (M-H, Random, 95% CI) 0.0 [0.0, 0.0]
4 Maternal Hb < 9 g/dL at 24-72hr
1 193 Risk Ratio (M-H, Random, 95% CI) 0.17 [0.02, 1.47]
4.1 Higher-income setting 1 193 Risk Ratio (M-H, Random, 95% CI) 0.17 [0.02, 1.47]4.2 Lower-income setting 0 0 Risk Ratio (M-H, Random, 95% CI) 0.0 [0.0, 0.0]
5 Admission to neonatalspecial/intensive care
1 1512 Risk Ratio (M-H, Random, 95% CI) 1.02 [0.55, 1.88]
5.1 Higher-income setting 1 1512 Risk Ratio (M-H, Random, 95% CI) 1.02 [0.55, 1.88]5.2 Lower-income setting 0 0 Risk Ratio (M-H, Random, 95% CI) 0.0 [0.0, 0.0]
6 Neonatal jaundice requiringphototherapy or exchangetransfusion
1 1447 Risk Ratio (M-H, Random, 95% CI) 1.31 [0.78, 2.18]
6.1 Higher-income setting 1 1447 Risk Ratio (M-H, Random, 95% CI) 1.31 [0.78, 2.18]6.2 Lower-income setting 0 0 Risk Ratio (M-H, Random, 95% CI) 0.0 [0.0, 0.0]
7 Neonatal polycythaemia treatedwith dilutional exchangetransfusion
0 0 Risk Ratio (M-H, Random, 95% CI) 0.0 [0.0, 0.0]
7.1 Higher-income setting 0 0 Risk Ratio (M-H, Random, 95% CI) 0.0 [0.0, 0.0]7.2 Lower-income setting 0 0 Risk Ratio (M-H, Random, 95% CI) 0.0 [0.0, 0.0]
8 Severe primary PPH afterplacental delivery and up to 24hours (clinically estimated ormeasured blood loss ≥ 1000mL)
0 0 Risk Ratio (M-H, Random, 95% CI) 0.0 [0.0, 0.0]
8.1 Higher-income setting 0 0 Risk Ratio (M-H, Random, 95% CI) 0.0 [0.0, 0.0]8.2 Lower-income setting 0 0 Risk Ratio (M-H, Random, 95% CI) 0.0 [0.0, 0.0]
67Active versus expectant management for women in the third stage of labour (Review)
Copyright © 2019 The Cochrane Collaboration. Published by John Wiley & Sons, Ltd.
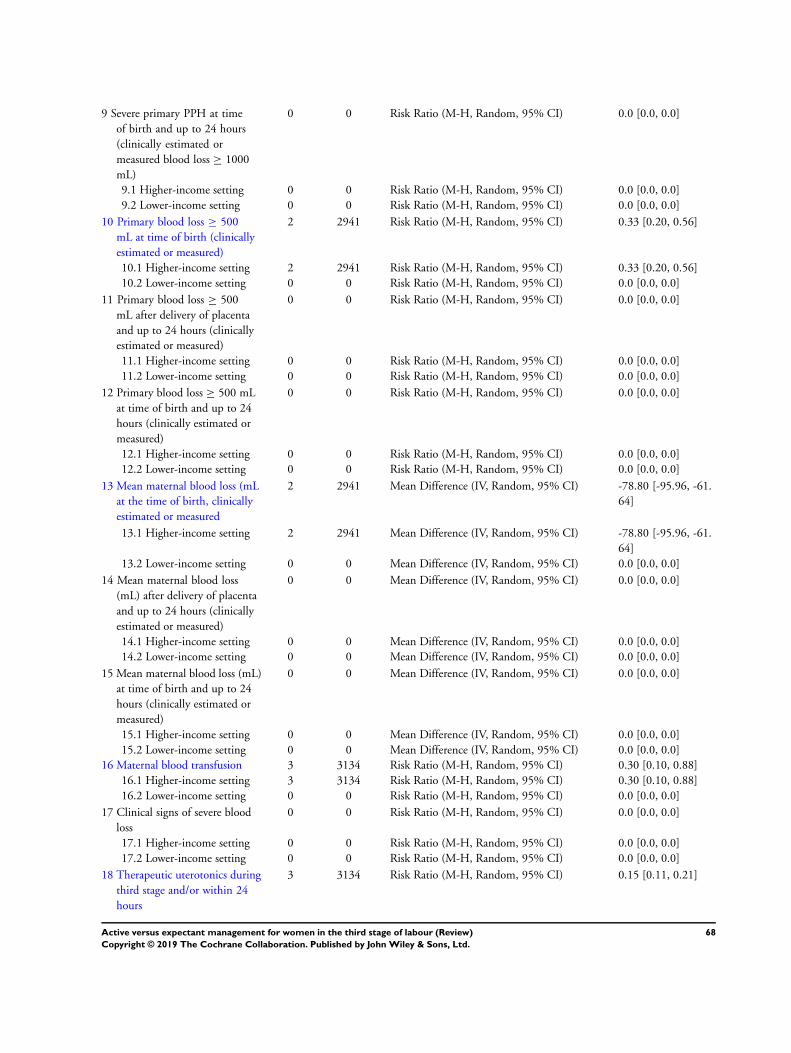
9 Severe primary PPH at timeof birth and up to 24 hours(clinically estimated ormeasured blood loss ≥ 1000mL)
0 0 Risk Ratio (M-H, Random, 95% CI) 0.0 [0.0, 0.0]
9.1 Higher-income setting 0 0 Risk Ratio (M-H, Random, 95% CI) 0.0 [0.0, 0.0]9.2 Lower-income setting 0 0 Risk Ratio (M-H, Random, 95% CI) 0.0 [0.0, 0.0]
10 Primary blood loss ≥ 500mL at time of birth (clinicallyestimated or measured)
2 2941 Risk Ratio (M-H, Random, 95% CI) 0.33 [0.20, 0.56]
10.1 Higher-income setting 2 2941 Risk Ratio (M-H, Random, 95% CI) 0.33 [0.20, 0.56]10.2 Lower-income setting 0 0 Risk Ratio (M-H, Random, 95% CI) 0.0 [0.0, 0.0]
11 Primary blood loss ≥ 500mL after delivery of placentaand up to 24 hours (clinicallyestimated or measured)
0 0 Risk Ratio (M-H, Random, 95% CI) 0.0 [0.0, 0.0]
11.1 Higher-income setting 0 0 Risk Ratio (M-H, Random, 95% CI) 0.0 [0.0, 0.0]11.2 Lower-income setting 0 0 Risk Ratio (M-H, Random, 95% CI) 0.0 [0.0, 0.0]
12 Primary blood loss ≥ 500 mLat time of birth and up to 24hours (clinically estimated ormeasured)
0 0 Risk Ratio (M-H, Random, 95% CI) 0.0 [0.0, 0.0]
12.1 Higher-income setting 0 0 Risk Ratio (M-H, Random, 95% CI) 0.0 [0.0, 0.0]12.2 Lower-income setting 0 0 Risk Ratio (M-H, Random, 95% CI) 0.0 [0.0, 0.0]
13 Mean maternal blood loss (mLat the time of birth, clinicallyestimated or measured
2 2941 Mean Difference (IV, Random, 95% CI) -78.80 [-95.96, -61.64]
13.1 Higher-income setting 2 2941 Mean Difference (IV, Random, 95% CI) -78.80 [-95.96, -61.64]
13.2 Lower-income setting 0 0 Mean Difference (IV, Random, 95% CI) 0.0 [0.0, 0.0]
14 Mean maternal blood loss(mL) after delivery of placentaand up to 24 hours (clinicallyestimated or measured)
0 0 Mean Difference (IV, Random, 95% CI) 0.0 [0.0, 0.0]
14.1 Higher-income setting 0 0 Mean Difference (IV, Random, 95% CI) 0.0 [0.0, 0.0]14.2 Lower-income setting 0 0 Mean Difference (IV, Random, 95% CI) 0.0 [0.0, 0.0]
15 Mean maternal blood loss (mL)at time of birth and up to 24hours (clinically estimated ormeasured)
0 0 Mean Difference (IV, Random, 95% CI) 0.0 [0.0, 0.0]
15.1 Higher-income setting 0 0 Mean Difference (IV, Random, 95% CI) 0.0 [0.0, 0.0]15.2 Lower-income setting 0 0 Mean Difference (IV, Random, 95% CI) 0.0 [0.0, 0.0]
16 Maternal blood transfusion 3 3134 Risk Ratio (M-H, Random, 95% CI) 0.30 [0.10, 0.88]16.1 Higher-income setting 3 3134 Risk Ratio (M-H, Random, 95% CI) 0.30 [0.10, 0.88]16.2 Lower-income setting 0 0 Risk Ratio (M-H, Random, 95% CI) 0.0 [0.0, 0.0]
17 Clinical signs of severe bloodloss
0 0 Risk Ratio (M-H, Random, 95% CI) 0.0 [0.0, 0.0]
17.1 Higher-income setting 0 0 Risk Ratio (M-H, Random, 95% CI) 0.0 [0.0, 0.0]17.2 Lower-income setting 0 0 Risk Ratio (M-H, Random, 95% CI) 0.0 [0.0, 0.0]
18 Therapeutic uterotonics duringthird stage and/or within 24hours
3 3134 Risk Ratio (M-H, Random, 95% CI) 0.15 [0.11, 0.21]
68Active versus expectant management for women in the third stage of labour (Review)
Copyright © 2019 The Cochrane Collaboration. Published by John Wiley & Sons, Ltd.

18.1 Higher-income setting 3 3134 Risk Ratio (M-H, Random, 95% CI) 0.15 [0.11, 0.21]18.2 Lower-income setting 0 0 Risk Ratio (M-H, Random, 95% CI) 0.0 [0.0, 0.0]
19 Mean length of third stage 1 1429 Mean Difference (IV, Random, 95% CI) -0.30 [-1.87, 1.27]19.1 Higher-income setting 1 1429 Mean Difference (IV, Random, 95% CI) -0.30 [-1.87, 1.27]19.2 Lower-income setting 0 0 Mean Difference (IV, Random, 95% CI) 0.0 [0.0, 0.0]
20 Manual removal of placenta asdefined by study authors
3 3134 Risk Ratio (M-H, Random, 95% CI) 3.58 [0.42, 30.61]
20.1 Higher-income setting 3 3134 Risk Ratio (M-H, Random, 95% CI) 3.58 [0.42, 30.61]20.2 Lower-income setting 0 0 Risk Ratio (M-H, Random, 95% CI) 0.0 [0.0, 0.0]
21 Postnatal diastolic bloodpressure > 90 mmHg betweenbirth of baby and dischargefrom the labour ward
2 2941 Risk Ratio (M-H, Random, 95% CI) 7.00 [2.99, 16.43]
21.1 Higher-income setting 2 2941 Risk Ratio (M-H, Random, 95% CI) 7.00 [2.99, 16.43]21.2 Lower-income setting 0 0 Risk Ratio (M-H, Random, 95% CI) 0.0 [0.0, 0.0]
22 Postnatal vomiting betweenbirth of baby and dischargefrom the labour ward.
2 2941 Risk Ratio (M-H, Random, 95% CI) 5.63 [0.69, 46.08]
22.1 Higher-income setting 2 2941 Risk Ratio (M-H, Random, 95% CI) 5.63 [0.69, 46.08]22.2 Lower-income setting 0 0 Risk Ratio (M-H, Random, 95% CI) 0.0 [0.0, 0.0]
23 Any analgesia between birth ofthe baby and up to dischargefrom labour ward
1 1429 Risk Ratio (M-H, Random, 95% CI) 2.53 [1.34, 4.78]
23.1 Higher-income setting 1 1429 Risk Ratio (M-H, Random, 95% CI) 2.53 [1.34, 4.78]23.2 Lower-income setting 0 0 Risk Ratio (M-H, Random, 95% CI) 0.0 [0.0, 0.0]
24 Women’s assessment of painduring third stage as reportedby study authors
0 0 Risk Ratio (M-H, Random, 95% CI) 0.0 [0.0, 0.0]
24.1 Higher-income setting 0 0 Risk Ratio (M-H, Random, 95% CI) 0.0 [0.0, 0.0]24.2 Lower-income setting 0 0 Risk Ratio (M-H, Random, 95% CI) 0.0 [0.0, 0.0]
25 Secondary blood loss/anyvaginal bleeding needingtreatment (after 24 hours andup to 6 weeks)
2 2941 Risk Ratio (M-H, Random, 95% CI) 1.78 [0.69, 4.60]
25.1 Higher-income setting 2 2941 Risk Ratio (M-H, Random, 95% CI) 1.78 [0.69, 4.60]25.2 Lower-income setting 0 0 Risk Ratio (M-H, Random, 95% CI) 0.0 [0.0, 0.0]
26 Amount of lochia eitherestimated or measured after 24hours and up to discharge fromhospital
0 0 Mean Difference (IV, Random, 95% CI) 0.0 [0.0, 0.0]
26.1 Higher-income setting 0 0 Mean Difference (IV, Random, 95% CI) 0.0 [0.0, 0.0]26.2 Lower-income setting 0 0 Mean Difference (IV, Random, 95% CI) 0.0 [0.0, 0.0]
27 Surgical evacuation of retainedproducts of conception
2 2941 Risk Ratio (M-H, Random, 95% CI) 0.69 [0.12, 3.98]
27.1 Higher-income setting 2 2941 Risk Ratio (M-H, Random, 95% CI) 0.69 [0.12, 3.98]27.2 Lower-income setting 0 0 Risk Ratio (M-H, Random, 95% CI) 0.0 [0.0, 0.0]
28 Afterpains - abdominal painassociated with the contractinguterus in the postpartumperiod
1 1429 Risk Ratio (M-H, Random, 95% CI) 2.53 [1.34, 4.78]
28.1 Higher-income setting 1 1429 Risk Ratio (M-H, Random, 95% CI) 2.53 [1.34, 4.78]28.2 Lower-income setting 0 0 Risk Ratio (M-H, Random, 95% CI) 0.0 [0.0, 0.0]
69Active versus expectant management for women in the third stage of labour (Review)
Copyright © 2019 The Cochrane Collaboration. Published by John Wiley & Sons, Ltd.

29 Apgar score < 7 at 5 minutes 0 0 Risk Ratio (M-H, Random, 95% CI) 0.0 [0.0, 0.0]29.1 Higher-income setting 0 0 Risk Ratio (M-H, Random, 95% CI) 0.0 [0.0, 0.0]29.2 Lower-income setting 0 0 Risk Ratio (M-H, Random, 95% CI) 0.0 [0.0, 0.0]
30 Birthweight 1 1512 Mean Difference (IV, Random, 95% CI) -67.0 [-114.13, -19.87]
30.1 Higher-income setting 1 1512 Mean Difference (IV, Random, 95% CI) -67.0 [-114.13, -19.87]
30.2 Lower-income setting 0 0 Mean Difference (IV, Random, 95% CI) 0.0 [0.0, 0.0]
31 Neonatal encephalopathyassessed using Sarnat staging(Sarnat 1976; Table 1)
0 0 Risk Ratio (M-H, Random, 95% CI) 0.0 [0.0, 0.0]
31.1 Higher-income setting 0 0 Risk Ratio (M-H, Random, 95% CI) 0.0 [0.0, 0.0]31.2 Lower-income setting 0 0 Risk Ratio (M-H, Random, 95% CI) 0.0 [0.0, 0.0]
32 Neonatal mortality 0 0 Risk Ratio (M-H, Random, 95% CI) 0.0 [0.0, 0.0]32.1 Higher-income setting 0 0 Risk Ratio (M-H, Random, 95% CI) 0.0 [0.0, 0.0]32.2 Lower-income setting 0 0 Risk Ratio (M-H, Random, 95% CI) 0.0 [0.0, 0.0]
33 Intraventricular haemorrhage- Papille grade III/IV - (forinfants born before 34 weeks’gestation only)
0 0 Risk Ratio (M-H, Random, 95% CI) 0.0 [0.0, 0.0]
33.1 Higher-income setting 0 0 Risk Ratio (M-H, Random, 95% CI) 0.0 [0.0, 0.0]33.2 Lower-income setting 0 0 Risk Ratio (M-H, Random, 95% CI) 0.0 [0.0, 0.0]
34 Number of infants exposedto one or more red blood celltransfusions
0 0 Risk Ratio (M-H, Random, 95% CI) 0.0 [0.0, 0.0]
34.1 Higher-income setting 0 0 Risk Ratio (M-H, Random, 95% CI) 0.0 [0.0, 0.0]34.2 Lower-income setting 0 0 Risk Ratio (M-H, Random, 95% CI) 0.0 [0.0, 0.0]
35 Infant Hb level at 24 to 72hours
0 0 Mean Difference (IV, Random, 95% CI) 0.0 [0.0, 0.0]
35.1 Higher-income setting 0 0 Mean Difference (IV, Random, 95% CI) 0.0 [0.0, 0.0]35.2 Lower-income setting 0 0 Mean Difference (IV, Random, 95% CI) 0.0 [0.0, 0.0]
36 Infant Hb level at 3-6 months 0 0 Mean Difference (IV, Random, 95% CI) 0.0 [0.0, 0.0]36.1 Higher-income setting 0 0 Mean Difference (IV, Random, 95% CI) 0.0 [0.0, 0.0]36.2 Lower-income setting 0 0 Mean Difference (IV, Random, 95% CI) 0.0 [0.0, 0.0]
37 Infant iron indices (ferritin) at3 to 6 months.
0 0 Risk Ratio (M-H, Random, 95% CI) 0.0 [0.0, 0.0]
37.1 Higher-income setting 0 0 Risk Ratio (M-H, Random, 95% CI) 0.0 [0.0, 0.0]37.2 Lower-income setting 0 0 Risk Ratio (M-H, Random, 95% CI) 0.0 [0.0, 0.0]
38 Exclusive breastfeeding atdischarge from hospital
0 0 Risk Ratio (M-H, Random, 95% CI) 0.0 [0.0, 0.0]
38.1 Higher-income setting 0 0 Risk Ratio (M-H, Random, 95% CI) 0.0 [0.0, 0.0]38.2 Lower-income setting 0 0 Risk Ratio (M-H, Random, 95% CI) 0.0 [0.0, 0.0]
39 Neurodevelopmental, cognitiveor developmental outcomesassessed after age 18 months
0 0 Risk Ratio (M-H, Random, 95% CI) 0.0 [0.0, 0.0]
39.1 Higher-income setting 0 0 Risk Ratio (M-H, Random, 95% CI) 0.0 [0.0, 0.0]39.2 Lower-income setting 0 0 Risk Ratio (M-H, Random, 95% CI) 0.0 [0.0, 0.0]
40 Return to hospital as in- oroutpatient because of bleeding(not pre-specified)
2 2941 Risk Ratio (M-H, Random, 95% CI) 2.21 [1.29, 3.79]
40.1 Higher-income setting 2 2941 Risk Ratio (M-H, Random, 95% CI) 2.21 [1.29, 3.79]40.2 Lower-income setting 0 0 Risk Ratio (M-H, Random, 95% CI) 0.0 [0.0, 0.0]
70Active versus expectant management for women in the third stage of labour (Review)
Copyright © 2019 The Cochrane Collaboration. Published by John Wiley & Sons, Ltd.

41 Postnatal maternal mean Hb(outcome not pre-specified)
2 2683 Mean Difference (IV, Random, 95% CI) 0.5 [0.41, 0.59]
41.1 Higher-income setting 2 2683 Mean Difference (IV, Random, 95% CI) 0.5 [0.41, 0.59]41.2 Lower-income setting 0 0 Mean Difference (IV, Random, 95% CI) 0.0 [0.0, 0.0]
Comparison 3. Active versus mixed management of 3rd stage (early uterotonic, delayed cord clamping, controlled
cord traction)
Outcome or subgroup titleNo. of
studies
No. of
participants Statistical method Effect size
1 Severe primary PPH at time ofbirth (clinically estimated ormeasured blood loss ≥ 1000mL)
0 0 Risk Ratio (M-H, Random, 95% CI) 0.0 [0.0, 0.0]
1.1 Higher-income setting 0 0 Risk Ratio (M-H, Random, 95% CI) 0.0 [0.0, 0.0]1.2 Lower-income setting 0 0 Risk Ratio (M-H, Random, 95% CI) 0.0 [0.0, 0.0]
2 Very severe primary PPH at timeof birth (clinically estimated ormeasured blood loss ≥ 2500mL)
0 0 Risk Ratio (M-H, Random, 95% CI) 0.0 [0.0, 0.0]
2.1 Higher-income setting 0 0 Risk Ratio (M-H, Random, 95% CI) 0.0 [0.0, 0.0]2.2 Lower-income setting 0 0 Risk Ratio (M-H, Random, 95% CI) 0.0 [0.0, 0.0]
3 Maternal mortality 0 0 Risk Ratio (M-H, Random, 95% CI) 0.0 [0.0, 0.0]3.1 Higher-income setting 0 0 Risk Ratio (M-H, Random, 95% CI) 0.0 [0.0, 0.0]3.2 Lower-income setting 0 0 Risk Ratio (M-H, Random, 95% CI) 0.0 [0.0, 0.0]
4 Maternal Hb < 9 g/dL at 24-72hr
0 0 Risk Ratio (M-H, Random, 95% CI) 0.0 [0.0, 0.0]
4.1 Higher-income setting 0 0 Risk Ratio (M-H, Random, 95% CI) 0.0 [0.0, 0.0]4.2 Lower-income setting 0 0 Risk Ratio (M-H, Random, 95% CI) 0.0 [0.0, 0.0]
5 Admission to neonatal special/intensive care
0 0 Risk Ratio (M-H, Random, 95% CI) 0.0 [0.0, 0.0]
5.1 Higher-income setting 0 0 Risk Ratio (M-H, Random, 95% CI) 0.0 [0.0, 0.0]5.2 Lower-income setting 0 0 Risk Ratio (M-H, Random, 95% CI) 0.0 [0.0, 0.0]
6 Neonatal jaundice requiringphototherapy or exchangetransfusion
0 0 Risk Ratio (M-H, Random, 95% CI) 0.0 [0.0, 0.0]
6.1 Higher-income setting 0 0 Risk Ratio (M-H, Random, 95% CI) 0.0 [0.0, 0.0]6.2 Lower-income setting 0 0 Risk Ratio (M-H, Random, 95% CI) 0.0 [0.0, 0.0]
7 Neonatal polycythaemia treatedwith dilutional exchangetransfusion
0 0 Risk Ratio (M-H, Random, 95% CI) 0.0 [0.0, 0.0]
7.1 Higher-income setting 0 0 Risk Ratio (M-H, Random, 95% CI) 0.0 [0.0, 0.0]7.2 Lower-income setting 0 0 Risk Ratio (M-H, Random, 95% CI) 0.0 [0.0, 0.0]
71Active versus expectant management for women in the third stage of labour (Review)
Copyright © 2019 The Cochrane Collaboration. Published by John Wiley & Sons, Ltd.

Comparison 4. Active versus mixed management of 3rd stage (delayed uterotonic, delayed cord clamping, con-
trolled cord traction)
Outcome or subgroup titleNo. of
studies
No. of
participants Statistical method Effect size
1 Severe primary PPH at time ofbirth (clinically estimated ormeasured blood loss ≥ 1000mL)
0 0 Risk Ratio (M-H, Random, 95% CI) 0.0 [0.0, 0.0]
1.1 Higher-income setting 0 0 Risk Ratio (M-H, Random, 95% CI) 0.0 [0.0, 0.0]1.2 Lower-income setting 0 0 Risk Ratio (M-H, Random, 95% CI) 0.0 [0.0, 0.0]
2 Very severe primary PPH at timeof birth (clinically estimated ormeasured blood loss ≥ 2500mL)
0 0 Risk Ratio (M-H, Random, 95% CI) 0.0 [0.0, 0.0]
2.1 Higher-income setting 0 0 Risk Ratio (M-H, Random, 95% CI) 0.0 [0.0, 0.0]2.2 Lower-income setting 0 0 Risk Ratio (M-H, Random, 95% CI) 0.0 [0.0, 0.0]
3 Maternal mortality 0 0 Risk Ratio (M-H, Random, 95% CI) 0.0 [0.0, 0.0]3.1 Higher-income setting 0 0 Risk Ratio (M-H, Random, 95% CI) 0.0 [0.0, 0.0]3.2 Lower-income setting 0 0 Risk Ratio (M-H, Random, 95% CI) 0.0 [0.0, 0.0]
4 Maternal Hb < 9 g/dL at 24-72hr
0 0 Risk Ratio (M-H, Random, 95% CI) 0.0 [0.0, 0.0]
4.1 Higher-income setting 0 0 Risk Ratio (M-H, Random, 95% CI) 0.0 [0.0, 0.0]4.2 Lower-income setting 0 0 Risk Ratio (M-H, Random, 95% CI) 0.0 [0.0, 0.0]
5 Admission to neonatal special/intensive care
0 0 Risk Ratio (M-H, Random, 95% CI) 0.0 [0.0, 0.0]
5.1 Higher-income setting 0 0 Risk Ratio (M-H, Random, 95% CI) 0.0 [0.0, 0.0]5.2 Lower-income setting 0 0 Risk Ratio (M-H, Random, 95% CI) 0.0 [0.0, 0.0]
6 Neonatal jaundice requiringphototherapy or exchangetransfusion
0 0 Risk Ratio (M-H, Random, 95% CI) 0.0 [0.0, 0.0]
6.1 Higher-income setting 0 0 Risk Ratio (M-H, Random, 95% CI) 0.0 [0.0, 0.0]6.2 Lower-income setting 0 0 Risk Ratio (M-H, Random, 95% CI) 0.0 [0.0, 0.0]
7 Neonatal polycythaemia treatedwith dilutional exchangetransfusion
0 0 Risk Ratio (M-H, Random, 95% CI) 0.0 [0.0, 0.0]
7.1 Higher-income setting 0 0 Risk Ratio (M-H, Random, 95% CI) 0.0 [0.0, 0.0]7.2 Lower-income setting 0 0 Risk Ratio (M-H, Random, 95% CI) 0.0 [0.0, 0.0]
72Active versus expectant management for women in the third stage of labour (Review)
Copyright © 2019 The Cochrane Collaboration. Published by John Wiley & Sons, Ltd.

Comparison 5. Active versus mixed management of 3rd stage (delayed uterotonic, delayed cord clamping, no
controlled cord traction)
Outcome or subgroup titleNo. of
studies
No. of
participants Statistical method Effect size
1 Severe primary PPH at time ofbirth (clinically estimated ormeasured blood loss ≥ 1000mL)
0 0 Risk Ratio (M-H, Random, 95% CI) 0.0 [0.0, 0.0]
1.1 Higher-income setting 0 0 Risk Ratio (M-H, Random, 95% CI) 0.0 [0.0, 0.0]1.2 Lower-income setting 0 0 Risk Ratio (M-H, Random, 95% CI) 0.0 [0.0, 0.0]
2 Very severe primary PPH at timeof birth (clinically estimated ormeasured blood loss ≥ 2500mL)
0 0 Risk Ratio (M-H, Random, 95% CI) 0.0 [0.0, 0.0]
2.1 Higher-income setting 0 0 Risk Ratio (M-H, Random, 95% CI) 0.0 [0.0, 0.0]2.2 Lower-income setting 0 0 Risk Ratio (M-H, Random, 95% CI) 0.0 [0.0, 0.0]
3 Maternal mortality 0 0 Risk Ratio (M-H, Random, 95% CI) 0.0 [0.0, 0.0]3.1 Higher-income setting 0 0 Risk Ratio (M-H, Random, 95% CI) 0.0 [0.0, 0.0]3.2 Lower-income setting 0 0 Risk Ratio (M-H, Random, 95% CI) 0.0 [0.0, 0.0]
4 Maternal Hb < 9 g/dL at 24-72hr
0 0 Risk Ratio (M-H, Random, 95% CI) 0.0 [0.0, 0.0]
4.1 Higher-income setting 0 0 Risk Ratio (M-H, Random, 95% CI) 0.0 [0.0, 0.0]4.2 Lower-income setting 0 0 Risk Ratio (M-H, Random, 95% CI) 0.0 [0.0, 0.0]
5 Admission to neonatal special/intensive care
0 0 Risk Ratio (M-H, Random, 95% CI) 0.0 [0.0, 0.0]
5.1 Higher-income setting 0 0 Risk Ratio (M-H, Random, 95% CI) 0.0 [0.0, 0.0]5.2 Lower-income setting 0 0 Risk Ratio (M-H, Random, 95% CI) 0.0 [0.0, 0.0]
6 Neonatal jaundice requiringphototherapy or exchangetransfusion
0 0 Risk Ratio (M-H, Random, 95% CI) 0.0 [0.0, 0.0]
6.1 Higher-income setting 0 0 Risk Ratio (M-H, Random, 95% CI) 0.0 [0.0, 0.0]6.2 Lower-income setting 0 0 Risk Ratio (M-H, Random, 95% CI) 0.0 [0.0, 0.0]
7 Neonatal polycythaemia treatedwith dilutional exchangetransfusion
0 0 Risk Ratio (M-H, Random, 95% CI) 0.0 [0.0, 0.0]
7.1 Higher-income setting 0 0 Risk Ratio (M-H, Random, 95% CI) 0.0 [0.0, 0.0]7.2 Lower-income setting 0 0 Risk Ratio (M-H, Random, 95% CI) 0.0 [0.0, 0.0]
8 Maternal blood transfusion 1 654 Risk Ratio (M-H, Random, 95% CI) 0.75 [0.17, 3.32]8.1 Higher-income setting 1 654 Risk Ratio (M-H, Random, 95% CI) 0.75 [0.17, 3.32]8.2 Lower-income setting 0 0 Risk Ratio (M-H, Random, 95% CI) 0.0 [0.0, 0.0]
9 Therapeutic uterotonics duringthird stage and/or within 24hours
1 654 Risk Ratio (M-H, Random, 95% CI) 0.9 [0.55, 1.48]
9.1 Higher-income setting 1 654 Risk Ratio (M-H, Random, 95% CI) 0.9 [0.55, 1.48]9.2 Lower-income setting 0 0 Risk Ratio (M-H, Random, 95% CI) 0.0 [0.0, 0.0]
10 Mean length of third stage 1 654 Mean Difference (IV, Random, 95% CI) -5.15 [-5.71, -4.59]10.1 Higher-income setting 1 654 Mean Difference (IV, Random, 95% CI) -5.15 [-5.71, -4.59]10.2 Lower-income setting 0 0 Mean Difference (IV, Random, 95% CI) 0.0 [0.0, 0.0]
73Active versus expectant management for women in the third stage of labour (Review)
Copyright © 2019 The Cochrane Collaboration. Published by John Wiley & Sons, Ltd.

11 Manual removal of placenta asdefined by study authors
1 654 Risk Ratio (M-H, Random, 95% CI) 0.67 [0.11, 3.96]
11.1 Higher-income setting 1 654 Risk Ratio (M-H, Random, 95% CI) 0.67 [0.11, 3.96]11.2 Lower-income setting 0 0 Risk Ratio (M-H, Random, 95% CI) 0.0 [0.0, 0.0]
12 Surgical evacuation of retainedproducts of conception
1 654 Risk Ratio (M-H, Random, 95% CI) 7.0 [0.36, 134.98]
12.1 Higher-income setting 1 654 Risk Ratio (M-H, Random, 95% CI) 7.0 [0.36, 134.98]12.2 Lower-income setting 0 0 Risk Ratio (M-H, Random, 95% CI) 0.0 [0.0, 0.0]
13 Birthweight 1 654 Mean Difference (IV, Random, 95% CI) 68.0 [23.87, 112.13]13.1 Higher-income setting 1 654 Mean Difference (IV, Random, 95% CI) 68.0 [23.87, 112.13]13.2 Lower-income setting 0 0 Mean Difference (IV, Random, 95% CI) 0.0 [0.0, 0.0]
14 Postnatal maternal mean Hb 1 654 Mean Difference (IV, Random, 95% CI) 0.69 [0.58, 0.80]14.1 Higher-income setting 1 654 Mean Difference (IV, Random, 95% CI) 0.69 [0.58, 0.80]14.2 Lower-income setting 0 0 Mean Difference (IV, Random, 95% CI) 0.0 [0.0, 0.0]
Comparison 6. Expectant versus mixed management (early uterotonic, delayed cord clamping, controlled cord
traction)
Outcome or subgroup titleNo. of
studies
No. of
participants Statistical method Effect size
1 Severe primary PPH at time ofbirth (clinically estimated ormeasured blood loss ≥ 1000mL)
0 0 Risk Ratio (M-H, Random, 95% CI) 0.0 [0.0, 0.0]
1.1 Higher-income setting 0 0 Risk Ratio (M-H, Random, 95% CI) 0.0 [0.0, 0.0]1.2 Lower-income setting 0 0 Risk Ratio (M-H, Random, 95% CI) 0.0 [0.0, 0.0]
2 Very severe primary PPH at timeof birth (clinically estimated ormeasured blood loss ≥ 2500mL)
0 0 Risk Ratio (M-H, Random, 95% CI) 0.0 [0.0, 0.0]
2.1 Higher-income setting 0 0 Risk Ratio (M-H, Random, 95% CI) 0.0 [0.0, 0.0]2.2 Lower-income setting 0 0 Risk Ratio (M-H, Random, 95% CI) 0.0 [0.0, 0.0]
3 Maternal mortality 0 0 Risk Ratio (M-H, Random, 95% CI) 0.0 [0.0, 0.0]3.1 Higher-income setting 0 0 Risk Ratio (M-H, Random, 95% CI) 0.0 [0.0, 0.0]3.2 Lower-income setting 0 0 Risk Ratio (M-H, Random, 95% CI) 0.0 [0.0, 0.0]
4 Maternal Hb < 9 g/dL at 24-72hr
0 0 Risk Ratio (M-H, Random, 95% CI) 0.0 [0.0, 0.0]
4.1 Higher-income setting 0 0 Risk Ratio (M-H, Random, 95% CI) 0.0 [0.0, 0.0]4.2 Lower-income setting 0 0 Risk Ratio (M-H, Random, 95% CI) 0.0 [0.0, 0.0]
5 Admission to neonatal special/intensive care
0 0 Risk Ratio (M-H, Random, 95% CI) 0.0 [0.0, 0.0]
5.1 Higher-income setting 0 0 Risk Ratio (M-H, Random, 95% CI) 0.0 [0.0, 0.0]5.2 Lower-income setting 0 0 Risk Ratio (M-H, Random, 95% CI) 0.0 [0.0, 0.0]
6 Neonatal jaundice requiringphototherapy or exchangetransfusion
0 0 Risk Ratio (M-H, Random, 95% CI) 0.0 [0.0, 0.0]
6.1 Higher-income setting 0 0 Risk Ratio (M-H, Random, 95% CI) 0.0 [0.0, 0.0]6.2 Lower-income setting 0 0 Risk Ratio (M-H, Random, 95% CI) 0.0 [0.0, 0.0]
74Active versus expectant management for women in the third stage of labour (Review)
Copyright © 2019 The Cochrane Collaboration. Published by John Wiley & Sons, Ltd.
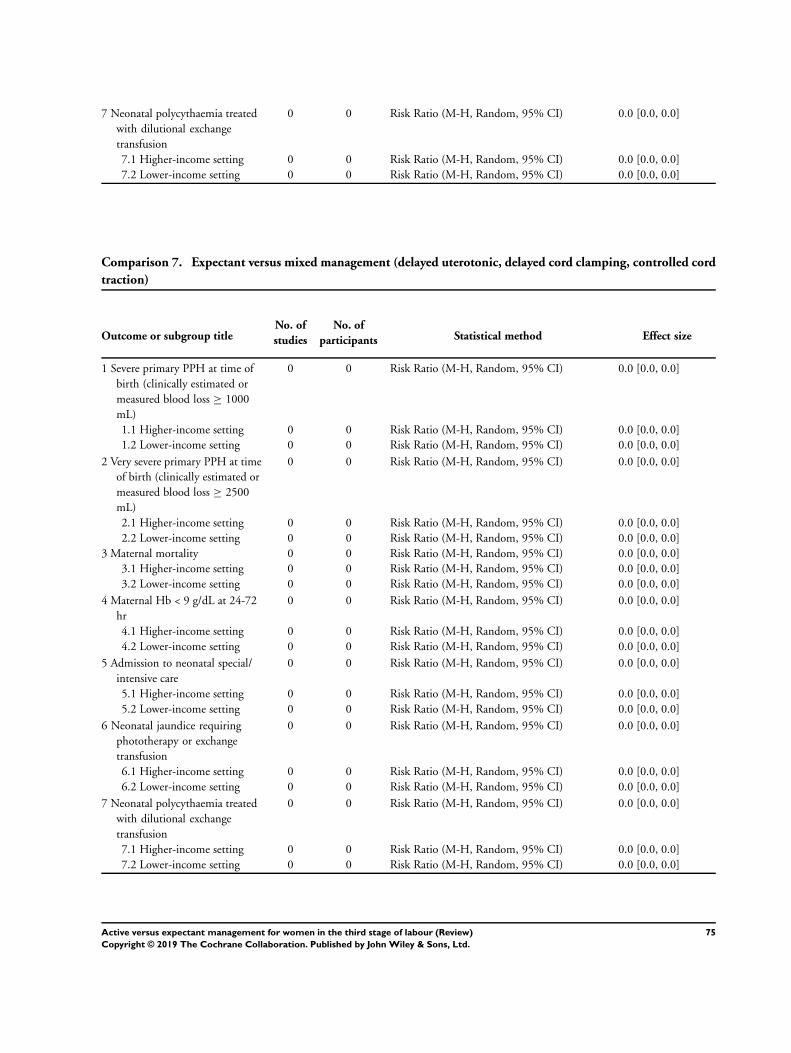
7 Neonatal polycythaemia treatedwith dilutional exchangetransfusion
0 0 Risk Ratio (M-H, Random, 95% CI) 0.0 [0.0, 0.0]
7.1 Higher-income setting 0 0 Risk Ratio (M-H, Random, 95% CI) 0.0 [0.0, 0.0]7.2 Lower-income setting 0 0 Risk Ratio (M-H, Random, 95% CI) 0.0 [0.0, 0.0]
Comparison 7. Expectant versus mixed management (delayed uterotonic, delayed cord clamping, controlled cord
traction)
Outcome or subgroup titleNo. of
studies
No. of
participants Statistical method Effect size
1 Severe primary PPH at time ofbirth (clinically estimated ormeasured blood loss ≥ 1000mL)
0 0 Risk Ratio (M-H, Random, 95% CI) 0.0 [0.0, 0.0]
1.1 Higher-income setting 0 0 Risk Ratio (M-H, Random, 95% CI) 0.0 [0.0, 0.0]1.2 Lower-income setting 0 0 Risk Ratio (M-H, Random, 95% CI) 0.0 [0.0, 0.0]
2 Very severe primary PPH at timeof birth (clinically estimated ormeasured blood loss ≥ 2500mL)
0 0 Risk Ratio (M-H, Random, 95% CI) 0.0 [0.0, 0.0]
2.1 Higher-income setting 0 0 Risk Ratio (M-H, Random, 95% CI) 0.0 [0.0, 0.0]2.2 Lower-income setting 0 0 Risk Ratio (M-H, Random, 95% CI) 0.0 [0.0, 0.0]
3 Maternal mortality 0 0 Risk Ratio (M-H, Random, 95% CI) 0.0 [0.0, 0.0]3.1 Higher-income setting 0 0 Risk Ratio (M-H, Random, 95% CI) 0.0 [0.0, 0.0]3.2 Lower-income setting 0 0 Risk Ratio (M-H, Random, 95% CI) 0.0 [0.0, 0.0]
4 Maternal Hb < 9 g/dL at 24-72hr
0 0 Risk Ratio (M-H, Random, 95% CI) 0.0 [0.0, 0.0]
4.1 Higher-income setting 0 0 Risk Ratio (M-H, Random, 95% CI) 0.0 [0.0, 0.0]4.2 Lower-income setting 0 0 Risk Ratio (M-H, Random, 95% CI) 0.0 [0.0, 0.0]
5 Admission to neonatal special/intensive care
0 0 Risk Ratio (M-H, Random, 95% CI) 0.0 [0.0, 0.0]
5.1 Higher-income setting 0 0 Risk Ratio (M-H, Random, 95% CI) 0.0 [0.0, 0.0]5.2 Lower-income setting 0 0 Risk Ratio (M-H, Random, 95% CI) 0.0 [0.0, 0.0]
6 Neonatal jaundice requiringphototherapy or exchangetransfusion
0 0 Risk Ratio (M-H, Random, 95% CI) 0.0 [0.0, 0.0]
6.1 Higher-income setting 0 0 Risk Ratio (M-H, Random, 95% CI) 0.0 [0.0, 0.0]6.2 Lower-income setting 0 0 Risk Ratio (M-H, Random, 95% CI) 0.0 [0.0, 0.0]
7 Neonatal polycythaemia treatedwith dilutional exchangetransfusion
0 0 Risk Ratio (M-H, Random, 95% CI) 0.0 [0.0, 0.0]
7.1 Higher-income setting 0 0 Risk Ratio (M-H, Random, 95% CI) 0.0 [0.0, 0.0]7.2 Lower-income setting 0 0 Risk Ratio (M-H, Random, 95% CI) 0.0 [0.0, 0.0]
75Active versus expectant management for women in the third stage of labour (Review)
Copyright © 2019 The Cochrane Collaboration. Published by John Wiley & Sons, Ltd.

Comparison 8. Expectant versus mixed management (delayed uterotonic, delayed cord clamping, no controlled
cord traction)
Outcome or subgroup titleNo. of
studies
No. of
participants Statistical method Effect size
1 Severe primary PPH at time ofbirth (clinically estimated ormeasured blood loss ≥ 1000mL)
0 0 Risk Ratio (M-H, Random, 95% CI) 0.0 [0.0, 0.0]
1.1 Higher-income setting 0 0 Risk Ratio (M-H, Random, 95% CI) 0.0 [0.0, 0.0]1.2 Lower-income setting 0 0 Risk Ratio (M-H, Random, 95% CI) 0.0 [0.0, 0.0]
2 Very severe primary PPH at timeof birth (clinically estimated ormeasured blood loss ≥ 2500mL)
0 0 Risk Ratio (M-H, Random, 95% CI) 0.0 [0.0, 0.0]
2.1 Higher-income setting 0 0 Risk Ratio (M-H, Random, 95% CI) 0.0 [0.0, 0.0]2.2 Lower-income setting 0 0 Risk Ratio (M-H, Random, 95% CI) 0.0 [0.0, 0.0]
3 Maternal mortality 0 0 Risk Ratio (M-H, Random, 95% CI) 0.0 [0.0, 0.0]3.1 Higher-income setting 0 0 Risk Ratio (M-H, Random, 95% CI) 0.0 [0.0, 0.0]3.2 Lower-income setting 0 0 Risk Ratio (M-H, Random, 95% CI) 0.0 [0.0, 0.0]
4 Maternal Hb < 9 g/dL at 24-72hr
0 0 Risk Ratio (M-H, Random, 95% CI) 0.0 [0.0, 0.0]
4.1 Higher-income setting 0 0 Risk Ratio (M-H, Random, 95% CI) 0.0 [0.0, 0.0]4.2 Lower-income setting 0 0 Risk Ratio (M-H, Random, 95% CI) 0.0 [0.0, 0.0]
5 Admission to neonatal special/intensive care
0 0 Risk Ratio (M-H, Random, 95% CI) 0.0 [0.0, 0.0]
5.1 Higher-income setting 0 0 Risk Ratio (M-H, Random, 95% CI) 0.0 [0.0, 0.0]5.2 Lower-income setting 0 0 Risk Ratio (M-H, Random, 95% CI) 0.0 [0.0, 0.0]
6 Neonatal jaundice requiringphototherapy or exchangetransfusion
0 0 Risk Ratio (M-H, Random, 95% CI) 0.0 [0.0, 0.0]
6.1 Higher-income setting 0 0 Risk Ratio (M-H, Random, 95% CI) 0.0 [0.0, 0.0]6.2 Lower-income setting 0 0 Risk Ratio (M-H, Random, 95% CI) 0.0 [0.0, 0.0]
7 Neonatal polycythaemia treatedwith dilutional exchangetransfusion
0 0 Risk Ratio (M-H, Random, 95% CI) 0.0 [0.0, 0.0]
7.1 Higher-income setting 0 0 Risk Ratio (M-H, Random, 95% CI) 0.0 [0.0, 0.0]7.2 Lower-income setting 0 0 Risk Ratio (M-H, Random, 95% CI) 0.0 [0.0, 0.0]
76Active versus expectant management for women in the third stage of labour (Review)
Copyright © 2019 The Cochrane Collaboration. Published by John Wiley & Sons, Ltd.

Comparison 9. Active versus mixed management (uterotonic after placental delivery, immediate cord clamping
and no controlled cord traction)
Outcome or subgroup titleNo. of
studies
No. of
participants Statistical method Effect size
1 Severe primary PPH at time ofbirth (clinically estimated ormeasured blood loss ≥ 1000mL)
1 1648 Risk Ratio (M-H, Random, 95% CI) 0.23 [0.09, 0.55]
1.1 Higher-income setting 1 1648 Risk Ratio (M-H, Random, 95% CI) 0.23 [0.09, 0.55]1.2 Lower-income setting 0 0 Risk Ratio (M-H, Random, 95% CI) 0.0 [0.0, 0.0]
2 Very severe primary PPH at timeof birth (clinically estimated ormeasured blood loss ≥ 2500mL)
0 0 Risk Ratio (M-H, Random, 95% CI) 0.0 [0.0, 0.0]
2.1 Higher-income setting 0 0 Risk Ratio (M-H, Random, 95% CI) 0.0 [0.0, 0.0]2.2 Lower-income setting 0 0 Risk Ratio (M-H, Random, 95% CI) 0.0 [0.0, 0.0]
3 Maternal mortality 0 0 Risk Ratio (M-H, Random, 95% CI) 0.0 [0.0, 0.0]3.1 Higher-income setting 0 0 Risk Ratio (M-H, Random, 95% CI) 0.0 [0.0, 0.0]3.2 Lower-income setting 0 0 Risk Ratio (M-H, Random, 95% CI) 0.0 [0.0, 0.0]
4 Maternal Hb < 9 g/dL at 24-72hr
0 0 Risk Ratio (M-H, Random, 95% CI) 0.0 [0.0, 0.0]
4.1 Higher-income setting 0 0 Risk Ratio (M-H, Random, 95% CI) 0.0 [0.0, 0.0]4.2 Lower-income setting 0 0 Risk Ratio (M-H, Random, 95% CI) 0.0 [0.0, 0.0]
5 Admission to neonatal special/intensive care
0 0 Risk Ratio (M-H, Random, 95% CI) 0.0 [0.0, 0.0]
5.1 Higher-income setting 0 0 Risk Ratio (M-H, Random, 95% CI) 0.0 [0.0, 0.0]5.2 Lower-income setting 0 0 Risk Ratio (M-H, Random, 95% CI) 0.0 [0.0, 0.0]
6 Neonatal jaundice requiringphototherapy or exchangetransfusion
0 0 Risk Ratio (M-H, Random, 95% CI) 0.0 [0.0, 0.0]
6.1 Higher-income setting 0 0 Risk Ratio (M-H, Random, 95% CI) 0.0 [0.0, 0.0]6.2 Lower-income setting 0 0 Risk Ratio (M-H, Random, 95% CI) 0.0 [0.0, 0.0]
7 Neonatal polycythaemia treatedwith dilutional exchangetransfusion
0 0 Risk Ratio (M-H, Random, 95% CI) 0.0 [0.0, 0.0]
7.1 Higher-income setting 0 0 Risk Ratio (M-H, Random, 95% CI) 0.0 [0.0, 0.0]7.2 Lower-income setting 0 0 Risk Ratio (M-H, Random, 95% CI) 0.0 [0.0, 0.0]
8 Severe primary PPH afterplacental delivery and up to 24hours (clinically estimated ormeasured blood loss ≥ 1000mL)
0 0 Risk Ratio (M-H, Random, 95% CI) 0.0 [0.0, 0.0]
8.1 Higher-income setting 0 0 Risk Ratio (M-H, Random, 95% CI) 0.0 [0.0, 0.0]8.2 Lower-income setting 0 0 Risk Ratio (M-H, Random, 95% CI) 0.0 [0.0, 0.0]
9 Severe primary PPH at timeof birth and up to 24 hours(clinically estimated ormeasured blood loss ≥1000mL)
0 0 Risk Ratio (M-H, Random, 95% CI) 0.0 [0.0, 0.0]
77Active versus expectant management for women in the third stage of labour (Review)
Copyright © 2019 The Cochrane Collaboration. Published by John Wiley & Sons, Ltd.

9.1 Higher-income setting 0 0 Risk Ratio (M-H, Random, 95% CI) 0.0 [0.0, 0.0]9.2 Lower-income setting 0 0 Risk Ratio (M-H, Random, 95% CI) 0.0 [0.0, 0.0]
10 Primary blood loss ≥ 500mL at time of birth (clinicallyestimated or measured)
1 1648 Risk Ratio (M-H, Random, 95% CI) 0.53 [0.38, 0.74]
10.1 Higher-income setting 1 1648 Risk Ratio (M-H, Random, 95% CI) 0.53 [0.38, 0.74]10.2 Lower-income setting 0 0 Risk Ratio (M-H, Random, 95% CI) 0.0 [0.0, 0.0]
11 Primary blood loss ≥ 500mL after delivery of placentaand up to 24 hours (clinicallyestimated or measured)
0 0 Risk Ratio (M-H, Random, 95% CI) 0.0 [0.0, 0.0]
11.1 Higher-income setting 0 0 Risk Ratio (M-H, Random, 95% CI) 0.0 [0.0, 0.0]11.2 Lower-income setting 0 0 Risk Ratio (M-H, Random, 95% CI) 0.0 [0.0, 0.0]
12 Primary blood loss ≥ 500 mLat time of birth and up to 24hours (clinically estimated ormeasured)
0 0 Risk Ratio (M-H, Random, 95% CI) 0.0 [0.0, 0.0]
12.1 Higher-income setting 0 0 Risk Ratio (M-H, Random, 95% CI) 0.0 [0.0, 0.0]12.2 Lower-income setting 0 0 Risk Ratio (M-H, Random, 95% CI) 0.0 [0.0, 0.0]
13 Mean maternal blood loss(mL) at time of birth (clinicallyestimated or measured)
0 0 Mean Difference (IV, Random, 95% CI) 0.0 [0.0, 0.0]
13.1 Higher-income setting 0 0 Mean Difference (IV, Random, 95% CI) 0.0 [0.0, 0.0]13.2 Lower-income setting 0 0 Mean Difference (IV, Random, 95% CI) 0.0 [0.0, 0.0]
14 Mean maternal blood loss(mL) after delivery of placentaand up to 24 hours (clinicallyestimated or measured)
0 0 Mean Difference (IV, Random, 95% CI) 0.0 [0.0, 0.0]
14.1 Higher-income setting 0 0 Mean Difference (IV, Random, 95% CI) 0.0 [0.0, 0.0]14.2 Lower-income setting 0 0 Mean Difference (IV, Random, 95% CI) 0.0 [0.0, 0.0]
15 Mean maternal blood loss (mL)at time of birth and up to 24hours (clinically estimated ormeasured)
0 0 Mean Difference (IV, Random, 95% CI) 0.0 [0.0, 0.0]
15.1 Higher-income setting 0 0 Mean Difference (IV, Random, 95% CI) 0.0 [0.0, 0.0]15.2 Lower-income setting 0 0 Mean Difference (IV, Random, 95% CI) 0.0 [0.0, 0.0]
16 Maternal blood transfusion 1 1648 Risk Ratio (M-H, Random, 95% CI) 0.25 [0.03, 2.22]16.1 Higher-income setting 1 1648 Risk Ratio (M-H, Random, 95% CI) 0.25 [0.03, 2.22]16.2 Lower-income setting 0 0 Risk Ratio (M-H, Random, 95% CI) 0.0 [0.0, 0.0]
17 Clinical signs of severe bloodloss
1 1648 Risk Ratio (M-H, Random, 95% CI) 0.25 [0.05, 1.17]
17.1 Higher-income setting 1 1648 Risk Ratio (M-H, Random, 95% CI) 0.25 [0.05, 1.17]17.2 Lower-income setting 0 0 Risk Ratio (M-H, Random, 95% CI) 0.0 [0.0, 0.0]
18 Therapeutic uterotonics duringthird stage and/or within 24hours
1 1648 Risk Ratio (M-H, Random, 95% CI) 0.45 [0.26, 0.77]
18.1 Higher-income setting 1 1648 Risk Ratio (M-H, Random, 95% CI) 0.45 [0.26, 0.77]18.2 Lower-income setting 0 0 Risk Ratio (M-H, Random, 95% CI) 0.0 [0.0, 0.0]
19 Mean length of third stage 1 1648 Mean Difference (IV, Random, 95% CI) -10.0 [-10.24, -9.76]19.1 Higher-income setting 1 1648 Mean Difference (IV, Random, 95% CI) -10.0 [-10.24, -9.76]19.2 Lower-income setting 0 0 Mean Difference (IV, Random, 95% CI) 0.0 [0.0, 0.0]
78Active versus expectant management for women in the third stage of labour (Review)
Copyright © 2019 The Cochrane Collaboration. Published by John Wiley & Sons, Ltd.

20 Manual removal of placenta asdefined by study authors
0 0 Risk Ratio (M-H, Random, 95% CI) 0.0 [0.0, 0.0]
20.1 Higher-income setting 0 0 Risk Ratio (M-H, Random, 95% CI) 0.0 [0.0, 0.0]20.2 Lower-income setting 0 0 Risk Ratio (M-H, Random, 95% CI) 0.0 [0.0, 0.0]
21 Postnatal diastolic bloodpressure > 90 mmHg betweenbirth of baby and dischargefrom the labour ward
0 0 Risk Ratio (M-H, Random, 95% CI) 0.0 [0.0, 0.0]
21.1 Higher-income setting 0 0 Risk Ratio (M-H, Random, 95% CI) 0.0 [0.0, 0.0]21.2 Lower-income setting 0 0 Risk Ratio (M-H, Random, 95% CI) 0.0 [0.0, 0.0]
22 Postnatal vomiting betweenbirth of baby and dischargefrom the labour ward
0 0 Risk Ratio (M-H, Random, 95% CI) 0.0 [0.0, 0.0]
22.1 Higher-income setting 0 0 Risk Ratio (M-H, Random, 95% CI) 0.0 [0.0, 0.0]22.2 Lower-income setting 0 0 Risk Ratio (M-H, Random, 95% CI) 0.0 [0.0, 0.0]
23 Any analgesia between birth ofthe baby and discharge fromlabour ward
0 0 Risk Ratio (M-H, Random, 95% CI) 0.0 [0.0, 0.0]
23.1 Higher-income setting 0 0 Risk Ratio (M-H, Random, 95% CI) 0.0 [0.0, 0.0]23.2 Lower-income setting 0 0 Risk Ratio (M-H, Random, 95% CI) 0.0 [0.0, 0.0]
24 Women’s assessment of painduring third stage as reportedby study authors
0 0 Risk Ratio (M-H, Random, 95% CI) 0.0 [0.0, 0.0]
24.1 Higher-income setting 0 0 Risk Ratio (M-H, Random, 95% CI) 0.0 [0.0, 0.0]24.2 Lower-income setting 0 0 Risk Ratio (M-H, Random, 95% CI) 0.0 [0.0, 0.0]
25 Secondary blood loss/anyvaginal bleeding needingtreatment (after 24 hours andup to 6 weeks)
0 0 Risk Ratio (M-H, Random, 95% CI) 0.0 [0.0, 0.0]
25.1 Higher-income setting 0 0 Risk Ratio (M-H, Random, 95% CI) 0.0 [0.0, 0.0]25.2 Lower-income setting 0 0 Risk Ratio (M-H, Random, 95% CI) 0.0 [0.0, 0.0]
26 Amount of lochia eitherestimated or measured after 24hours and up to discharge fromhospital
0 0 Mean Difference (IV, Random, 95% CI) 0.0 [0.0, 0.0]
26.1 Higher-income setting 0 0 Mean Difference (IV, Random, 95% CI) 0.0 [0.0, 0.0]26.2 Lower-income setting 0 0 Mean Difference (IV, Random, 95% CI) 0.0 [0.0, 0.0]
27 Surgical evacuation of retainedproducts of conception
0 0 Risk Ratio (M-H, Random, 95% CI) 0.0 [0.0, 0.0]
27.1 Higher-income setting 0 0 Risk Ratio (M-H, Random, 95% CI) 0.0 [0.0, 0.0]27.2 Lower-income setting 0 0 Risk Ratio (M-H, Random, 95% CI) 0.0 [0.0, 0.0]
28 Afterpains - abdominal painassociated with the contractinguterus in the postpartumperiod
0 0 Risk Ratio (M-H, Random, 95% CI) 0.0 [0.0, 0.0]
28.1 Higher-income setting 0 0 Risk Ratio (M-H, Random, 95% CI) 0.0 [0.0, 0.0]28.2 Lower-income setting 0 0 Risk Ratio (M-H, Random, 95% CI) 0.0 [0.0, 0.0]
29 Apgar score < 7 at 5 minutes 0 0 Risk Ratio (M-H, Random, 95% CI) 0.0 [0.0, 0.0]29.1 Higher-income setting 0 0 Risk Ratio (M-H, Random, 95% CI) 0.0 [0.0, 0.0]29.2 Lower-income setting 0 0 Risk Ratio (M-H, Random, 95% CI) 0.0 [0.0, 0.0]
30 Birthweight 0 0 Mean Difference (IV, Random, 95% CI) 0.0 [0.0, 0.0]30.1 Higher-income setting 0 0 Mean Difference (IV, Random, 95% CI) 0.0 [0.0, 0.0]
79Active versus expectant management for women in the third stage of labour (Review)
Copyright © 2019 The Cochrane Collaboration. Published by John Wiley & Sons, Ltd.
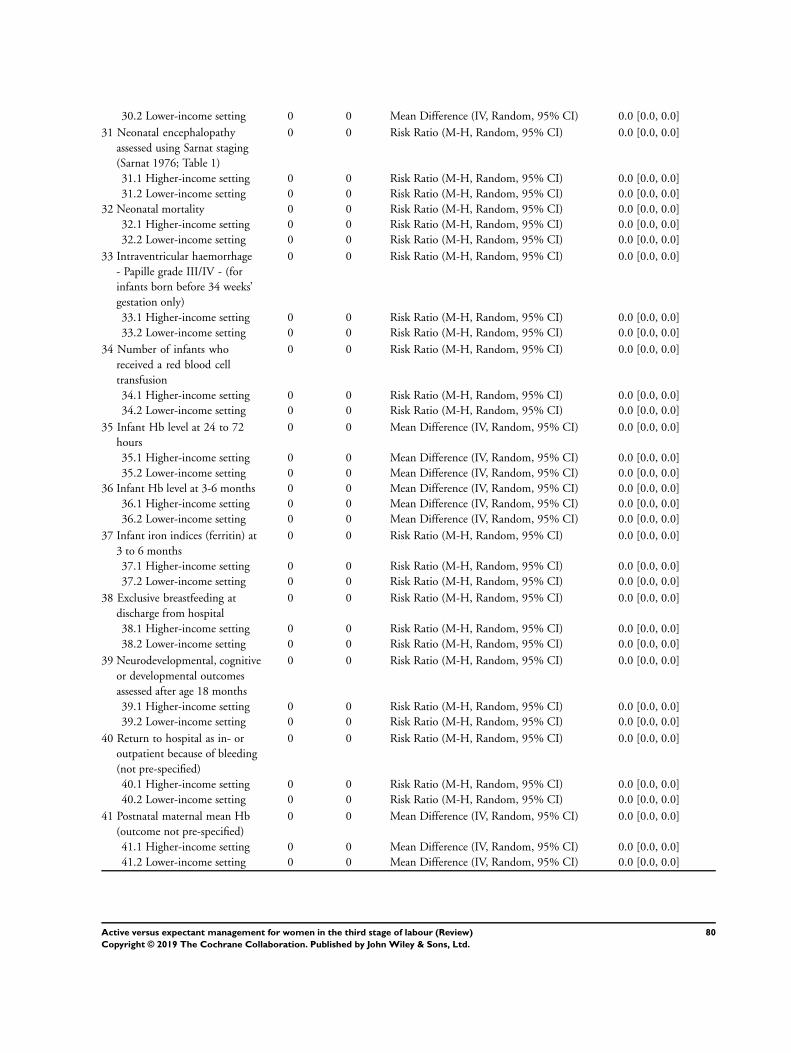
30.2 Lower-income setting 0 0 Mean Difference (IV, Random, 95% CI) 0.0 [0.0, 0.0]
31 Neonatal encephalopathyassessed using Sarnat staging(Sarnat 1976; Table 1)
0 0 Risk Ratio (M-H, Random, 95% CI) 0.0 [0.0, 0.0]
31.1 Higher-income setting 0 0 Risk Ratio (M-H, Random, 95% CI) 0.0 [0.0, 0.0]31.2 Lower-income setting 0 0 Risk Ratio (M-H, Random, 95% CI) 0.0 [0.0, 0.0]
32 Neonatal mortality 0 0 Risk Ratio (M-H, Random, 95% CI) 0.0 [0.0, 0.0]32.1 Higher-income setting 0 0 Risk Ratio (M-H, Random, 95% CI) 0.0 [0.0, 0.0]32.2 Lower-income setting 0 0 Risk Ratio (M-H, Random, 95% CI) 0.0 [0.0, 0.0]
33 Intraventricular haemorrhage- Papille grade III/IV - (forinfants born before 34 weeks’gestation only)
0 0 Risk Ratio (M-H, Random, 95% CI) 0.0 [0.0, 0.0]
33.1 Higher-income setting 0 0 Risk Ratio (M-H, Random, 95% CI) 0.0 [0.0, 0.0]33.2 Lower-income setting 0 0 Risk Ratio (M-H, Random, 95% CI) 0.0 [0.0, 0.0]
34 Number of infants whoreceived a red blood celltransfusion
0 0 Risk Ratio (M-H, Random, 95% CI) 0.0 [0.0, 0.0]
34.1 Higher-income setting 0 0 Risk Ratio (M-H, Random, 95% CI) 0.0 [0.0, 0.0]34.2 Lower-income setting 0 0 Risk Ratio (M-H, Random, 95% CI) 0.0 [0.0, 0.0]
35 Infant Hb level at 24 to 72hours
0 0 Mean Difference (IV, Random, 95% CI) 0.0 [0.0, 0.0]
35.1 Higher-income setting 0 0 Mean Difference (IV, Random, 95% CI) 0.0 [0.0, 0.0]35.2 Lower-income setting 0 0 Mean Difference (IV, Random, 95% CI) 0.0 [0.0, 0.0]
36 Infant Hb level at 3-6 months 0 0 Mean Difference (IV, Random, 95% CI) 0.0 [0.0, 0.0]36.1 Higher-income setting 0 0 Mean Difference (IV, Random, 95% CI) 0.0 [0.0, 0.0]36.2 Lower-income setting 0 0 Mean Difference (IV, Random, 95% CI) 0.0 [0.0, 0.0]
37 Infant iron indices (ferritin) at3 to 6 months
0 0 Risk Ratio (M-H, Random, 95% CI) 0.0 [0.0, 0.0]
37.1 Higher-income setting 0 0 Risk Ratio (M-H, Random, 95% CI) 0.0 [0.0, 0.0]37.2 Lower-income setting 0 0 Risk Ratio (M-H, Random, 95% CI) 0.0 [0.0, 0.0]
38 Exclusive breastfeeding atdischarge from hospital
0 0 Risk Ratio (M-H, Random, 95% CI) 0.0 [0.0, 0.0]
38.1 Higher-income setting 0 0 Risk Ratio (M-H, Random, 95% CI) 0.0 [0.0, 0.0]38.2 Lower-income setting 0 0 Risk Ratio (M-H, Random, 95% CI) 0.0 [0.0, 0.0]
39 Neurodevelopmental, cognitiveor developmental outcomesassessed after age 18 months
0 0 Risk Ratio (M-H, Random, 95% CI) 0.0 [0.0, 0.0]
39.1 Higher-income setting 0 0 Risk Ratio (M-H, Random, 95% CI) 0.0 [0.0, 0.0]39.2 Lower-income setting 0 0 Risk Ratio (M-H, Random, 95% CI) 0.0 [0.0, 0.0]
40 Return to hospital as in- oroutpatient because of bleeding(not pre-specified)
0 0 Risk Ratio (M-H, Random, 95% CI) 0.0 [0.0, 0.0]
40.1 Higher-income setting 0 0 Risk Ratio (M-H, Random, 95% CI) 0.0 [0.0, 0.0]40.2 Lower-income setting 0 0 Risk Ratio (M-H, Random, 95% CI) 0.0 [0.0, 0.0]
41 Postnatal maternal mean Hb(outcome not pre-specified)
0 0 Mean Difference (IV, Random, 95% CI) 0.0 [0.0, 0.0]
41.1 Higher-income setting 0 0 Mean Difference (IV, Random, 95% CI) 0.0 [0.0, 0.0]41.2 Lower-income setting 0 0 Mean Difference (IV, Random, 95% CI) 0.0 [0.0, 0.0]
80Active versus expectant management for women in the third stage of labour (Review)
Copyright © 2019 The Cochrane Collaboration. Published by John Wiley & Sons, Ltd.
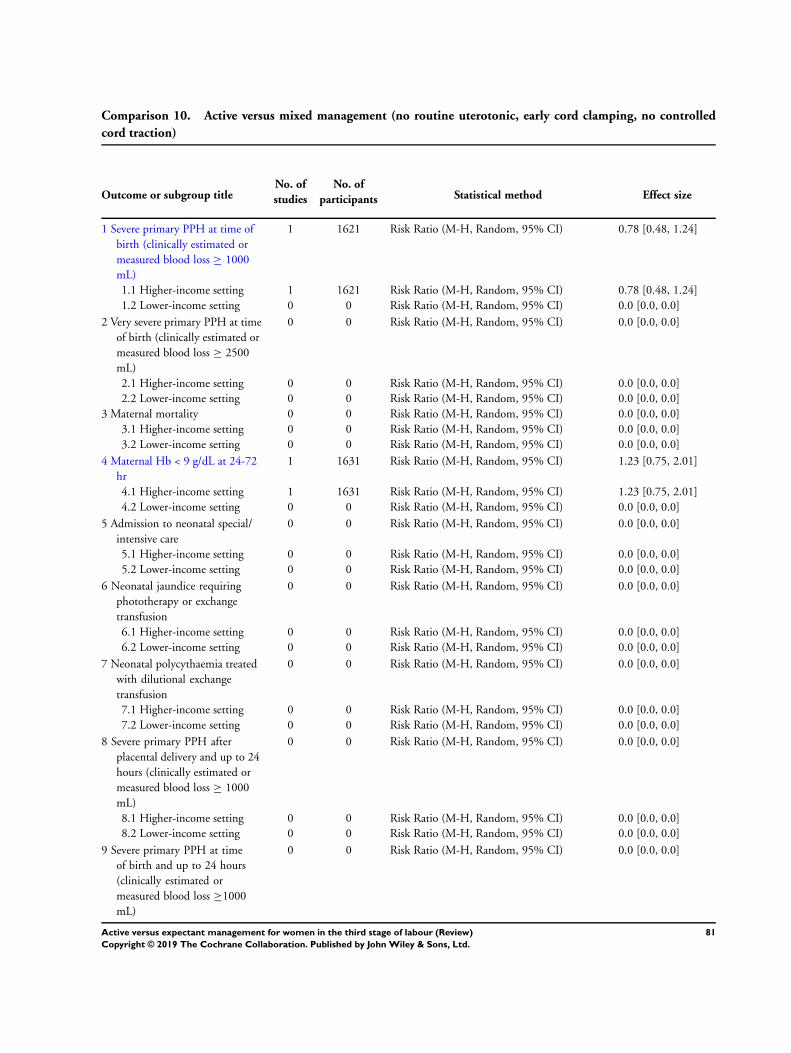
Comparison 10. Active versus mixed management (no routine uterotonic, early cord clamping, no controlled
cord traction)
Outcome or subgroup titleNo. of
studies
No. of
participants Statistical method Effect size
1 Severe primary PPH at time ofbirth (clinically estimated ormeasured blood loss ≥ 1000mL)
1 1621 Risk Ratio (M-H, Random, 95% CI) 0.78 [0.48, 1.24]
1.1 Higher-income setting 1 1621 Risk Ratio (M-H, Random, 95% CI) 0.78 [0.48, 1.24]1.2 Lower-income setting 0 0 Risk Ratio (M-H, Random, 95% CI) 0.0 [0.0, 0.0]
2 Very severe primary PPH at timeof birth (clinically estimated ormeasured blood loss ≥ 2500mL)
0 0 Risk Ratio (M-H, Random, 95% CI) 0.0 [0.0, 0.0]
2.1 Higher-income setting 0 0 Risk Ratio (M-H, Random, 95% CI) 0.0 [0.0, 0.0]2.2 Lower-income setting 0 0 Risk Ratio (M-H, Random, 95% CI) 0.0 [0.0, 0.0]
3 Maternal mortality 0 0 Risk Ratio (M-H, Random, 95% CI) 0.0 [0.0, 0.0]3.1 Higher-income setting 0 0 Risk Ratio (M-H, Random, 95% CI) 0.0 [0.0, 0.0]3.2 Lower-income setting 0 0 Risk Ratio (M-H, Random, 95% CI) 0.0 [0.0, 0.0]
4 Maternal Hb < 9 g/dL at 24-72hr
1 1631 Risk Ratio (M-H, Random, 95% CI) 1.23 [0.75, 2.01]
4.1 Higher-income setting 1 1631 Risk Ratio (M-H, Random, 95% CI) 1.23 [0.75, 2.01]4.2 Lower-income setting 0 0 Risk Ratio (M-H, Random, 95% CI) 0.0 [0.0, 0.0]
5 Admission to neonatal special/intensive care
0 0 Risk Ratio (M-H, Random, 95% CI) 0.0 [0.0, 0.0]
5.1 Higher-income setting 0 0 Risk Ratio (M-H, Random, 95% CI) 0.0 [0.0, 0.0]5.2 Lower-income setting 0 0 Risk Ratio (M-H, Random, 95% CI) 0.0 [0.0, 0.0]
6 Neonatal jaundice requiringphototherapy or exchangetransfusion
0 0 Risk Ratio (M-H, Random, 95% CI) 0.0 [0.0, 0.0]
6.1 Higher-income setting 0 0 Risk Ratio (M-H, Random, 95% CI) 0.0 [0.0, 0.0]6.2 Lower-income setting 0 0 Risk Ratio (M-H, Random, 95% CI) 0.0 [0.0, 0.0]
7 Neonatal polycythaemia treatedwith dilutional exchangetransfusion
0 0 Risk Ratio (M-H, Random, 95% CI) 0.0 [0.0, 0.0]
7.1 Higher-income setting 0 0 Risk Ratio (M-H, Random, 95% CI) 0.0 [0.0, 0.0]7.2 Lower-income setting 0 0 Risk Ratio (M-H, Random, 95% CI) 0.0 [0.0, 0.0]
8 Severe primary PPH afterplacental delivery and up to 24hours (clinically estimated ormeasured blood loss ≥ 1000mL)
0 0 Risk Ratio (M-H, Random, 95% CI) 0.0 [0.0, 0.0]
8.1 Higher-income setting 0 0 Risk Ratio (M-H, Random, 95% CI) 0.0 [0.0, 0.0]8.2 Lower-income setting 0 0 Risk Ratio (M-H, Random, 95% CI) 0.0 [0.0, 0.0]
9 Severe primary PPH at timeof birth and up to 24 hours(clinically estimated ormeasured blood loss ≥1000mL)
0 0 Risk Ratio (M-H, Random, 95% CI) 0.0 [0.0, 0.0]
81Active versus expectant management for women in the third stage of labour (Review)
Copyright © 2019 The Cochrane Collaboration. Published by John Wiley & Sons, Ltd.

9.1 Higher-income setting 0 0 Risk Ratio (M-H, Random, 95% CI) 0.0 [0.0, 0.0]9.2 Lower-income setting 0 0 Risk Ratio (M-H, Random, 95% CI) 0.0 [0.0, 0.0]
10 Primary blood loss ≥ 500mL at time of birth (clinicallyestimated or measured)
1 1621 Risk Ratio (M-H, Random, 95% CI) 0.51 [0.40, 0.66]
10.1 Higher-income setting 1 1621 Risk Ratio (M-H, Random, 95% CI) 0.51 [0.40, 0.66]10.2 Lower-income setting 0 0 Risk Ratio (M-H, Random, 95% CI) 0.0 [0.0, 0.0]
11 Primary blood loss ≥ 500mL after delivery of placentaand up to 24 hours (clinicallyestimated or measured)
0 0 Risk Ratio (M-H, Random, 95% CI) 0.0 [0.0, 0.0]
11.1 Higher-income setting 0 0 Risk Ratio (M-H, Random, 95% CI) 0.0 [0.0, 0.0]11.2 Lower-income setting 0 0 Risk Ratio (M-H, Random, 95% CI) 0.0 [0.0, 0.0]
12 Primary blood loss ≥ 500 mLat time of birth and up to 24hours (clinically estimated ormeasured)
0 0 Risk Ratio (M-H, Random, 95% CI) 0.0 [0.0, 0.0]
12.1 Higher-income setting 0 0 Risk Ratio (M-H, Random, 95% CI) 0.0 [0.0, 0.0]12.2 Lower-income setting 0 0 Risk Ratio (M-H, Random, 95% CI) 0.0 [0.0, 0.0]
13 Mean maternal blood loss(mL) at time of birth (clinicallyestimated or measured)
1 1621 Mean Difference (IV, Random, 95% CI) -94.0 [-126.57, -61.43]
13.1 Higher-income setting 1 1621 Mean Difference (IV, Random, 95% CI) -94.0 [-126.57, -61.43]
13.2 Lower-income setting 0 0 Mean Difference (IV, Random, 95% CI) 0.0 [0.0, 0.0]
14 Mean maternal blood loss(mL) after delivery of placentaand up to 24 hours (clinicallyestimated or measured)
0 0 Mean Difference (IV, Random, 95% CI) 0.0 [0.0, 0.0]
14.1 Higher-income setting 0 0 Mean Difference (IV, Random, 95% CI) 0.0 [0.0, 0.0]14.2 Lower-income setting 0 0 Mean Difference (IV, Random, 95% CI) 0.0 [0.0, 0.0]
15 Mean maternal blood loss (mL)at time of birth and up to 24hours (clinically estimated ormeasured)
0 0 Mean Difference (IV, Random, 95% CI) 0.0 [0.0, 0.0]
15.1 Higher-income setting 0 0 Mean Difference (IV, Random, 95% CI) 0.0 [0.0, 0.0]15.2 Lower-income setting 0 0 Mean Difference (IV, Random, 95% CI) 0.0 [0.0, 0.0]
16 Maternal blood transfusion 1 1631 Risk Ratio (M-H, Random, 95% CI) 0.79 [0.43, 1.46]16.1 Higher-income setting 1 1631 Risk Ratio (M-H, Random, 95% CI) 0.79 [0.43, 1.46]16.2 Lower-income setting 0 0 Risk Ratio (M-H, Random, 95% CI) 0.0 [0.0, 0.0]
17 Clinical signs of severe bloodloss
0 0 Risk Ratio (M-H, Random, 95% CI) 0.0 [0.0, 0.0]
17.1 Higher-income setting 0 0 Risk Ratio (M-H, Random, 95% CI) 0.0 [0.0, 0.0]17.2 Lower-income setting 0 0 Risk Ratio (M-H, Random, 95% CI) 0.0 [0.0, 0.0]
18 Therapeutic uterotonics duringthird stage and/or within 24hours
1 1631 Risk Ratio (M-H, Random, 95% CI) 0.39 [0.33, 0.48]
18.1 Higher-income setting 1 1631 Risk Ratio (M-H, Random, 95% CI) 0.39 [0.33, 0.48]18.2 Lower-income setting 0 0 Risk Ratio (M-H, Random, 95% CI) 0.0 [0.0, 0.0]
19 Mean length of third stage 1 1631 Mean Difference (IV, Random, 95% CI) -1.60 [-3.08, -0.12]19.1 Higher-income setting 1 1631 Mean Difference (IV, Random, 95% CI) -1.60 [-3.08, -0.12]19.2 Lower-income setting 0 0 Mean Difference (IV, Random, 95% CI) 0.0 [0.0, 0.0]
82Active versus expectant management for women in the third stage of labour (Review)
Copyright © 2019 The Cochrane Collaboration. Published by John Wiley & Sons, Ltd.

20 Manual removal of placenta asdefined by study authors
1 1631 Risk Ratio (M-H, Random, 95% CI) 1.25 [0.71, 2.21]
20.1 Higher-income setting 1 1631 Risk Ratio (M-H, Random, 95% CI) 1.25 [0.71, 2.21]20.2 Lower-income setting 0 0 Risk Ratio (M-H, Random, 95% CI) 0.0 [0.0, 0.0]
21 Postnatal diastolic bloodpressure > 90 mmHg betweenbirth of baby and dischargefrom the labour ward
0 0 Risk Ratio (M-H, Random, 95% CI) 0.0 [0.0, 0.0]
21.1 Higher-income setting 0 0 Risk Ratio (M-H, Random, 95% CI) 0.0 [0.0, 0.0]21.2 Lower-income setting 0 0 Risk Ratio (M-H, Random, 95% CI) 0.0 [0.0, 0.0]
22 Postnatal vomiting betweenbirth of baby and dischargefrom the labour ward
0 0 Risk Ratio (M-H, Random, 95% CI) 0.0 [0.0, 0.0]
22.1 Higher-income setting 0 0 Risk Ratio (M-H, Random, 95% CI) 0.0 [0.0, 0.0]22.2 Lower-income setting 0 0 Risk Ratio (M-H, Random, 95% CI) 0.0 [0.0, 0.0]
23 Any analgesia between birth ofthe baby and discharge fromlabour ward
0 0 Risk Ratio (M-H, Random, 95% CI) 0.0 [0.0, 0.0]
23.1 Higher-income setting 0 0 Risk Ratio (M-H, Random, 95% CI) 0.0 [0.0, 0.0]23.2 Lower-income setting 0 0 Risk Ratio (M-H, Random, 95% CI) 0.0 [0.0, 0.0]
24 Women’s assessment of painduring third stage as reportedby study authors
0 0 Risk Ratio (M-H, Random, 95% CI) 0.0 [0.0, 0.0]
24.1 Higher-income setting 0 0 Risk Ratio (M-H, Random, 95% CI) 0.0 [0.0, 0.0]24.2 Lower-income setting 0 0 Risk Ratio (M-H, Random, 95% CI) 0.0 [0.0, 0.0]
25 Secondary blood loss/anyvaginal bleeding needingtreatment (after 24 hours andup to 6 weeks)
0 0 Risk Ratio (M-H, Random, 95% CI) 0.0 [0.0, 0.0]
25.1 Higher-income setting 0 0 Risk Ratio (M-H, Random, 95% CI) 0.0 [0.0, 0.0]25.2 Lower-income setting 0 0 Risk Ratio (M-H, Random, 95% CI) 0.0 [0.0, 0.0]
26 Amount of lochia eitherestimated or measured after 24hours and up to discharge fromhospital
0 0 Mean Difference (IV, Random, 95% CI) 0.0 [0.0, 0.0]
26.1 Higher-income setting 0 0 Mean Difference (IV, Random, 95% CI) 0.0 [0.0, 0.0]26.2 Lower-income setting 0 0 Mean Difference (IV, Random, 95% CI) 0.0 [0.0, 0.0]
27 Surgical evacuation of retainedproducts of conception
0 0 Risk Ratio (M-H, Random, 95% CI) 0.0 [0.0, 0.0]
27.1 Higher-income setting 0 0 Risk Ratio (M-H, Random, 95% CI) 0.0 [0.0, 0.0]27.2 Lower-income setting 0 0 Risk Ratio (M-H, Random, 95% CI) 0.0 [0.0, 0.0]
28 Not prespecified: afterpains at2 hours after birth (id 20458)
1 1425 Mean Difference (IV, Random, 95% CI) -2.80 [-4.62, -0.98]
28.1 Higher-income setting 1 1425 Mean Difference (IV, Random, 95% CI) -2.80 [-4.62, -0.98]28.2 Lower-income setting 0 0 Mean Difference (IV, Random, 95% CI) 0.0 [0.0, 0.0]
29 Not pre-specified: afterpainsthe day after birth (id 20458)
1 1336 Mean Difference (IV, Random, 95% CI) -3.0 [-5.33, -0.67]
29.1 Higher-income setting 1 1336 Mean Difference (IV, Random, 95% CI) -3.0 [-5.33, -0.67]29.2 Lower-income setting 0 0 Mean Difference (IV, Random, 95% CI) 0.0 [0.0, 0.0]
30 Apgar score < 7 at 5 minutes 0 0 Risk Ratio (M-H, Random, 95% CI) 0.0 [0.0, 0.0]30.1 Higher-income setting 0 0 Risk Ratio (M-H, Random, 95% CI) 0.0 [0.0, 0.0]30.2 Lower-income setting 0 0 Risk Ratio (M-H, Random, 95% CI) 0.0 [0.0, 0.0]
83Active versus expectant management for women in the third stage of labour (Review)
Copyright © 2019 The Cochrane Collaboration. Published by John Wiley & Sons, Ltd.

31 Birthweight 1 1631 Mean Difference (IV, Random, 95% CI) 15.0 [-28.88, 58.88]31.1 Higher-income setting 1 1631 Mean Difference (IV, Random, 95% CI) 15.0 [-28.88, 58.88]31.2 Lower-income setting 0 0 Mean Difference (IV, Random, 95% CI) 0.0 [0.0, 0.0]
32 Neonatal encephalopathyassessed using Sarnat staging(Sarnat 1976; Table 1)
0 0 Risk Ratio (M-H, Random, 95% CI) 0.0 [0.0, 0.0]
32.1 Higher-income setting 0 0 Risk Ratio (M-H, Random, 95% CI) 0.0 [0.0, 0.0]32.2 Lower-income setting 0 0 Risk Ratio (M-H, Random, 95% CI) 0.0 [0.0, 0.0]
33 Neonatal mortality 0 0 Risk Ratio (M-H, Random, 95% CI) 0.0 [0.0, 0.0]33.1 Higher-income setting 0 0 Risk Ratio (M-H, Random, 95% CI) 0.0 [0.0, 0.0]33.2 Lower-income setting 0 0 Risk Ratio (M-H, Random, 95% CI) 0.0 [0.0, 0.0]
34 Intraventricular haemorrhage- Papille grade III/IV - (forinfants born before 34 weeks’gestation only)
0 0 Risk Ratio (M-H, Random, 95% CI) 0.0 [0.0, 0.0]
34.1 Higher-income setting 0 0 Risk Ratio (M-H, Random, 95% CI) 0.0 [0.0, 0.0]34.2 Lower-income setting 0 0 Risk Ratio (M-H, Random, 95% CI) 0.0 [0.0, 0.0]
35 Number of infants whoreceived a red blood celltransfusion
0 0 Risk Ratio (M-H, Random, 95% CI) 0.0 [0.0, 0.0]
35.1 Higher-income setting 0 0 Risk Ratio (M-H, Random, 95% CI) 0.0 [0.0, 0.0]35.2 Lower-income setting 0 0 Risk Ratio (M-H, Random, 95% CI) 0.0 [0.0, 0.0]
36 Infant Hb level at 24 to 72hours
0 0 Mean Difference (IV, Random, 95% CI) 0.0 [0.0, 0.0]
36.1 Higher-income setting 0 0 Mean Difference (IV, Random, 95% CI) 0.0 [0.0, 0.0]36.2 Lower-income setting 0 0 Mean Difference (IV, Random, 95% CI) 0.0 [0.0, 0.0]
37 Infant Hb level at 3-6 months 0 0 Mean Difference (IV, Random, 95% CI) 0.0 [0.0, 0.0]37.1 Higher-income setting 0 0 Mean Difference (IV, Random, 95% CI) 0.0 [0.0, 0.0]37.2 Lower-income setting 0 0 Mean Difference (IV, Random, 95% CI) 0.0 [0.0, 0.0]
38 Infant iron indices (ferritin) at3 to 6 months.
0 0 Risk Ratio (M-H, Random, 95% CI) 0.0 [0.0, 0.0]
38.1 Higher-income setting 0 0 Risk Ratio (M-H, Random, 95% CI) 0.0 [0.0, 0.0]38.2 Lower-income setting 0 0 Risk Ratio (M-H, Random, 95% CI) 0.0 [0.0, 0.0]
39 Exclusive breastfeeding atdischarge from hospital
0 0 Risk Ratio (M-H, Random, 95% CI) 0.0 [0.0, 0.0]
39.1 Higher-income setting 0 0 Risk Ratio (M-H, Random, 95% CI) 0.0 [0.0, 0.0]39.2 Lower-income setting 0 0 Risk Ratio (M-H, Random, 95% CI) 0.0 [0.0, 0.0]
40 Neurodevelopmental, cognitiveor developmental outcomesassessed after age 18 months
0 0 Risk Ratio (M-H, Random, 95% CI) 0.0 [0.0, 0.0]
40.1 Higher-income setting 0 0 Risk Ratio (M-H, Random, 95% CI) 0.0 [0.0, 0.0]40.2 Lower-income setting 0 0 Risk Ratio (M-H, Random, 95% CI) 0.0 [0.0, 0.0]
41 Return to hospital as in- oroutpatient because of bleeding(not pre-specified)
0 0 Risk Ratio (M-H, Random, 95% CI) 0.0 [0.0, 0.0]
42 Postnatal maternal mean Hb(outcome not pre-specified)
1 1631 Mean Difference (IV, Random, 95% CI) 0.28 [0.14, 0.42]
42.1 Higher-income setting 1 1631 Mean Difference (IV, Random, 95% CI) 0.28 [0.14, 0.42]42.2 Lower-income setting 0 0 Mean Difference (IV, Random, 95% CI) 0.0 [0.0, 0.0]
84Active versus expectant management for women in the third stage of labour (Review)
Copyright © 2019 The Cochrane Collaboration. Published by John Wiley & Sons, Ltd.

43 Severe primary PPH afterplacental delivery and up to 2hours (clinically estimated ormeasured blood loss ≥ 1000mL) - not pre-specified
1 1621 Risk Ratio (M-H, Random, 95% CI) 0.54 [0.39, 0.74]
43.1 Higher-income setting 1 1621 Risk Ratio (M-H, Random, 95% CI) 0.54 [0.39, 0.74]43.2 Lower-income setting 0 0 Risk Ratio (M-H, Random, 95% CI) 0.0 [0.0, 0.0]
44 Severe primary PPH attime of birth and up to 2hours (clinically estimated ormeasured blood loss ≥1000mL) - not pre-specified
1 1621 Risk Ratio (M-H, Random, 95% CI) 0.60 [0.47, 0.78]
44.1 Higher-income setting 1 1621 Risk Ratio (M-H, Random, 95% CI) 0.60 [0.47, 0.78]44.2 Lower-income setting 0 0 Risk Ratio (M-H, Random, 95% CI) 0.0 [0.0, 0.0]
45 Mean blood loss (mL)(clinically estimated ormeasured at birth and up to 2hours (not pre-specified)
1 1621 Mean Difference (IV, Random, 95% CI) -49.0 [-75.52, -22.48]
45.1 Higher-income setting 1 1621 Mean Difference (IV, Random, 95% CI) -49.0 [-75.52, -22.48]
45.2 Lower-income setting 0 0 Mean Difference (IV, Random, 95% CI) 0.0 [0.0, 0.0]
Comparison 11. Active versus mixed management (no routine uterotonic, early cord clamping, controlled cord
traction)
Outcome or subgroup titleNo. of
studies
No. of
participants Statistical method Effect size
1 Severe primary PPH at time ofbirth (clinically estimated ormeasured blood loss ≥ 1000mL)
0 0 Risk Ratio (M-H, Random, 95% CI) 0.0 [0.0, 0.0]
1.1 Higher-income setting 0 0 Risk Ratio (M-H, Random, 95% CI) 0.0 [0.0, 0.0]1.2 Lower-income setting 0 0 Risk Ratio (M-H, Random, 95% CI) 0.0 [0.0, 0.0]
2 Very severe primary PPH at timeof birth (clinically estimated ormeasured blood loss ≥ 2500mL)
0 0 Risk Ratio (M-H, Random, 95% CI) 0.0 [0.0, 0.0]
2.1 Higher-income setting 0 0 Risk Ratio (M-H, Random, 95% CI) 0.0 [0.0, 0.0]2.2 Lower-income setting 0 0 Risk Ratio (M-H, Random, 95% CI) 0.0 [0.0, 0.0]
3 Maternal mortality 0 0 Risk Ratio (M-H, Random, 95% CI) 0.0 [0.0, 0.0]3.1 Higher-income setting 0 0 Risk Ratio (M-H, Random, 95% CI) 0.0 [0.0, 0.0]3.2 Lower-income setting 0 0 Risk Ratio (M-H, Random, 95% CI) 0.0 [0.0, 0.0]
4 Maternal Hb < 9 g/dL at 24-72hr
1 130 Risk Ratio (M-H, Random, 95% CI) 0.8 [0.34, 1.90]
4.1 Higher-income setting 0 0 Risk Ratio (M-H, Random, 95% CI) 0.0 [0.0, 0.0]4.2 Lower-income setting 1 130 Risk Ratio (M-H, Random, 95% CI) 0.8 [0.34, 1.90]
5 Admission to neonatal special/intensive care
0 0 Risk Ratio (M-H, Random, 95% CI) 0.0 [0.0, 0.0]
85Active versus expectant management for women in the third stage of labour (Review)
Copyright © 2019 The Cochrane Collaboration. Published by John Wiley & Sons, Ltd.

5.1 Higher-income setting 0 0 Risk Ratio (M-H, Random, 95% CI) 0.0 [0.0, 0.0]5.2 Lower-income setting 0 0 Risk Ratio (M-H, Random, 95% CI) 0.0 [0.0, 0.0]
6 Neonatal jaundice requiringphototherapy or exchangetransfusion
0 0 Risk Ratio (M-H, Random, 95% CI) 0.0 [0.0, 0.0]
6.1 Higher-income setting 0 0 Risk Ratio (M-H, Random, 95% CI) 0.0 [0.0, 0.0]6.2 Lower-income setting 0 0 Risk Ratio (M-H, Random, 95% CI) 0.0 [0.0, 0.0]
7 Neonatal polycythaemia treatedwith dilutional exchangetransfusion
0 0 Risk Ratio (M-H, Random, 95% CI) 0.0 [0.0, 0.0]
7.1 Higher-income setting 0 0 Risk Ratio (M-H, Random, 95% CI) 0.0 [0.0, 0.0]7.2 Lower-income setting 0 0 Risk Ratio (M-H, Random, 95% CI) 0.0 [0.0, 0.0]
8 Severe primary PPH afterplacental delivery and up to 24hours (clinically estimated ormeasured blood loss ≥ 1000mL)
0 0 Risk Ratio (M-H, Random, 95% CI) 0.0 [0.0, 0.0]
8.1 Higher-income setting 0 0 Risk Ratio (M-H, Random, 95% CI) 0.0 [0.0, 0.0]8.2 Lower-income setting 0 0 Risk Ratio (M-H, Random, 95% CI) 0.0 [0.0, 0.0]
9 Severe primary PPH at timeof birth and up to 24 hours(clinically estimated ormeasured blood loss ≥1000mL)
0 0 Risk Ratio (M-H, Random, 95% CI) 0.0 [0.0, 0.0]
9.1 Higher-income setting 0 0 Risk Ratio (M-H, Random, 95% CI) 0.0 [0.0, 0.0]9.2 Lower-income setting 0 0 Risk Ratio (M-H, Random, 95% CI) 0.0 [0.0, 0.0]
10 Primary blood loss ≥ 500mL at time of birth (clinicallyestimated or measured)
0 0 Risk Ratio (M-H, Random, 95% CI) 0.0 [0.0, 0.0]
10.1 Higher-income setting 0 0 Risk Ratio (M-H, Random, 95% CI) 0.0 [0.0, 0.0]10.2 Lower-income setting 0 0 Risk Ratio (M-H, Random, 95% CI) 0.0 [0.0, 0.0]
11 Primary blood loss ≥ 500mL after delivery of placentaand up to 24 hours (clinicallyestimated or measured)
0 0 Risk Ratio (M-H, Random, 95% CI) 0.0 [0.0, 0.0]
11.1 Higher-income setting 0 0 Risk Ratio (M-H, Random, 95% CI) 0.0 [0.0, 0.0]11.2 Lower-income setting 0 0 Risk Ratio (M-H, Random, 95% CI) 0.0 [0.0, 0.0]
12 Primary blood loss ≥ 500 mLat time of birth and up to 24hours (clinically estimated ormeasured)
0 0 Risk Ratio (M-H, Random, 95% CI) 0.0 [0.0, 0.0]
12.1 Higher-income setting 0 0 Risk Ratio (M-H, Random, 95% CI) 0.0 [0.0, 0.0]12.2 Lower-income setting 0 0 Risk Ratio (M-H, Random, 95% CI) 0.0 [0.0, 0.0]
13 Mean maternal blood loss(mL) at time of birth (clinicallyestimated or measured)
0 0 Mean Difference (IV, Random, 95% CI) 0.0 [0.0, 0.0]
13.1 Higher-income setting 0 0 Mean Difference (IV, Random, 95% CI) 0.0 [0.0, 0.0]13.2 Lower-income setting 0 0 Mean Difference (IV, Random, 95% CI) 0.0 [0.0, 0.0]
14 Mean maternal blood loss(mL) after delivery of placentaand up to 24 hours (clinicallyestimated or measured)
0 0 Mean Difference (IV, Random, 95% CI) 0.0 [0.0, 0.0]
86Active versus expectant management for women in the third stage of labour (Review)
Copyright © 2019 The Cochrane Collaboration. Published by John Wiley & Sons, Ltd.

14.1 Higher-income setting 0 0 Mean Difference (IV, Random, 95% CI) 0.0 [0.0, 0.0]14.2 Lower-income setting 0 0 Mean Difference (IV, Random, 95% CI) 0.0 [0.0, 0.0]
15 Mean maternal blood loss (mL)at time of birth and up to 24hours (clinically estimated ormeasured)
0 0 Mean Difference (IV, Random, 95% CI) 0.0 [0.0, 0.0]
15.1 Higher-income setting 0 0 Mean Difference (IV, Random, 95% CI) 0.0 [0.0, 0.0]15.2 Lower-income setting 0 0 Mean Difference (IV, Random, 95% CI) 0.0 [0.0, 0.0]
16 Maternal blood transfusion 0 0 Risk Ratio (M-H, Random, 95% CI) 0.0 [0.0, 0.0]16.1 Higher-income setting 0 0 Risk Ratio (M-H, Random, 95% CI) 0.0 [0.0, 0.0]16.2 Lower-income setting 0 0 Risk Ratio (M-H, Random, 95% CI) 0.0 [0.0, 0.0]
17 Clinical signs of severe bloodloss
0 0 Risk Ratio (M-H, Random, 95% CI) 0.0 [0.0, 0.0]
17.1 Higher-income setting 0 0 Risk Ratio (M-H, Random, 95% CI) 0.0 [0.0, 0.0]17.2 Lower-income setting 0 0 Risk Ratio (M-H, Random, 95% CI) 0.0 [0.0, 0.0]
18 Therapeutic uterotonics duringthird stage and/or within 24hours
0 0 Risk Ratio (M-H, Random, 95% CI) 0.0 [0.0, 0.0]
18.1 Higher-income setting 0 0 Risk Ratio (M-H, Random, 95% CI) 0.0 [0.0, 0.0]18.2 Lower-income setting 0 0 Risk Ratio (M-H, Random, 95% CI) 0.0 [0.0, 0.0]
19 Mean length of third stage 1 130 Mean Difference (IV, Random, 95% CI) -8.12 [-9.72, -6.52]19.1 Higher-income setting 0 0 Mean Difference (IV, Random, 95% CI) 0.0 [0.0, 0.0]19.2 Lower-income setting 1 130 Mean Difference (IV, Random, 95% CI) -8.12 [-9.72, -6.52]
20 Manual removal of placenta asdefined by study authors
1 130 Risk Ratio (M-H, Random, 95% CI) 1.0 [0.06, 15.65]
20.1 Higher-income setting 0 0 Risk Ratio (M-H, Random, 95% CI) 0.0 [0.0, 0.0]20.2 Lower-income setting 1 130 Risk Ratio (M-H, Random, 95% CI) 1.0 [0.06, 15.65]
21 Postnatal diastolic bloodpressure > 90 mmHg betweenbirth of baby and dischargefrom the labour ward
0 0 Risk Ratio (M-H, Random, 95% CI) 0.0 [0.0, 0.0]
21.1 Higher-income setting 0 0 Risk Ratio (M-H, Random, 95% CI) 0.0 [0.0, 0.0]21.2 Lower-income setting 0 0 Risk Ratio (M-H, Random, 95% CI) 0.0 [0.0, 0.0]
22 Postnatal vomiting betweenbirth of baby and dischargefrom the labour ward
0 0 Risk Ratio (M-H, Random, 95% CI) 0.0 [0.0, 0.0]
22.1 Higher-income setting 0 0 Risk Ratio (M-H, Random, 95% CI) 0.0 [0.0, 0.0]22.2 Lower-income setting 0 0 Risk Ratio (M-H, Random, 95% CI) 0.0 [0.0, 0.0]
23 Any analgesia between birth ofthe baby and discharge fromlabour ward
0 0 Risk Ratio (M-H, Random, 95% CI) 0.0 [0.0, 0.0]
23.1 Higher-income setting 0 0 Risk Ratio (M-H, Random, 95% CI) 0.0 [0.0, 0.0]23.2 Lower-income setting 0 0 Risk Ratio (M-H, Random, 95% CI) 0.0 [0.0, 0.0]
24 Women’s assessment of painduring third stage as reportedby study authors
0 0 Risk Ratio (M-H, Random, 95% CI) 0.0 [0.0, 0.0]
24.1 Higher-income setting 0 0 Risk Ratio (M-H, Random, 95% CI) 0.0 [0.0, 0.0]24.2 Lower-income setting 0 0 Risk Ratio (M-H, Random, 95% CI) 0.0 [0.0, 0.0]
25 Secondary blood loss/anyvaginal bleeding needingtreatment (after 24 hours andup to 6 weeks)
0 0 Risk Ratio (M-H, Random, 95% CI) 0.0 [0.0, 0.0]
87Active versus expectant management for women in the third stage of labour (Review)
Copyright © 2019 The Cochrane Collaboration. Published by John Wiley & Sons, Ltd.

25.1 Higher-income setting 0 0 Risk Ratio (M-H, Random, 95% CI) 0.0 [0.0, 0.0]25.2 Lower-income setting 0 0 Risk Ratio (M-H, Random, 95% CI) 0.0 [0.0, 0.0]
26 Amount of lochia eitherestimated or measured after 24hours and up to discharge fromhospital
0 0 Mean Difference (IV, Random, 95% CI) 0.0 [0.0, 0.0]
26.1 Higher-income setting 0 0 Mean Difference (IV, Random, 95% CI) 0.0 [0.0, 0.0]26.2 Lower-income setting 0 0 Mean Difference (IV, Random, 95% CI) 0.0 [0.0, 0.0]
27 Surgical evacuation of retainedproducts of conception
0 0 Risk Ratio (M-H, Random, 95% CI) 0.0 [0.0, 0.0]
27.1 Higher-income setting 0 0 Risk Ratio (M-H, Random, 95% CI) 0.0 [0.0, 0.0]27.2 Lower-income setting 0 0 Risk Ratio (M-H, Random, 95% CI) 0.0 [0.0, 0.0]
28 Afterpains - abdominal painassociated with the contractinguterus in the postpartumperiod
0 0 Risk Ratio (M-H, Random, 95% CI) 0.0 [0.0, 0.0]
28.1 Higher-income setting 0 0 Risk Ratio (M-H, Random, 95% CI) 0.0 [0.0, 0.0]28.2 Lower-income setting 0 0 Risk Ratio (M-H, Random, 95% CI) 0.0 [0.0, 0.0]
29 Apgar score < 7 at 5 minutes 0 0 Risk Ratio (M-H, Random, 95% CI) 0.0 [0.0, 0.0]29.1 Higher-income setting 0 0 Risk Ratio (M-H, Random, 95% CI) 0.0 [0.0, 0.0]29.2 Lower-income setting 0 0 Risk Ratio (M-H, Random, 95% CI) 0.0 [0.0, 0.0]
30 Birthweight 0 0 Mean Difference (IV, Random, 95% CI) 0.0 [0.0, 0.0]30.1 Higher-income setting 0 0 Mean Difference (IV, Random, 95% CI) 0.0 [0.0, 0.0]30.2 Lower-income setting 0 0 Mean Difference (IV, Random, 95% CI) 0.0 [0.0, 0.0]
31 Neonatal encephalopathyassessed using Sarnat staging(Sarnat 1976; Table 1)
0 0 Risk Ratio (M-H, Random, 95% CI) 0.0 [0.0, 0.0]
31.1 Higher-income setting 0 0 Risk Ratio (M-H, Random, 95% CI) 0.0 [0.0, 0.0]31.2 Lower-income setting 0 0 Risk Ratio (M-H, Random, 95% CI) 0.0 [0.0, 0.0]
32 Neonatal mortality 0 0 Risk Ratio (M-H, Random, 95% CI) 0.0 [0.0, 0.0]32.1 Higher-income setting 0 0 Risk Ratio (M-H, Random, 95% CI) 0.0 [0.0, 0.0]32.2 Lower-income setting 0 0 Risk Ratio (M-H, Random, 95% CI) 0.0 [0.0, 0.0]
33 Intraventricular haemorrhage- Papille grade III/IV - (forinfants born before 34 weeks’gestation only)
0 0 Risk Ratio (M-H, Random, 95% CI) 0.0 [0.0, 0.0]
33.1 Higher-income setting 0 0 Risk Ratio (M-H, Random, 95% CI) 0.0 [0.0, 0.0]33.2 Lower-income setting 0 0 Risk Ratio (M-H, Random, 95% CI) 0.0 [0.0, 0.0]
34 Number of infants whoreceived a red blood celltransfusion
0 0 Risk Ratio (M-H, Random, 95% CI) 0.0 [0.0, 0.0]
34.1 Higher-income setting 0 0 Risk Ratio (M-H, Random, 95% CI) 0.0 [0.0, 0.0]34.2 Lower-income setting 0 0 Risk Ratio (M-H, Random, 95% CI) 0.0 [0.0, 0.0]
35 Infant Hb level at 24 to 72hours
0 0 Mean Difference (IV, Random, 95% CI) 0.0 [0.0, 0.0]
35.1 Higher-income setting 0 0 Mean Difference (IV, Random, 95% CI) 0.0 [0.0, 0.0]35.2 Lower-income setting 0 0 Mean Difference (IV, Random, 95% CI) 0.0 [0.0, 0.0]
36 Infant Hb level at 3-6 months 0 0 Mean Difference (IV, Random, 95% CI) 0.0 [0.0, 0.0]36.1 Higher-income setting 0 0 Mean Difference (IV, Random, 95% CI) 0.0 [0.0, 0.0]36.2 Lower-income setting 0 0 Mean Difference (IV, Random, 95% CI) 0.0 [0.0, 0.0]
37 Infant iron indices (ferritin) at3 to 6 months.
0 0 Risk Ratio (M-H, Random, 95% CI) 0.0 [0.0, 0.0]
88Active versus expectant management for women in the third stage of labour (Review)
Copyright © 2019 The Cochrane Collaboration. Published by John Wiley & Sons, Ltd.

37.1 Higher-income setting 0 0 Risk Ratio (M-H, Random, 95% CI) 0.0 [0.0, 0.0]37.2 Lower-income setting 0 0 Risk Ratio (M-H, Random, 95% CI) 0.0 [0.0, 0.0]
38 Exclusive breastfeeding atdischarge from hospital
0 0 Risk Ratio (M-H, Random, 95% CI) 0.0 [0.0, 0.0]
38.1 Higher-income setting 0 0 Risk Ratio (M-H, Random, 95% CI) 0.0 [0.0, 0.0]38.2 Lower-income setting 0 0 Risk Ratio (M-H, Random, 95% CI) 0.0 [0.0, 0.0]
39 Neurodevelopmental, cognitiveor developmental outcomesassessed after age 18 months
0 0 Risk Ratio (M-H, Random, 95% CI) 0.0 [0.0, 0.0]
39.1 Higher-income setting 0 0 Risk Ratio (M-H, Random, 95% CI) 0.0 [0.0, 0.0]39.2 Lower-income setting 0 0 Risk Ratio (M-H, Random, 95% CI) 0.0 [0.0, 0.0]
40 Return to hospital as in- oroutpatient because of bleeding(not pre-specified)
0 0 Risk Ratio (M-H, Random, 95% CI) 0.0 [0.0, 0.0]
40.1 Higher-income setting 0 0 Risk Ratio (M-H, Random, 95% CI) 0.0 [0.0, 0.0]40.2 Lower-income setting 0 0 Risk Ratio (M-H, Random, 95% CI) 0.0 [0.0, 0.0]
41 Postnatal maternal mean Hb(outcome not pre-specified)
0 0 Mean Difference (IV, Random, 95% CI) 0.0 [0.0, 0.0]
41.1 Higher-income setting 0 0 Mean Difference (IV, Random, 95% CI) 0.0 [0.0, 0.0]41.2 Lower-income setting 0 0 Mean Difference (IV, Random, 95% CI) 0.0 [0.0, 0.0]
89Active versus expectant management for women in the third stage of labour (Review)
Copyright © 2019 The Cochrane Collaboration. Published by John Wiley & Sons, Ltd.

Analysis 1.1. Comparison 1 Active versus expectant management of 3rd stage of labour (all women),
Outcome 1 Severe primary postpartum haemorrhage (PPH) at time of birth (clinically estimated or
measured blood loss ≥ 1000 mL).
Review: Active versus expectant management for women in the third stage of labour
Comparison: 1 Active versus expectant management of 3rd stage of labour (all women)
Outcome: 1 Severe primary postpartum haemorrhage (PPH) at time of birth (clinically estimated or measured blood loss ≥ 1000 mL)
Study or subgroup Active management
Expectantmanage-
ment Risk Ratio Weight Risk Ratio
n/N n/N
M-H,Random,95%
CI
M-H,Random,95%
CI
1 Higher-income setting
Begley 1990 1/705 11/724 15.3 % 0.09 [ 0.01, 0.72 ]
Prendiville 1988 7/846 26/849 40.2 % 0.27 [ 0.12, 0.62 ]
Rogers 1998 13/748 20/764 44.5 % 0.66 [ 0.33, 1.32 ]
Subtotal (95% CI) 2299 2337 100.0 % 0.34 [ 0.14, 0.87 ]
Total events: 21 (Active management), 57 (Expectant management)
Heterogeneity: Tau2 = 0.38; Chi2 = 5.01, df = 2 (P = 0.08); I2 =60%
Test for overall effect: Z = 2.26 (P = 0.024)
2 Lower-income setting
Subtotal (95% CI) 0 0 Not estimable
Total events: 0 (Active management), 0 (Expectant management)
Heterogeneity: not applicable
Test for overall effect: not applicable
Total (95% CI) 2299 2337 100.0 % 0.34 [ 0.14, 0.87 ]
Total events: 21 (Active management), 57 (Expectant management)
Heterogeneity: Tau2 = 0.38; Chi2 = 5.01, df = 2 (P = 0.08); I2 =60%
Test for overall effect: Z = 2.26 (P = 0.024)
Test for subgroup differences: Not applicable
0.01 0.1 1 10 100
Favours active Favours expectant
90Active versus expectant management for women in the third stage of labour (Review)
Copyright © 2019 The Cochrane Collaboration. Published by John Wiley & Sons, Ltd.
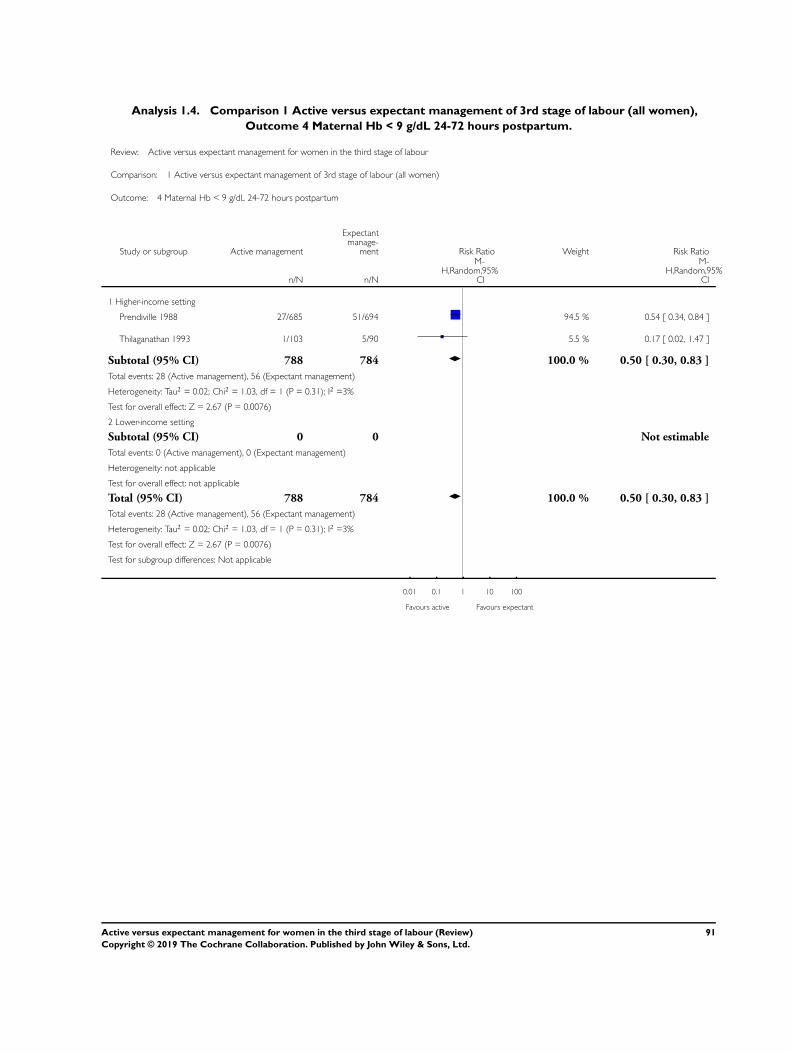
Analysis 1.4. Comparison 1 Active versus expectant management of 3rd stage of labour (all women),
Outcome 4 Maternal Hb < 9 g/dL 24-72 hours postpartum.
Review: Active versus expectant management for women in the third stage of labour
Comparison: 1 Active versus expectant management of 3rd stage of labour (all women)
Outcome: 4 Maternal Hb < 9 g/dL 24-72 hours postpartum
Study or subgroup Active management
Expectantmanage-
ment Risk Ratio Weight Risk Ratio
n/N n/N
M-H,Random,95%
CI
M-H,Random,95%
CI
1 Higher-income setting
Prendiville 1988 27/685 51/694 94.5 % 0.54 [ 0.34, 0.84 ]
Thilaganathan 1993 1/103 5/90 5.5 % 0.17 [ 0.02, 1.47 ]
Subtotal (95% CI) 788 784 100.0 % 0.50 [ 0.30, 0.83 ]
Total events: 28 (Active management), 56 (Expectant management)
Heterogeneity: Tau2 = 0.02; Chi2 = 1.03, df = 1 (P = 0.31); I2 =3%
Test for overall effect: Z = 2.67 (P = 0.0076)
2 Lower-income setting
Subtotal (95% CI) 0 0 Not estimable
Total events: 0 (Active management), 0 (Expectant management)
Heterogeneity: not applicable
Test for overall effect: not applicable
Total (95% CI) 788 784 100.0 % 0.50 [ 0.30, 0.83 ]
Total events: 28 (Active management), 56 (Expectant management)
Heterogeneity: Tau2 = 0.02; Chi2 = 1.03, df = 1 (P = 0.31); I2 =3%
Test for overall effect: Z = 2.67 (P = 0.0076)
Test for subgroup differences: Not applicable
0.01 0.1 1 10 100
Favours active Favours expectant
91Active versus expectant management for women in the third stage of labour (Review)
Copyright © 2019 The Cochrane Collaboration. Published by John Wiley & Sons, Ltd.

Analysis 1.5. Comparison 1 Active versus expectant management of 3rd stage of labour (all women),
Outcome 5 Admission to neonatal special/intensive care.
Review: Active versus expectant management for women in the third stage of labour
Comparison: 1 Active versus expectant management of 3rd stage of labour (all women)
Outcome: 5 Admission to neonatal special/intensive care
Study or subgroup Active management
Expectantmanage-
ment Risk Ratio Weight Risk Ratio
n/N n/N
M-H,Random,95%
CI
M-H,Random,95%
CI
1 Higher-income setting
Prendiville 1988 48/846 64/849 74.1 % 0.75 [ 0.52, 1.08 ]
Rogers 1998 20/748 20/764 25.9 % 1.02 [ 0.55, 1.88 ]
Subtotal (95% CI) 1594 1613 100.0 % 0.81 [ 0.60, 1.11 ]
Total events: 68 (Active management), 84 (Expectant management)
Heterogeneity: Tau2 = 0.0; Chi2 = 0.71, df = 1 (P = 0.40); I2 =0.0%
Test for overall effect: Z = 1.29 (P = 0.20)
2 Lower-income setting
Subtotal (95% CI) 0 0 Not estimable
Total events: 0 (Active management), 0 (Expectant management)
Heterogeneity: not applicable
Test for overall effect: not applicable
Total (95% CI) 1594 1613 100.0 % 0.81 [ 0.60, 1.11 ]
Total events: 68 (Active management), 84 (Expectant management)
Heterogeneity: Tau2 = 0.0; Chi2 = 0.71, df = 1 (P = 0.40); I2 =0.0%
Test for overall effect: Z = 1.29 (P = 0.20)
Test for subgroup differences: Not applicable
0.01 0.1 1 10 100
Favours active Favours expectant
92Active versus expectant management for women in the third stage of labour (Review)
Copyright © 2019 The Cochrane Collaboration. Published by John Wiley & Sons, Ltd.
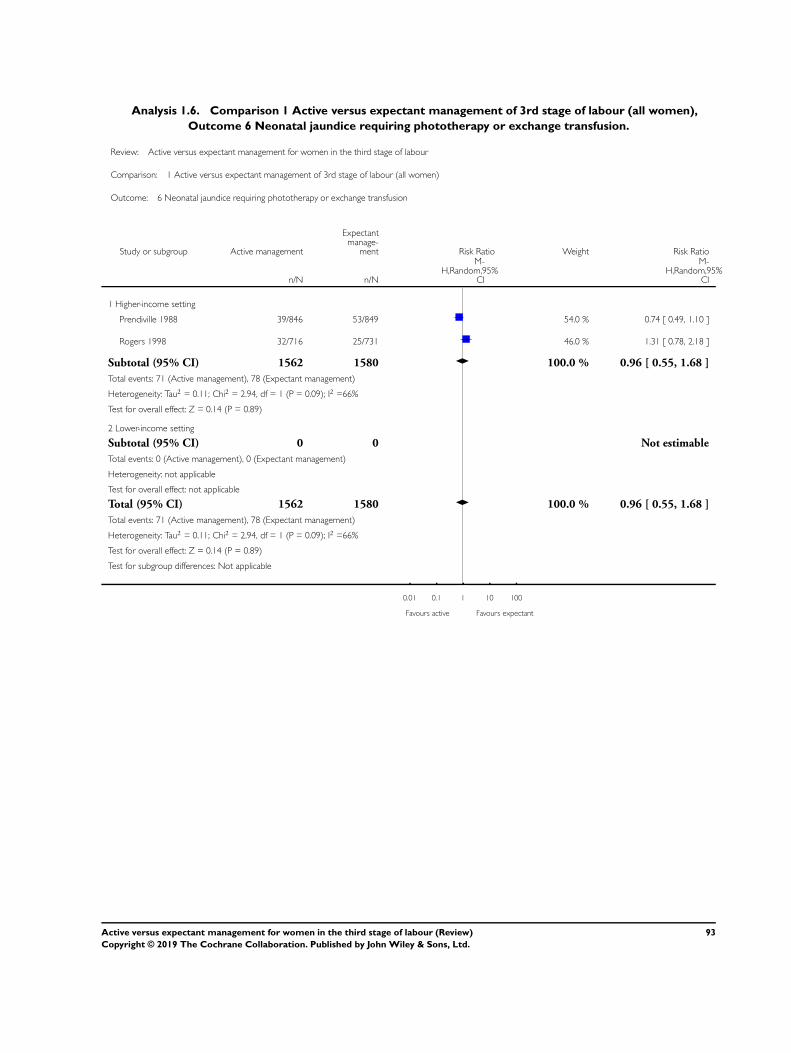
Analysis 1.6. Comparison 1 Active versus expectant management of 3rd stage of labour (all women),
Outcome 6 Neonatal jaundice requiring phototherapy or exchange transfusion.
Review: Active versus expectant management for women in the third stage of labour
Comparison: 1 Active versus expectant management of 3rd stage of labour (all women)
Outcome: 6 Neonatal jaundice requiring phototherapy or exchange transfusion
Study or subgroup Active management
Expectantmanage-
ment Risk Ratio Weight Risk Ratio
n/N n/N
M-H,Random,95%
CI
M-H,Random,95%
CI
1 Higher-income setting
Prendiville 1988 39/846 53/849 54.0 % 0.74 [ 0.49, 1.10 ]
Rogers 1998 32/716 25/731 46.0 % 1.31 [ 0.78, 2.18 ]
Subtotal (95% CI) 1562 1580 100.0 % 0.96 [ 0.55, 1.68 ]
Total events: 71 (Active management), 78 (Expectant management)
Heterogeneity: Tau2 = 0.11; Chi2 = 2.94, df = 1 (P = 0.09); I2 =66%
Test for overall effect: Z = 0.14 (P = 0.89)
2 Lower-income setting
Subtotal (95% CI) 0 0 Not estimable
Total events: 0 (Active management), 0 (Expectant management)
Heterogeneity: not applicable
Test for overall effect: not applicable
Total (95% CI) 1562 1580 100.0 % 0.96 [ 0.55, 1.68 ]
Total events: 71 (Active management), 78 (Expectant management)
Heterogeneity: Tau2 = 0.11; Chi2 = 2.94, df = 1 (P = 0.09); I2 =66%
Test for overall effect: Z = 0.14 (P = 0.89)
Test for subgroup differences: Not applicable
0.01 0.1 1 10 100
Favours active Favours expectant
93Active versus expectant management for women in the third stage of labour (Review)
Copyright © 2019 The Cochrane Collaboration. Published by John Wiley & Sons, Ltd.

Analysis 1.10. Comparison 1 Active versus expectant management of 3rd stage of labour (all women),
Outcome 10 Primary blood loss ≥ 500 mL at time of birth (clinically estimated or measured).
Review: Active versus expectant management for women in the third stage of labour
Comparison: 1 Active versus expectant management of 3rd stage of labour (all women)
Outcome: 10 Primary blood loss ≥ 500 mL at time of birth (clinically estimated or measured)
Study or subgroup Active management
Expectantmanage-
ment Risk Ratio Weight Risk Ratio
n/N n/N
M-H,Random,95%
CI
M-H,Random,95%
CI
1 Higher-income setting
Begley 1990 14/705 60/724 16.9 % 0.24 [ 0.14, 0.42 ]
Prendiville 1988 50/846 152/849 41.9 % 0.33 [ 0.24, 0.45 ]
Rogers 1998 51/748 126/764 41.2 % 0.41 [ 0.30, 0.56 ]
Subtotal (95% CI) 2299 2337 100.0 % 0.34 [ 0.27, 0.44 ]
Total events: 115 (Active management), 338 (Expectant management)
Heterogeneity: Tau2 = 0.02; Chi2 = 2.95, df = 2 (P = 0.23); I2 =32%
Test for overall effect: Z = 8.14 (P < 0.00001)
2 Lower-income setting
Subtotal (95% CI) 0 0 Not estimable
Total events: 0 (Active management), 0 (Expectant management)
Heterogeneity: not applicable
Test for overall effect: not applicable
Total (95% CI) 2299 2337 100.0 % 0.34 [ 0.27, 0.44 ]
Total events: 115 (Active management), 338 (Expectant management)
Heterogeneity: Tau2 = 0.02; Chi2 = 2.95, df = 2 (P = 0.23); I2 =32%
Test for overall effect: Z = 8.14 (P < 0.00001)
Test for subgroup differences: Not applicable
0.01 0.1 1 10 100
Favours active Favours expectant
94Active versus expectant management for women in the third stage of labour (Review)
Copyright © 2019 The Cochrane Collaboration. Published by John Wiley & Sons, Ltd.

Analysis 1.13. Comparison 1 Active versus expectant management of 3rd stage of labour (all women),
Outcome 13 Mean maternal blood loss (mL) at time of birth (clinically estimated or measured).
Review: Active versus expectant management for women in the third stage of labour
Comparison: 1 Active versus expectant management of 3rd stage of labour (all women)
Outcome: 13 Mean maternal blood loss (mL) at time of birth (clinically estimated or measured)
Study or subgroup Active management
Expectantmanage-
mentMean
Difference WeightMean
Difference
N Mean(SD) N Mean(SD) IV,Random,95% CI IV,Random,95% CI
1 Higher-income setting
Begley 1990 705 148.9 (127.1) 724 234.8 (223.9) 60.3 % -85.90 [ -104.72, -67.08 ]
Rogers 1998 748 268.5 (246.1) 764 336.5 (243.2) 39.7 % -68.00 [ -92.67, -43.33 ]
Subtotal (95% CI) 1453 1488 100.0 % -78.80 [ -95.96, -61.64 ]
Heterogeneity: Tau2 = 34.93; Chi2 = 1.28, df = 1 (P = 0.26); I2 =22%
Test for overall effect: Z = 9.00 (P < 0.00001)
2 Lower-income setting
Subtotal (95% CI) 0 0 Not estimable
Heterogeneity: not applicable
Test for overall effect: not applicable
Total (95% CI) 1453 1488 100.0 % -78.80 [ -95.96, -61.64 ]
Heterogeneity: Tau2 = 34.93; Chi2 = 1.28, df = 1 (P = 0.26); I2 =22%
Test for overall effect: Z = 9.00 (P < 0.00001)
Test for subgroup differences: Not applicable
-100 -50 0 50 100
Favours active Favours expectant
95Active versus expectant management for women in the third stage of labour (Review)
Copyright © 2019 The Cochrane Collaboration. Published by John Wiley & Sons, Ltd.

Analysis 1.16. Comparison 1 Active versus expectant management of 3rd stage of labour (all women),
Outcome 16 Maternal blood transfusion.
Review: Active versus expectant management for women in the third stage of labour
Comparison: 1 Active versus expectant management of 3rd stage of labour (all women)
Outcome: 16 Maternal blood transfusion
Study or subgroup Active management
Expectantmanage-
ment Risk Ratio Weight Risk Ratio
n/N n/N
M-H,Random,95%
CI
M-H,Random,95%
CI
1 Higher-income setting
Begley 1990 1/705 3/724 4.2 % 0.34 [ 0.04, 3.28 ]
Prendiville 1988 18/846 48/849 75.0 % 0.38 [ 0.22, 0.64 ]
Rogers 1998 4/748 20/764 18.7 % 0.20 [ 0.07, 0.59 ]
Thilaganathan 1993 1/103 0/90 2.1 % 2.63 [ 0.11, 63.64 ]
Subtotal (95% CI) 2402 2427 100.0 % 0.35 [ 0.22, 0.55 ]
Total events: 24 (Active management), 71 (Expectant management)
Heterogeneity: Tau2 = 0.0; Chi2 = 2.58, df = 3 (P = 0.46); I2 =0.0%
Test for overall effect: Z = 4.47 (P < 0.00001)
2 Lower-income setting
Subtotal (95% CI) 0 0 Not estimable
Total events: 0 (Active management), 0 (Expectant management)
Heterogeneity: not applicable
Test for overall effect: not applicable
Total (95% CI) 2402 2427 100.0 % 0.35 [ 0.22, 0.55 ]
Total events: 24 (Active management), 71 (Expectant management)
Heterogeneity: Tau2 = 0.0; Chi2 = 2.58, df = 3 (P = 0.46); I2 =0.0%
Test for overall effect: Z = 4.47 (P < 0.00001)
Test for subgroup differences: Not applicable
0.01 0.1 1 10 100
Favours active Favours expectant
96Active versus expectant management for women in the third stage of labour (Review)
Copyright © 2019 The Cochrane Collaboration. Published by John Wiley & Sons, Ltd.

Analysis 1.18. Comparison 1 Active versus expectant management of 3rd stage of labour (all women),
Outcome 18 Therapeutic uterotonics during third stage and/or within 24 hours.
Review: Active versus expectant management for women in the third stage of labour
Comparison: 1 Active versus expectant management of 3rd stage of labour (all women)
Outcome: 18 Therapeutic uterotonics during third stage and/or within 24 hours
Study or subgroup Active management
Expectantmanage-
ment Risk Ratio Weight Risk Ratio
n/N n/N
M-H,Random,95%
CI
M-H,Random,95%
CI
1 Higher-income setting
Begley 1990 14/705 93/724 14.8 % 0.15 [ 0.09, 0.27 ]
Prendiville 1988 54/846 252/849 58.3 % 0.22 [ 0.16, 0.28 ]
Rogers 1998 24/748 161/764 25.9 % 0.15 [ 0.10, 0.23 ]
Thilaganathan 1993 1/103 7/90 1.0 % 0.12 [ 0.02, 1.00 ]
Subtotal (95% CI) 2402 2427 100.0 % 0.19 [ 0.15, 0.23 ]
Total events: 93 (Active management), 513 (Expectant management)
Heterogeneity: Tau2 = 0.0; Chi2 = 2.53, df = 3 (P = 0.47); I2 =0.0%
Test for overall effect: Z = 15.52 (P < 0.00001)
2 Lower-income setting
Subtotal (95% CI) 0 0 Not estimable
Total events: 0 (Active management), 0 (Expectant management)
Heterogeneity: not applicable
Test for overall effect: not applicable
Total (95% CI) 2402 2427 100.0 % 0.19 [ 0.15, 0.23 ]
Total events: 93 (Active management), 513 (Expectant management)
Heterogeneity: Tau2 = 0.0; Chi2 = 2.53, df = 3 (P = 0.47); I2 =0.0%
Test for overall effect: Z = 15.52 (P < 0.00001)
Test for subgroup differences: Not applicable
0.1 0.2 0.5 1 2 5 10
Favours active Favours expectant
97Active versus expectant management for women in the third stage of labour (Review)
Copyright © 2019 The Cochrane Collaboration. Published by John Wiley & Sons, Ltd.

Analysis 1.19. Comparison 1 Active versus expectant management of 3rd stage of labour (all women),
Outcome 19 Mean length of third stage.
Review: Active versus expectant management for women in the third stage of labour
Comparison: 1 Active versus expectant management of 3rd stage of labour (all women)
Outcome: 19 Mean length of third stage
Study or subgroup Active management
Expectantmanage-
mentMean
Difference WeightMean
Difference
N Mean(SD)[min] N Mean(SD)[min] IV,Random,95% CI IV,Random,95% CI
1 Higher-income setting
Begley 1990 705 11.26 (19.62) 724 11.56 (8.41) 100.0 % -0.30 [ -1.87, 1.27 ]
Subtotal (95% CI) 705 724 100.0 % -0.30 [ -1.87, 1.27 ]
Heterogeneity: not applicable
Test for overall effect: Z = 0.37 (P = 0.71)
2 Lower-income setting
Subtotal (95% CI) 0 0 Not estimable
Heterogeneity: not applicable
Test for overall effect: not applicable
Total (95% CI) 705 724 100.0 % -0.30 [ -1.87, 1.27 ]
Heterogeneity: not applicable
Test for overall effect: Z = 0.37 (P = 0.71)
Test for subgroup differences: Not applicable
-100 -50 0 50 100
Favours active Favours expectant
98Active versus expectant management for women in the third stage of labour (Review)
Copyright © 2019 The Cochrane Collaboration. Published by John Wiley & Sons, Ltd.

Analysis 1.20. Comparison 1 Active versus expectant management of 3rd stage of labour (all women),
Outcome 20 Manual removal of placenta as defined by study authors.
Review: Active versus expectant management for women in the third stage of labour
Comparison: 1 Active versus expectant management of 3rd stage of labour (all women)
Outcome: 20 Manual removal of placenta as defined by study authors
Study or subgroup Active management
Expectantmanage-
ment Risk Ratio Weight Risk Ratio
n/N n/N
M-H,Random,95%
CI
M-H,Random,95%
CI
1 Higher-income setting
Begley 1990 19/705 1/724 18.1 % 19.51 [ 2.62, 145.36 ]
Prendiville 1988 16/846 22/849 36.7 % 0.73 [ 0.39, 1.38 ]
Rogers 1998 15/748 13/764 35.4 % 1.18 [ 0.56, 2.46 ]
Thilaganathan 1993 1/103 0/90 9.8 % 2.63 [ 0.11, 63.64 ]
Subtotal (95% CI) 2402 2427 100.0 % 1.78 [ 0.57, 5.56 ]
Total events: 51 (Active management), 36 (Expectant management)
Heterogeneity: Tau2 = 0.82; Chi2 = 11.17, df = 3 (P = 0.01); I2 =73%
Test for overall effect: Z = 0.99 (P = 0.32)
2 Lower-income setting
Subtotal (95% CI) 0 0 Not estimable
Total events: 0 (Active management), 0 (Expectant management)
Heterogeneity: not applicable
Test for overall effect: not applicable
Total (95% CI) 2402 2427 100.0 % 1.78 [ 0.57, 5.56 ]
Total events: 51 (Active management), 36 (Expectant management)
Heterogeneity: Tau2 = 0.82; Chi2 = 11.17, df = 3 (P = 0.01); I2 =73%
Test for overall effect: Z = 0.99 (P = 0.32)
Test for subgroup differences: Not applicable
0.01 0.1 1 10 100
Favours active Favours expectant
99Active versus expectant management for women in the third stage of labour (Review)
Copyright © 2019 The Cochrane Collaboration. Published by John Wiley & Sons, Ltd.
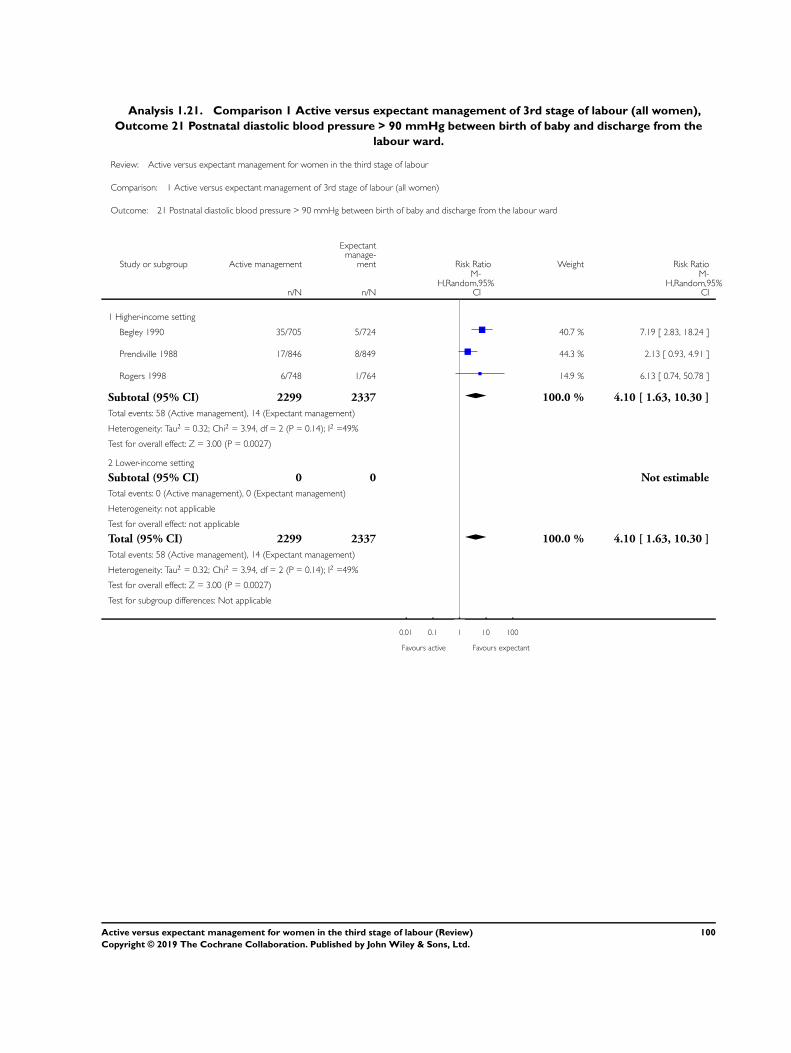
Analysis 1.21. Comparison 1 Active versus expectant management of 3rd stage of labour (all women),
Outcome 21 Postnatal diastolic blood pressure > 90 mmHg between birth of baby and discharge from the
labour ward.
Review: Active versus expectant management for women in the third stage of labour
Comparison: 1 Active versus expectant management of 3rd stage of labour (all women)
Outcome: 21 Postnatal diastolic blood pressure > 90 mmHg between birth of baby and discharge from the labour ward
Study or subgroup Active management
Expectantmanage-
ment Risk Ratio Weight Risk Ratio
n/N n/N
M-H,Random,95%
CI
M-H,Random,95%
CI
1 Higher-income setting
Begley 1990 35/705 5/724 40.7 % 7.19 [ 2.83, 18.24 ]
Prendiville 1988 17/846 8/849 44.3 % 2.13 [ 0.93, 4.91 ]
Rogers 1998 6/748 1/764 14.9 % 6.13 [ 0.74, 50.78 ]
Subtotal (95% CI) 2299 2337 100.0 % 4.10 [ 1.63, 10.30 ]
Total events: 58 (Active management), 14 (Expectant management)
Heterogeneity: Tau2 = 0.32; Chi2 = 3.94, df = 2 (P = 0.14); I2 =49%
Test for overall effect: Z = 3.00 (P = 0.0027)
2 Lower-income setting
Subtotal (95% CI) 0 0 Not estimable
Total events: 0 (Active management), 0 (Expectant management)
Heterogeneity: not applicable
Test for overall effect: not applicable
Total (95% CI) 2299 2337 100.0 % 4.10 [ 1.63, 10.30 ]
Total events: 58 (Active management), 14 (Expectant management)
Heterogeneity: Tau2 = 0.32; Chi2 = 3.94, df = 2 (P = 0.14); I2 =49%
Test for overall effect: Z = 3.00 (P = 0.0027)
Test for subgroup differences: Not applicable
0.01 0.1 1 10 100
Favours active Favours expectant
100Active versus expectant management for women in the third stage of labour (Review)
Copyright © 2019 The Cochrane Collaboration. Published by John Wiley & Sons, Ltd.

Analysis 1.22. Comparison 1 Active versus expectant management of 3rd stage of labour (all women),
Outcome 22 Postnatal vomiting between birth of baby and discharge from the labour ward.
Review: Active versus expectant management for women in the third stage of labour
Comparison: 1 Active versus expectant management of 3rd stage of labour (all women)
Outcome: 22 Postnatal vomiting between birth of baby and discharge from the labour ward
Study or subgroup Active management
Expectantmanage-
ment Risk Ratio Weight Risk Ratio
n/N n/N
M-H,Random,95%
CI
M-H,Random,95%
CI
1 Higher-income setting
Begley 1990 12/705 0/724 4.2 % 25.67 [ 1.52, 432.78 ]
Prendiville 1988 102/846 55/849 54.3 % 1.86 [ 1.36, 2.55 ]
Rogers 1998 47/748 17/764 41.6 % 2.82 [ 1.64, 4.87 ]
Subtotal (95% CI) 2299 2337 100.0 % 2.47 [ 1.36, 4.48 ]
Total events: 161 (Active management), 72 (Expectant management)
Heterogeneity: Tau2 = 0.14; Chi2 = 4.92, df = 2 (P = 0.09); I2 =59%
Test for overall effect: Z = 2.97 (P = 0.0029)
2 Lower-income setting
Subtotal (95% CI) 0 0 Not estimable
Total events: 0 (Active management), 0 (Expectant management)
Heterogeneity: not applicable
Test for overall effect: not applicable
Total (95% CI) 2299 2337 100.0 % 2.47 [ 1.36, 4.48 ]
Total events: 161 (Active management), 72 (Expectant management)
Heterogeneity: Tau2 = 0.14; Chi2 = 4.92, df = 2 (P = 0.09); I2 =59%
Test for overall effect: Z = 2.97 (P = 0.0029)
Test for subgroup differences: Not applicable
0.01 0.1 1 10 100
Favours active Favours expectant
101Active versus expectant management for women in the third stage of labour (Review)
Copyright © 2019 The Cochrane Collaboration. Published by John Wiley & Sons, Ltd.

Analysis 1.23. Comparison 1 Active versus expectant management of 3rd stage of labour (all women),
Outcome 23 Any analgesia between birth of the baby and discharge from labour ward.
Review: Active versus expectant management for women in the third stage of labour
Comparison: 1 Active versus expectant management of 3rd stage of labour (all women)
Outcome: 23 Any analgesia between birth of the baby and discharge from labour ward
Study or subgroup Active management
Expectantmanage-
ment Risk Ratio Weight Risk Ratio
n/N n/N
M-H,Random,95%
CI
M-H,Random,95%
CI
1 Higher-income setting
Begley 1990 32/705 13/724 100.0 % 2.53 [ 1.34, 4.78 ]
Subtotal (95% CI) 705 724 100.0 % 2.53 [ 1.34, 4.78 ]
Total events: 32 (Active management), 13 (Expectant management)
Heterogeneity: not applicable
Test for overall effect: Z = 2.86 (P = 0.0043)
2 Lower-income setting
Subtotal (95% CI) 0 0 Not estimable
Total events: 0 (Active management), 0 (Expectant management)
Heterogeneity: not applicable
Test for overall effect: not applicable
Total (95% CI) 705 724 100.0 % 2.53 [ 1.34, 4.78 ]
Total events: 32 (Active management), 13 (Expectant management)
Heterogeneity: not applicable
Test for overall effect: Z = 2.86 (P = 0.0043)
Test for subgroup differences: Not applicable
0.01 0.1 1 10 100
Favours active Favours expectant
102Active versus expectant management for women in the third stage of labour (Review)
Copyright © 2019 The Cochrane Collaboration. Published by John Wiley & Sons, Ltd.

Analysis 1.25. Comparison 1 Active versus expectant management of 3rd stage of labour (all women),
Outcome 25 Secondary blood loss/any vaginal bleeding needing treatment (after 24 hours and up to 6 weeks).
Review: Active versus expectant management for women in the third stage of labour
Comparison: 1 Active versus expectant management of 3rd stage of labour (all women)
Outcome: 25 Secondary blood loss/any vaginal bleeding needing treatment (after 24 hours and up to 6 weeks)
Study or subgroup Active management
Expectantmanage-
ment Risk Ratio Weight Risk Ratio
n/N n/N
M-H,Random,95%
CI
M-H,Random,95%
CI
1 Higher-income setting
Begley 1990 35/705 12/724 33.7 % 3.00 [ 1.57, 5.72 ]
Prendiville 1988 6/846 18/849 29.5 % 0.33 [ 0.13, 0.84 ]
Rogers 1998 48/748 43/764 36.9 % 1.14 [ 0.77, 1.70 ]
Subtotal (95% CI) 2299 2337 100.0 % 1.10 [ 0.40, 2.99 ]
Total events: 89 (Active management), 73 (Expectant management)
Heterogeneity: Tau2 = 0.67; Chi2 = 15.11, df = 2 (P = 0.00052); I2 =87%
Test for overall effect: Z = 0.19 (P = 0.85)
2 Lower-income setting
Subtotal (95% CI) 0 0 Not estimable
Total events: 0 (Active management), 0 (Expectant management)
Heterogeneity: not applicable
Test for overall effect: not applicable
Total (95% CI) 2299 2337 100.0 % 1.10 [ 0.40, 2.99 ]
Total events: 89 (Active management), 73 (Expectant management)
Heterogeneity: Tau2 = 0.67; Chi2 = 15.11, df = 2 (P = 0.00052); I2 =87%
Test for overall effect: Z = 0.19 (P = 0.85)
Test for subgroup differences: Not applicable
0.01 0.1 1 10 100
Favours active Favours expectant
103Active versus expectant management for women in the third stage of labour (Review)
Copyright © 2019 The Cochrane Collaboration. Published by John Wiley & Sons, Ltd.
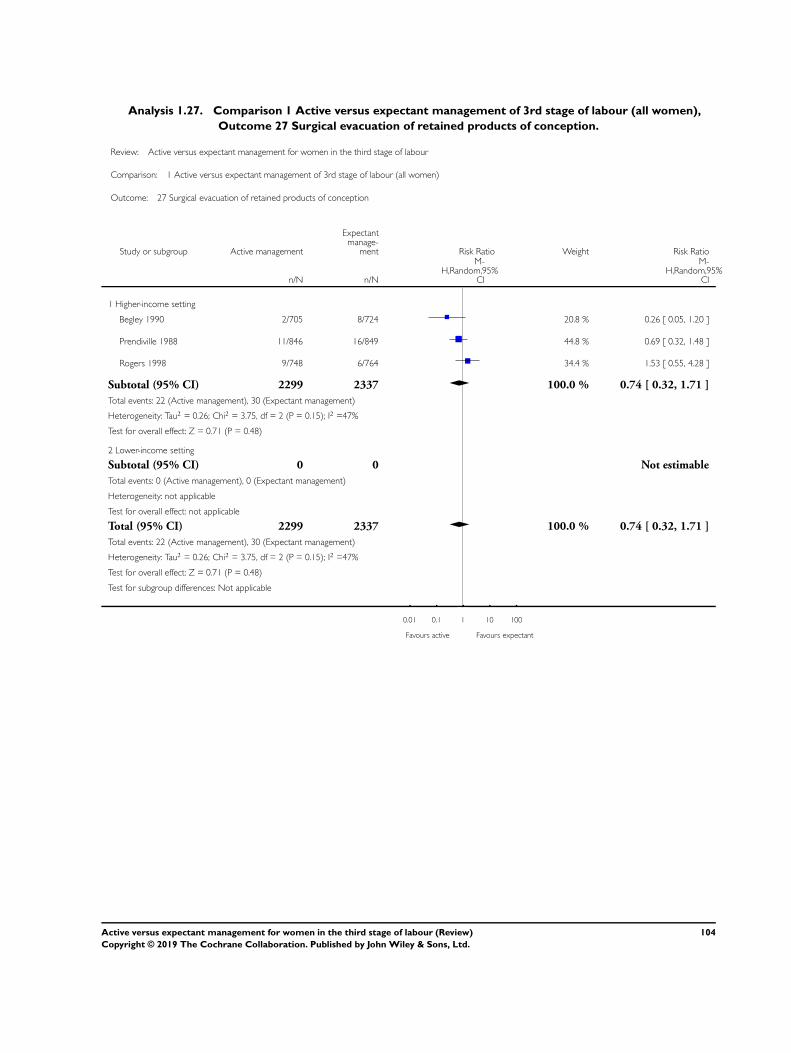
Analysis 1.27. Comparison 1 Active versus expectant management of 3rd stage of labour (all women),
Outcome 27 Surgical evacuation of retained products of conception.
Review: Active versus expectant management for women in the third stage of labour
Comparison: 1 Active versus expectant management of 3rd stage of labour (all women)
Outcome: 27 Surgical evacuation of retained products of conception
Study or subgroup Active management
Expectantmanage-
ment Risk Ratio Weight Risk Ratio
n/N n/N
M-H,Random,95%
CI
M-H,Random,95%
CI
1 Higher-income setting
Begley 1990 2/705 8/724 20.8 % 0.26 [ 0.05, 1.20 ]
Prendiville 1988 11/846 16/849 44.8 % 0.69 [ 0.32, 1.48 ]
Rogers 1998 9/748 6/764 34.4 % 1.53 [ 0.55, 4.28 ]
Subtotal (95% CI) 2299 2337 100.0 % 0.74 [ 0.32, 1.71 ]
Total events: 22 (Active management), 30 (Expectant management)
Heterogeneity: Tau2 = 0.26; Chi2 = 3.75, df = 2 (P = 0.15); I2 =47%
Test for overall effect: Z = 0.71 (P = 0.48)
2 Lower-income setting
Subtotal (95% CI) 0 0 Not estimable
Total events: 0 (Active management), 0 (Expectant management)
Heterogeneity: not applicable
Test for overall effect: not applicable
Total (95% CI) 2299 2337 100.0 % 0.74 [ 0.32, 1.71 ]
Total events: 22 (Active management), 30 (Expectant management)
Heterogeneity: Tau2 = 0.26; Chi2 = 3.75, df = 2 (P = 0.15); I2 =47%
Test for overall effect: Z = 0.71 (P = 0.48)
Test for subgroup differences: Not applicable
0.01 0.1 1 10 100
Favours active Favours expectant
104Active versus expectant management for women in the third stage of labour (Review)
Copyright © 2019 The Cochrane Collaboration. Published by John Wiley & Sons, Ltd.

Analysis 1.28. Comparison 1 Active versus expectant management of 3rd stage of labour (all women),
Outcome 28 Afterpains - abdominal pain associated with the contracting uterus in the postpartum period.
Review: Active versus expectant management for women in the third stage of labour
Comparison: 1 Active versus expectant management of 3rd stage of labour (all women)
Outcome: 28 Afterpains - abdominal pain associated with the contracting uterus in the postpartum period
Study or subgroup Active management
Expectantmanage-
ment Risk Ratio Weight Risk Ratio
n/N n/N
M-H,Random,95%
CI
M-H,Random,95%
CI
1 Higher-income setting
Begley 1990 32/705 13/724 100.0 % 2.53 [ 1.34, 4.78 ]
Subtotal (95% CI) 705 724 100.0 % 2.53 [ 1.34, 4.78 ]
Total events: 32 (Active management), 13 (Expectant management)
Heterogeneity: not applicable
Test for overall effect: Z = 2.86 (P = 0.0043)
2 Lower-income setting
Subtotal (95% CI) 0 0 Not estimable
Total events: 0 (Active management), 0 (Expectant management)
Heterogeneity: not applicable
Test for overall effect: not applicable
Total (95% CI) 705 724 100.0 % 2.53 [ 1.34, 4.78 ]
Total events: 32 (Active management), 13 (Expectant management)
Heterogeneity: not applicable
Test for overall effect: Z = 2.86 (P = 0.0043)
Test for subgroup differences: Not applicable
0.01 0.1 1 10 100
Favours active Favours expectant
105Active versus expectant management for women in the third stage of labour (Review)
Copyright © 2019 The Cochrane Collaboration. Published by John Wiley & Sons, Ltd.
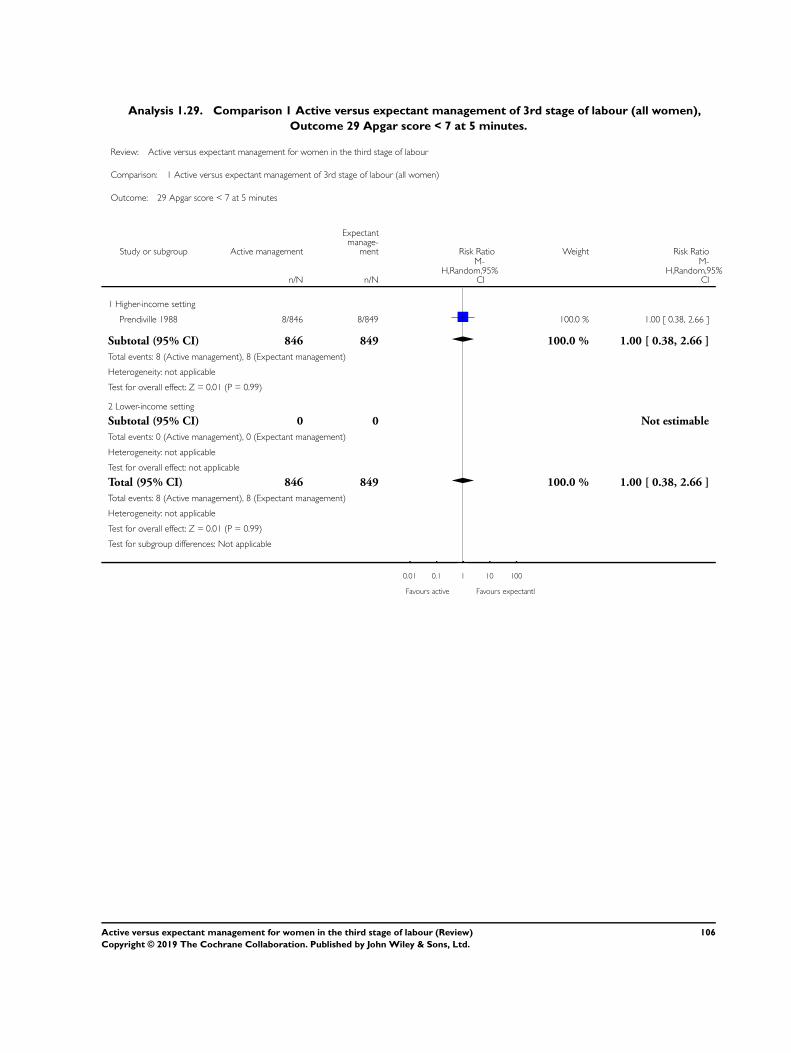
Analysis 1.29. Comparison 1 Active versus expectant management of 3rd stage of labour (all women),
Outcome 29 Apgar score < 7 at 5 minutes.
Review: Active versus expectant management for women in the third stage of labour
Comparison: 1 Active versus expectant management of 3rd stage of labour (all women)
Outcome: 29 Apgar score < 7 at 5 minutes
Study or subgroup Active management
Expectantmanage-
ment Risk Ratio Weight Risk Ratio
n/N n/N
M-H,Random,95%
CI
M-H,Random,95%
CI
1 Higher-income setting
Prendiville 1988 8/846 8/849 100.0 % 1.00 [ 0.38, 2.66 ]
Subtotal (95% CI) 846 849 100.0 % 1.00 [ 0.38, 2.66 ]
Total events: 8 (Active management), 8 (Expectant management)
Heterogeneity: not applicable
Test for overall effect: Z = 0.01 (P = 0.99)
2 Lower-income setting
Subtotal (95% CI) 0 0 Not estimable
Total events: 0 (Active management), 0 (Expectant management)
Heterogeneity: not applicable
Test for overall effect: not applicable
Total (95% CI) 846 849 100.0 % 1.00 [ 0.38, 2.66 ]
Total events: 8 (Active management), 8 (Expectant management)
Heterogeneity: not applicable
Test for overall effect: Z = 0.01 (P = 0.99)
Test for subgroup differences: Not applicable
0.01 0.1 1 10 100
Favours active Favours expectantl
106Active versus expectant management for women in the third stage of labour (Review)
Copyright © 2019 The Cochrane Collaboration. Published by John Wiley & Sons, Ltd.

Analysis 1.30. Comparison 1 Active versus expectant management of 3rd stage of labour (all women),
Outcome 30 Birthweight.
Review: Active versus expectant management for women in the third stage of labour
Comparison: 1 Active versus expectant management of 3rd stage of labour (all women)
Outcome: 30 Birthweight
Study or subgroup Active management
Expectantmanage-
mentMean
Difference WeightMean
Difference
N Mean(SD)[g] N Mean(SD)[g] IV,Random,95% CI IV,Random,95% CI
1 Higher-income setting
Prendiville 1988 846 3337 (451) 849 3422 (444) 55.0 % -85.00 [ -127.61, -42.39 ]
Rogers 1998 748 3454 (465) 764 3521 (470) 45.0 % -67.00 [ -114.13, -19.87 ]
Subtotal (95% CI) 1594 1613 100.0 % -76.90 [ -108.51, -45.30 ]
Heterogeneity: Tau2 = 0.0; Chi2 = 0.31, df = 1 (P = 0.58); I2 =0.0%
Test for overall effect: Z = 4.77 (P < 0.00001)
2 Lower-income setting
Subtotal (95% CI) 0 0 Not estimable
Heterogeneity: not applicable
Test for overall effect: not applicable
Total (95% CI) 1594 1613 100.0 % -76.90 [ -108.51, -45.30 ]
Heterogeneity: Tau2 = 0.0; Chi2 = 0.31, df = 1 (P = 0.58); I2 =0.0%
Test for overall effect: Z = 4.77 (P < 0.00001)
Test for subgroup differences: Not applicable
-100 -50 0 50 100
Favours expectant Favours active
107Active versus expectant management for women in the third stage of labour (Review)
Copyright © 2019 The Cochrane Collaboration. Published by John Wiley & Sons, Ltd.

Analysis 1.38. Comparison 1 Active versus expectant management of 3rd stage of labour (all women),
Outcome 38 Exclusive breastfeeding at discharge from hospital.
Review: Active versus expectant management for women in the third stage of labour
Comparison: 1 Active versus expectant management of 3rd stage of labour (all women)
Outcome: 38 Exclusive breastfeeding at discharge from hospital
Study or subgroup Active management
Expectantmanage-
ment Risk Ratio Weight Risk Ratio
n/N n/N
M-H,Random,95%
CI
M-H,Random,95%
CI
1 Higher-income setting
Prendiville 1988 637/846 632/849 100.0 % 1.01 [ 0.96, 1.07 ]
Subtotal (95% CI) 846 849 100.0 % 1.01 [ 0.96, 1.07 ]
Total events: 637 (Active management), 632 (Expectant management)
Heterogeneity: not applicable
Test for overall effect: Z = 0.41 (P = 0.68)
2 Lower-income setting
Subtotal (95% CI) 0 0 Not estimable
Total events: 0 (Active management), 0 (Expectant management)
Heterogeneity: not applicable
Test for overall effect: not applicable
Total (95% CI) 846 849 100.0 % 1.01 [ 0.96, 1.07 ]
Total events: 637 (Active management), 632 (Expectant management)
Heterogeneity: not applicable
Test for overall effect: Z = 0.41 (P = 0.68)
Test for subgroup differences: Not applicable
0.01 0.1 1 10 100
Favours expectant Favours active
108Active versus expectant management for women in the third stage of labour (Review)
Copyright © 2019 The Cochrane Collaboration. Published by John Wiley & Sons, Ltd.

Analysis 1.40. Comparison 1 Active versus expectant management of 3rd stage of labour (all women),
Outcome 40 Return to hospital as in- or outpatient because of bleeding (not pre-specified).
Review: Active versus expectant management for women in the third stage of labour
Comparison: 1 Active versus expectant management of 3rd stage of labour (all women)
Outcome: 40 Return to hospital as in- or outpatient because of bleeding (not pre-specified)
Study or subgroup Active management
Expectantmanage-
ment Risk Ratio Weight Risk Ratio
n/N n/N
M-H,Random,95%
CI
M-H,Random,95%
CI
1 Higher-income setting
Begley 1990 29/705 14/724 73.1 % 2.13 [ 1.13, 3.99 ]
Rogers 1998 12/748 5/764 26.9 % 2.45 [ 0.87, 6.92 ]
Subtotal (95% CI) 1453 1488 100.0 % 2.21 [ 1.29, 3.79 ]
Total events: 41 (Active management), 19 (Expectant management)
Heterogeneity: Tau2 = 0.0; Chi2 = 0.05, df = 1 (P = 0.82); I2 =0.0%
Test for overall effect: Z = 2.89 (P = 0.0039)
2 Lower-income setting
Subtotal (95% CI) 0 0 Not estimable
Total events: 0 (Active management), 0 (Expectant management)
Heterogeneity: not applicable
Test for overall effect: not applicable
Total (95% CI) 1453 1488 100.0 % 2.21 [ 1.29, 3.79 ]
Total events: 41 (Active management), 19 (Expectant management)
Heterogeneity: Tau2 = 0.0; Chi2 = 0.05, df = 1 (P = 0.82); I2 =0.0%
Test for overall effect: Z = 2.89 (P = 0.0039)
Test for subgroup differences: Not applicable
0.01 0.1 1 10 100
Favours active Favours expectant
109Active versus expectant management for women in the third stage of labour (Review)
Copyright © 2019 The Cochrane Collaboration. Published by John Wiley & Sons, Ltd.

Analysis 1.41. Comparison 1 Active versus expectant management of 3rd stage of labour (all women),
Outcome 41 Postnatal maternal mean Hb (outcome not pre-specified).
Review: Active versus expectant management for women in the third stage of labour
Comparison: 1 Active versus expectant management of 3rd stage of labour (all women)
Outcome: 41 Postnatal maternal mean Hb (outcome not pre-specified)
Study or subgroup Active management
Expectantmanage-
mentMean
Difference WeightMean
Difference
N Mean(SD) N Mean(SD) IV,Random,95% CI IV,Random,95% CI
1 Higher-income setting
Begley 1990 618 12.59 (1.13) 645 12.09 (1.23) 40.3 % 0.50 [ 0.37, 0.63 ]
Prendiville 1988 685 11.7 (2.2) 694 11.1 (1.4) 18.0 % 0.60 [ 0.41, 0.79 ]
Rogers 1998 702 11.2 (1.06) 718 10.7 (1.38) 41.8 % 0.50 [ 0.37, 0.63 ]
Subtotal (95% CI) 2005 2057 100.0 % 0.52 [ 0.44, 0.60 ]
Heterogeneity: Tau2 = 0.0; Chi2 = 0.83, df = 2 (P = 0.66); I2 =0.0%
Test for overall effect: Z = 12.29 (P < 0.00001)
2 Lower-income setting
Subtotal (95% CI) 0 0 Not estimable
Heterogeneity: not applicable
Test for overall effect: not applicable
Total (95% CI) 2005 2057 100.0 % 0.52 [ 0.44, 0.60 ]
Heterogeneity: Tau2 = 0.0; Chi2 = 0.83, df = 2 (P = 0.66); I2 =0.0%
Test for overall effect: Z = 12.29 (P < 0.00001)
Test for subgroup differences: Not applicable
-4 -2 0 2 4
Favours expectant Favours active
110Active versus expectant management for women in the third stage of labour (Review)
Copyright © 2019 The Cochrane Collaboration. Published by John Wiley & Sons, Ltd.

Analysis 2.1. Comparison 2 Active versus expectant management of 3rd stage of labour (women at low risk),
Outcome 1 Severe primary PPH at time of birth (clinically estimated or measured blood loss ≥ 1000 mL).
Review: Active versus expectant management for women in the third stage of labour
Comparison: 2 Active versus expectant management of 3rd stage of labour (women at low risk)
Outcome: 1 Severe primary PPH at time of birth (clinically estimated or measured blood loss ≥ 1000 mL)
Study or subgroup Active management
Expectantmanage-
ment Risk Ratio Weight Risk Ratio
n/N n/N
M-H,Random,95%
CI
M-H,Random,95%
CI
1 Higher-income setting
Begley 1990 1/705 11/724 38.3 % 0.09 [ 0.01, 0.72 ]
Rogers 1998 13/748 20/764 61.7 % 0.66 [ 0.33, 1.32 ]
Subtotal (95% CI) 1453 1488 100.0 % 0.31 [ 0.05, 2.17 ]
Total events: 14 (Active management), 31 (Expectant management)
Heterogeneity: Tau2 = 1.46; Chi2 = 3.41, df = 1 (P = 0.06); I2 =71%
Test for overall effect: Z = 1.18 (P = 0.24)
2 Lower-income setting
Subtotal (95% CI) 0 0 Not estimable
Total events: 0 (Active management), 0 (Expectant management)
Heterogeneity: not applicable
Test for overall effect: not applicable
Total (95% CI) 1453 1488 100.0 % 0.31 [ 0.05, 2.17 ]
Total events: 14 (Active management), 31 (Expectant management)
Heterogeneity: Tau2 = 1.46; Chi2 = 3.41, df = 1 (P = 0.06); I2 =71%
Test for overall effect: Z = 1.18 (P = 0.24)
Test for subgroup differences: Not applicable
0.01 0.1 1 10 100
Favours active Favours expectant
111Active versus expectant management for women in the third stage of labour (Review)
Copyright © 2019 The Cochrane Collaboration. Published by John Wiley & Sons, Ltd.

Analysis 2.4. Comparison 2 Active versus expectant management of 3rd stage of labour (women at low
risk), Outcome 4 Maternal Hb < 9 g/dL at 24-72 hr.
Review: Active versus expectant management for women in the third stage of labour
Comparison: 2 Active versus expectant management of 3rd stage of labour (women at low risk)
Outcome: 4 Maternal Hb < 9 g/dL at 24-72 hr
Study or subgroup Active management
Expectantmanage-
ment Risk Ratio Weight Risk Ratio
n/N n/N
M-H,Random,95%
CI
M-H,Random,95%
CI
1 Higher-income setting
Thilaganathan 1993 1/103 5/90 100.0 % 0.17 [ 0.02, 1.47 ]
Subtotal (95% CI) 103 90 100.0 % 0.17 [ 0.02, 1.47 ]
Total events: 1 (Active management), 5 (Expectant management)
Heterogeneity: not applicable
Test for overall effect: Z = 1.61 (P = 0.11)
2 Lower-income setting
Subtotal (95% CI) 0 0 Not estimable
Total events: 0 (Active management), 0 (Expectant management)
Heterogeneity: not applicable
Test for overall effect: not applicable
Total (95% CI) 103 90 100.0 % 0.17 [ 0.02, 1.47 ]
Total events: 1 (Active management), 5 (Expectant management)
Heterogeneity: not applicable
Test for overall effect: Z = 1.61 (P = 0.11)
Test for subgroup differences: Not applicable
0.01 0.1 1 10 100
Favours active Favours expectant
112Active versus expectant management for women in the third stage of labour (Review)
Copyright © 2019 The Cochrane Collaboration. Published by John Wiley & Sons, Ltd.

Analysis 2.5. Comparison 2 Active versus expectant management of 3rd stage of labour (women at low
risk), Outcome 5 Admission to neonatal special/intensive care.
Review: Active versus expectant management for women in the third stage of labour
Comparison: 2 Active versus expectant management of 3rd stage of labour (women at low risk)
Outcome: 5 Admission to neonatal special/intensive care
Study or subgroup Active management
Expectantmanage-
ment Risk Ratio Weight Risk Ratio
n/N n/N
M-H,Random,95%
CI
M-H,Random,95%
CI
1 Higher-income setting
Rogers 1998 20/748 20/764 100.0 % 1.02 [ 0.55, 1.88 ]
Subtotal (95% CI) 748 764 100.0 % 1.02 [ 0.55, 1.88 ]
Total events: 20 (Active management), 20 (Expectant management)
Heterogeneity: not applicable
Test for overall effect: Z = 0.07 (P = 0.95)
2 Lower-income setting
Subtotal (95% CI) 0 0 Not estimable
Total events: 0 (Active management), 0 (Expectant management)
Heterogeneity: not applicable
Test for overall effect: not applicable
Total (95% CI) 748 764 100.0 % 1.02 [ 0.55, 1.88 ]
Total events: 20 (Active management), 20 (Expectant management)
Heterogeneity: not applicable
Test for overall effect: Z = 0.07 (P = 0.95)
Test for subgroup differences: Not applicable
0.01 0.1 1 10 100
Favours active Favours expectant
113Active versus expectant management for women in the third stage of labour (Review)
Copyright © 2019 The Cochrane Collaboration. Published by John Wiley & Sons, Ltd.
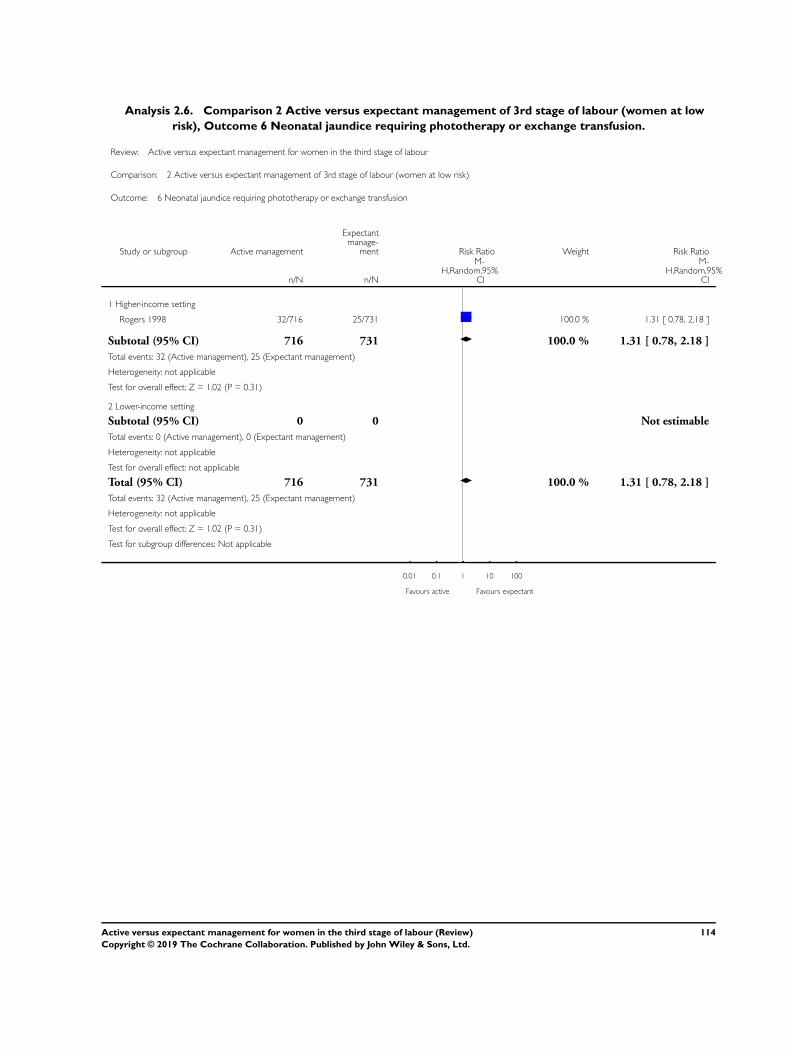
Analysis 2.6. Comparison 2 Active versus expectant management of 3rd stage of labour (women at low
risk), Outcome 6 Neonatal jaundice requiring phototherapy or exchange transfusion.
Review: Active versus expectant management for women in the third stage of labour
Comparison: 2 Active versus expectant management of 3rd stage of labour (women at low risk)
Outcome: 6 Neonatal jaundice requiring phototherapy or exchange transfusion
Study or subgroup Active management
Expectantmanage-
ment Risk Ratio Weight Risk Ratio
n/N n/N
M-H,Random,95%
CI
M-H,Random,95%
CI
1 Higher-income setting
Rogers 1998 32/716 25/731 100.0 % 1.31 [ 0.78, 2.18 ]
Subtotal (95% CI) 716 731 100.0 % 1.31 [ 0.78, 2.18 ]
Total events: 32 (Active management), 25 (Expectant management)
Heterogeneity: not applicable
Test for overall effect: Z = 1.02 (P = 0.31)
2 Lower-income setting
Subtotal (95% CI) 0 0 Not estimable
Total events: 0 (Active management), 0 (Expectant management)
Heterogeneity: not applicable
Test for overall effect: not applicable
Total (95% CI) 716 731 100.0 % 1.31 [ 0.78, 2.18 ]
Total events: 32 (Active management), 25 (Expectant management)
Heterogeneity: not applicable
Test for overall effect: Z = 1.02 (P = 0.31)
Test for subgroup differences: Not applicable
0.01 0.1 1 10 100
Favours active Favours expectant
114Active versus expectant management for women in the third stage of labour (Review)
Copyright © 2019 The Cochrane Collaboration. Published by John Wiley & Sons, Ltd.

Analysis 2.10. Comparison 2 Active versus expectant management of 3rd stage of labour (women at low
risk), Outcome 10 Primary blood loss ≥ 500 mL at time of birth (clinically estimated or measured).
Review: Active versus expectant management for women in the third stage of labour
Comparison: 2 Active versus expectant management of 3rd stage of labour (women at low risk)
Outcome: 10 Primary blood loss ≥ 500 mL at time of birth (clinically estimated or measured)
Study or subgroup Active management
Expectantmanage-
ment Risk Ratio Weight Risk Ratio
n/N n/N
M-H,Random,95%
CI
M-H,Random,95%
CI
1 Higher-income setting
Begley 1990 14/705 60/724 39.9 % 0.24 [ 0.14, 0.42 ]
Rogers 1998 51/748 126/764 60.1 % 0.41 [ 0.30, 0.56 ]
Subtotal (95% CI) 1453 1488 100.0 % 0.33 [ 0.20, 0.56 ]
Total events: 65 (Active management), 186 (Expectant management)
Heterogeneity: Tau2 = 0.10; Chi2 = 2.73, df = 1 (P = 0.10); I2 =63%
Test for overall effect: Z = 4.10 (P = 0.000041)
2 Lower-income setting
Subtotal (95% CI) 0 0 Not estimable
Total events: 0 (Active management), 0 (Expectant management)
Heterogeneity: not applicable
Test for overall effect: not applicable
Total (95% CI) 1453 1488 100.0 % 0.33 [ 0.20, 0.56 ]
Total events: 65 (Active management), 186 (Expectant management)
Heterogeneity: Tau2 = 0.10; Chi2 = 2.73, df = 1 (P = 0.10); I2 =63%
Test for overall effect: Z = 4.10 (P = 0.000041)
Test for subgroup differences: Not applicable
0.01 0.1 1 10 100
Favours active Favours expectant
115Active versus expectant management for women in the third stage of labour (Review)
Copyright © 2019 The Cochrane Collaboration. Published by John Wiley & Sons, Ltd.

Analysis 2.13. Comparison 2 Active versus expectant management of 3rd stage of labour (women at low
risk), Outcome 13 Mean maternal blood loss (mL at the time of birth, clinically estimated or measured.
Review: Active versus expectant management for women in the third stage of labour
Comparison: 2 Active versus expectant management of 3rd stage of labour (women at low risk)
Outcome: 13 Mean maternal blood loss (mL at the time of birth, clinically estimated or measured
Study or subgroup Active management
Expectantmanage-
mentMean
Difference WeightMean
Difference
N Mean(SD) N Mean(SD) IV,Random,95% CI IV,Random,95% CI
1 Higher-income setting
Begley 1990 705 148.9 (127.1) 724 234.8 (223.9) 60.3 % -85.90 [ -104.72, -67.08 ]
Rogers 1998 748 268.5 (246.1) 764 336.5 (243.2) 39.7 % -68.00 [ -92.67, -43.33 ]
Subtotal (95% CI) 1453 1488 100.0 % -78.80 [ -95.96, -61.64 ]
Heterogeneity: Tau2 = 34.93; Chi2 = 1.28, df = 1 (P = 0.26); I2 =22%
Test for overall effect: Z = 9.00 (P < 0.00001)
2 Lower-income setting
Subtotal (95% CI) 0 0 Not estimable
Heterogeneity: not applicable
Test for overall effect: not applicable
Total (95% CI) 1453 1488 100.0 % -78.80 [ -95.96, -61.64 ]
Heterogeneity: Tau2 = 34.93; Chi2 = 1.28, df = 1 (P = 0.26); I2 =22%
Test for overall effect: Z = 9.00 (P < 0.00001)
Test for subgroup differences: Not applicable
-100 -50 0 50 100
Favours active Favours expectant
116Active versus expectant management for women in the third stage of labour (Review)
Copyright © 2019 The Cochrane Collaboration. Published by John Wiley & Sons, Ltd.

Analysis 2.16. Comparison 2 Active versus expectant management of 3rd stage of labour (women at low
risk), Outcome 16 Maternal blood transfusion.
Review: Active versus expectant management for women in the third stage of labour
Comparison: 2 Active versus expectant management of 3rd stage of labour (women at low risk)
Outcome: 16 Maternal blood transfusion
Study or subgroup Active management
Expectantmanage-
ment Risk Ratio Weight Risk Ratio
n/N n/N
M-H,Random,95%
CI
M-H,Random,95%
CI
1 Higher-income setting
Begley 1990 1/705 3/724 20.5 % 0.34 [ 0.04, 3.28 ]
Rogers 1998 4/748 20/764 68.7 % 0.20 [ 0.07, 0.59 ]
Thilaganathan 1993 1/103 0/90 10.8 % 2.63 [ 0.11, 63.64 ]
Subtotal (95% CI) 1556 1578 100.0 % 0.30 [ 0.10, 0.88 ]
Total events: 6 (Active management), 23 (Expectant management)
Heterogeneity: Tau2 = 0.14; Chi2 = 2.26, df = 2 (P = 0.32); I2 =11%
Test for overall effect: Z = 2.20 (P = 0.028)
2 Lower-income setting
Subtotal (95% CI) 0 0 Not estimable
Total events: 0 (Active management), 0 (Expectant management)
Heterogeneity: not applicable
Test for overall effect: not applicable
Total (95% CI) 1556 1578 100.0 % 0.30 [ 0.10, 0.88 ]
Total events: 6 (Active management), 23 (Expectant management)
Heterogeneity: Tau2 = 0.14; Chi2 = 2.26, df = 2 (P = 0.32); I2 =11%
Test for overall effect: Z = 2.20 (P = 0.028)
Test for subgroup differences: Not applicable
0.01 0.1 1 10 100
Favours active Favours expectant
117Active versus expectant management for women in the third stage of labour (Review)
Copyright © 2019 The Cochrane Collaboration. Published by John Wiley & Sons, Ltd.

Analysis 2.18. Comparison 2 Active versus expectant management of 3rd stage of labour (women at low
risk), Outcome 18 Therapeutic uterotonics during third stage and/or within 24 hours.
Review: Active versus expectant management for women in the third stage of labour
Comparison: 2 Active versus expectant management of 3rd stage of labour (women at low risk)
Outcome: 18 Therapeutic uterotonics during third stage and/or within 24 hours
Study or subgroup Active management
Expectantmanage-
ment Risk Ratio Weight Risk Ratio
n/N n/N
M-H,Random,95%
CI
M-H,Random,95%
CI
1 Higher-income setting
Begley 1990 14/705 93/724 35.4 % 0.15 [ 0.09, 0.27 ]
Rogers 1998 24/748 161/764 62.1 % 0.15 [ 0.10, 0.23 ]
Thilaganathan 1993 1/103 7/90 2.5 % 0.12 [ 0.02, 1.00 ]
Subtotal (95% CI) 1556 1578 100.0 % 0.15 [ 0.11, 0.21 ]
Total events: 39 (Active management), 261 (Expectant management)
Heterogeneity: Tau2 = 0.0; Chi2 = 0.04, df = 2 (P = 0.98); I2 =0.0%
Test for overall effect: Z = 11.23 (P < 0.00001)
2 Lower-income setting
Subtotal (95% CI) 0 0 Not estimable
Total events: 0 (Active management), 0 (Expectant management)
Heterogeneity: not applicable
Test for overall effect: not applicable
Total (95% CI) 1556 1578 100.0 % 0.15 [ 0.11, 0.21 ]
Total events: 39 (Active management), 261 (Expectant management)
Heterogeneity: Tau2 = 0.0; Chi2 = 0.04, df = 2 (P = 0.98); I2 =0.0%
Test for overall effect: Z = 11.23 (P < 0.00001)
Test for subgroup differences: Not applicable
0.01 0.1 1 10 100
Favours active Favours expectant
118Active versus expectant management for women in the third stage of labour (Review)
Copyright © 2019 The Cochrane Collaboration. Published by John Wiley & Sons, Ltd.

Analysis 2.19. Comparison 2 Active versus expectant management of 3rd stage of labour (women at low
risk), Outcome 19 Mean length of third stage.
Review: Active versus expectant management for women in the third stage of labour
Comparison: 2 Active versus expectant management of 3rd stage of labour (women at low risk)
Outcome: 19 Mean length of third stage
Study or subgroup Active management
Expectantmanage-
mentMean
Difference WeightMean
Difference
N Mean(SD)[min] N Mean(SD)[min] IV,Random,95% CI IV,Random,95% CI
1 Higher-income setting
Begley 1990 705 11.26 (19.62) 724 11.56 (8.41) 100.0 % -0.30 [ -1.87, 1.27 ]
Subtotal (95% CI) 705 724 100.0 % -0.30 [ -1.87, 1.27 ]
Heterogeneity: not applicable
Test for overall effect: Z = 0.37 (P = 0.71)
2 Lower-income setting
Subtotal (95% CI) 0 0 Not estimable
Heterogeneity: not applicable
Test for overall effect: not applicable
Total (95% CI) 705 724 100.0 % -0.30 [ -1.87, 1.27 ]
Heterogeneity: not applicable
Test for overall effect: Z = 0.37 (P = 0.71)
Test for subgroup differences: Not applicable
-100 -50 0 50 100
Favours active Favours expectant
119Active versus expectant management for women in the third stage of labour (Review)
Copyright © 2019 The Cochrane Collaboration. Published by John Wiley & Sons, Ltd.

Analysis 2.20. Comparison 2 Active versus expectant management of 3rd stage of labour (women at low
risk), Outcome 20 Manual removal of placenta as defined by study authors.
Review: Active versus expectant management for women in the third stage of labour
Comparison: 2 Active versus expectant management of 3rd stage of labour (women at low risk)
Outcome: 20 Manual removal of placenta as defined by study authors
Study or subgroup Active management
Expectantmanage-
ment Risk Ratio Weight Risk Ratio
n/N n/N
M-H,Random,95%
CI
M-H,Random,95%
CI
1 Higher-income setting
Begley 1990 19/705 1/724 33.0 % 19.51 [ 2.62, 145.36 ]
Rogers 1998 15/748 13/764 44.0 % 1.18 [ 0.56, 2.46 ]
Thilaganathan 1993 1/103 0/90 22.9 % 2.63 [ 0.11, 63.64 ]
Subtotal (95% CI) 1556 1578 100.0 % 3.58 [ 0.42, 30.61 ]
Total events: 35 (Active management), 14 (Expectant management)
Heterogeneity: Tau2 = 2.58; Chi2 = 8.01, df = 2 (P = 0.02); I2 =75%
Test for overall effect: Z = 1.16 (P = 0.24)
2 Lower-income setting
Subtotal (95% CI) 0 0 Not estimable
Total events: 0 (Active management), 0 (Expectant management)
Heterogeneity: not applicable
Test for overall effect: not applicable
Total (95% CI) 1556 1578 100.0 % 3.58 [ 0.42, 30.61 ]
Total events: 35 (Active management), 14 (Expectant management)
Heterogeneity: Tau2 = 2.58; Chi2 = 8.01, df = 2 (P = 0.02); I2 =75%
Test for overall effect: Z = 1.16 (P = 0.24)
Test for subgroup differences: Not applicable
0.01 0.1 1 10 100
Favours active Favours expectant
120Active versus expectant management for women in the third stage of labour (Review)
Copyright © 2019 The Cochrane Collaboration. Published by John Wiley & Sons, Ltd.
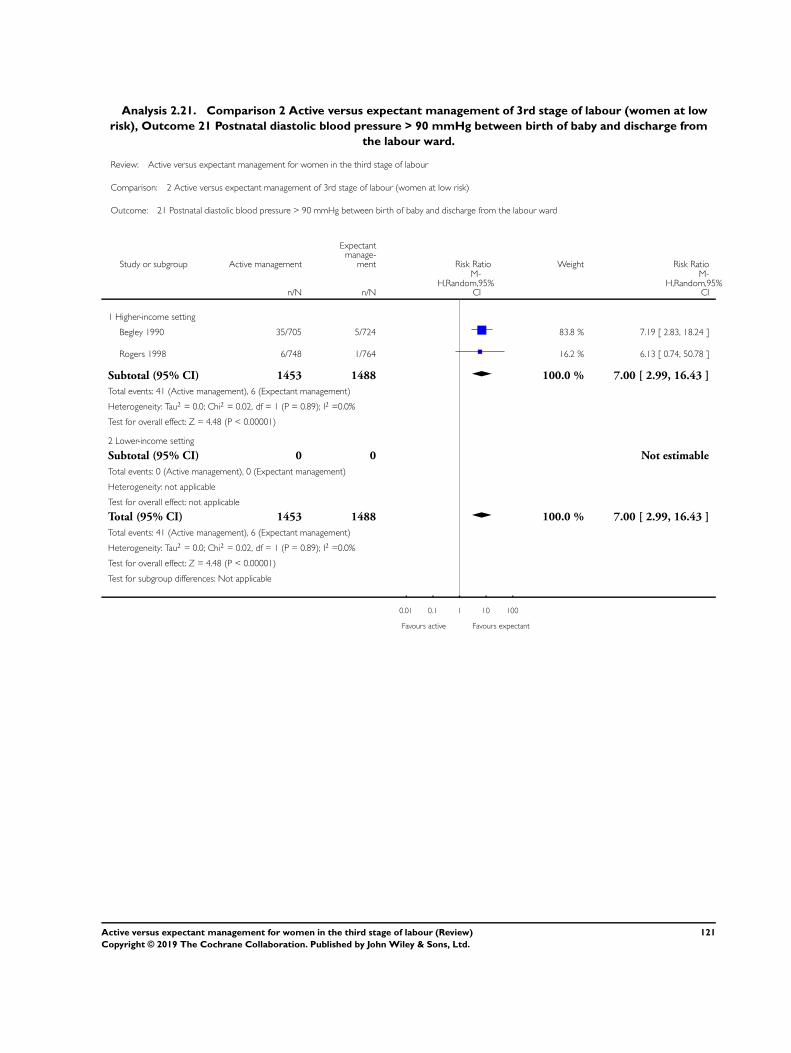
Analysis 2.21. Comparison 2 Active versus expectant management of 3rd stage of labour (women at low
risk), Outcome 21 Postnatal diastolic blood pressure > 90 mmHg between birth of baby and discharge from
the labour ward.
Review: Active versus expectant management for women in the third stage of labour
Comparison: 2 Active versus expectant management of 3rd stage of labour (women at low risk)
Outcome: 21 Postnatal diastolic blood pressure > 90 mmHg between birth of baby and discharge from the labour ward
Study or subgroup Active management
Expectantmanage-
ment Risk Ratio Weight Risk Ratio
n/N n/N
M-H,Random,95%
CI
M-H,Random,95%
CI
1 Higher-income setting
Begley 1990 35/705 5/724 83.8 % 7.19 [ 2.83, 18.24 ]
Rogers 1998 6/748 1/764 16.2 % 6.13 [ 0.74, 50.78 ]
Subtotal (95% CI) 1453 1488 100.0 % 7.00 [ 2.99, 16.43 ]
Total events: 41 (Active management), 6 (Expectant management)
Heterogeneity: Tau2 = 0.0; Chi2 = 0.02, df = 1 (P = 0.89); I2 =0.0%
Test for overall effect: Z = 4.48 (P < 0.00001)
2 Lower-income setting
Subtotal (95% CI) 0 0 Not estimable
Total events: 0 (Active management), 0 (Expectant management)
Heterogeneity: not applicable
Test for overall effect: not applicable
Total (95% CI) 1453 1488 100.0 % 7.00 [ 2.99, 16.43 ]
Total events: 41 (Active management), 6 (Expectant management)
Heterogeneity: Tau2 = 0.0; Chi2 = 0.02, df = 1 (P = 0.89); I2 =0.0%
Test for overall effect: Z = 4.48 (P < 0.00001)
Test for subgroup differences: Not applicable
0.01 0.1 1 10 100
Favours active Favours expectant
121Active versus expectant management for women in the third stage of labour (Review)
Copyright © 2019 The Cochrane Collaboration. Published by John Wiley & Sons, Ltd.

Analysis 2.22. Comparison 2 Active versus expectant management of 3rd stage of labour (women at low
risk), Outcome 22 Postnatal vomiting between birth of baby and discharge from the labour ward..
Review: Active versus expectant management for women in the third stage of labour
Comparison: 2 Active versus expectant management of 3rd stage of labour (women at low risk)
Outcome: 22 Postnatal vomiting between birth of baby and discharge from the labour ward.
Study or subgroup Active management
Expectantmanage-
ment Risk Ratio Weight Risk Ratio
n/N n/N
M-H,Random,95%
CI
M-H,Random,95%
CI
1 Higher-income setting
Begley 1990 12/705 0/724 31.3 % 25.67 [ 1.52, 432.78 ]
Rogers 1998 47/748 17/764 68.7 % 2.82 [ 1.64, 4.87 ]
Subtotal (95% CI) 1453 1488 100.0 % 5.63 [ 0.69, 46.08 ]
Total events: 59 (Active management), 17 (Expectant management)
Heterogeneity: Tau2 = 1.60; Chi2 = 2.48, df = 1 (P = 0.12); I2 =60%
Test for overall effect: Z = 1.61 (P = 0.11)
2 Lower-income setting
Subtotal (95% CI) 0 0 Not estimable
Total events: 0 (Active management), 0 (Expectant management)
Heterogeneity: not applicable
Test for overall effect: not applicable
Total (95% CI) 1453 1488 100.0 % 5.63 [ 0.69, 46.08 ]
Total events: 59 (Active management), 17 (Expectant management)
Heterogeneity: Tau2 = 1.60; Chi2 = 2.48, df = 1 (P = 0.12); I2 =60%
Test for overall effect: Z = 1.61 (P = 0.11)
Test for subgroup differences: Not applicable
0.01 0.1 1 10 100
Favours active Favours expectant
122Active versus expectant management for women in the third stage of labour (Review)
Copyright © 2019 The Cochrane Collaboration. Published by John Wiley & Sons, Ltd.

Analysis 2.23. Comparison 2 Active versus expectant management of 3rd stage of labour (women at low
risk), Outcome 23 Any analgesia between birth of the baby and up to discharge from labour ward.
Review: Active versus expectant management for women in the third stage of labour
Comparison: 2 Active versus expectant management of 3rd stage of labour (women at low risk)
Outcome: 23 Any analgesia between birth of the baby and up to discharge from labour ward
Study or subgroup Active management
Expectantmanage-
ment Risk Ratio Weight Risk Ratio
n/N n/N
M-H,Random,95%
CI
M-H,Random,95%
CI
1 Higher-income setting
Begley 1990 32/705 13/724 100.0 % 2.53 [ 1.34, 4.78 ]
Subtotal (95% CI) 705 724 100.0 % 2.53 [ 1.34, 4.78 ]
Total events: 32 (Active management), 13 (Expectant management)
Heterogeneity: not applicable
Test for overall effect: Z = 2.86 (P = 0.0043)
2 Lower-income setting
Subtotal (95% CI) 0 0 Not estimable
Total events: 0 (Active management), 0 (Expectant management)
Heterogeneity: not applicable
Test for overall effect: not applicable
Total (95% CI) 705 724 100.0 % 2.53 [ 1.34, 4.78 ]
Total events: 32 (Active management), 13 (Expectant management)
Heterogeneity: not applicable
Test for overall effect: Z = 2.86 (P = 0.0043)
Test for subgroup differences: Not applicable
0.01 0.1 1 10 100
Favours active Favours expectant
123Active versus expectant management for women in the third stage of labour (Review)
Copyright © 2019 The Cochrane Collaboration. Published by John Wiley & Sons, Ltd.

Analysis 2.25. Comparison 2 Active versus expectant management of 3rd stage of labour (women at low
risk), Outcome 25 Secondary blood loss/any vaginal bleeding needing treatment (after 24 hours and up to 6
weeks).
Review: Active versus expectant management for women in the third stage of labour
Comparison: 2 Active versus expectant management of 3rd stage of labour (women at low risk)
Outcome: 25 Secondary blood loss/any vaginal bleeding needing treatment (after 24 hours and up to 6 weeks)
Study or subgroup Active management
Expectantmanage-
ment Risk Ratio Weight Risk Ratio
n/N n/N
M-H,Random,95%
CI
M-H,Random,95%
CI
1 Higher-income setting
Begley 1990 35/705 12/724 46.4 % 3.00 [ 1.57, 5.72 ]
Rogers 1998 48/748 43/764 53.6 % 1.14 [ 0.77, 1.70 ]
Subtotal (95% CI) 1453 1488 100.0 % 1.78 [ 0.69, 4.60 ]
Total events: 83 (Active management), 55 (Expectant management)
Heterogeneity: Tau2 = 0.39; Chi2 = 6.24, df = 1 (P = 0.01); I2 =84%
Test for overall effect: Z = 1.20 (P = 0.23)
2 Lower-income setting
Subtotal (95% CI) 0 0 Not estimable
Total events: 0 (Active management), 0 (Expectant management)
Heterogeneity: not applicable
Test for overall effect: not applicable
Total (95% CI) 1453 1488 100.0 % 1.78 [ 0.69, 4.60 ]
Total events: 83 (Active management), 55 (Expectant management)
Heterogeneity: Tau2 = 0.39; Chi2 = 6.24, df = 1 (P = 0.01); I2 =84%
Test for overall effect: Z = 1.20 (P = 0.23)
Test for subgroup differences: Not applicable
0.01 0.1 1 10 100
Favours active Favours expectant
124Active versus expectant management for women in the third stage of labour (Review)
Copyright © 2019 The Cochrane Collaboration. Published by John Wiley & Sons, Ltd.

Analysis 2.27. Comparison 2 Active versus expectant management of 3rd stage of labour (women at low
risk), Outcome 27 Surgical evacuation of retained products of conception.
Review: Active versus expectant management for women in the third stage of labour
Comparison: 2 Active versus expectant management of 3rd stage of labour (women at low risk)
Outcome: 27 Surgical evacuation of retained products of conception
Study or subgroup Active management
Expectantmanage-
ment Risk Ratio Weight Risk Ratio
n/N n/N
M-H,Random,95%
CI
M-H,Random,95%
CI
1 Higher-income setting
Begley 1990 2/705 8/724 44.6 % 0.26 [ 0.05, 1.20 ]
Rogers 1998 9/748 6/764 55.4 % 1.53 [ 0.55, 4.28 ]
Subtotal (95% CI) 1453 1488 100.0 % 0.69 [ 0.12, 3.98 ]
Total events: 11 (Active management), 14 (Expectant management)
Heterogeneity: Tau2 = 1.17; Chi2 = 3.61, df = 1 (P = 0.06); I2 =72%
Test for overall effect: Z = 0.41 (P = 0.68)
2 Lower-income setting
Subtotal (95% CI) 0 0 Not estimable
Total events: 0 (Active management), 0 (Expectant management)
Heterogeneity: not applicable
Test for overall effect: not applicable
Total (95% CI) 1453 1488 100.0 % 0.69 [ 0.12, 3.98 ]
Total events: 11 (Active management), 14 (Expectant management)
Heterogeneity: Tau2 = 1.17; Chi2 = 3.61, df = 1 (P = 0.06); I2 =72%
Test for overall effect: Z = 0.41 (P = 0.68)
Test for subgroup differences: Not applicable
0.01 0.1 1 10 100
Favours active Favours expectant
125Active versus expectant management for women in the third stage of labour (Review)
Copyright © 2019 The Cochrane Collaboration. Published by John Wiley & Sons, Ltd.

Analysis 2.28. Comparison 2 Active versus expectant management of 3rd stage of labour (women at low
risk), Outcome 28 Afterpains - abdominal pain associated with the contracting uterus in the postpartum
period.
Review: Active versus expectant management for women in the third stage of labour
Comparison: 2 Active versus expectant management of 3rd stage of labour (women at low risk)
Outcome: 28 Afterpains - abdominal pain associated with the contracting uterus in the postpartum period
Study or subgroup Active management
Expectantmanage-
ment Risk Ratio Weight Risk Ratio
n/N n/N
M-H,Random,95%
CI
M-H,Random,95%
CI
1 Higher-income setting
Begley 1990 32/705 13/724 100.0 % 2.53 [ 1.34, 4.78 ]
Subtotal (95% CI) 705 724 100.0 % 2.53 [ 1.34, 4.78 ]
Total events: 32 (Active management), 13 (Expectant management)
Heterogeneity: not applicable
Test for overall effect: Z = 2.86 (P = 0.0043)
2 Lower-income setting
Subtotal (95% CI) 0 0 Not estimable
Total events: 0 (Active management), 0 (Expectant management)
Heterogeneity: not applicable
Test for overall effect: not applicable
Total (95% CI) 705 724 100.0 % 2.53 [ 1.34, 4.78 ]
Total events: 32 (Active management), 13 (Expectant management)
Heterogeneity: not applicable
Test for overall effect: Z = 2.86 (P = 0.0043)
Test for subgroup differences: Not applicable
0.01 0.1 1 10 100
Favours active Favours expectant
126Active versus expectant management for women in the third stage of labour (Review)
Copyright © 2019 The Cochrane Collaboration. Published by John Wiley & Sons, Ltd.

Analysis 2.30. Comparison 2 Active versus expectant management of 3rd stage of labour (women at low
risk), Outcome 30 Birthweight.
Review: Active versus expectant management for women in the third stage of labour
Comparison: 2 Active versus expectant management of 3rd stage of labour (women at low risk)
Outcome: 30 Birthweight
Study or subgroup Active management
Expectantmanage-
mentMean
Difference WeightMean
Difference
N Mean(SD)[g] N Mean(SD)[g] IV,Random,95% CI IV,Random,95% CI
1 Higher-income setting
Rogers 1998 748 3454 (465) 764 3521 (470) 100.0 % -67.00 [ -114.13, -19.87 ]
Subtotal (95% CI) 748 764 100.0 % -67.00 [ -114.13, -19.87 ]
Heterogeneity: not applicable
Test for overall effect: Z = 2.79 (P = 0.0053)
2 Lower-income setting
Subtotal (95% CI) 0 0 Not estimable
Heterogeneity: not applicable
Test for overall effect: not applicable
Total (95% CI) 748 764 100.0 % -67.00 [ -114.13, -19.87 ]
Heterogeneity: not applicable
Test for overall effect: Z = 2.79 (P = 0.0053)
Test for subgroup differences: Not applicable
-100 -50 0 50 100
Favours expectant Favours active
127Active versus expectant management for women in the third stage of labour (Review)
Copyright © 2019 The Cochrane Collaboration. Published by John Wiley & Sons, Ltd.

Analysis 2.40. Comparison 2 Active versus expectant management of 3rd stage of labour (women at low
risk), Outcome 40 Return to hospital as in- or outpatient because of bleeding (not pre-specified).
Review: Active versus expectant management for women in the third stage of labour
Comparison: 2 Active versus expectant management of 3rd stage of labour (women at low risk)
Outcome: 40 Return to hospital as in- or outpatient because of bleeding (not pre-specified)
Study or subgroup Active management
Expectantmanage-
ment Risk Ratio Weight Risk Ratio
n/N n/N
M-H,Random,95%
CI
M-H,Random,95%
CI
1 Higher-income setting
Begley 1990 29/705 14/724 73.1 % 2.13 [ 1.13, 3.99 ]
Rogers 1998 12/748 5/764 26.9 % 2.45 [ 0.87, 6.92 ]
Subtotal (95% CI) 1453 1488 100.0 % 2.21 [ 1.29, 3.79 ]
Total events: 41 (Active management), 19 (Expectant management)
Heterogeneity: Tau2 = 0.0; Chi2 = 0.05, df = 1 (P = 0.82); I2 =0.0%
Test for overall effect: Z = 2.89 (P = 0.0039)
2 Lower-income setting
Subtotal (95% CI) 0 0 Not estimable
Total events: 0 (Active management), 0 (Expectant management)
Heterogeneity: not applicable
Test for overall effect: not applicable
Total (95% CI) 1453 1488 100.0 % 2.21 [ 1.29, 3.79 ]
Total events: 41 (Active management), 19 (Expectant management)
Heterogeneity: Tau2 = 0.0; Chi2 = 0.05, df = 1 (P = 0.82); I2 =0.0%
Test for overall effect: Z = 2.89 (P = 0.0039)
Test for subgroup differences: Not applicable
0.01 0.1 1 10 100
Favours active Favours expectant
128Active versus expectant management for women in the third stage of labour (Review)
Copyright © 2019 The Cochrane Collaboration. Published by John Wiley & Sons, Ltd.
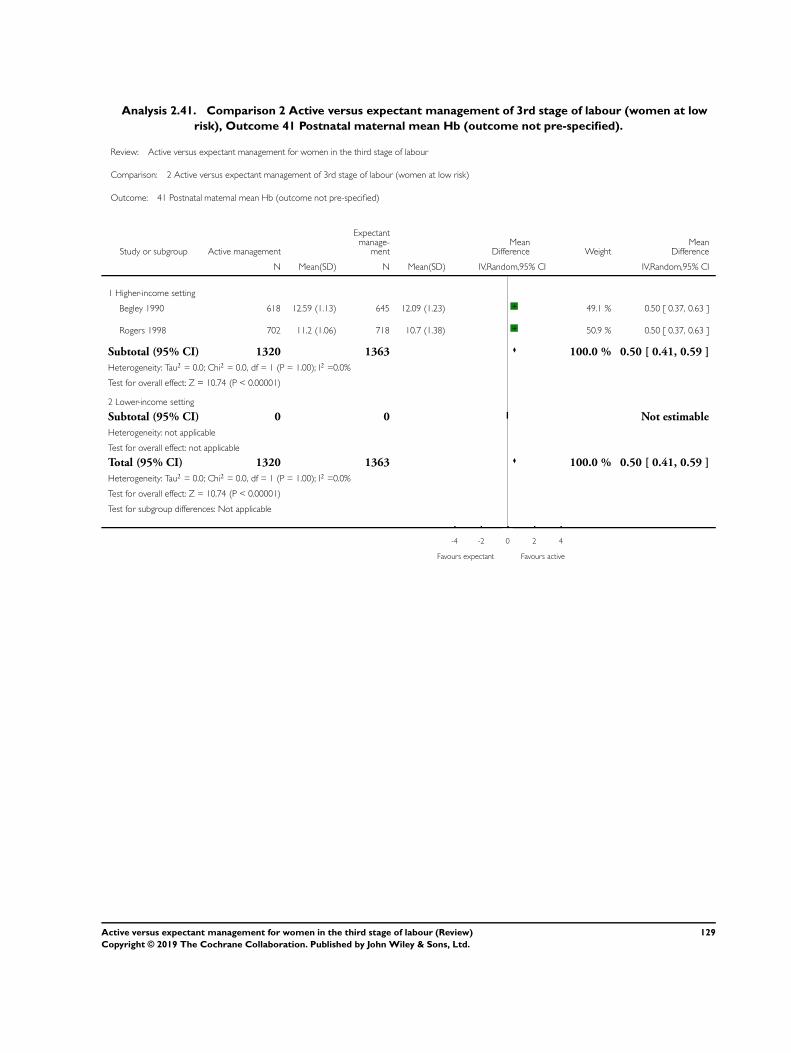
Analysis 2.41. Comparison 2 Active versus expectant management of 3rd stage of labour (women at low
risk), Outcome 41 Postnatal maternal mean Hb (outcome not pre-specified).
Review: Active versus expectant management for women in the third stage of labour
Comparison: 2 Active versus expectant management of 3rd stage of labour (women at low risk)
Outcome: 41 Postnatal maternal mean Hb (outcome not pre-specified)
Study or subgroup Active management
Expectantmanage-
mentMean
Difference WeightMean
Difference
N Mean(SD) N Mean(SD) IV,Random,95% CI IV,Random,95% CI
1 Higher-income setting
Begley 1990 618 12.59 (1.13) 645 12.09 (1.23) 49.1 % 0.50 [ 0.37, 0.63 ]
Rogers 1998 702 11.2 (1.06) 718 10.7 (1.38) 50.9 % 0.50 [ 0.37, 0.63 ]
Subtotal (95% CI) 1320 1363 100.0 % 0.50 [ 0.41, 0.59 ]
Heterogeneity: Tau2 = 0.0; Chi2 = 0.0, df = 1 (P = 1.00); I2 =0.0%
Test for overall effect: Z = 10.74 (P < 0.00001)
2 Lower-income setting
Subtotal (95% CI) 0 0 Not estimable
Heterogeneity: not applicable
Test for overall effect: not applicable
Total (95% CI) 1320 1363 100.0 % 0.50 [ 0.41, 0.59 ]
Heterogeneity: Tau2 = 0.0; Chi2 = 0.0, df = 1 (P = 1.00); I2 =0.0%
Test for overall effect: Z = 10.74 (P < 0.00001)
Test for subgroup differences: Not applicable
-4 -2 0 2 4
Favours expectant Favours active
129Active versus expectant management for women in the third stage of labour (Review)
Copyright © 2019 The Cochrane Collaboration. Published by John Wiley & Sons, Ltd.

Analysis 5.8. Comparison 5 Active versus mixed management of 3rd stage (delayed uterotonic, delayed
cord clamping, no controlled cord traction), Outcome 8 Maternal blood transfusion.
Review: Active versus expectant management for women in the third stage of labour
Comparison: 5 Active versus mixed management of 3rd stage (delayed uterotonic, delayed cord clamping, no controlled cord traction)
Outcome: 8 Maternal blood transfusion
Study or subgroup Active management Mixed management Risk Ratio Weight Risk Ratio
n/N n/N
M-H,Random,95%
CI
M-H,Random,95%
CI
1 Higher-income setting
Yildirim 2016 3/327 4/327 100.0 % 0.75 [ 0.17, 3.32 ]
Subtotal (95% CI) 327 327 100.0 % 0.75 [ 0.17, 3.32 ]
Total events: 3 (Active management), 4 (Mixed management)
Heterogeneity: not applicable
Test for overall effect: Z = 0.38 (P = 0.70)
2 Lower-income setting
Subtotal (95% CI) 0 0 Not estimable
Total events: 0 (Active management), 0 (Mixed management)
Heterogeneity: not applicable
Test for overall effect: not applicable
Total (95% CI) 327 327 100.0 % 0.75 [ 0.17, 3.32 ]
Total events: 3 (Active management), 4 (Mixed management)
Heterogeneity: not applicable
Test for overall effect: Z = 0.38 (P = 0.70)
Test for subgroup differences: Not applicable
0.01 0.1 1 10 100
Favours active Favours mixed
130Active versus expectant management for women in the third stage of labour (Review)
Copyright © 2019 The Cochrane Collaboration. Published by John Wiley & Sons, Ltd.

Analysis 5.9. Comparison 5 Active versus mixed management of 3rd stage (delayed uterotonic, delayed
cord clamping, no controlled cord traction), Outcome 9 Therapeutic uterotonics during third stage and/or
within 24 hours.
Review: Active versus expectant management for women in the third stage of labour
Comparison: 5 Active versus mixed management of 3rd stage (delayed uterotonic, delayed cord clamping, no controlled cord traction)
Outcome: 9 Therapeutic uterotonics during third stage and/or within 24 hours
Study or subgroup Active management Mixed management Risk Ratio Weight Risk Ratio
n/N n/N
M-H,Random,95%
CI
M-H,Random,95%
CI
1 Higher-income setting
Yildirim 2016 27/327 30/327 100.0 % 0.90 [ 0.55, 1.48 ]
Subtotal (95% CI) 327 327 100.0 % 0.90 [ 0.55, 1.48 ]
Total events: 27 (Active management), 30 (Mixed management)
Heterogeneity: not applicable
Test for overall effect: Z = 0.42 (P = 0.68)
2 Lower-income setting
Subtotal (95% CI) 0 0 Not estimable
Total events: 0 (Active management), 0 (Mixed management)
Heterogeneity: not applicable
Test for overall effect: not applicable
Total (95% CI) 327 327 100.0 % 0.90 [ 0.55, 1.48 ]
Total events: 27 (Active management), 30 (Mixed management)
Heterogeneity: not applicable
Test for overall effect: Z = 0.42 (P = 0.68)
Test for subgroup differences: Not applicable
0.01 0.1 1 10 100
Favours active Favours mixed
131Active versus expectant management for women in the third stage of labour (Review)
Copyright © 2019 The Cochrane Collaboration. Published by John Wiley & Sons, Ltd.

Analysis 5.10. Comparison 5 Active versus mixed management of 3rd stage (delayed uterotonic, delayed
cord clamping, no controlled cord traction), Outcome 10 Mean length of third stage.
Review: Active versus expectant management for women in the third stage of labour
Comparison: 5 Active versus mixed management of 3rd stage (delayed uterotonic, delayed cord clamping, no controlled cord traction)
Outcome: 10 Mean length of third stage
Study or subgroup Active management Mixed managementMean
Difference WeightMean
Difference
N Mean(SD)[min] N Mean(SD)[min] IV,Random,95% CI IV,Random,95% CI
1 Higher-income setting
Yildirim 2016 327 4.11 (2.32) 327 9.26 (4.59) 100.0 % -5.15 [ -5.71, -4.59 ]
Subtotal (95% CI) 327 327 100.0 % -5.15 [ -5.71, -4.59 ]
Heterogeneity: not applicable
Test for overall effect: Z = 18.11 (P < 0.00001)
2 Lower-income setting
Subtotal (95% CI) 0 0 Not estimable
Heterogeneity: not applicable
Test for overall effect: not applicable
Total (95% CI) 327 327 100.0 % -5.15 [ -5.71, -4.59 ]
Heterogeneity: not applicable
Test for overall effect: Z = 18.11 (P < 0.00001)
Test for subgroup differences: Not applicable
-100 -50 0 50 100
Favours active Favours mixed
132Active versus expectant management for women in the third stage of labour (Review)
Copyright © 2019 The Cochrane Collaboration. Published by John Wiley & Sons, Ltd.

Analysis 5.11. Comparison 5 Active versus mixed management of 3rd stage (delayed uterotonic, delayed
cord clamping, no controlled cord traction), Outcome 11 Manual removal of placenta as defined by study
authors.
Review: Active versus expectant management for women in the third stage of labour
Comparison: 5 Active versus mixed management of 3rd stage (delayed uterotonic, delayed cord clamping, no controlled cord traction)
Outcome: 11 Manual removal of placenta as defined by study authors
Study or subgroup Active management Mixed management Risk Ratio Weight Risk Ratio
n/N n/N
M-H,Random,95%
CI
M-H,Random,95%
CI
1 Higher-income setting
Yildirim 2016 2/327 3/327 100.0 % 0.67 [ 0.11, 3.96 ]
Subtotal (95% CI) 327 327 100.0 % 0.67 [ 0.11, 3.96 ]
Total events: 2 (Active management), 3 (Mixed management)
Heterogeneity: not applicable
Test for overall effect: Z = 0.45 (P = 0.66)
2 Lower-income setting
Subtotal (95% CI) 0 0 Not estimable
Total events: 0 (Active management), 0 (Mixed management)
Heterogeneity: not applicable
Test for overall effect: not applicable
Total (95% CI) 327 327 100.0 % 0.67 [ 0.11, 3.96 ]
Total events: 2 (Active management), 3 (Mixed management)
Heterogeneity: not applicable
Test for overall effect: Z = 0.45 (P = 0.66)
Test for subgroup differences: Not applicable
0.01 0.1 1 10 100
Favours active Favours mixed
133Active versus expectant management for women in the third stage of labour (Review)
Copyright © 2019 The Cochrane Collaboration. Published by John Wiley & Sons, Ltd.

Analysis 5.12. Comparison 5 Active versus mixed management of 3rd stage (delayed uterotonic, delayed
cord clamping, no controlled cord traction), Outcome 12 Surgical evacuation of retained products of
conception.
Review: Active versus expectant management for women in the third stage of labour
Comparison: 5 Active versus mixed management of 3rd stage (delayed uterotonic, delayed cord clamping, no controlled cord traction)
Outcome: 12 Surgical evacuation of retained products of conception
Study or subgroup Active management Mixed management Risk Ratio Weight Risk Ratio
n/N n/N
M-H,Random,95%
CI
M-H,Random,95%
CI
1 Higher-income setting
Yildirim 2016 3/327 0/327 100.0 % 7.00 [ 0.36, 134.98 ]
Subtotal (95% CI) 327 327 100.0 % 7.00 [ 0.36, 134.98 ]
Total events: 3 (Active management), 0 (Mixed management)
Heterogeneity: not applicable
Test for overall effect: Z = 1.29 (P = 0.20)
2 Lower-income setting
Subtotal (95% CI) 0 0 Not estimable
Total events: 0 (Active management), 0 (Mixed management)
Heterogeneity: not applicable
Test for overall effect: not applicable
Total (95% CI) 327 327 100.0 % 7.00 [ 0.36, 134.98 ]
Total events: 3 (Active management), 0 (Mixed management)
Heterogeneity: not applicable
Test for overall effect: Z = 1.29 (P = 0.20)
Test for subgroup differences: Not applicable
0.01 0.1 1 10 100
Favours active Favours mixed
134Active versus expectant management for women in the third stage of labour (Review)
Copyright © 2019 The Cochrane Collaboration. Published by John Wiley & Sons, Ltd.

Analysis 5.13. Comparison 5 Active versus mixed management of 3rd stage (delayed uterotonic, delayed
cord clamping, no controlled cord traction), Outcome 13 Birthweight.
Review: Active versus expectant management for women in the third stage of labour
Comparison: 5 Active versus mixed management of 3rd stage (delayed uterotonic, delayed cord clamping, no controlled cord traction)
Outcome: 13 Birthweight
Study or subgroup Active management Mixed managementMean
Difference WeightMean
Difference
N Mean(SD)[g] N Mean(SD)[g] IV,Random,95% CI IV,Random,95% CI
1 Higher-income setting
Yildirim 2016 327 3316 (258) 327 3248 (315) 100.0 % 68.00 [ 23.87, 112.13 ]
Subtotal (95% CI) 327 327 100.0 % 68.00 [ 23.87, 112.13 ]
Heterogeneity: not applicable
Test for overall effect: Z = 3.02 (P = 0.0025)
2 Lower-income setting
Subtotal (95% CI) 0 0 Not estimable
Heterogeneity: not applicable
Test for overall effect: not applicable
Total (95% CI) 327 327 100.0 % 68.00 [ 23.87, 112.13 ]
Heterogeneity: not applicable
Test for overall effect: Z = 3.02 (P = 0.0025)
Test for subgroup differences: Not applicable
-100 -50 0 50 100
Favours mixed Favours active
135Active versus expectant management for women in the third stage of labour (Review)
Copyright © 2019 The Cochrane Collaboration. Published by John Wiley & Sons, Ltd.

Analysis 5.14. Comparison 5 Active versus mixed management of 3rd stage (delayed uterotonic, delayed
cord clamping, no controlled cord traction), Outcome 14 Postnatal maternal mean Hb.
Review: Active versus expectant management for women in the third stage of labour
Comparison: 5 Active versus mixed management of 3rd stage (delayed uterotonic, delayed cord clamping, no controlled cord traction)
Outcome: 14 Postnatal maternal mean Hb
Study or subgroup Active management Mixed managementMean
Difference WeightMean
Difference
N Mean(SD) N Mean(SD) IV,Random,95% CI IV,Random,95% CI
1 Higher-income setting
Yildirim 2016 327 10.78 (0.68) 327 10.09 (0.72) 100.0 % 0.69 [ 0.58, 0.80 ]
Subtotal (95% CI) 327 327 100.0 % 0.69 [ 0.58, 0.80 ]
Heterogeneity: not applicable
Test for overall effect: Z = 12.60 (P < 0.00001)
2 Lower-income setting
Subtotal (95% CI) 0 0 Not estimable
Heterogeneity: not applicable
Test for overall effect: not applicable
Total (95% CI) 327 327 100.0 % 0.69 [ 0.58, 0.80 ]
Heterogeneity: not applicable
Test for overall effect: Z = 12.60 (P < 0.00001)
Test for subgroup differences: Not applicable
-4 -2 0 2 4
Favours mixed Favours active
136Active versus expectant management for women in the third stage of labour (Review)
Copyright © 2019 The Cochrane Collaboration. Published by John Wiley & Sons, Ltd.

Analysis 9.1. Comparison 9 Active versus mixed management (uterotonic after placental delivery,
immediate cord clamping and no controlled cord traction) , Outcome 1 Severe primary PPH at time of birth
(clinically estimated or measured blood loss ≥ 1000 mL).
Review: Active versus expectant management for women in the third stage of labour
Comparison: 9 Active versus mixed management (uterotonic after placental delivery, immediate cord clamping and no controlled cord traction)
Outcome: 1 Severe primary PPH at time of birth (clinically estimated or measured blood loss ≥ 1000 mL)
Study or subgroup Active management Mixed management Risk Ratio Weight Risk Ratio
n/N n/N
M-H,Random,95%
CI
M-H,Random,95%
CI
1 Higher-income setting
Khan 1997 6/827 26/821 100.0 % 0.23 [ 0.09, 0.55 ]
Subtotal (95% CI) 827 821 100.0 % 0.23 [ 0.09, 0.55 ]
Total events: 6 (Active management), 26 (Mixed management)
Heterogeneity: not applicable
Test for overall effect: Z = 3.27 (P = 0.0011)
2 Lower-income setting
Subtotal (95% CI) 0 0 Not estimable
Total events: 0 (Active management), 0 (Mixed management)
Heterogeneity: not applicable
Test for overall effect: not applicable
Total (95% CI) 827 821 100.0 % 0.23 [ 0.09, 0.55 ]
Total events: 6 (Active management), 26 (Mixed management)
Heterogeneity: not applicable
Test for overall effect: Z = 3.27 (P = 0.0011)
Test for subgroup differences: Not applicable
0.01 0.1 1 10 100
Favours active Favours mixed
137Active versus expectant management for women in the third stage of labour (Review)
Copyright © 2019 The Cochrane Collaboration. Published by John Wiley & Sons, Ltd.

Analysis 9.10. Comparison 9 Active versus mixed management (uterotonic after placental delivery,
immediate cord clamping and no controlled cord traction) , Outcome 10 Primary blood loss ≥ 500 mL at
time of birth (clinically estimated or measured).
Review: Active versus expectant management for women in the third stage of labour
Comparison: 9 Active versus mixed management (uterotonic after placental delivery, immediate cord clamping and no controlled cord traction)
Outcome: 10 Primary blood loss ≥ 500 mL at time of birth (clinically estimated or measured)
Study or subgroup Active management Mixed management Risk Ratio Weight Risk Ratio
n/N n/N
M-H,Random,95%
CI
M-H,Random,95%
CI
1 Higher-income setting
Khan 1997 48/827 90/821 100.0 % 0.53 [ 0.38, 0.74 ]
Subtotal (95% CI) 827 821 100.0 % 0.53 [ 0.38, 0.74 ]
Total events: 48 (Active management), 90 (Mixed management)
Heterogeneity: not applicable
Test for overall effect: Z = 3.70 (P = 0.00021)
2 Lower-income setting
Subtotal (95% CI) 0 0 Not estimable
Total events: 0 (Active management), 0 (Mixed management)
Heterogeneity: not applicable
Test for overall effect: not applicable
Total (95% CI) 827 821 100.0 % 0.53 [ 0.38, 0.74 ]
Total events: 48 (Active management), 90 (Mixed management)
Heterogeneity: not applicable
Test for overall effect: Z = 3.70 (P = 0.00021)
Test for subgroup differences: Not applicable
0.01 0.1 1 10 100
Favours active Favours mixed
138Active versus expectant management for women in the third stage of labour (Review)
Copyright © 2019 The Cochrane Collaboration. Published by John Wiley & Sons, Ltd.

Analysis 9.16. Comparison 9 Active versus mixed management (uterotonic after placental delivery,
immediate cord clamping and no controlled cord traction) , Outcome 16 Maternal blood transfusion.
Review: Active versus expectant management for women in the third stage of labour
Comparison: 9 Active versus mixed management (uterotonic after placental delivery, immediate cord clamping and no controlled cord traction)
Outcome: 16 Maternal blood transfusion
Study or subgroup Active management Mixed management Risk Ratio Weight Risk Ratio
n/N n/N
M-H,Random,95%
CI
M-H,Random,95%
CI
1 Higher-income setting
Khan 1997 1/827 4/821 100.0 % 0.25 [ 0.03, 2.22 ]
Subtotal (95% CI) 827 821 100.0 % 0.25 [ 0.03, 2.22 ]
Total events: 1 (Active management), 4 (Mixed management)
Heterogeneity: not applicable
Test for overall effect: Z = 1.25 (P = 0.21)
2 Lower-income setting
Subtotal (95% CI) 0 0 Not estimable
Total events: 0 (Active management), 0 (Mixed management)
Heterogeneity: not applicable
Test for overall effect: not applicable
Total (95% CI) 827 821 100.0 % 0.25 [ 0.03, 2.22 ]
Total events: 1 (Active management), 4 (Mixed management)
Heterogeneity: not applicable
Test for overall effect: Z = 1.25 (P = 0.21)
Test for subgroup differences: Not applicable
0.01 0.1 1 10 100
Favours active Favours mixed
139Active versus expectant management for women in the third stage of labour (Review)
Copyright © 2019 The Cochrane Collaboration. Published by John Wiley & Sons, Ltd.

Analysis 9.17. Comparison 9 Active versus mixed management (uterotonic after placental delivery,
immediate cord clamping and no controlled cord traction) , Outcome 17 Clinical signs of severe blood loss.
Review: Active versus expectant management for women in the third stage of labour
Comparison: 9 Active versus mixed management (uterotonic after placental delivery, immediate cord clamping and no controlled cord traction)
Outcome: 17 Clinical signs of severe blood loss
Study or subgroup Active management Mixed management Risk Ratio Weight Risk Ratio
n/N n/N
M-H,Random,95%
CI
M-H,Random,95%
CI
1 Higher-income setting
Khan 1997 2/827 8/821 100.0 % 0.25 [ 0.05, 1.17 ]
Subtotal (95% CI) 827 821 100.0 % 0.25 [ 0.05, 1.17 ]
Total events: 2 (Active management), 8 (Mixed management)
Heterogeneity: not applicable
Test for overall effect: Z = 1.77 (P = 0.077)
2 Lower-income setting
Subtotal (95% CI) 0 0 Not estimable
Total events: 0 (Active management), 0 (Mixed management)
Heterogeneity: not applicable
Test for overall effect: not applicable
Total (95% CI) 827 821 100.0 % 0.25 [ 0.05, 1.17 ]
Total events: 2 (Active management), 8 (Mixed management)
Heterogeneity: not applicable
Test for overall effect: Z = 1.77 (P = 0.077)
Test for subgroup differences: Not applicable
0.01 0.1 1 10 100
Favours active Favours mixed
140Active versus expectant management for women in the third stage of labour (Review)
Copyright © 2019 The Cochrane Collaboration. Published by John Wiley & Sons, Ltd.

Analysis 9.18. Comparison 9 Active versus mixed management (uterotonic after placental delivery,
immediate cord clamping and no controlled cord traction) , Outcome 18 Therapeutic uterotonics during
third stage and/or within 24 hours.
Review: Active versus expectant management for women in the third stage of labour
Comparison: 9 Active versus mixed management (uterotonic after placental delivery, immediate cord clamping and no controlled cord traction)
Outcome: 18 Therapeutic uterotonics during third stage and/or within 24 hours
Study or subgroup Active management Mixed management Risk Ratio Weight Risk Ratio
n/N n/N
M-H,Random,95%
CI
M-H,Random,95%
CI
1 Higher-income setting
Khan 1997 19/827 42/821 100.0 % 0.45 [ 0.26, 0.77 ]
Subtotal (95% CI) 827 821 100.0 % 0.45 [ 0.26, 0.77 ]
Total events: 19 (Active management), 42 (Mixed management)
Heterogeneity: not applicable
Test for overall effect: Z = 2.94 (P = 0.0033)
2 Lower-income setting
Subtotal (95% CI) 0 0 Not estimable
Total events: 0 (Active management), 0 (Mixed management)
Heterogeneity: not applicable
Test for overall effect: not applicable
Total (95% CI) 827 821 100.0 % 0.45 [ 0.26, 0.77 ]
Total events: 19 (Active management), 42 (Mixed management)
Heterogeneity: not applicable
Test for overall effect: Z = 2.94 (P = 0.0033)
Test for subgroup differences: Not applicable
0.01 0.1 1 10 100
Favours active Favours mixed
141Active versus expectant management for women in the third stage of labour (Review)
Copyright © 2019 The Cochrane Collaboration. Published by John Wiley & Sons, Ltd.

Analysis 9.19. Comparison 9 Active versus mixed management (uterotonic after placental delivery,
immediate cord clamping and no controlled cord traction) , Outcome 19 Mean length of third stage.
Review: Active versus expectant management for women in the third stage of labour
Comparison: 9 Active versus mixed management (uterotonic after placental delivery, immediate cord clamping and no controlled cord traction)
Outcome: 19 Mean length of third stage
Study or subgroup Active management Mixed managementMean
Difference WeightMean
Difference
N Mean(SD)[min] N Mean(SD)[min] IV,Random,95% CI IV,Random,95% CI
1 Higher-income setting
Khan 1997 827 4 (2.5) 821 14 (2.5) 100.0 % -10.00 [ -10.24, -9.76 ]
Subtotal (95% CI) 827 821 100.0 % -10.00 [ -10.24, -9.76 ]
Heterogeneity: not applicable
Test for overall effect: Z = 81.19 (P < 0.00001)
2 Lower-income setting
Subtotal (95% CI) 0 0 Not estimable
Heterogeneity: not applicable
Test for overall effect: not applicable
Total (95% CI) 827 821 100.0 % -10.00 [ -10.24, -9.76 ]
Heterogeneity: not applicable
Test for overall effect: Z = 81.19 (P < 0.00001)
Test for subgroup differences: Not applicable
-10 -5 0 5 10
Favours active Favours mixed
142Active versus expectant management for women in the third stage of labour (Review)
Copyright © 2019 The Cochrane Collaboration. Published by John Wiley & Sons, Ltd.

Analysis 10.1. Comparison 10 Active versus mixed management (no routine uterotonic, early cord
clamping, no controlled cord traction), Outcome 1 Severe primary PPH at time of birth (clinically estimated
or measured blood loss ≥ 1000 mL).
Review: Active versus expectant management for women in the third stage of labour
Comparison: 10 Active versus mixed management (no routine uterotonic, early cord clamping, no controlled cord traction)
Outcome: 1 Severe primary PPH at time of birth (clinically estimated or measured blood loss ≥ 1000 mL)
Study or subgroup Active management Mixed management Risk Ratio Weight Risk Ratio
n/N n/N
M-H,Random,95%
CI
M-H,Random,95%
CI
1 Higher-income setting
Jangsten 2011 29/804 38/817 100.0 % 0.78 [ 0.48, 1.24 ]
Subtotal (95% CI) 804 817 100.0 % 0.78 [ 0.48, 1.24 ]
Total events: 29 (Active management), 38 (Mixed management)
Heterogeneity: not applicable
Test for overall effect: Z = 1.05 (P = 0.29)
2 Lower-income setting
Subtotal (95% CI) 0 0 Not estimable
Total events: 0 (Active management), 0 (Mixed management)
Heterogeneity: not applicable
Test for overall effect: not applicable
Total (95% CI) 804 817 100.0 % 0.78 [ 0.48, 1.24 ]
Total events: 29 (Active management), 38 (Mixed management)
Heterogeneity: not applicable
Test for overall effect: Z = 1.05 (P = 0.29)
Test for subgroup differences: Not applicable
0.1 0.2 0.5 1 2 5 10
Favours active Favours mixed
143Active versus expectant management for women in the third stage of labour (Review)
Copyright © 2019 The Cochrane Collaboration. Published by John Wiley & Sons, Ltd.

Analysis 10.4. Comparison 10 Active versus mixed management (no routine uterotonic, early cord
clamping, no controlled cord traction), Outcome 4 Maternal Hb < 9 g/dL at 24-72 hr.
Review: Active versus expectant management for women in the third stage of labour
Comparison: 10 Active versus mixed management (no routine uterotonic, early cord clamping, no controlled cord traction)
Outcome: 4 Maternal Hb < 9 g/dL at 24-72 hr
Study or subgroup Active management Mixed management Risk Ratio Weight Risk Ratio
n/N n/N
M-H,Random,95%
CI
M-H,Random,95%
CI
1 Higher-income setting
Jangsten 2011 34/810 28/821 100.0 % 1.23 [ 0.75, 2.01 ]
Subtotal (95% CI) 810 821 100.0 % 1.23 [ 0.75, 2.01 ]
Total events: 34 (Active management), 28 (Mixed management)
Heterogeneity: not applicable
Test for overall effect: Z = 0.83 (P = 0.41)
2 Lower-income setting
Subtotal (95% CI) 0 0 Not estimable
Total events: 0 (Active management), 0 (Mixed management)
Heterogeneity: not applicable
Test for overall effect: not applicable
Total (95% CI) 810 821 100.0 % 1.23 [ 0.75, 2.01 ]
Total events: 34 (Active management), 28 (Mixed management)
Heterogeneity: not applicable
Test for overall effect: Z = 0.83 (P = 0.41)
Test for subgroup differences: Not applicable
0.01 0.1 1 10 100
Favours active Favours mixed
144Active versus expectant management for women in the third stage of labour (Review)
Copyright © 2019 The Cochrane Collaboration. Published by John Wiley & Sons, Ltd.

Analysis 10.10. Comparison 10 Active versus mixed management (no routine uterotonic, early cord
clamping, no controlled cord traction), Outcome 10 Primary blood loss ≥ 500 mL at time of birth (clinically
estimated or measured).
Review: Active versus expectant management for women in the third stage of labour
Comparison: 10 Active versus mixed management (no routine uterotonic, early cord clamping, no controlled cord traction)
Outcome: 10 Primary blood loss ≥ 500 mL at time of birth (clinically estimated or measured)
Study or subgroup Active management Mixed management Risk Ratio Weight Risk Ratio
n/N n/N
M-H,Random,95%
CI
M-H,Random,95%
CI
1 Higher-income setting
Jangsten 2011 79/804 156/817 100.0 % 0.51 [ 0.40, 0.66 ]
Subtotal (95% CI) 804 817 100.0 % 0.51 [ 0.40, 0.66 ]
Total events: 79 (Active management), 156 (Mixed management)
Heterogeneity: not applicable
Test for overall effect: Z = 5.16 (P < 0.00001)
2 Lower-income setting
Subtotal (95% CI) 0 0 Not estimable
Total events: 0 (Active management), 0 (Mixed management)
Heterogeneity: not applicable
Test for overall effect: not applicable
Total (95% CI) 804 817 100.0 % 0.51 [ 0.40, 0.66 ]
Total events: 79 (Active management), 156 (Mixed management)
Heterogeneity: not applicable
Test for overall effect: Z = 5.16 (P < 0.00001)
Test for subgroup differences: Not applicable
0.01 0.1 1 10 100
Favours active Favours mixed
145Active versus expectant management for women in the third stage of labour (Review)
Copyright © 2019 The Cochrane Collaboration. Published by John Wiley & Sons, Ltd.

Analysis 10.13. Comparison 10 Active versus mixed management (no routine uterotonic, early cord
clamping, no controlled cord traction), Outcome 13 Mean maternal blood loss (mL) at time of birth (clinically
estimated or measured).
Review: Active versus expectant management for women in the third stage of labour
Comparison: 10 Active versus mixed management (no routine uterotonic, early cord clamping, no controlled cord traction)
Outcome: 13 Mean maternal blood loss (mL) at time of birth (clinically estimated or measured)
Study or subgroup Active management Mixed managementMean
Difference WeightMean
Difference
N Mean(SD) N Mean(SD) IV,Random,95% CI IV,Random,95% CI
1 Higher-income setting
Jangsten 2011 804 301 (306.5) 817 395 (360.8) 100.0 % -94.00 [ -126.57, -61.43 ]
Subtotal (95% CI) 804 817 100.0 % -94.00 [ -126.57, -61.43 ]
Heterogeneity: not applicable
Test for overall effect: Z = 5.66 (P < 0.00001)
2 Lower-income setting
Subtotal (95% CI) 0 0 Not estimable
Heterogeneity: not applicable
Test for overall effect: not applicable
Total (95% CI) 804 817 100.0 % -94.00 [ -126.57, -61.43 ]
Heterogeneity: not applicable
Test for overall effect: Z = 5.66 (P < 0.00001)
Test for subgroup differences: Not applicable
-100 -50 0 50 100
Favours active Favours mixed
146Active versus expectant management for women in the third stage of labour (Review)
Copyright © 2019 The Cochrane Collaboration. Published by John Wiley & Sons, Ltd.
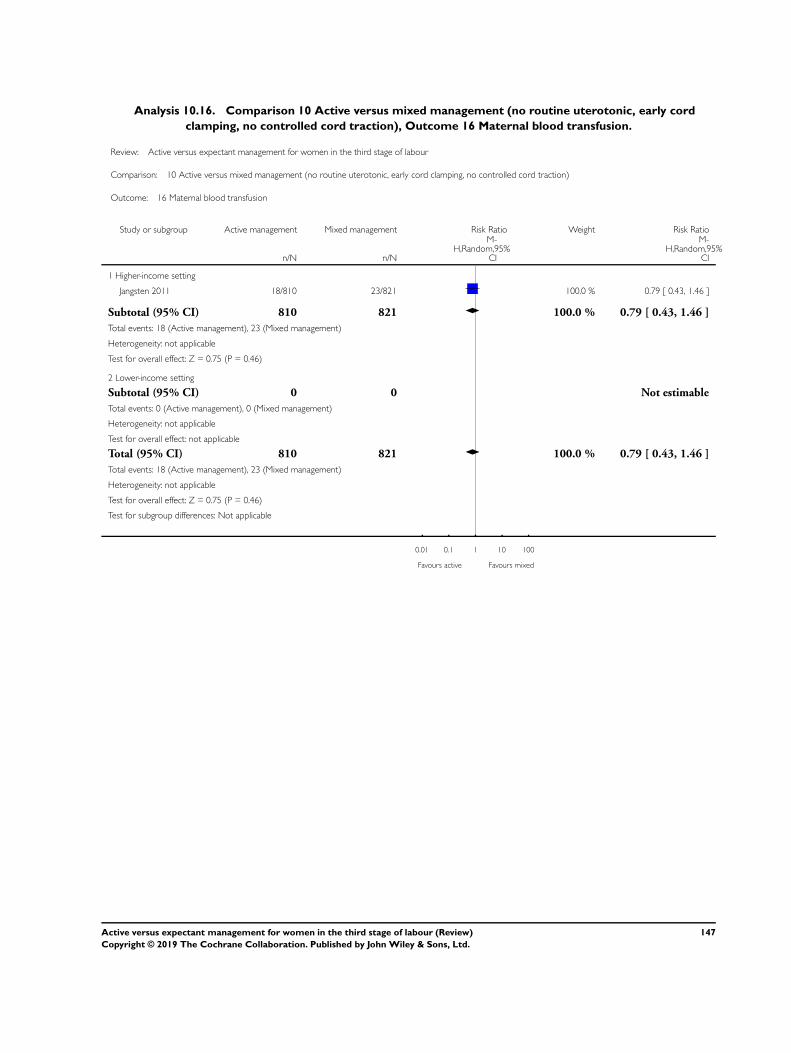
Analysis 10.16. Comparison 10 Active versus mixed management (no routine uterotonic, early cord
clamping, no controlled cord traction), Outcome 16 Maternal blood transfusion.
Review: Active versus expectant management for women in the third stage of labour
Comparison: 10 Active versus mixed management (no routine uterotonic, early cord clamping, no controlled cord traction)
Outcome: 16 Maternal blood transfusion
Study or subgroup Active management Mixed management Risk Ratio Weight Risk Ratio
n/N n/N
M-H,Random,95%
CI
M-H,Random,95%
CI
1 Higher-income setting
Jangsten 2011 18/810 23/821 100.0 % 0.79 [ 0.43, 1.46 ]
Subtotal (95% CI) 810 821 100.0 % 0.79 [ 0.43, 1.46 ]
Total events: 18 (Active management), 23 (Mixed management)
Heterogeneity: not applicable
Test for overall effect: Z = 0.75 (P = 0.46)
2 Lower-income setting
Subtotal (95% CI) 0 0 Not estimable
Total events: 0 (Active management), 0 (Mixed management)
Heterogeneity: not applicable
Test for overall effect: not applicable
Total (95% CI) 810 821 100.0 % 0.79 [ 0.43, 1.46 ]
Total events: 18 (Active management), 23 (Mixed management)
Heterogeneity: not applicable
Test for overall effect: Z = 0.75 (P = 0.46)
Test for subgroup differences: Not applicable
0.01 0.1 1 10 100
Favours active Favours mixed
147Active versus expectant management for women in the third stage of labour (Review)
Copyright © 2019 The Cochrane Collaboration. Published by John Wiley & Sons, Ltd.
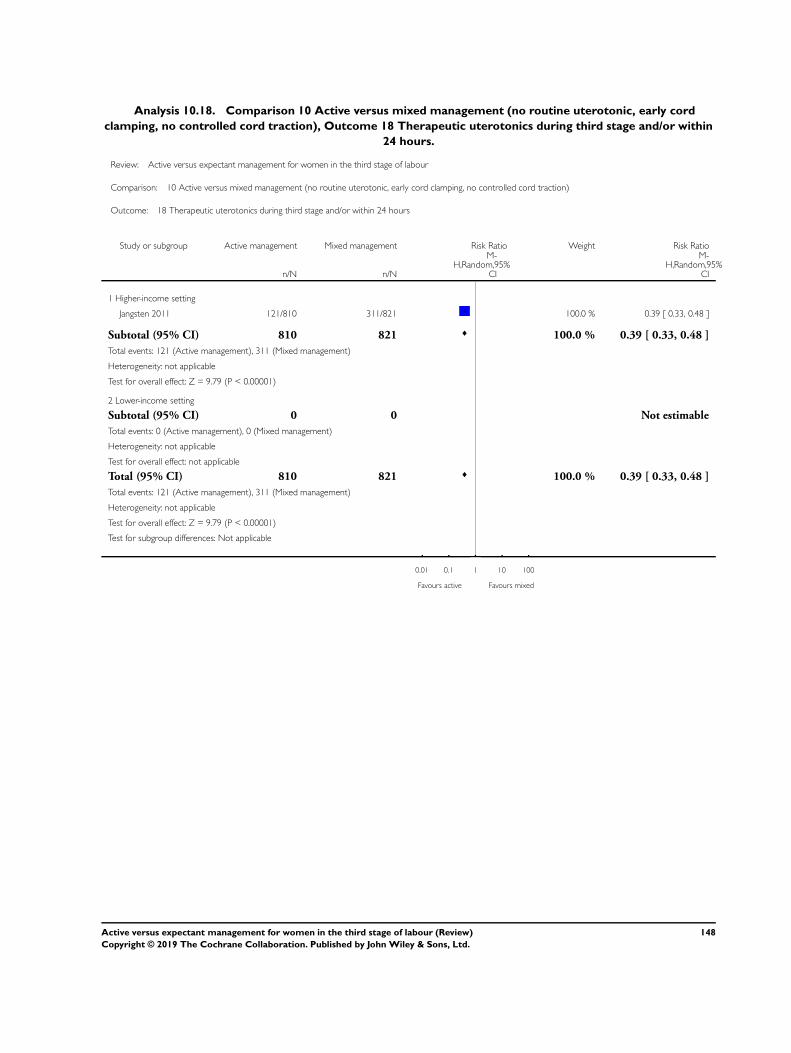
Analysis 10.18. Comparison 10 Active versus mixed management (no routine uterotonic, early cord
clamping, no controlled cord traction), Outcome 18 Therapeutic uterotonics during third stage and/or within
24 hours.
Review: Active versus expectant management for women in the third stage of labour
Comparison: 10 Active versus mixed management (no routine uterotonic, early cord clamping, no controlled cord traction)
Outcome: 18 Therapeutic uterotonics during third stage and/or within 24 hours
Study or subgroup Active management Mixed management Risk Ratio Weight Risk Ratio
n/N n/N
M-H,Random,95%
CI
M-H,Random,95%
CI
1 Higher-income setting
Jangsten 2011 121/810 311/821 100.0 % 0.39 [ 0.33, 0.48 ]
Subtotal (95% CI) 810 821 100.0 % 0.39 [ 0.33, 0.48 ]
Total events: 121 (Active management), 311 (Mixed management)
Heterogeneity: not applicable
Test for overall effect: Z = 9.79 (P < 0.00001)
2 Lower-income setting
Subtotal (95% CI) 0 0 Not estimable
Total events: 0 (Active management), 0 (Mixed management)
Heterogeneity: not applicable
Test for overall effect: not applicable
Total (95% CI) 810 821 100.0 % 0.39 [ 0.33, 0.48 ]
Total events: 121 (Active management), 311 (Mixed management)
Heterogeneity: not applicable
Test for overall effect: Z = 9.79 (P < 0.00001)
Test for subgroup differences: Not applicable
0.01 0.1 1 10 100
Favours active Favours mixed
148Active versus expectant management for women in the third stage of labour (Review)
Copyright © 2019 The Cochrane Collaboration. Published by John Wiley & Sons, Ltd.
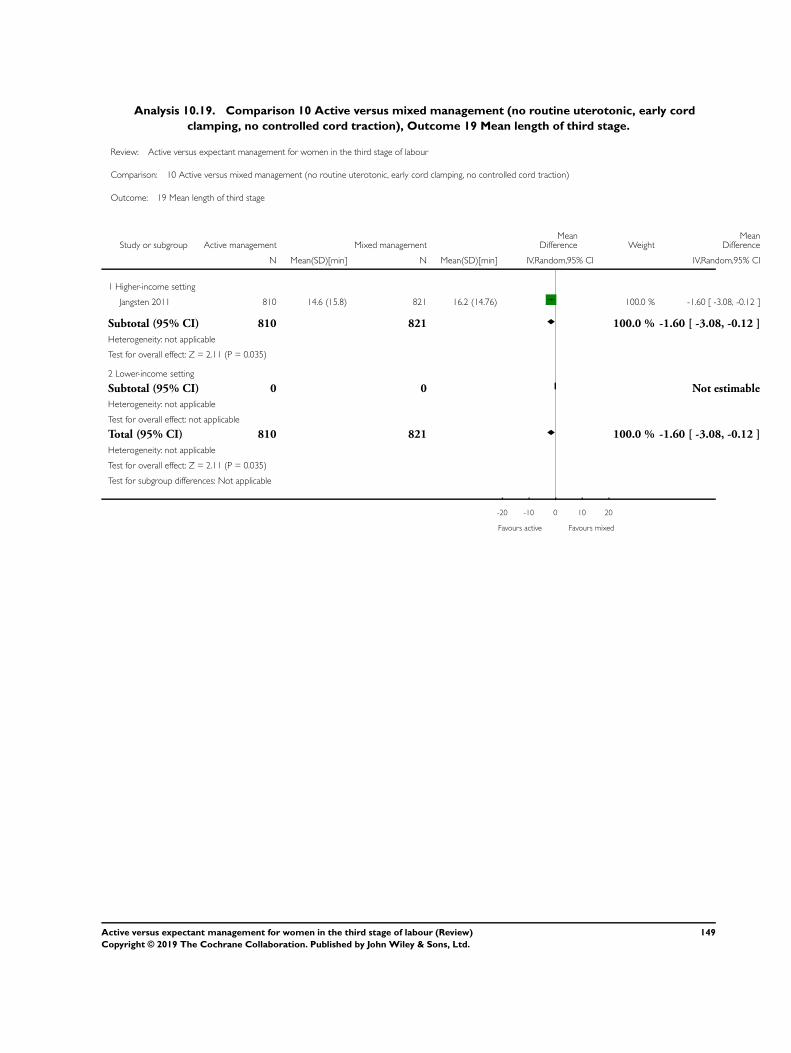
Analysis 10.19. Comparison 10 Active versus mixed management (no routine uterotonic, early cord
clamping, no controlled cord traction), Outcome 19 Mean length of third stage.
Review: Active versus expectant management for women in the third stage of labour
Comparison: 10 Active versus mixed management (no routine uterotonic, early cord clamping, no controlled cord traction)
Outcome: 19 Mean length of third stage
Study or subgroup Active management Mixed managementMean
Difference WeightMean
Difference
N Mean(SD)[min] N Mean(SD)[min] IV,Random,95% CI IV,Random,95% CI
1 Higher-income setting
Jangsten 2011 810 14.6 (15.8) 821 16.2 (14.76) 100.0 % -1.60 [ -3.08, -0.12 ]
Subtotal (95% CI) 810 821 100.0 % -1.60 [ -3.08, -0.12 ]
Heterogeneity: not applicable
Test for overall effect: Z = 2.11 (P = 0.035)
2 Lower-income setting
Subtotal (95% CI) 0 0 Not estimable
Heterogeneity: not applicable
Test for overall effect: not applicable
Total (95% CI) 810 821 100.0 % -1.60 [ -3.08, -0.12 ]
Heterogeneity: not applicable
Test for overall effect: Z = 2.11 (P = 0.035)
Test for subgroup differences: Not applicable
-20 -10 0 10 20
Favours active Favours mixed
149Active versus expectant management for women in the third stage of labour (Review)
Copyright © 2019 The Cochrane Collaboration. Published by John Wiley & Sons, Ltd.

Analysis 10.20. Comparison 10 Active versus mixed management (no routine uterotonic, early cord
clamping, no controlled cord traction), Outcome 20 Manual removal of placenta as defined by study authors.
Review: Active versus expectant management for women in the third stage of labour
Comparison: 10 Active versus mixed management (no routine uterotonic, early cord clamping, no controlled cord traction)
Outcome: 20 Manual removal of placenta as defined by study authors
Study or subgroup Active management Mixed management Risk Ratio Weight Risk Ratio
n/N n/N
M-H,Random,95%
CI
M-H,Random,95%
CI
1 Higher-income setting
Jangsten 2011 26/810 21/821 100.0 % 1.25 [ 0.71, 2.21 ]
Subtotal (95% CI) 810 821 100.0 % 1.25 [ 0.71, 2.21 ]
Total events: 26 (Active management), 21 (Mixed management)
Heterogeneity: not applicable
Test for overall effect: Z = 0.79 (P = 0.43)
2 Lower-income setting
Subtotal (95% CI) 0 0 Not estimable
Total events: 0 (Active management), 0 (Mixed management)
Heterogeneity: not applicable
Test for overall effect: not applicable
Total (95% CI) 810 821 100.0 % 1.25 [ 0.71, 2.21 ]
Total events: 26 (Active management), 21 (Mixed management)
Heterogeneity: not applicable
Test for overall effect: Z = 0.79 (P = 0.43)
Test for subgroup differences: Not applicable
0.01 0.1 1 10 100
Favours active Favours mixed
150Active versus expectant management for women in the third stage of labour (Review)
Copyright © 2019 The Cochrane Collaboration. Published by John Wiley & Sons, Ltd.

Analysis 10.28. Comparison 10 Active versus mixed management (no routine uterotonic, early cord
clamping, no controlled cord traction), Outcome 28 Not prespecified: afterpains at 2 hours after birth (id
20458).
Review: Active versus expectant management for women in the third stage of labour
Comparison: 10 Active versus mixed management (no routine uterotonic, early cord clamping, no controlled cord traction)
Outcome: 28 Not prespecified: afterpains at 2 hours after birth (id 20458)
Study or subgroup Active MixedMean
Difference WeightMean
Difference
N Mean(SD) N Mean(SD) IV,Random,95% CI IV,Random,95% CI
1 Higher-income setting
Jangsten 2011 713 10.4 (16.4) 712 13.2 (18.6) 100.0 % -2.80 [ -4.62, -0.98 ]
Subtotal (95% CI) 713 712 100.0 % -2.80 [ -4.62, -0.98 ]
Heterogeneity: not applicable
Test for overall effect: Z = 3.01 (P = 0.0026)
2 Lower-income setting
Subtotal (95% CI) 0 0 Not estimable
Heterogeneity: not applicable
Test for overall effect: not applicable
Total (95% CI) 713 712 100.0 % -2.80 [ -4.62, -0.98 ]
Heterogeneity: not applicable
Test for overall effect: Z = 3.01 (P = 0.0026)
Test for subgroup differences: Not applicable
-100 -50 0 50 100
Favours active Favours mixed
151Active versus expectant management for women in the third stage of labour (Review)
Copyright © 2019 The Cochrane Collaboration. Published by John Wiley & Sons, Ltd.

Analysis 10.29. Comparison 10 Active versus mixed management (no routine uterotonic, early cord
clamping, no controlled cord traction), Outcome 29 Not pre-specified: afterpains the day after birth (id 20458).
Review: Active versus expectant management for women in the third stage of labour
Comparison: 10 Active versus mixed management (no routine uterotonic, early cord clamping, no controlled cord traction)
Outcome: 29 Not pre-specified: afterpains the day after birth (id 20458)
Study or subgroup Active management Mixed managementMean
Difference WeightMean
Difference
N Mean(SD) N Mean(SD) IV,Random,95% CI IV,Random,95% CI
1 Higher-income setting
Jangsten 2011 663 26.1 (21.6) 673 29.1 (21.8) 100.0 % -3.00 [ -5.33, -0.67 ]
Subtotal (95% CI) 663 673 100.0 % -3.00 [ -5.33, -0.67 ]
Heterogeneity: not applicable
Test for overall effect: Z = 2.53 (P = 0.012)
2 Lower-income setting
Subtotal (95% CI) 0 0 Not estimable
Heterogeneity: not applicable
Test for overall effect: not applicable
Total (95% CI) 663 673 100.0 % -3.00 [ -5.33, -0.67 ]
Heterogeneity: not applicable
Test for overall effect: Z = 2.53 (P = 0.012)
Test for subgroup differences: Not applicable
-20 -10 0 10 20
Favours active Favours mixed
152Active versus expectant management for women in the third stage of labour (Review)
Copyright © 2019 The Cochrane Collaboration. Published by John Wiley & Sons, Ltd.

Analysis 10.31. Comparison 10 Active versus mixed management (no routine uterotonic, early cord
clamping, no controlled cord traction), Outcome 31 Birthweight.
Review: Active versus expectant management for women in the third stage of labour
Comparison: 10 Active versus mixed management (no routine uterotonic, early cord clamping, no controlled cord traction)
Outcome: 31 Birthweight
Study or subgroup Active management Mixed managementMean
Difference WeightMean
Difference
N Mean(SD)[g] N Mean(SD)[g] IV,Random,95% CI IV,Random,95% CI
1 Higher-income setting
Jangsten 2011 810 3600 (458.2) 821 3585 (445.8) 100.0 % 15.00 [ -28.88, 58.88 ]
Subtotal (95% CI) 810 821 100.0 % 15.00 [ -28.88, 58.88 ]
Heterogeneity: not applicable
Test for overall effect: Z = 0.67 (P = 0.50)
2 Lower-income setting
Subtotal (95% CI) 0 0 Not estimable
Heterogeneity: not applicable
Test for overall effect: not applicable
Total (95% CI) 810 821 100.0 % 15.00 [ -28.88, 58.88 ]
Heterogeneity: not applicable
Test for overall effect: Z = 0.67 (P = 0.50)
Test for subgroup differences: Not applicable
-100 -50 0 50 100
Favours mixed Favours active
153Active versus expectant management for women in the third stage of labour (Review)
Copyright © 2019 The Cochrane Collaboration. Published by John Wiley & Sons, Ltd.

Analysis 10.42. Comparison 10 Active versus mixed management (no routine uterotonic, early cord
clamping, no controlled cord traction), Outcome 42 Postnatal maternal mean Hb (outcome not pre-specified).
Review: Active versus expectant management for women in the third stage of labour
Comparison: 10 Active versus mixed management (no routine uterotonic, early cord clamping, no controlled cord traction)
Outcome: 42 Postnatal maternal mean Hb (outcome not pre-specified)
Study or subgroup Active management Mixed managementMean
Difference WeightMean
Difference
N Mean(SD) N Mean(SD) IV,Random,95% CI IV,Random,95% CI
1 Higher-income setting
Jangsten 2011 810 11.8 (1.45) 821 11.52 (1.43) 100.0 % 0.28 [ 0.14, 0.42 ]
Subtotal (95% CI) 810 821 100.0 % 0.28 [ 0.14, 0.42 ]
Heterogeneity: not applicable
Test for overall effect: Z = 3.93 (P = 0.000086)
2 Lower-income setting
Subtotal (95% CI) 0 0 Not estimable
Heterogeneity: not applicable
Test for overall effect: not applicable
Total (95% CI) 810 821 100.0 % 0.28 [ 0.14, 0.42 ]
Heterogeneity: not applicable
Test for overall effect: Z = 3.93 (P = 0.000086)
Test for subgroup differences: Not applicable
-4 -2 0 2 4
Favours mixed Favours active
154Active versus expectant management for women in the third stage of labour (Review)
Copyright © 2019 The Cochrane Collaboration. Published by John Wiley & Sons, Ltd.

Analysis 10.43. Comparison 10 Active versus mixed management (no routine uterotonic, early cord
clamping, no controlled cord traction), Outcome 43 Severe primary PPH after placental delivery and up to 2
hours (clinically estimated or measured blood loss ≥ 1000 mL) - not pre-specified.
Review: Active versus expectant management for women in the third stage of labour
Comparison: 10 Active versus mixed management (no routine uterotonic, early cord clamping, no controlled cord traction)
Outcome: 43 Severe primary PPH after placental delivery and up to 2 hours (clinically estimated or measured blood loss ≥ 1000 mL) - not pre-specified
Study or subgroup Active management Mixed management Risk Ratio Weight Risk Ratio
n/N n/N
M-H,Random,95%
CI
M-H,Random,95%
CI
1 Higher-income setting
Jangsten 2011 53/804 100/817 100.0 % 0.54 [ 0.39, 0.74 ]
Subtotal (95% CI) 804 817 100.0 % 0.54 [ 0.39, 0.74 ]
Total events: 53 (Active management), 100 (Mixed management)
Heterogeneity: not applicable
Test for overall effect: Z = 3.81 (P = 0.00014)
2 Lower-income setting
Subtotal (95% CI) 0 0 Not estimable
Total events: 0 (Active management), 0 (Mixed management)
Heterogeneity: not applicable
Test for overall effect: not applicable
Total (95% CI) 804 817 100.0 % 0.54 [ 0.39, 0.74 ]
Total events: 53 (Active management), 100 (Mixed management)
Heterogeneity: not applicable
Test for overall effect: Z = 3.81 (P = 0.00014)
Test for subgroup differences: Not applicable
0.01 0.1 1 10 100
Favours active Favours mixed
155Active versus expectant management for women in the third stage of labour (Review)
Copyright © 2019 The Cochrane Collaboration. Published by John Wiley & Sons, Ltd.

Analysis 10.44. Comparison 10 Active versus mixed management (no routine uterotonic, early cord
clamping, no controlled cord traction), Outcome 44 Severe primary PPH at time of birth and up to 2 hours
(clinically estimated or measured blood loss ≥1000 mL) - not pre-specified.
Review: Active versus expectant management for women in the third stage of labour
Comparison: 10 Active versus mixed management (no routine uterotonic, early cord clamping, no controlled cord traction)
Outcome: 44 Severe primary PPH at time of birth and up to 2 hours (clinically estimated or measured blood loss ≥1000 mL) - not pre-specified
Study or subgroup Active management Mixed management Risk Ratio Weight Risk Ratio
n/N n/N
M-H,Random,95%
CI
M-H,Random,95%
CI
1 Higher-income setting
Jangsten 2011 82/804 138/817 100.0 % 0.60 [ 0.47, 0.78 ]
Subtotal (95% CI) 804 817 100.0 % 0.60 [ 0.47, 0.78 ]
Total events: 82 (Active management), 138 (Mixed management)
Heterogeneity: not applicable
Test for overall effect: Z = 3.87 (P = 0.00011)
2 Lower-income setting
Subtotal (95% CI) 0 0 Not estimable
Total events: 0 (Active management), 0 (Mixed management)
Heterogeneity: not applicable
Test for overall effect: not applicable
Total (95% CI) 804 817 100.0 % 0.60 [ 0.47, 0.78 ]
Total events: 82 (Active management), 138 (Mixed management)
Heterogeneity: not applicable
Test for overall effect: Z = 3.87 (P = 0.00011)
Test for subgroup differences: Not applicable
0.01 0.1 1 10 100
Favours active Favours mixed
156Active versus expectant management for women in the third stage of labour (Review)
Copyright © 2019 The Cochrane Collaboration. Published by John Wiley & Sons, Ltd.

Analysis 10.45. Comparison 10 Active versus mixed management (no routine uterotonic, early cord
clamping, no controlled cord traction), Outcome 45 Mean blood loss (mL) (clinically estimated or measured at
birth and up to 2 hours (not pre-specified).
Review: Active versus expectant management for women in the third stage of labour
Comparison: 10 Active versus mixed management (no routine uterotonic, early cord clamping, no controlled cord traction)
Outcome: 45 Mean blood loss (mL) (clinically estimated or measured at birth and up to 2 hours (not pre-specified)
Study or subgroup Active management Mixed managementMean
Difference WeightMean
Difference
N Mean(SD) N Mean(SD) IV,Random,95% CI IV,Random,95% CI
1 Higher-income setting
Jangsten 2011 804 233 (255) 817 282 (288.9) 100.0 % -49.00 [ -75.52, -22.48 ]
Subtotal (95% CI) 804 817 100.0 % -49.00 [ -75.52, -22.48 ]
Heterogeneity: not applicable
Test for overall effect: Z = 3.62 (P = 0.00029)
2 Lower-income setting
Subtotal (95% CI) 0 0 Not estimable
Heterogeneity: not applicable
Test for overall effect: not applicable
Total (95% CI) 804 817 100.0 % -49.00 [ -75.52, -22.48 ]
Heterogeneity: not applicable
Test for overall effect: Z = 3.62 (P = 0.00029)
Test for subgroup differences: Not applicable
-100 -50 0 50 100
Favours mixed Favours active
157Active versus expectant management for women in the third stage of labour (Review)
Copyright © 2019 The Cochrane Collaboration. Published by John Wiley & Sons, Ltd.

Analysis 11.4. Comparison 11 Active versus mixed management (no routine uterotonic, early cord
clamping, controlled cord traction), Outcome 4 Maternal Hb < 9 g/dL at 24-72 hr.
Review: Active versus expectant management for women in the third stage of labour
Comparison: 11 Active versus mixed management (no routine uterotonic, early cord clamping, controlled cord traction)
Outcome: 4 Maternal Hb < 9 g/dL at 24-72 hr
Study or subgroup Active management Mixed management Risk Ratio Weight Risk Ratio
n/N n/N
M-H,Random,95%
CI
M-H,Random,95%
CI
1 Higher-income setting
Subtotal (95% CI) 0 0 Not estimable
Total events: 0 (Active management), 0 (Mixed management)
Heterogeneity: not applicable
Test for overall effect: not applicable
2 Lower-income setting
Jerbi 2007 8/65 10/65 100.0 % 0.80 [ 0.34, 1.90 ]
Subtotal (95% CI) 65 65 100.0 % 0.80 [ 0.34, 1.90 ]
Total events: 8 (Active management), 10 (Mixed management)
Heterogeneity: not applicable
Test for overall effect: Z = 0.51 (P = 0.61)
Total (95% CI) 65 65 100.0 % 0.80 [ 0.34, 1.90 ]
Total events: 8 (Active management), 10 (Mixed management)
Heterogeneity: not applicable
Test for overall effect: Z = 0.51 (P = 0.61)
Test for subgroup differences: Not applicable
0.01 0.1 1 10 100
Favours active Favours mixed
158Active versus expectant management for women in the third stage of labour (Review)
Copyright © 2019 The Cochrane Collaboration. Published by John Wiley & Sons, Ltd.

Analysis 11.19. Comparison 11 Active versus mixed management (no routine uterotonic, early cord
clamping, controlled cord traction), Outcome 19 Mean length of third stage.
Review: Active versus expectant management for women in the third stage of labour
Comparison: 11 Active versus mixed management (no routine uterotonic, early cord clamping, controlled cord traction)
Outcome: 19 Mean length of third stage
Study or subgroup Active management Mixed managementMean
Difference WeightMean
Difference
N Mean(SD)[min] N Mean(SD)[min] IV,Random,95% CI IV,Random,95% CI
1 Higher-income setting
Subtotal (95% CI) 0 0 Not estimable
Heterogeneity: not applicable
Test for overall effect: not applicable
2 Lower-income setting
Jerbi 2007 65 2.46 (4.28) 65 10.58 (5) 100.0 % -8.12 [ -9.72, -6.52 ]
Subtotal (95% CI) 65 65 100.0 % -8.12 [ -9.72, -6.52 ]
Heterogeneity: not applicable
Test for overall effect: Z = 9.95 (P < 0.00001)
Total (95% CI) 65 65 100.0 % -8.12 [ -9.72, -6.52 ]
Heterogeneity: not applicable
Test for overall effect: Z = 9.95 (P < 0.00001)
Test for subgroup differences: Not applicable
-100 -50 0 50 100
Favours active Favours mixed
159Active versus expectant management for women in the third stage of labour (Review)
Copyright © 2019 The Cochrane Collaboration. Published by John Wiley & Sons, Ltd.

Analysis 11.20. Comparison 11 Active versus mixed management (no routine uterotonic, early cord
clamping, controlled cord traction), Outcome 20 Manual removal of placenta as defined by study authors.
Review: Active versus expectant management for women in the third stage of labour
Comparison: 11 Active versus mixed management (no routine uterotonic, early cord clamping, controlled cord traction)
Outcome: 20 Manual removal of placenta as defined by study authors
Study or subgroup Active management Mixed management Risk Ratio Weight Risk Ratio
n/N n/N
M-H,Random,95%
CI
M-H,Random,95%
CI
1 Higher-income setting
Subtotal (95% CI) 0 0 Not estimable
Total events: 0 (Active management), 0 (Mixed management)
Heterogeneity: not applicable
Test for overall effect: not applicable
2 Lower-income setting
Jerbi 2007 1/65 1/65 100.0 % 1.00 [ 0.06, 15.65 ]
Subtotal (95% CI) 65 65 100.0 % 1.00 [ 0.06, 15.65 ]
Total events: 1 (Active management), 1 (Mixed management)
Heterogeneity: not applicable
Test for overall effect: Z = 0.0 (P = 1.0)
Total (95% CI) 65 65 100.0 % 1.00 [ 0.06, 15.65 ]
Total events: 1 (Active management), 1 (Mixed management)
Heterogeneity: not applicable
Test for overall effect: Z = 0.0 (P = 1.0)
Test for subgroup differences: Not applicable
0.01 0.1 1 10 100
Favours active Favours mixed
A D D I T I O N A L T A B L E S
Table 1. Terms and definitions used in this review
Terms Definitions used in this review
Expectant management of third stage of labour • A prophylactic uterotonic agent is not administered• Umbilical cord is neither clamped nor cut until the
placenta has been delivered or until cord pulsation has ceased• Placenta is delivered spontaneously with the aid of gravity
and sometimes by maternal effort
Active management of third stage of labour • The routine administration of a prophylactic uterotonicdrug just before, with, or immediately after, the birth of the baby
• Early cord clamping and cutting
160Active versus expectant management for women in the third stage of labour (Review)
Copyright © 2019 The Cochrane Collaboration. Published by John Wiley & Sons, Ltd.

Table 1. Terms and definitions used in this review (Continued)
• Controlled cord traction to deliver the placenta
Mixed management of third stage of labour A mixture of some of the components of both active and expec-tant management of third stage of labour, but without exclusivelycontaining all the components of either. There can be a numberof different mixed third stage managements, for example:
• early prophylactic uterotonic drug, cord clamping whenpulsation has ceased and controlled cord traction
• delayed prophylactic uterotonic drug, cord clamping whenpulsation has ceased and controlled cord traction
Early prophylactic uterotonic Prophylactic uterotonic drug administered just before, with, orimmediately after, the birth of the infant
Delayed prophylactic uterotonic Prophylactic uterotonic drug administered after the cord pulsationhas ceased
Early cord clamping The application of a clamp to the umbilical cord within 60 secondsof the birth of the infant (McDonald 2013)
Delayed cord clamping The application of a clamp to the umbilical cord more than 1minute after birth or when cord pulsation has ceased (McDonald2013)
Sarnat staging for hypoxic ischaemic encephalopathy (Sarnat1976)
• Stage 1 (mild): hyper-alertness, hyper-reflexia, dilatedpupils, tachycardia, absence of seizures
• Stage 2 (moderate): lethargy, hyper-reflexia, miosis,bradycardia, seizures, hypotonia with weak suck and Mororeflexes
• Stage 3 (severe): stupor, flaccidity, small to mid-positionpupils which react poorly to light, decreased stretch reflexes,hypothermia and absent Moro
Table 2. Varying managements used in studies in the main analysis compared with the study’s planned regime of management
Study Active management
protocol
Expectant management
protocol
Active management
used
Expectant management
used
Begley 1990 • IV ergometrine 0.5mg immediatelyfollowing birth
• Try to clamp cordwithin 30 seconds
• When uteruscontracted, attemptCCT
• Try not to give anyspecial instructions re
• No oxytocic drugroutinely
• Try to leave cordattached to baby untilpulsation has ceased
• Placenta may bedelivered by maternaleffort or gentlecontrolled cord tractiononce separated
• All given IVergometrine beforedelivery of placenta
• 89% cord clampedand cut
• 93% CCT and 5%maternal effort
• 7% upright and93% recumbent
• 14% were givenergometrine fortreatment, notprophylactically, 6 (0.83%) before placentadelivered
• Cord leftunclamped till pulsationceased 42%
161Active versus expectant management for women in the third stage of labour (Review)
Copyright © 2019 The Cochrane Collaboration. Published by John Wiley & Sons, Ltd.

Table 2. Varying managements used in studies in the main analysis compared with the study’s planned regime of management
(Continued)
posture • Encourage motherto breastfeed. Help herto kneel/sit/squa
• Placenta deliveredby maternal effort 32%and gentle CCT 66%
• 11% upright
Prendiville 1988 • IM syntometrine (5units oxytocin + 0.5 mgergometrine) (IM 10units oxytocin if raisedBP) Immediately afterbirth of anterior shoulder
• Clamp cord 30seconds after birth
• CCT when uteruscontracted
• Try not to giveoxytocic
• Try to leave cordattached to baby untilplacenta delivered
• Try not to use CCTor any manualinterference with uterusat the fundus
• Encourage motherto adopt posture aidingdelivery with gravity
• If placenta notdelivered spontaneouslywait, try putting baby tobreast, and encouragematernal effort as above
• Full activemanagement (99%)
• 99% cord clampedand cut before deliveryof placenta
• 99% CCT• 217 (26%) upright
• Full expectantmanagement 403 (48%)
• Full activemanagement 168 (20%)
• 278 (32%) hadmixed management
• Cord leftunclamped till pulsationceased 48%
• Placenta deliveredby maternal effort 60%and CCT 40%
• 416 (49%) upright• 30% received
uterotonic for treatment
Rogers 1998 • IM syntometrine (5units oxytocin + 0.5 mgergometrine)¬(IM 10units oxytocin if raisedblood pressure)
• As soon as possibleafter birth of anteriorshoulder (within 2minutes of birth)
• Immediate cordclamping and cutting
• CCT or maternaleffort
• Womenrandomised to uprightand recumbent in botharms
• No uterotonic drug• No cord clamping
until after pulsationceased
• Delivery of placentawithin 1 hour bymaternal effort
• 699 (93.4%) hadfull active management
• 2 (0.3%) had fullyexpectant management
• 47 (6.2%) hadmixed
• 95% givenprophylactic uterotonicbefore delivery ofplacenta
• 93% cord clampedbefore pulsation ceased
• 46% CCT• 44% upright (when
placenta delivered)
• 488 (63.9%) hadfull expectantmanagement
• 19 (2.5%) had fullyactive management
• 257 (33.6%) hadmixed
• 21% receivedoxytocic for treatment, 2.5% prophylactically
• Cord leftunclamped till pulsationceased 70%
• Placenta deliveredby CCT 12%
• 43% upright (whenplacenta delivered)
Thilaganathan 1993 • IM oxytocin 10units at delivery ofanterior shoulder
• Immediate cordclamping and cutting
• CCT as soon as theuterus was contractedfirmly - repeated every 2-
• No oxytocic priorto delivery of placenta
• Cord clamped andcut after delivery
• No CCT• No fundal massage• Maternal expulsion
after signs of separation
No information No information
162Active versus expectant management for women in the third stage of labour (Review)
Copyright © 2019 The Cochrane Collaboration. Published by John Wiley & Sons, Ltd.

Table 2. Varying managements used in studies in the main analysis compared with the study’s planned regime of management
(Continued)
3 minutes • IV infusion ofoxytocin 10 units in 500mL normal saline givenslowly
BP: blood pressure; CCT: controlled cord traction; IM: intramuscular; IV: intravenous
A P P E N D I C E S
Appendix 1. Search methods - ICTRP and ClinicalTrials.gov
ICTRP
postpartum h(a)emorrhagethird AND stage AND labo(u)r AND bleedingactive AND expectant AND thirdactive AND expectant AND labo(u)rClinicalTrials.gov
Advanced search
Interventional studies | postpartum hemorrhageInterventional studies | third stage | laborInterventional studies | bleeding | labor
F E E D B A C K
Mc’Alpine, 31 August 2002
Summary
I have some questions. In the four included studies, how many women were in each study and when were the studies done? Was acomparison made between maternity hospitals, birth centres, and home delivery? For postpartum haemorrhage of more than 500 mls,what does “relative risk 0.38, 95% confidence interval 0.32 to 0.46” mean in terms of numbers?Why do you conclude that active management should be the ’routine’ management of choice in a maternity hospital? What are theimplications for other settings?[Summary of comments from Elizabeth McAlpine, August 2002]
Reply
Reply from Cecily Begley in December 2009: The number of women in each study can be found in the analyses graphs in this updatedreview, and the overall numbers of studies and women included for each outcome are also reported in the text. Dates for the studiesare included in the references. All the studies were in hospital settings and we found no studies of midwifery-led birth centres or home
163Active versus expectant management for women in the third stage of labour (Review)
Copyright © 2019 The Cochrane Collaboration. Published by John Wiley & Sons, Ltd.

births. We have included this information on study settings in the ‘Characteristics of Included studies’ and at appropriate places in thetext of the review. Our estimate of the relative risk of blood loss greater than 500 mL is slightly different from the previous versionof the review because we have used a random-effects analysis. We also report the ‘Numbers needed to treat’ under ‘Summary of mainresults’ for the outcomes of severe primary PPH and postnatal Hb < 9 g/dL; we hope this addresses the meaning of the relative riskand confidence intervals for these outcomes. Our conclusions differ from the previous review as we have included additional outcomeswhich show a balance of benefits and harms and we have used new systematic review methodology. Our findings refer to hospitalsettings because this is where the included studies were undertaken. We cannot provide evidence-based information for other settings.
Contributors
Cecily Begley
Matthews, December 2004
Summary
My anecdotal observation, having changed my practice to include physiological management of the third stage, is that women whochoose this option have a decrease in the amount of lochia postpartum and a shorter duration of vaginal discharge. I have not seen anystudies that could confirm or refute this.[Comment received from Mary Jo Matthews, December 2004]
Reply
We have included in the update of the review the outcome ‘Amount of lochia > 24 hours and up to discharge from hospital [mL]’;however, none of the included studies assessed this outcome, so we have, therefore, no evidence to confirm or refute this observation.
Contributors
Cecily Begley
Van Wyk, 4 March 2009
Summary
This review was last updated in 2000, and comments sent in 2002 and 2004 have not been addressed. The authors stated in 2007 thatan update is in progress. We are concerned about the validity of the review findings.[Summary of feedback from Susan van Wyk on behalf of the Masters Clinical Epidemiology class, Stellenbosch University, February2009]
Reply
A new team took over this review in December 2008. We have now updated this review and addressed these comments from 2002 and2004. Our conclusions differ from the previous review as we have included additional outcomes which show a balance of benefits andharms and we have used new systematic review methodology. The delay has arisen from our needing to produce a new protocol for thereview prior to undertaking the update.
Contributors
Reply from Cecily Begley, December 2009
164Active versus expectant management for women in the third stage of labour (Review)
Copyright © 2019 The Cochrane Collaboration. Published by John Wiley & Sons, Ltd.

W H A T ’ S N E W
Date Event Description
22 January 2018 New search has been performed Search updated and five new trial reports identified.Three were clinical trials registry reports of studies al-ready assessed. We excluded one new trial in comparison5. We are still unable to source the full-text of Rosario1973. One new study has been included in this update(Yildirim 2016).All details were updated in line with the new Cochranerequirements. We changed one section of risk of biasfor two papers and updated the ’Summary of findings’table footnotes with this information, and included thesetting. Dr Linda Biesty joined the team. We had erro-neously referred to the comparison, ’women at low riskof excessive bleeding’ as a “subgroup” in the text, so wealtered this
22 January 2018 New citation required but conclusions have not changed Main conclusions have not changed. Language to reflectthe GRADE assessments of the quality of the evidencewas added, as was a sentence on the conclusions in rela-tion to the comparison of women at low risk of excessivebleeding
H I S T O R Y
Protocol first published: Issue 4, 2008
Review first published: Issue 7, 2010
Date Event Description
20 October 2014 New search has been performed Search updated. We included a further publication onone of the already included studies and now includedata on after-pains for this comparison (Jangsten 2011). We updated the risk of bias for all included studiesto assess both performance bias and detection bias. Wehave included a ’Summary of findings’ table in this up-date
20 October 2014 New citation required but conclusions have notchanged
Three references identified and one included for thisupdate (a new paper from a trial already included) andtwo were excluded
17 August 2011 New citation required but conclusions have notchanged
Deirdre Murphy and Susan MacDonald stepped downas authors. Andrew Weeks joined the team
165Active versus expectant management for women in the third stage of labour (Review)
Copyright © 2019 The Cochrane Collaboration. Published by John Wiley & Sons, Ltd.

(Continued)
17 August 2011 New search has been performed Search updated in February 2011: two new studiesincluded (Jangsten 2011; Jerbi 2007); four excluded(Abdel-Aleem 2010; Hoffman 2006; Ramirez 2001;Vasegh 2005); and one added to Studies awaitingclassification.Protocol section updated - see Differences betweenprotocol and review.
10 May 2010 Feedback has been incorporated Feedback on the previous version of this review added,along with replies from the new review team
C O N T R I B U T I O N S O F A U T H O R S
Cecily Begley (CB) drafted the background section and all other authors contributed to editing the text. All review authors contributedto the drafting of the inclusion criteria for the review. Gill Gyte (GG) and Declan Devane (DD) added the methodology section withother authors commenting. CB and GG abstracted and pooled data. William McGuire checked data entry, DD prepared the ’Summaryof findings’ table, which was checked by Andrew Weeks. GG, DD and CB wrote the results section with other authors commenting.CB and GG wrote the discussion and implications sections, with input from all authors. For this update, GG and LB updated the RoBsections, DD and LB updated the methods, AW and CB updated the data entry and analysis, CB and WM updated the SoF table.Cecily Begley is the guarantor of the review.
D E C L A R A T I O N S O F I N T E R E S T
Cecily Begley: was the lead researcher on the ’Dublin trial’ (Begley 1990). Gill Gyte, Declan Devane, and a member of the CochranePregnancy and Childbirth Group’s staff independently reviewed Begley’s paper and agreed inclusion in the review. GG and DD extracteddata.
Gill Gyte: I have written extensively on third-stage management and was a co-applicant on a five year study of care at preterm birthwhich included a pilot randomised controlled trial of delayed cord clamping with immediate neonatal care with cord intact versusearly cord clamping (funded by the National Institute for Health Research (NIHR) under its Programme Grants for Applied Researchfunding scheme [RPPG-0609-10107]). I am currently a Public and Patient Involvement representative on the Trial Management Groupon a Health Technology Assessment funded clinical trial of carboprost versus oxytocin as first line treatment of primary postpartumhaemorrhage, led by Professor Andrew Weeks based at University of Liverpool, UK. I also received royalties from John Wiley & Sonsin respect of ‘A Cochrane Pocketbook - Pregnancy and Childbirth’ Hofmeyr GJ et al. 2008.
Declan Devane: was a member of the Data Monitoring Board for the Cord pilot trial - immediate versus deferred cord clamping forvery preterm birth (before 32 weeks’ gestation). (The study is not included in this review.)
William McGuire: none known
Andrew Weeks: has been on a programme grant related to the timing of cord clamping, as well as investigating the use of misoprostolfor postpartum haemorrhage prophylaxis in rural Uganda (Weeks AD, Ditai J, Ononge S, Faragher B, Frye LJ, Durocher J, MirembeFM, Byamugisha J, Winikoff B, Alfirevic Z. The MamaMiso study of self-administered misoprostol to prevent bleeding after childbirthin rural Uganda: a community-based, placebo-controlled randomised trial. BMC Pregnancy Childbirth. 2015 Sep 14;15:219). He isalso one of nine designers of a small resuscitation trolley (the BASICS trolley; Weeks AD, Watt P, Yoxall CW, Gallagher A, Burleigh A,Bewley S, Heuchan AM, Duley L. Innovation in immediate neonatal care: development of the Bedside Assessment, Stabilisation andInitial Cardiorespiratory Support (BASICS) trolley. BMJ Innov. 2015 Apr;1(2):53-58) that allows neonatal resuscitation with an intactcord and the inventor of the PPH Butterfly, a device to allow minimally invasive uterine compression to treat postpartum haemorrhage
166Active versus expectant management for women in the third stage of labour (Review)
Copyright © 2019 The Cochrane Collaboration. Published by John Wiley & Sons, Ltd.

(Cunningham C, Watt P, Aflaifel N, Collins S, Lambert D, Porter J, Lavender T, Fisher T, Weeks A. PPH Butterfly: a novel device totreat postpartum haemorrhage through uterine compression. BMJ Innov. 2017 Feb;3(1):45-54.).
Linda M Biesty: none known.
S O U R C E S O F S U P P O R T
Internal sources
• (GG) The University of Liverpool, UK.
External sources
• (GG) National Institute for Health Research, UK.2009 Version of this review was supported by the NIHR NHS Cochrane Collaboration Programme Grant Scheme award for NHS-prioritised centrally-managed, pregnancy and childbirth systematic reviews: CPGS02
• Human Reproduction Programme. World Health Organization. Geneva, Switzerland.
D I F F E R E N C E S B E T W E E N P R O T O C O L A N D R E V I E W
We did not carry out additional searching as proposed. We decided after looking at the variation in the interventions and controlsused in the studies that we had clinical heterogeneity between the studies (Table 1) and so we have used a random-effects meta-analysisthroughout the review.
We have changed the labels on the secondary outcomes of ’Primary postpartum haemorrhage (> 500 mL)’ and ’Secondary postpartumhaemorrhage (> 500 mL)’ to ’Primary maternal blood loss > 500 mL’ and ’Secondary maternal blood loss > 500 mL’ respectively. This isbecause we believe that in research the term ’haemorrhage’ should be reserved for excessive blood loss. We have also included referenceto the mean Hb values in order to provide an outcome that was calculated by blinded personnel.
We have modified the wording in the methods sections for ’Assessment of heterogeneity’, ’Assessment of reporting biases’ and ’Datasynthesis’ to update them with the new methods being used by the group, developed in conjunction with the group’s statisticians,Simon Gates and Richard Riley. We have used these new methods in the review.
We decided to reduce the number of outcomes, in line with the Cochrane Handbook of Systematic Reviews of Interventions’ recommen-dations. We made the following changes to outcomes.
Nine primary outcomes reduced to seven
Clinical signs of severe blood loss at the time of birth, e.g. woman feeling breathless, weak, faint, pale, exhausted: moved to secondaryoutcomes list.Evidence of acidaemia indicated by a pH less than seven or base deficit greater than 12 mmol/L in umbilical arterial cord blood, or (c)neonatal blood sample in first hour of life, or both: removed.Apgar score less than 7 at five minutes, and neonatal (’hypoxic ischaemic’) encephalopathy assessed using Sarnat staging: moved tosecondary outcomes list.
167Active versus expectant management for women in the third stage of labour (Review)
Copyright © 2019 The Cochrane Collaboration. Published by John Wiley & Sons, Ltd.

Changes to primary outcomes
All PPH amounts and mean blood losses are now expressed at three time periods “at the time of the birth”, “after delivery of placentaand up to 24 hours”, and “at the time of birth and up to 24 hours”. This was done because it was noted that the two primary outcomes“Severe primary PPH (clinically estimated or measured blood loss greater than or equal to 1000 mL at time of birth and up to 24hours)” and “Very severe primary PPH (clinically estimated or measured blood loss greater than or equal to 2500 mL at time of birthand up to 24 hours)”, which were based on the international definition of postpartum haemorrhage (PPH) could, in fact, providemisleading results if study authors measured or estimated blood loss at birth, and over a period of some hours in the first 24 hours, andadded all amounts together to provide an overall PPH rate. While this estimate could also be useful, it raises the PPH rate artificiallyin comparison with studies that do not do this. Accordingly, we have changed the first two primary outcomes to “Severe primarypostpartum haemorrhage (clinically estimated or measured blood loss greater than or equal to 1000 mL at time of birth)” and “Verysevere primary PPH (clinically estimated or measured blood loss greater than or equal to 2500 mL at time of birth)” and have includedthe original definitions as secondary outcomes.“Maternal Hb concentration less than 9 g/dL 24 to 48 hours postpartum” changed to “Maternal Hb concentration less than 9 g/dL24 to 72 hours postpartum” - as Hb levels may be taken within the first three days postnatal, rather than the first two.
Secondary outcomes deleted (to reduce number of outcomes)
1. Iron therapy during the puerperium.2. Length of the third stage greater than or equal to 60 minutes.3. Nausea between birth of baby and discharge from the labour ward.4. Headache between birth of baby and discharge from the labour ward.5. Maternal views of third-stage management (assessed using a validated questionnaire).6. Maternal Hb concentration less than 9 g/dL postdischarge and up to six weeks.7. Sequelae of PPH (length of stay; infection; re-admission).8. Infant Hb level and iron indices beyond three months.
Changes to secondary outcomes
“Administration of oral or rectal analgesia (e.g. paracetamol, codeine, non-steroidals) between birth of the baby and discharge fromthe labour ward” and “Administration of opiate analgesia between birth of the baby and discharge from the labour ward” combined as“Administration of any analgesia between birth of the baby and discharge from the labour ward”.“Secondary blood loss equal to or greater than 500 mL (clinically estimated or measured after 24 hours and before six weeks)” and“Any vaginal bleeding needing treatment (after 24 hours and before six weeks)” and “Uterotonic treatment after 24 hours and beforesix weeks” combined as “Secondary blood loss/any vaginal bleeding needing treatment (after 24 hours and before six weeks)”.“Infant Hb level (Hb) at 24 to 48 hours” changed to “at 24 to 72 hours”, as Hb levels may be taken within the first three days postnatal,rather than the first two.“Intraventricular haemorrhage (preterm infants): (i) grade III/IV; (ii) all grades (Sarnat 1976)” changed to “Papille grade III/IVintraventricular haemorrhage (for infants born before 34 weeks’ gestation only)”.“Transfusion requirements (preterm infants): (i) number of infants exposed to one or more red blood cell transfusions; (ii) number oftransfusions per infant; (iii) number of donors to whom the infant was exposed” changed to “Number of infants who received a redblood cell transfusion”.“Breastfeeding at discharge from hospital and at interval assessments until six months” changed to “Exclusive breastfeeding at dischargefrom hospital”.
New secondary outcomes included
“Neonatal mortality” included
Search methods
For the 2018 update we added in an additional search of ClinicalTrials.gov and the WHO International Clinical Trials Registry Platform( ICTRP).
168Active versus expectant management for women in the third stage of labour (Review)
Copyright © 2019 The Cochrane Collaboration. Published by John Wiley & Sons, Ltd.

Types of interventions
We included the following three comparisons as we added studies that had used them to this review update (2018).Comparison 9: active versus mixed management of the third stage of labour with uterotonic after placental delivery, immediate cordclamping and no controlled cord tractionComparison 10: active versus mixed management of the third stage of labour with no routine uterotonic, early cord clamping, nocontrolled cord traction.Comparison 11: active versus mixed management of the third stage of labour with no routine uterotonic, early cord clamping, controlledcord traction.We deleted the fifth subgroup analysis ‘low risk of PPH versus high risk of PPH’ as we realised that the analysis of studies undertakenwith women in the low risk group was in fact a separate comparison.We changed the original subgroups of ’high-income country’ and ’low-income country’ to ’higher-income setting’ and ’lower-incomesetting’, based on the World Bank definitions, with the border between the lower-middle-income and upper-middle-income being thecut-off point ( World Bank definitions 2018).
I N D E X T E R M S
Medical Subject Headings (MeSH)
∗Watchful Waiting; Birth Weight; Constriction; Delivery, Obstetric [adverse effects; ∗methods]; Labor Stage, Third [∗physiology];Oxytocics [∗administration & dosage; adverse effects]; Placenta; Postpartum Hemorrhage [∗prevention & control]; RandomizedControlled Trials as Topic
MeSH check words
Female; Humans; Pregnancy
169Active versus expectant management for women in the third stage of labour (Review)
Copyright © 2019 The Cochrane Collaboration. Published by John Wiley & Sons, Ltd.